

ABSTRACT
Human cytomegalovirus (HCMV) antigens in glioblastoma (GBM) present opportunities for personalised immunotherapy. However, their presence in GBM tissue is still under debate, and evidence of their impact on functional immune responses and prognosis is sparse. Here, we investigated the presence of pp65 (UL83) and immediate early 1 (IE-1) HCMV antigens in a cohort of Norwegian GBM patients (n = 177), using qPCR, immunohistochemistry, and serology. HCMV status was then used to investigate whether viral antigens influenced immune cell phenotype, infiltration, activation and patient survival. Pp65 and IE-1 were detected by qPCR in 23% and 43% of GBM patients, respectively. Furthermore, there was increased seropositivity in GBM patients relative to donors (79% vs. 48%, respectively; Logistic regression, OR = 4.05, 95%CI [1.807-9.114], P = 0.001, also when adjusted for age (OR = 2.84, 95%CI [1.110-7.275], P = 0.029). Tissue IE-1-positivity correlated with increased CD3+CD8+ T-cell infiltration (P < 0.0001), where CD8+ effector memory T (TEM) cells accounted for the majority of CD8+T cells compared with peripheral blood of HCMV+ patients (P < 0.0001), and HCMV+ (P < 0.001) and HCMV− (P < 0.001) donors. HLA-A2/B8-restricted HCMV-specific CD8+ T cells were more frequent in blood and tumor of HCMV+ GBM patients compared with seronegative patients, and donors irrespective of their serostatus. In biopsies, the HCMV-specific CD8+ TEM cells highly expressed CTLA-4 and PD-1 immune checkpoint protein markers compared with populations in peripheral blood (P < 0.001 and P < 0.0001), which expressed 3-fold greater levels of CD28 (P < 0.001 and P < 0.0001). These peripheral blood T cells correspondingly secreted higher levels of IFNγ in response to pp65 and IE-1 peptide stimulation (P < 0.001). Thus, despite apparent increased immunogenicity of HCMV compared with tumor antigens, the T cells were tolerised, and HCMV status did not impact patient survival (Log Rank3.53 HR = 0.85 95%CI [0.564-1.290], P = 0.45). Enhancing immune functionality in the tumor microenvironment thus may improve patient outcome.
KEYWORDS: HCMV, Glioblastoma, HLA-restricted T-cells, memory T-cells, Survival
Introduction
Glioblastoma (GBM) is the most frequent and malignant brain tumor in adults.1 Despite aggressive multimodal treatment consisting of surgery and concurrent temozolomide chemotherapy with fractionated radiotherapy, median and 5-year survival of patients remains dismally at 14.6 months and 9.8%, respectively.2
One of the more promising approaches today is to identify factors that drive immunogenicity of GBM. Such factors/antigens may provide salient targets for novel and effective treatments, particularly approaches for immunotherapy. The presence of human cytomegalovirus (HCMV) in the GBM microenvironment has generated considerable interest as viral antigens provide unique targets for the development of immune targeted therapies. HCMV is a member of the Herpesviridae family of double stranded DNA viruses where primary infection usually occurs during childhood in an asymptomatic manner, but thereafter the virus remains latent in endothelial cells and mononuclear cells.3,4 HCMV also exhibits tropism for glial cells, thus, subsequent detection in GBM tissues offers unique potential for therapeutic targeting.
HCMV products have however, been variably demonstrated in GBM.5-8 Some have disputed the existence of HCMV antigens in the tumor at altogether.3,9,10 Several factors ostensibly contribute to this discrepancy, including age, gender and socioeconomic status of the patients in these studies. The diverse methods, targeted HCMV products and sample sizes analyzed may also account for the variation, especially in the older publications. It has also been suggested that HCMV detection may vary with time due to sample storage.11
HCMV has a 235-kb genome that encodes approximately 200 proteins subdivided into 3 distinct regions: the repeat long and short regions (RL and RS) and the unique long (UL) and unique short (US) regions,12 many of which are not necessary for viral replication.13 However, these proteins have been shown to influence a broad spectrum of biologic functions, including host cell telomerase activity, cellular differentiation, apoptosis and even migration of tumor cells through RTK/Ras/Phosphatidylinositol 3-kinase (PI3K)/AKT and GSK3-β signaling. HCMV gene products interact with TP53, retinoblastoma (Rb) and interfere with mismatch DNA repair to promote gliomagenesis.14-18 Furthermore, US28, a homolog of the human G-protein-coupled CCR1 chemokine receptor, was demonstrated to localize near GBM vasculature,19 and induce IL-6 and COX-2 expression. This cascade of signalling events results in the phosphorylation of signal transducer and activator of transcription 3 (STAT3) and downstream production of pro-angiogenic vascular endothelial growth factor (VEGF), which all directly promote GBM progression.19-22
Indeed, GBM patients with low grade HCMV infection, indicated by attenuated expression levels of immediate early-1 (IE-1) antigen, were reported to have improved survival outcomes compared with those with high-grade infection.23 The authors reported that the impact of HCMV on patient survival was independent of age; yet several studies have shown that high levels of HCMV-specific IgG are associated with aging and likelihood of reactivation24-26 and mortality.27 This discrepancy may be due to poor correlation between HCMV seropositivity and presence of viral gene products in tumor tissue.28,29 Nevertheless, the study did not correct for O6 methylguanine DNA methyltransferase (MGMT) a strong prognostic and predictive factor for response to temozolomide chemotherapy30 which could have confounded their findings. In a separate study, the authors treated HCMV positive GBM patients with valganciclovir as add-on to standard therapy and reported a 2-year survival extension up to 62%.23 Further studies are required to confirm therapeutic efficacy of this drug.31 Thus, the impact of HCMV on patient survival has not been unequivocally determined.
HCMV promotes malignant progression by inducing tumor-supportive monocytes,6,20 and facilitating escape from immune surveillance. Proteins and nucleic acids from US2, US3, US6, USI0 and US11 were demonstrated to inhibit class I human leukocyte antigen (HLA) expression, thus interfering with antigen presentation to cytotoxic CD8+ T lymphocytes. Since virus-infected cells are the natural targets of CD8+ and CD4+ T lymphocytes that recognize and eliminate viral peptides presented on class I and II HLA, respectively, we hypothesized that differential frequency of HCMV gene products in GBM biopsies may impact T cell infiltration, function and survival outcomes. Thus, we aimed to demonstrate the presence of pp65 and IE-1 HCMV products in blood and within the tumor microenvironment in a large cohort of Norwegian GBM patients (n = 177) and healthy blood donors (n = 91), using several molecular methods (including qPCR, IHC and serology) in blood and within the tumor microenvironment. We investigated the influence of HCMV viral antigens on frequency of T-cell effector and memory phenotypes in blood and tumor, on T cell tumor infiltration, and function and whether such changes could affect patient survival outcomes. The results indicated that although systemic and localized immune milieus are differentially affected by the presence of HCMV in patients, they remain functionally tolerant to tumor cells. Thus, treatment regimens that exploit both HCMV and tumor-antigen specificity may be more effective but only in combination strategies that simultaneously overcome tolerance in tumors.
Results
Detection of HCMV pp65 and IE-1 by qPCR and IHC in GBM patient blood and matched tissue
The inconsistencies in reported HCMV prevalence in GBM patients might be ascribed to differences in the detection sensitivity between the various methods applied across studies. We therefore used both DNA and protein based assays to detect HCMV in patient biopsies and matching blood samples. PCR was used first to detect the late antigen (UL83) pp65 and immediate early-1 (IE-1) DNAs in patient samples. The late antigen (UL83) pp65 DNA was detected in 16.4% (26/159) of tumors but only in 10.1% (12/119) of the corresponding blood samples (Fig. 1A, 1C and 1D). Immediate early -1 (IE-1) DNA was detected in 37.8% (65/172) of tumors (Fig. 1D), and in 13.8% (18/130) of patient blood samples.
Figure 1.
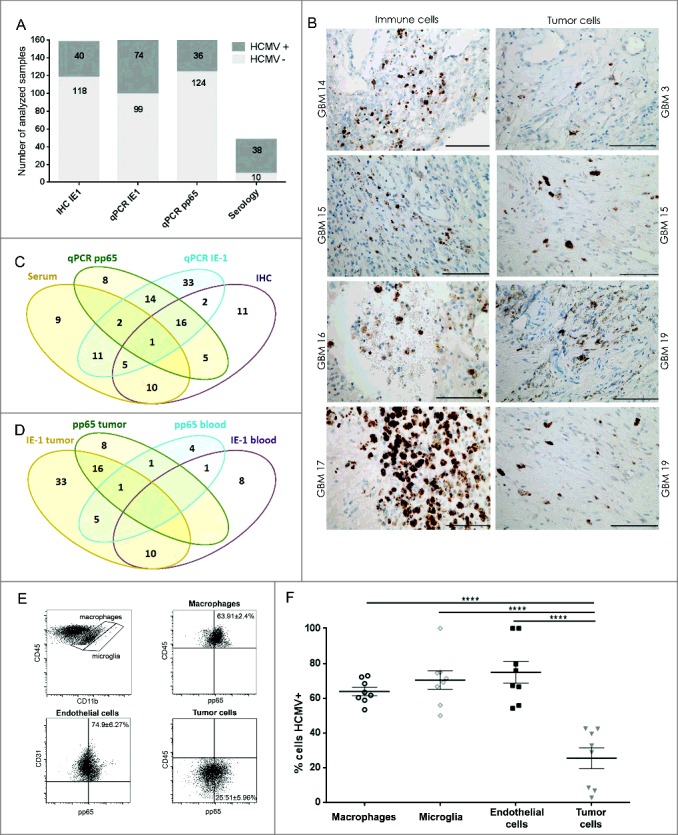
HCMV positivity in GBM determined comparatively by serology, qPCR and IHC. GBM patients were investigated for presence of HCMV pp65 and IE-1 expression by (A) qPCR, IHC and serology (dark gray bars = positive samples and light gray bar = negative samples) and (B) IE-1 expression on macrophage/myeloid derived cells (left panel) and on tumor cells (right panel). Magnification 400X, Scale bar 100 μm. (C) Venn diagram showing comparative HCMV serology (IgG), qPCR (pp65), qPCR (IE-1) and IHC (IE-1) detection in GBM tissue and blood. (D) Venn diagram showing comparative HCMV pp65 and IE-1 qPCR in GBM patients' blood and tumor. (E) Representative dotplots showing (left to right) macrophages (CD45brightCD11bbright) and microglia (CD45dimCD11bbright) within tumor biopsies cells; pp65 vs. CD45 within macrophages of tumor biopsies; pp65 vs. CD31 within CD45− tumor biopsy cells; and pp65 vs. CD45 within CD45− tumor biopsy cells. (F) % mean ± SEM of pp65+ cells within CD45brightCD11bbright macrophages, CD45dimCD11bbright microglia, CD45-CD31+ endothelial cells and CD45- tumor cells. (2-way ANOVA, Bonferroni's multiple comparison, ****P < 0.0001). IHC = immunonohistochemistry; IE-1 = immediate early -1.
In IHC, we found that IE-1 protein was expressed in 25.3% (40/158) of the tumors. IE-1 expression was furthermore associated with putative tumor and macrophage cells in the vicinity of or within blood vessels (Fig. 1A, 1B and 1C). Flow cytometry performed on cell suspensions from dissociated tissue samples confirmed that pp65 was indeed expressed on various cell types within tumor samples, including CD45brightCD11bbright macrophages, CD45dimCD11bbright microglia, CD45−CD31+ endothelial cells and CD45− tumor cells (Fig. 1E and 1F).
Finally, analysis of all patient blood samples revealed that 79.2% (38/48) of GBM patients were HCMV IgG seropositive (Fig. 1A) compared with 48.4% (44/91) of healthy Norwegian donors (OR 4.05, 95% CI (1.807-9.114), P = 0.001). The 13-year higher patient age only partially accounted for the variance (OR 2.84 95% CI [1.110-7.275], P = 0.029), indicating that there was an inherent HCMV seropositivity risk associated with GBM.
Inter-method correlation of HCVM detection in GBM
To determine whether the variance in reported HCMV prevalence in GBM might be due to discrepancies between the methods used, we examined whether associations existed between the methods applied here. We specifically wanted to determine whether detection of IE-1 and pp65 DNA by qPCR were correlated in blood and tumor samples, with each other, with IE-1 protein detected by IHC, or with HCMV IgG antibodies detected in plasma by serology. In the first analysis, we found no correlation between blood and tumor samples in patients for either IE-1 or pp65 DNA results as determined by qPCR (ChiSq2.11, P > 0.05, likewise, pp65 ChiSq 0.0004, P > 0.05; Fig. 1D). Second, qPCR detected IE-1 was positively correlated with qPCR detected pp65 DNA in blood and tumor samples of patients (ChiSq 6.1, P = 0.01; Fig. 1C and 1D). However, neither qPCR detected IE-1 nor pp65 correlated with IE-1 protein as determined by IHC (P > 0.05). Third, a trend toward a significant association of qPCR detected IE-1 with IgG serology was uncovered (ChiSq 3.8, P = 0.052; Fig 1C), whereas qPCR detected pp65 was not correlated with IgG serology. Finally, IE-1 protein detected by IHC was not correlated with serology, IE-1 or pp65 DNA (P > 0.05). Together, these analyses demonstrated that only qPCR detected IE-1 DNA was significantly correlated with levels of pp65 DNA and indicated that qPCR for IE-1, pp65 DNA and serology are reliable methods for detecting HCMV positivity in GBM patients (Fig. 1C). Moreover, there was a greater likelihood of detecting IE-1 DNA in samples more recently stored in liquid nitrogen in our tumor bank during the consecutive years from 2009 to 2017 (Logistic regression, OD1.19, CI [1.05-1.35], P = 0.008). This effect of time was also significant when considering 2010 as the median cutoff year (Logistic regression, OD3.07, CI [1.60-5.90], P = 0.001). However, age of samples did not affect detection of pp65 DNA in qPCR assays (Logistic regression, OD0.87, CI [0.74-1.02], P = 0.087), even after considering the cutoff (Logistic regression, OD1.55, CI [0.70-3.43], P = 0.283).
Decreased CD3+CD4+ T cells and increased NK cells in GBM patient blood
Immune cell profiling in tumor and systemic circulation provides insight into the potential functionality of the immune response in GBM patients compared with healthy donors, and ultimately whether differences might exist between HCMV+ and HCMV− patient populations. The distribution and immune cell phenotypes was thus first examined without regard to HCMV status in peripheral blood and tumor samples from GBM patients and compared with that of peripheral blood in normal healthy donors using flow cytometry. Firstly, GBM patients exhibited attenuated numbers of CD3+ T cells in blood and tumor compared with healthy donors (2-way ANOVA, GBM-blood 43.4 ± 2.7%; tumor 44.0 ± 5.4% vs. 67.1 ± 1.5%, P < 0.0001, Fig. S1A, 1B and 1D). Furthermore, GBM patients had greater numbers of CD3−CD56+ NK cells in blood (16.3 ± 2.2%) but not in tumor (13 ± 2.6%), compared with peripheral blood of controls (7.6 ± 0.7% 2-way ANOVA, P < 0.01; Fig. S1A, 1B and 1D). There was no difference in CD3+CD56+ subsets (Fig. S1D). GBM patients had decreased numbers of T helper cell (Th) phenotype (CD4+ subset) in both peripheral blood and tumor compared with healthy controls (2-way ANOVA, blood 57.9 ± 2.3%; tumor 40 ± 3.9% vs. 67.6 ± 1.7%, P < 0.01 and P < 0.0001, respectively), but no difference in the numbers of cytotoxic T-lymphocytes (CTLs; CD8+ subset) was detected relative to healthy donors (Fig. S1C and 1E). These results demonstrated diminished T-helper but not cytotoxic T cells in GBM patients compared to healthy individuals.
IE-1 positivity is associated with increased T cell infiltration
We next investigated whether the presence of HCMV-IE-1 and -pp65 in the tumor microenvironment might correlate with differential recruitment of T lymphocytes and NK cells into the tumor. IE-1 positivity determined by both IHC and qPCR was correlated with increased CD3+ T cell infiltration (IE-1 IHC: ChiSq 16.22, P < 0.000; IE-1 qPCR ChiSq 9.4, P = 0.009; Fig. 2A and 2C). Multiple comparisons were then performed with logistic regression analyzing infiltration of CD3, CD4 and CD8 simultaneously. CD3 was positively associated with IE-1 protein (Logistic regression 13.2 OR 1.07 95% CI [1.03-1.113], P < 0.001) as was CD8 (Logistic regression 6.4 OR 1.095 95% CI [1.020-1.746, P = 0.021). In multiple comparisons, CD8 accounted for much of the variance (OR 1.069 95% CI [0.982-1.163], P = 0.11 of CD3 OR 1.056 95% CI [1.006- 1.107], P = 0.025) indicating that IE-1+ GBM tumors showed higher frequency of infiltrating CD3+CD8+ cytotoxic T cells (Fig. 2B and 2C). No difference in CD3+CD4+ T cell infiltration was detected in IE-1+ and IE-1− tumors (P > 0.05), or NKp46+ NK cells (P > 0.05; Fig. 2C). In contrast, the presence of pp65 DNA determined by qPCR did not significantly correlate with CD3+ T cell infiltration (ChiSq 1.04, P = 0.6) or NKp46+ NK cell infiltration (Chisq 2.63, P = 0.3, data not shown). In peripheral blood, HCMV+ GBM patients had significantly less CD3+CD4+T cells compared with healthy donors regardless of serological status (2-way ANOVA, P < 0.05 and P < 0.01, Fig. 2D, 2E and 2F). HCMV− GBM patients had more NK cells in peripheral blood than healthy controls regardless of HCMV status (P < 0.01, Fig. 2D). Taken together, tumor-derived suppression attenuated NK and CD4+ T cells in tumor and blood of patients regardless of HCMV status. In contrast, the presence of HCMV products correlated with increased tumor infiltration of CD8+ cytotoxic T cells.
Figure 2.
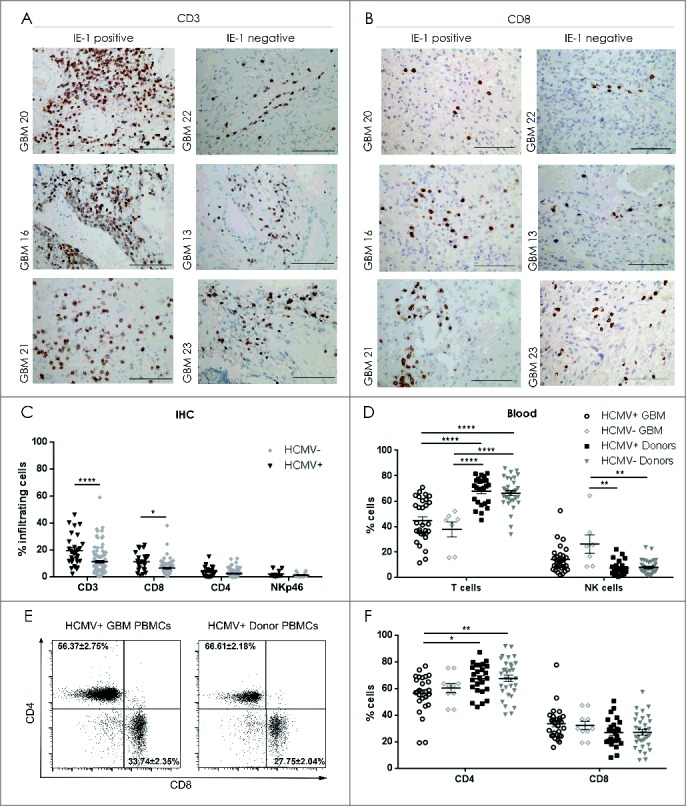
Decreased NK cells in blood and increased CD8+ T cells in tumor of HCMV+ patients. Representative IE-1+ or IE-1− tumors determined by IHC showing (A) CD3 positivity and (B) CD8+ T cell infiltration. Magnification 400X, Scale bar 100µm. (C) % mean ± SEM of T cell (CD3+), Th cells (CD4+), CTLs (CD8+) and NK cells (NKp46+) infiltrating the IE-1+ or IE-1− tumors determined by IHC, n = 138. (D) % mean ± SEM of CD3+T cells and CD3−CD56+ NK cells in peripheral blood of HCMV+ and HCMV− GBM patients and donors determined by flow cytometry. (E) Representative dotplots showing CD4+ vs. CD8+ T cell populations in seropositive patient and healthy control donor. (F) % mean ± SEM of CD4+ and CD8+ T- cells in peripheral blood of HCMV+ and HCMV− patients (n = 26) and donors (n = 56). Two Way ANOVA, Bonferroni's multiple comparison *P < 0.05, **P < 0.01, and ****P < 0.0001.
Diminished CD4+ TN cells and increased CD8+ TEM cells in peripheral blood and tumor of HCMV seropositive patients compared with normal healthy donors
To further understand the selective T cell tumor infiltration, we analyzed the phenotypes of the CD4+ and CD8+ T cells in blood and tumor of GBM patients and compared these to the blood of healthy donors. HCMV+ patients had significantly diminished CD45RO−CD62L+CCR7bright CD4+ TN cells in tumor compared with both seronegative and seropositive donors (2-way ANOVA, P < 0.0001 for both analyses) and in blood compared with seronegative and seropositive donors (2-way ANOVA, P < 0.001 and P < 0.05, respectively; Fig. 3A, 3B, 3C and 3D, Table 3), but not compared with seronegative tumors. Likewise, the tumor tissue of HCMV+ patients contained significantly higher CD45RO+CD62L−CCR7low CD4+TEM cells compared with peripheral blood of seropositive and seronegative donors (2-way ANOVA, P < 0.0001 for both) as well as blood of seropositive and seronegative patients (P < 0.01 for both; Fig. 3A, 3B, 3C and 3D, Table 3). There was also no difference in CD45RO−CD62L− CCR7low CD4+TE cells and CD45RO+CD62L+ CCR7bright CD4+TCM cells (2-way ANOVA, P > 0.05; Fig. 3A, 3B, 3C and 3D, Table 3). Thus, the decreased TN and increased TEM CD4+ cells in the GBM patients were not dependent on HCMV serostatus and might be a result of generalized tumor suppression.
Figure 3.

Increased CD4+ and CD8+ TEM cells in HCMV+ GBM tumor with higher CTLA4/CD28 ratio compared with donor peripheral blood. (A) Representative dotplots showing lymphocytes in dissociated GBM tumor gated on FSC vs. SSC; singlets, live dead and within CD45+ cells, left to right. Representative dotplots showing (B) CD4+ (Th) vs. CD8+ (CTLs) T cell populations and (C) CD45RO vs. CD62L populations within the Th cell and CTL gates. % mean ± SEM of (D) Th (CD3+CD4+) and (E) CTLs (CD3+CD8+) naïve (N: CD45RO−CD62L+CCR7bright), central memory (CM: CD45RO+CD62L+CCR7bright), effector (E: CD45RO−CD62L−CCR7low) and effector memory (EM: CD45RO+CD62L−CCR7low) in peripheral blood (n = 22) and tumor (n = 19) of HCMV+ and HCMV− patients compared with seropositive vs. seroponegative donors (n = 16) (Two way ANOVA, Bonferroni's multiple comparison *P < 0.05, **P < 0.01, ***P < 0.001 and ****P < 0.0001). Mean MFI ± SEM of CCR7 within (F) the Th (CD3+CD4+)and (G) CTLs (CD3+CD8+) T cell subsets, showing low CCR7 expression in TEM and TE subsets (Two way ANOVA, Bonferroni's multiple comparison, *P < 0.05, and ****P < 0.0001). Mean MFI ± SEM of (H) CD28 and (I) CTLA-4 within the Th (CD3+CD4+)TEM; (J) CD28 and (K) CTLA-4 within the CTLs (CD3+CD8+)TEM (Two way ANOVA, Bonferroni's multiple comparison, **P<0.01, ***P < 0.001 and ****P < 0.0001). (L) % mean ± SEM of CTLA-4+ cells within the CTLs (CD3+CD8+)TEM (Two way ANOVA, Bonferroni's multiple comparison, ***P < 0.001 and ****P < 0.0001).
Table 3.
CD4+ and CD8+ TEM and TN cells in patients relative to donors.
| Donor HCMV+ PBMCs | Donor HCMV− PBMCs | Patient HCMV+PBMCs | Patient HCMV−PBMCs | Patient HCMV+biopsy | Patient HCMV−biopsy | ||
|---|---|---|---|---|---|---|---|
| (n= 9) | (n = 7) | (n = 17) | (n = 2) | (n = 13) | (n = 2) | Statistical analysis | |
| % of CD4+EM | 30.1 ± 5.1 | 18.7 ± 1.2 | 42.3 ± 5.1 | 25.2 | 62.1 ± 4.1 | 70.7 | Two-way ANOVA, Bonferroni's multiple comparison test: |
| P < 0.01 for Donor HCMV+ vs. patient HCMV− biopsy, | |||||||
| P < 0.0001 for Donor HCMV+ vs. patient HCMV+ biopsy, | |||||||
| P < 0.0001 for Donor HCMV− vs. patient HCMV− biopsy, | |||||||
| P < 0.0001 for Donor HCMV− vs. patient HCMV+ biopsy, | |||||||
| P < 0.01 for Donor HCMV− vs. patient HCMV+ PBMC, | |||||||
| P < 0.05 patients' HCMV− PBMC vs. patient HCMV− biopsy | |||||||
| P < 0.01 patients' HCMV+ PBMC vs. patient HCMV+ biopsy and | |||||||
| P < 0.01 patients' HCMV− PBMC vs. patient HCMV+ biopsy | |||||||
| % of CD4+N | 36.6 ± 5.1 | 44.9 ± 2.1 | 19.4 ± 3.8 | 27.7 | 5.2 ± 1.9 | 4.1 | Two-way ANOVA, Bonferroni's multiple comparison test: |
| P < 0.05 for Donor HCMV+ vs. patient HCMV− biopsy, | |||||||
| P < 0.001 for Donor HCMV+ vs. patient HCMV+ biopsy, | |||||||
| P < 0.05 for Donor HCMV+ vs. patient HCMV− biopsy, | |||||||
| P < 0.01 for Donor HCMV− vs. patient HCMV− biopsy, | |||||||
| P < 0.0001 for Donor HCMV− vs. patient HCMV+ biopsy and | |||||||
| P < 0.001 for Donor HCMV− vs. patient HCMV+ PBMC | |||||||
| % of CD8+EM | 25.9 ± 4.2 | 16.6 ± 3.5 | 28.1 ± 4.1 | 22.1 | 52.1 ± 5.6 | 54.0 | Two-way ANOVA, Bonferroni's multiple comparison test: |
| P < 0.001 for Donor HCMV+ PBMC vs. patient HCMV+ biopsy, P < 0.05 for Donor HCMV−PBMC vs. patient HCMV− biopsy, | |||||||
| P < 0.0001 for Donor HCMV−PBMC vs. patient HCMV+ biopsy and | |||||||
| P < 0.0001 for patients' HCMV+ biopsy vs. patient HCMV+ PBMC | |||||||
| % of CD8+N | 26.9 ± 5.7 | 40.60 ± 5.5 | 26.9 ± 4.4 | 21.1 | 10.9 ± 2.8 | 0.8 | Two-way ANOVA, Bonferroni's multiple comparison test : |
| P < 0.01 for Donor HCMV−PBMC vs. patient HCMV− biopsy and P < 0.001 for Donor HCMV−PBMC vs. patients HCMV+ biopsy |
Seronegative donors exhibited the greatest frequencies of CD8+TN cells in peripheral blood compared with both HCMV+ and HCMV− tumors (P < 0.001 and P < 0.01, respectively; Fig. 3A, 3B, 3C and 3E, Table 3) and may imply a healthy and more functional immune system. CD8+TEM cells also accumulated substantially in tumor tissue compared with peripheral blood of seropositive GBM patients, (P < 0.0001) as well as both seropositive and seronegative donors (P < 0.001 and P < 0.0001, respectively; Fig. 3A, 3B, 3C and 3E, Table 3). All TE and TEM cells expressed lower levels of CCR7 compared with TN and TCM cells, respectively (Fig. 3F and 3G). Taken together, differences in T cell phenotypes indicated a tumor directed maturation effect rather than an effect of HCMV serostatus.
Tumor-derived TEM cells express less CD28 but more CTLA-4 than TEM cells in peripheral blood of HCMV+ patients
The potential functionality of T cell responses in various diseases can be reliably determined by examining molecular markers that have been associated with activation. We thus sought to investigate whether the activation states of the CD4+ and CD8+ TEM subsets differed with regard to HCMV seropositivity in patient tumor and blood, compared with healthy donors, by characterizing expression of immune checkpoint markers CD28, CTLA-4 and PD-1. Peripheral blood-derived CD4+TEM cells from HCMV+ patients highly expressed CD28 compared with tumor-derived CD4+TEM cells from HCMV+ patients (2-way ANOVA, P < 0.01, Fig 3H). These patient-derived cells also expressed CD28 at levels that were 2-fold greater than CTLA-4 potentially indicating greater activation status (Fig. 3H and 3I). In HCMV− patients, CD4+TEM cells from the blood expressed CD28 but only barely detectable levels of the immune checkpoint marker CTLA-4 (Fig. 3H and 3I), indicating greater functionality of peripheral blood cells than those within the tumor microenvironment.
For CD8+ subsets,greater levels of CD28 were observed in peripheral blood-derived CD8+TEM cells from HCMV+ GBM patients (P < 0.0001), as well as HCMV+ (P < 0.0001) and HCMV− (P < 0.001) donors, compared with HCMV+ tumor-derived CD8+TEM cells (2-way ANOVA, Fig. 3J). In contrast, the HCMV+ tumor-derived CD8+TEM cells expressed greater levels of CTLA-4 than in those from peripheral blood of HCMV+ patients (P < 0.01, Fig. 3K). Moreover, an increased percentage of CD8+TEM cells in tumor expressed CTLA-4 compared with blood of HCMV+ patients (P < 0.0001), as well as HCMV+ (P < 0.0001) and HCMV− donors (P < 0.001) (2-way ANOVA, Fig. 3L). Collectively, these data may indicate a status of tumor-derived suppression of T cell activation, characterized by decreased CD28 and increased CTLA-4.
CTLA-4 checkpoint blockade and CD8+TEM function
Despite increased fractions of CD8+TEM in HCMV+ patient tumors (Fig. 3E) with elevated expression of CTLA-4 (Fig. 3K and 3L) and PD-1 (Fig. 4A and 4B), these T cells from HCMV+ GBM patient tumors degranulated better under steady-state compared with blood-bourne T cells from HCMV+ GBM patients (P < 0.0001), as well HCMV+ (P < 0.0001) and HCMV− donors (P < 0.0001; Fig. 4A and 4B). Anti-CTLA-4 blockade in combination with HCMV-specific peptide stimulation of both tumor and peripheral blood T cells from patients and controls had no significant effect on their degranulation capacity (data not shown). However, low IFNγ secreting T cells from the blood of HCMV+ patients showed a non-significant tendency toward increased IFNγ levels after CTLA-4 checkpoint blockade (69.3 ± 26.9 vs. 332.1 ± 200.3, baseline vs. blockade, respectively; Fig. 4C and 4D) before stimulation of HCMV peptides. Likewise, non-statistically significant changes in IFNγ release were also observed in donor T cells after CTLA-4 checkpoint blockade (158 ± 88.9 vs. 463.4 ± 249.1, baseline vs. blockade, respectively; Fig. 4C and 4D). Taken together, these results indicated that CD8+TEM infiltrating the tumor are tolerised to express high levels of CTLA-4 and PD-1 immune checkpoint molecules and diminished CD28, despite greater propensity for degranulation. Anti-CTLA-4 blockade was not sufficient to relinquish their immunosuppression, whereas in corresponding peripheral blood T-cells cells, this treatment showed a tendency toward harnessed responses.
Figure 4.
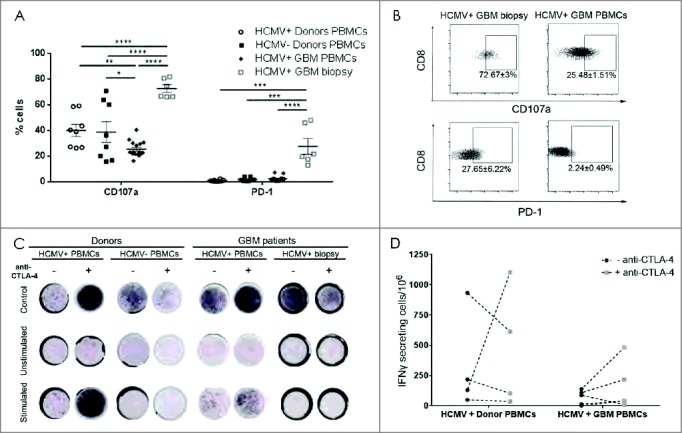
High CD107a degranulation and PD-1 expression in CD8 (T) cell from HCMV+ patient biopsies. (A) % mean ± SEM of CD107a and PD-1 expression in HCMV+ and HCMV− patients' (n = 8), tumor (n = 6) and healthy donors' (n = 8) CD3+CD8+ T cells. (B) Representative dotplots and % mean ± SEM of CD3+CD8+ T cell expressing CD107a cells and PD-1 cells. (C) Representative IFNγ ELISpots from seropositive vs. seronegative patients' blood, tumor and healthy donors with and without stimulation with pp65 or IE-1 HCMV peptides and with (+) or without (-) anti-CTLA-4 blockade. Secretion was considered positive when number of cells secreting was >0, normalized to HCMV− donors. (D) Difference in frequency of IFNγ secreting cells after stimulation with pp65 HCMV peptides in HCMV+ patients (n = 5) vs. HCMV+ donors (n = 4) with and without blocking with CTLA-4. Two way ANOVA, Bonferroni's multiple comparison, *P < 0.05, **P < 0.01, ***P < 0.001 and ****P < 0.0001.
Increased pp65-HLA-A2/B8 dextramer restricted CD8+T cells in GBM tumor
Given the lack effect of HCMV on either T cell phenotype or function, we next asked whether the CD8+TEM cells infiltrating tumor and peripheral blood were in fact HCMV-specific, and second, if they were functional in response to HCMV peptide stimulation given the elevated fractions expressing CTLA-4. Based on detection in tumor samples, 38.5% (5/13) of HCMV+ GBM patients exhibited HCMV-specific CD8+TEM cells in tumor (Fig. 5C and 5D). However, the frequency of the HCMV-specific CD8+TEM cells was greatest in the blood of seropositive patients (6.0 ± 1.6% cells) compared with seronegative patients (0.4 ± 0.2%; P < 0.01 cells) and healthy control donors regardless of serostatus (HCMV+:2.4 ± 0.4%, P < 0.05; HCMV−:0.01 ± 0.01%, P < 0.001, 2-way ANOVA, Fig. 5A, and 5B). Furthermore, 55.6% (5/9) of seropositive donors had detectable HLA-A2/B8 restricted HCMV-specific CD8+ T cells whereas only 15.8% (3/19) of GBM patients had these fractions in their blood (Fig. 5C). Finally, pp65-HLA-A2/B8 dextramer positive CD8+CD3+CD56+ cytotoxic cells were also detected exclusively in tumor tissue. As expected seronegative donors and patients reproducibly lacked these fractions (data not shown).
Figure 5.

Increased HCMV-specific CD8+ T-lymphocytes with reduced function in HCMV+ GBM. (A) Representative dotplots showing HLA-A2/B8 dextramer restricted pp65- and IE-1 specific CD8+ T cell populations. (B) % mean ± SEM of HLA-A2/B8 dextramer+ CD8+ T-cells and (C) bar graph showing frequency of samples containing HLA-A2/B8 dextramer HCMV-specific CD8+ T cells in HCMV+ and HCMV− patients' blood (n = 21), tumor (n = 15) and healthy donors' blood (n = 16). (D) Live cell confocal microscopy images visualizing HLA-A2/B8 dextramer+ HCMV-specific CD8+ T cells in GBM dissociated tissue from HCMV+ vs. HCMV− patients, Magnification 630X, scale bar 10 μm. (E) Representative IFNγ ELISpots from seropositive vs. seronegative patients' blood, tumor and healthy donors with and without stimulation with pp65 or IE-1 HCMV peptides. IFNγ secretion was considered positive when number of cells secreting was ≥ 0 total cells. (F) % mean ± SEM of IFNγ secreting cells/106 total cells after stimulation with pp65 or IE-1 HCMV peptides in HCMV+ patients (n = 14) vs. HCMV+ and HCMV− donors (n = 16). Low IFNγ secretion ≥ 8; High IFNγ secretion ≥ 150 per 106 total cells. (G) Frequency of GBM patients and donors samples containing IFNγ secreting cells after stimulation with pp65 or IE-1 HCMV peptides in HCMV+ patients (n = 14) vs. HCMV+ and HCMV− donors (n = 16).
Secretion of IFNγ as determined in ELISpot assays was used to assess whether peptide stimulated T cells isolated from HCMV+ patients and/or donor samples were functional. None of the HCMV− donors released IFNγ in response to HCMV peptide stimulation. Therefore, IFNγ secretion was considered positive when the number of cells secreting IFNγ was > 0. However, in response to stimulation with HLA-A2/B8 restricted IE-1/pp65 peptides, blood-derived T cells from seropositive patients secreted 4-fold more IFNγ compared with seropositive donor T cells (2-way ANOVA, P < 0.0001; Fig. 5E and 5F). In response to IE-1/pp65 peptide stimulation, 87.5% (7/8) of HCMV+ donor blood samples released IFNγ compared with 78.6% (11/14) HCMV+ patient blood samples (Fig. 5G). In contrast, T cells from GBM tissues did not secrete detectable levels of IFNγ in response to IE-1/pp65 -peptide stimulation (Fig. 5E). As expected, peptide stimulated blood-derived T cells from HCMV− donors and patients did not secrete IFNγ (Fig. 5E and 5F). These results indicated that although CD8+TEM cells infiltrating the HCMV+ tumor were HCMV specific, they were more functionally impaired that those in peripheral blood.
IE-1 positivity has no impact on patient survival
Finally, to determine whether HCMV antigens might impact disease progression, Kaplan-Meier curves for patient survival were generated and also for evaluating impact of age and MGMT promoter methylation status, 2 well-described prognostic factors in GBM. The presence of HCMV antigens in the tumor did not impact patient survival (Log Rank 0.51 HR = 0.845 95%CI (0.530-1.350), P = 0.48, Fig. S1F). However, age (Log Rank7.97HR = 1.733 95% CI (1.181-1.2.540), P = 0.005, data not shown) and MGMT promoter methylation (Log Rank10.66 HR = 1.474, 95% CI (1.165-1.864), P = 0.001, Fig. S1G) were prognostic as expected, confirming the validity of our analyses.
Discussion
Contradicting evidence on the prevalence of HCMV gene products in GBM has been reported. Studies that contribute to clarifying the controversy and elucidate the biologic impact of HCMV in GBM tissues are important as the viral products may serve as targets for effective immunotherapy for GBM patients. On the other hand, active HCMV replication in GBM tissue may stymie immunotherapeutic attempts thorough various immunoevasive strategies,32-34 so that striking an intricate equilibrium of immune activation is needed. Here, we report for the first time a comprehensive analysis of the HCMV status in a large cohort of GBM tissues (n = 177), wherein n = 117 tumor-blood paired analyses were conducted for pp65 and n = 78 paired analyses for IE-1, as well as comparative serology analyses from (n = 48) patients and (n = 91) healthy donors. We confirmed the presence of HCMV products in 25 – 43% of GBM tissues, with 79% of GBM patients being seropositive. These results are concordant with previously reported prevalence.5,35-37 We determined that both serology and qPCR were reliable methods to detect HCMV, where DNA, in particular IE-1, was best correlated in blood and tissue by qPCR. Nevertheless, IE-1 DNA was vulnerable to degradation over time, confirming a previous suggestion.11 Serology detected more patients who had been infected with HCMV than IHC or qPCR, and reliably correlated with T cell responses and functional status, which however were not associated with enhanced patient survival. However, limited numbers of HCMVseronegative GBM samples influenced the statistical power of our analyses as nearly all GBM samples available for functional analyses were seropositive.
Our study is the first to investigate TEM subsets in relation to HCMV antigens in brain tumor tissue under steady-state and how their phenotype impacts functional responses to HCMV peptide stimulation. Our findings highlight the ultimate barrier the tumor microenvironment represents in regulating T cell responses against target cells expressing viral proteins.
Other studies reported higher IE-1 antigen levels in GBM tissue than our finding, herein of 43%,5,36,38 with the exception of one study35 where the antigen was detected at lower frequency. The discrepancy may be attributed to the methods used, but also to the relatively small number of previously examined samples in individual studies, where the median case number was n = 36 (range 21- 49). We also established that pp65 was expressed on diverse cell types within the tumor environment, including tumor cells, CD31+ endothelial cells, CD45brightCD11bright macrophages and CD45dimCD11bbright microglial cells. Within the tumor compartment, approximately 20% of cells expressed pp65. It has been reported that HCMV displays tropism for cancer stem cells and tumor associated macrophages/microglia (TAMs) within GBM,6 where TAMs are the predominant immune cells accounting for up to 40% of the tumor mass.39 HCMV attachment has been shown to lead to polarization of TAMs to M2 anti-inflammatory phenotypes characterized by secretion of IL-10, arginase and iNOS and increased STAT3 signaling to promote immunosuppression,6 through induction of PD-L1 on tumor cells, T cell anergy or inhibition through nitric oxide signaling.40 Our data do confirm greater tropism of pp66 to macrophages, microglia and endothelial cells than tumor cells.
The central tenet of host defense against viral infection posits that CD8+ T cells are instrumental,41 and that naïve CD8+ T cells proliferate and differentiate into effector phenotypes upon encounter with antigen presented on class I HLA by dendritic cells in secondary lymphoid organs.41,42 Effector CD8+ T cells migrate into sites of infection and kill infected cells, and upon clearance of infection, the population contracts, while a pool of pathogen-specific memory CD8+ T cells emerges and persists long-term,43,44 allowing for more rapid expansion and recall upon re-encounter with the same pathogen.45 Our results demonstrated that CD3+CD8+T cells were increased in both tumor tissue and blood of IE-1+ seropositive GBM patients. In blood, seropositive GBM patients displayed decreased levels of CD4+T cells, a finding that concurs with previous reports in elderly seropositive individuals denoting an “immune risk” phenotype associated with increased morbidity and mortality.46 Within the CD4+T cell fractions, it was particularly the CD45RO−CD62L+CCR7bright TN cells that were attenuated in the tumor and blood, while CD45RO+CD62L−CCR7low TEM subsets were increased in the GBM tumor compared with HCMV seropositive and seronegative donor and patient blood. The engagement of the TCR on TN cells with HCMV-antigen presented on class II HLA- molecules of antigen presenting cells in secondary lymphoid organs results in T cell differentiation to antigen experienced TE cells, potentially explaining their loss from peripheral blood and their enrichment in non-lymphoid, tumor tissues. The limited data from seronegative GBM patients for comparison, however, was a major limitation of our study that prevented unequivocal conclusions regarding the contribution of HCMV to the immune responses apart from the generalized tumor immune suppression. In response to pp65/IE-1 peptide stimulation, the HCMV specific CD8+TEM cells in peripheral blood of patients produced IFNγ at 4-fold higher levels compared with healthy donors. These cells highly expressed CD28 co-stimulatory molecules and attenuated CTLA-4 levels, which is consistent with their improved functionality. However, checkpoint blockade using antibodies against CTLA-4 after stimulation with pp65/IE-1 HCMV peptides in HCMV+ patients and donors did not significantly alter the frequency of IFNγ secreting cells or their function in terms of degranulation or TNFα secretion. Since we also observed increased basal expression levels of PD-1 on CD8+TEM cells in the HCMV+ patient biopsies, it may have been instrumental to also block PD-1 in combination with CTLA-4. The antibodies used were also not of clinical grade, which may have influenced the sensitivity of our readout.
Previous studies demonstrated that CTLA-4 blockade increased IL-2 production by CD4+T-helper cells resulting in greater terminal differentiation of CD8+T cells and augmentation of antigen specific CD8+T cells capable of producing pro-inflammatory cytokines IFNγ and TNFα.47 Nevertheless, we rarely detected HCMV antigens in blood, perhaps explaining the greater amplitude of IFNγ responses to exogenous pp65/IE-1 peptide stimulation. In contrast, HCMV specific CD8+TEM cells were more frequent in the tumor of HCMV positive patients. Since by definition, these cells lack homing and chemokine receptors CD62L and CCR7, it is possible that their increased numbers in the tumor microenvironment is a result of in situ proliferation in response to HCMV antigens pp65 and IE-1 that were detected. The high numbers of CD56+ HCMV-specific CTLs in the GBM tumors reported herein might also corroborate this hypothesis. Indeed, increased proportions of HCMV-specific CD8+CD56+ T cells have previously been described to be associated with primary or reactivating HCMV infections.48,49 These CD56+ T cells are cytotoxic to HCMV infected tumor cells and express distinct KIR, DNAM-1 receptors and a transcriptional gene signature that is unique from NK cells and Vα24+Vβ11+ invariant NKT.50,51 An alternative explanation for the source of these cells is that they were not recruited from peripheral blood, but indeed, expanded from CD103+ resident T cells. Unfortunately, we did not explore this possibility due to limited fresh biopsy material. Nevertheless, pp65-specific antigen stimulation of the TEM cells present in the tumor microenvironment did not result in detectable IFNγ production. It is possible that the presence of a low-level of HCMV antigens in the tumor microenvironment induced an exhausted phenotype in the CD8+TEM cells. However, in the absence of HCMV− tumor samples for comparison, it cannot be ruled out as a generalized tumor induced immunosuppression. As a result, the tumor-infiltrating HCMV-specific TEM cells exhibited greater CTLA-4 levels, and % of CTLA-4+ populations compared with CD28 expression, as well as % of CD8+PD-1+ fractions. CTLA-4 is preferentially induced on activated CD4+T cells52 during the priming phases of T cell activation, while PD-1 functions during the effector phases of T cell surveillance in peripheral tissues.53,54 Indeed, PD-1 expression is increasingly identified as a hallmark of over activated T cells that have experienced high antigen levels, extended periods of stimulation or exhausted cells after reduced CD4+T cell help.55 This tenet would partially support our reported findings here.
The precise molecular mechanisms for HCMV-specific immune dysfunction that we had set out to decipher still remain elusive, and in the absence of further evidence, the conclusion must be that generalized immune suppressive environment in GBM56,57 is a contributing factor that cannot be ruled out. A previous study reported diminished numbers of pp65-specific T cells in peripheral blood of GBM patients relative to healthy donors, while yet another found no difference between patients and controls.38,58 In both studies, however, T cells from both patients and controls could be expanded to high yields under continuous peptide stimulation in vitro. Expansion under stimulation improved their functionality, as indicated by their augmented killing of peptide-pulsed autologous cells as targets and the production of a broader range of cytokines.
Based on such findings, immunotherapies based on HCMV immunogenicity have already moved into the clinic. Adoptive transfer of ex vivo expanded, peripheral blood-derived HCMV−specific T cells in combination with chemotherapy was recently reported in 13 of 19 recurrent GBM patients. 11 of these patients received up to 4 T-cell infusions, and the treatment was well tolerated with long progression free survival reported.20,58 Expression analyses of the expanded T cells revealed a gene transcription profile, upregulated IFNγ with attenuated CTLA-4 and FoxP3, that distinguished responding from non-responding patients.20 Our results at steady-state are consistent with these findings, and extend the knowledge by comparing tumor with peripheral blood from GBM patients to healthy controls. Our results lend support to the rationale for intra-tumoral /ventricular adoptive transfer of expanded, functional antigen specific T cells in combination with multiple immune checkpoint blockade strategies and or other immunomodulation therapies, such as vaccine therapy. Whether HCMV specific antigens have potential in this context remains to be elucidated. Indeed, CTLA-4 immune checkpoint inhibiting antibodies such as Ipilimumab have demonstrated unprecedented efficacy as combination therapy in subsets of patients with metastatic melanoma.59-61 The treatment increased activated and antigen specific CD4+ and CD8+T cells with corresponding decrease in naïve CD4+ and CD8+T cells.61,62 More recently, combination therapy of CTLA-4 and PD-1 blockade has improved survival and progression-free survival of patients with metastatic melanoma with durable responses beyond 3 y for a subset of patients.60,63,64 The presence of HCMV antigens in the tumor microenvironment may ensure continued proliferation, maturation and survival of the transferred cells. Combination with immunomodulation might ensure a state of functionality as opposed to exhaustion. Thus, our findings pave the way for intensive exploration as therapeutic strategy.
Although we have largely focused on adaptive immunity in HCMV+ GBM, cell types involved in innate immunity were also detectably altered. In blood of HCMV seropositive patients, NK cells were markedly reduced compared with seronegative patients and healthy donors regardless of HCMV status. HCMV permanently reconfigures the NK-cell compartment, a hallmark of which is greater frequency of mature NK-cells characterized by expression of CD57+CD16+CD94/NKG2C and inhibitory killer immunoglobulin-like receptors (iKIR).65 We recently demonstrated that GBM had a differentiating effect on NK cells indicated by higher fractions expressing CD57, CD16 and NKG2D in GBM patients that was further augmented by HCMV infection.66 The CD57+ mature NK cells are potent killers but exhibit replicative senescence and diminished proliferation67 possibly explaining their reduced numbers in the blood of seropositive GBM patients. HCMV proteins inhibit class I HLA expression32-34 that would result in loss of engagement of iKIRs specific for class I HLA ligands, effectively lowering the threshold for NK-cell activation against infected cells.65 Indeed, seropositive GBM patients carrying the activating KIR2DS4*00101 allele in the context of specific HLA-C1/C2 ligands had increased HCMV matured NK cells with conceivably potent cytotoxicity that contributed to substantially attenuated disease progression.66 Thus, under these conditions, NK cells can also contribute to killing HCMV infected tumor cells, especially if tagged by anti-HCMV IgG. Their activation may contribute to the release of IFNγ that has potential to reverse the tumor microenvironment from immunosuppressive to pro-inflammatory.
Despite increased T cell infiltration to the HCMV+ tumors, we were unable to demonstrate a survival benefit of HCMV infection on patient outcomes. This is in contrast to a study reporting that GBM patients with low-grade IE-1 expression (cut-off at < 25% infected tumor cells) exhibited longer median survival independent of age.68 With a much larger patient cohort, we could not corroborate these findings. Differing methods of stratification of HCMV positivity potentially account for the discrepancy. The diminished T-cell functionality in the tumor microenvironment likely underscores the lack of survival benefit of HCMV antigens per se in our study. Nevertheless, another large prospective study of (n = 347) leukemia patients could not demonstrate prognostic effect of HCMV status based on serology.26 Taken together, our findings support the recent surge of interest in administering ex vivo expanded autologous antigen-specific T cells or the use of tumor lysate pulsed dendritic cells for immunotherapy against GBM. It will be important to combine these cells with immunomodulating drugs or HCMV-specific vaccines to increase T and NK cell persistence and functionality at the severely immunosuppressive tumor frontier.
Materials and methods
Ethics statement
The regional ethical committee approved the study (REK vest 013.09/20879; 2014/588), and samples were collected with the informed consent of patients and healthy donors.
Norwegian GBM patients and healthy donors
GBM biopsies (n = 177) were analyzed wherein matching tumor-blood samples were analyzed for pp65 (n = 117) and IE-1 (n = 78). Samples were obtained during surgical resections performed at Haukeland University Hospital, (Bergen, Norway) between 1998 and 2017. Neuropathologists confirmed the diagnosis of GBM. Plasma from healthy donors (n = 91) was used for control experiments. Eligibility criteria for patient material were the following: biopsies obtained at primary GBM diagnosis, < 30% necrosis, and availability of follow-up data. Survival was determined as time elapsed from the date of surgery to death or last follow-up in July 2016.
GBM tissue dissociation and live cell confocal microscopy
Fresh biopsy tissue (n = 19) was mechanically diced with scalpels into pieces < 1 mm3 under sterile conditions. The tissue was dissociated into single-cell suspensions in 5% Liberase DH (5401089001, Roche Molecular Diagnostics; Pleasanton, CA, USA) and 2% deoxyribonuclease I (LS002139, Worthington) in HBSS (Gibco, 14170-088, Thermo Fisher Scientific; Waltham, MA, USA) at 37°C for 30 min in a shaking water bath at 220 strokes/min, through successive rounds. Cells were triturated, filtered through a 100 µm cell strainer (352360, BD Falcon), and centrifuged at 900 rpm for 5 min for harvesting. Cell filtering was repeated once over a 70 µm cell strainer (352350, BD Falcon) followed by twice over 40 µm filters (352340, BD Falcon). Live cell imaging was performed simultaneously with dextramer analysis and T-cell phenotyping. A 10 µL drop consisting of 50,000 GBM cells, stained with PE-conjugated HLA-A2 or HLA-B8 dextramer, was seeded onto a Nunc Lab-Tek II 4-well chambered coverglass (154917, Thermo Fisher Scientific). A Leica HCS PL Apo CS 63 × numeric aperture (∞um1.4) oil objective was used, and live cell imaging was performed using the Leica SP5 AOBS confocal microscope (Leica Microsystems; Wetzlar, Germany). Images were imported and compiled into figure montages with Adobe Photoshop software (Adobe Systems; San Jose, CA, USA).
DNA isolation and quantitative PCR (qPCR)
Genomic DNA was isolated from blood and snap frozen, cryosectioned GBM biopsies using the DNeasy Blood & Tissue Kit (69504, QIAGEN), according to the manufacturer's protocol. Percentage of tumor cells in GBM cryosections was assessed at > 70% based on H&E staining. To detect UL83 (pp65) and major immediate early-1 (IE-1) sequences, qPCR was performed on genomic DNAs with the QuantiTect SYBR green PCR kit solution (204141, BioRad Laboratories, Inc.; Hercules, CA, USA) in microcapillary plates in the Light-Cycler 480 System (Roche Diagnostics; Indianapolis, IN, USA), following the manufacturer's instructions. For PCR, a 5 min denaturation at 95°C was followed by 40 cycles of 10 s at 95°C, 40 s at 56°C for pp65 and 60°C for IE-1 and 30 s at 40°C. Sequences of primer pairs used in qPCR were the following: UL83 (pp65) forward, 5′- GCAGCCACGGGATCGTACT-3′ and reverse, 5′-GGCTTTTACCTCACACGAGCATT-3′69,70; IE-1 forward, 5′-GACTAGTGTGATGCTGGCCAAG-3′ and reverse, 5′-GCTACAATAGCCTCTTCCTCATCTG-3′.3,71 DNA isolated from plasma from an HCMV-infected patient sample was used as the positive control. pp65 and IE-1 were considered positive at Ct values ≤ 34.
HLA genotyping
The HLA class I locus (A, B, and C) in blood samples of GBM patients and healthy donors was genotyped within 4-digit resolution using sequence-specific oligonucleotide probe hybridization (ProImmune; Table 1).
Table 1.
Clinical profile of GBM patients and geographically matched healthy control donors.
| ID | Age | Gender | IgG | IgM | HLA-A Locus | HLA-B Locus | ||
|---|---|---|---|---|---|---|---|---|
| Donor 2 | 64 | M | 148.1 | 0.3 | *02:01 | — | *40:01 | *44:02 |
| Donor 3 | 63 | M | 145.8 | 0.4 | *02:01 | *32:01P | *18:01 | *41:01 |
| Donor 4 | 62 | F | 0 | 0.3 | *01:01 | *11:01 | *08:01 | *35:01 |
| Donor 8 | 44 | M | 71.3 | 0.1 | *02:01 | *32:01P | *40:01 | *44:02 |
| Donor 10 | 24 | M | 1.7 | 0.1 | *02:01 | *03:01 | *15:01 | − |
| Donor 12 | 49 | M | 115.7 | 0.1 | *02:01 | − | *08:01 | *15:01 |
| Donor 14 | 33 | M | 191.8 | 0.2 | *02:01 | *24:02 | *07:02 | *15:01 |
| Donor 16 | 39 | M | 2.1 | 0.2 | *03:01 | *24:02 | *08:01 | *13:02 |
| Donor 19 | 27 | M | 39.9 | 0.1 | *01:01 | *24:02 | *08:01 | *35:03 |
| Donor 27 | 41 | M | 0.3 | 0.2 | *02:01 | *03:01 | *35:01 | *40:02 |
| Donor 28 | 38 | F | 0.4 | 0.4 | *02:01 | − | *14:02 | *15:01 |
| Donor 44 | 29 | F | 158 | 0.1 | *02:01 | *11:01 | *40:01 | *52:01 |
| Donor 49 | 31 | M | 0.3 | 0.2 | *02:01 | *11:01 | *15:01 | *18:01 |
| Donor 51 | 39 | F | 148 | 0.4 | *01:01 | *02:01 | *08:01 | *27:05 |
| Donor 52 | 33 | M | 0.2 | 0.3 | *02:01 | − | *08:01 | *40:01 |
| Donor 62 | 66 | F | 125.4 | 0.4 | *01:01 | *02:01 | *08:01 | *15:01 |
| GBM 1 | 72 | M | 0 | 0 | *02:01 | *68:01 | *27:05 | *40:01 |
| GBM 2 | 61 | F | 0 | 0 | *02:01 | − | *08:01 | *35:01 |
| GBM 3 | 49 | F | 102.9 | 0.3 | *01:01 | *02:11 | *07:05 | *57:01 |
| GBM 4 | 68 | F | >250 | 0.7 | *02:01 | — | *40:01 | *57:01 |
| GBM 5 | 30 | M | 216.7 | 0.19 | *02:01 | *24:02 | *07:02 | *15:01 |
| GBM 6 | 53 | F | 1.4 | 0.1 | *02:01 | *03:01 | *14:02 | *57:01 |
| GBM 7 | 61 | F | 111.4 | 0.3 | *01:01 | *02:01 | *08:01 | *27:05 |
| GBM 8 | 56 | M | 166 | 0.1 | *02:01 | *11:01 | *27:05 | *44:02 |
| GBM 9 | 67 | M | 157.9 | 0.3 | *02:01 | *03:01 | *07:02 | *40:01 |
| GBM 10 | 45 | F | 100.3 | 0.3 | *02:01 | *32:01 | *07:02 | *55:01 |
| GBM 11 | 50 | M | 107.5 | 0.2 | *01:01 | *24:02 | *08:01 | − |
| GBM 12 | 46 | M | 126.2 | 0.3 | *01:01 | *03:01 | *08:01 | *40:01 |
| GBM 13 | 41 | F | >250 | 0.4 | *01:01 | *11:01 | *08:01 | *57:01 |
| GBM 14 | 84 | M | ˃250 | 0.7 | *01:01 | *02:01 | *07:02 | *15:17 |
| GBM 15 | 61 | F | ˃250 | 0.4 | *02:01 | *24:02 | *07:02 | *35:01 |
| GBM 16 | 60 | F | 246,7 | 0.2 | *01:01 | *02:01 | *07:02 | *15:17p |
| GBM 17 | 58 | M | 59 | 0.4 | *02:01 | *03:01 | *15:01 | *35:01 |
| GBM 18 | 72 | M | 125.5 | 0.3 | *02:01 | *03:01 | *07:02 | *44:02 |
| GBM 19 | 72 | M | 202,3 | 0.3 | *01:01 | *02:01 | *08:01 | *44:02 |
| GBM 20 | 55 | F | 87.2 | 0.1 | *02:01 | *24:02 | *07:02 | *40:01 |
| GBM 21 | 43 | F | 176.3 | 0.4 | *24:02 | *68:01 | *08:01 | *44:02 |
Seropositivity was designated as IgG (Au/mL) ≥ 6 and IgM (index) ≥ 1.
CMV serology
Plasma from GBM patients (n = 48) and healthy donors (n = 91) was serotyped for CMV specific IgG (6C15) and IgM (6C16) antibodies using ARCHITECT CMV assays (Abbott; Chicago, IL, USA). A clinical diagnostic cut-off for seropositivity was designated as IgG (Au/mL) ≥ 6 and IgM (index) ≥ 1 (Table 1).
Immunohistochemistry
Immunohistochemistry was performed on formalin fixed paraffin-embedded (FFPE) tissue using the avidin-biotin-peroxidase complex method according to the manufacturer's protocol (Vectastain, PK-4004, Vector Laboratories; Burlingame, CA, USA). FFPE sections from GBM patients (n = 158) were immunostained with the following antibodies according to standard protocols: mouse anti-human cytomegalovirus clone CCH2+ DDG9 detecting IE-1 protein (IR75261-2), rabbit anti-human CD3 (A0452, Dako; Carpinteria, CA, USA), CD4 (NCL−L-CD4-368, Novocastra), CD8α (M7103, Dako), and mouse anti-human NKp46 (LS-B2105/10193, BioSite; San Diego, CA). Human tonsil tissue was used for a positive control, and primary antibody (MOC-31, sc-52344, Santa Cruz Biotechnology; Dallas, TX, USA) was used as the negative control. For IE-1, placental tissue from a known HCMV+ patient was used as the positive control. CD3+,CD4+ and CD8+ cells were quantified by morphometry, using NIS-Elements BR v4 software (400 × magnification, Nikon), and the results were presented as a percentage of the total number of positive cells in a minimum of 4 randomly selected fields representing hot spots for each section analyzed. Tumors were designated positive or negative for HCMV antigens based on the presence or absence of immunolabelled cells.
Flow cytometry, HLA A2/B8-dextramer analysis, CTLA-4 checkpoint blockade and cellular immune responses
Frozen peripheral blood mononuclear cells (PBMC) from serotyped blood donors (n = 56) and GBM patients (n = 22) were thawed and used for flow cytometry experiments. Dead cells were removed from frozen dissociated biopsies (n = 19) before use in experiments according to the manufacturer's protocol (MACS dead cell removal kit, 130-090-101, Miltenyi Biotec; Bergisch Gladbach, Germany). Cells (6 × 10⁶) were cultured in RPMI medium supplemented with 10% human serum (H4522, Sigma-Aldrich; St. Louis, MO, USA) for 10 h at 37°C in 5% CO2. Cells were divided into 2 groups (3 × 10⁶ cells/group) and incubated for 20 min at 4°C (1) with anti-CTLA-4 blocking antibody or isotype control (CD152, 349903, Biolegend; San Diego, CA, USA) and (2) in media without anti-CTLA-4 antibodies. Half of the cells from each of these groups was subsequently stimulated for 12 h with 1 μg/mL of either HLA-A2 or HLA-B8 specific HCMV peptide (NLVPMVATV and QIKVRVDMV from pp65 and IE-1, respectively; Table 2). Lipopolysaccharide (LPS) was added to some samples as a positive stimulation control. To assess degranulation, CD107a (560664, BD Biosciences; San Jose, CA, USA) was added to both groups simultaneously with the peptide and incubated for 1 h. Golgi StopTM and GolgiPlugTM (554724 and 555029, BD Biosciences) were added according to the manufacturer's protocol. After 12 h, cells were aliquoted at 0.25 – 0.5 × 10⁶ cells/tube and stained with Live/Dead® Fixable Near-IR Dead Cell Stain Kit (L10119, Thermo Fischer Scientific) and for surface markers (Table 2) for 20 min at 4°C.
Table 2.
Antibodies used for flow cytometry.
| Antibody | Company | Cat. No. |
|---|---|---|
| V450 mouse anti-human CD56 | BD Biosciences | 560360 |
| V500 mouse Anti-Human CD3 | BD Biosciences | 560770 |
| PE-Cy™7 mouse anti-human CD8 | BD Biosciences | 557746 |
| Brilliant Violet 570™ anti-human CD4 | Biolegend | 300534 |
| Alexa Fluor® 700 anti-human CD45 | Biolegend | 368514 |
| PE anti-HLA-A*0201 (NLVPMVATV, pp65) | Immudex | WB2132-OPT |
| PE anti- HLA-B*0801 (QIKVRVDMV, IE-1) | Immudex | WI2659-OPT |
| APC anti-human CD45RO | Miltenyi | 130-095-460 |
| FITC anti-human CD62L | Biolegend | 304804 |
| Brilliant Violet 711™ anti-human CD197 (CCR7) | Biolegend | 353227 |
| Alexa Fluor® 488 anti-human IFN-γ | Biolegend | 502515 |
| APC anti-human TNF-α | BD Biosciences | 340534 |
| Alexa700 mouse anti-human CD28 | Biolegend | 302920 |
| PE mouse anti-human CD107a | BD Biosciences | 555801 |
| BV786 mouse anti-human CD152 (CTLA-4) | BD Biosciences | 563931 |
| FITC anti-human TCR Vα24-Jα18 (iNKT) | Biolegend | 342905 |
| LEAF™ Purified anti-human CD152 (CTLA-4) | Biolegend | 349903 |
| FITC mouse anti-human cytomegalovirus pp65 | Thermo Fisher | MA1-7296 |
| PE-Cy™7 mouse anti-human CD31 | eBioscience | 25-0319-41 |
| PE mouse anti-human CD11b | Biolegend | 301306 |
| APC mouse anti-human CD279 (PD-1) | BD Biosciences | 558694 |
| APC mouse IgG1 isotype control | BD Biosciences | 555751 |
The samples were also used for HCMV HLA-A2 and HLA-B8 dextramer analysis (Table 1 and 2). Cells were stained with HCMV specific HLA-A2 or HLA-B8 restricted peptide dextramers (Table 2) as described previously.72 Fluorescent Minus One (FMO) controls were used for each channel, and lymphocytes were gated as indicated (Fig. S1A and Fig. S3A). Within the CD3+ CD56− T cell gate, CD8+ and CD4+ naïve (N), central memory (CM), effector (E) and effector memory (EM) T cells were distinguished based on expression of CD45RO, CD62L and CCR7 (Table 2, Fig. 3B and 3C). Data was acquired on the LSR Fortessa™ (BD Biosciences) and analyzed using FlowJo, version 10 (Tree Star Inc.; Ashland, OR, USA).
ELISpot
Functional T cell responses against HLA-A2 and HLA-B8-bound HCMV peptides were verified in an IFNγ enzyme linked immunospot assay (ELISpotPRO, 3420–4AST-2, Mabtech; Mariemont, OH, USA). Cryopreserved PBMCs and biopsies were recovered and treated as described for flow cytometry assays. After 10 hours of incubation (as described for flow cytometry assays), cells were divided into 2 groups (1) incubated for 20 min at 4°C with anti-CTLA-4 blocking antibody (CD152, 349903, Biolegend; San Diego, CA, USA) or (2) cells that were not blocked. 0.25 × 10⁶ −0.5 × 10⁶ cells from each group were added to each ELISpot well according to manufacturer's protocol. Cells in triplicate wells were stimulated with 1 μg/mL of either HLA-A2 or HLA-B8 specific HCMV peptide while one group was left untreated in medium for the non-stimulation control. Anti-CD3 antibody provided by manufacturer was used as a positive stimulation control to confirm the viability of cells. After 12 h of incubation at 37°C in 5% CO2, ELISpot membranes were developed, scanned and quantified as described previously.72 IFNγ secretion was considered positive when the number of cells secreting IFNγ was ˃ 0 total cells.
MGMT methylation analysis
Tumor DNA (200 ng) was treated with sodium bisulfite using the EZ DNA Methylation-Gold KitTM (D5005, Zymo Research; Irvine, CA, USA). PCR was performed on treated DNAs at 40 cycles with primers specific for methylated or unmethylated MGMT promoter sequences. PCR products were separated on 2% agarose gels, and images of ethidium bromide-stained bands were acquired. The primer sequences used were the following: unmethylated MGMT promoter forward, 5′-TTTGTGTTTTGATGTTGTTAGGTTTTTGT-3′ and reverse, 5′-AACTCCACACTC TTCCAAAAACAAAACA-3′; methylated MGMT promoter forward, 5′-TTTCGACGTTCGTAGGTTTTCGC-3′ and reverse, 5′-GCACTCTTCCGAAAACGAAACG-3′.
Statistical analysis
Patient survival was analyzed using the Kaplan-Meier method (42), and Cox-proportional hazards regression was used to assess significant differences in survival adjusted for age, sex, and MGMT as possible confounders. The Fisher's exact test was used to compare frequency differences between HCMV+ and HCMV− patient and healthy donor cohorts. A 2-way ANOVA with Bonferoni correction for multiple testing was used to compare > 2 categorical variables in more than 2 dependent variables. Descriptive statistics were reported as the mean ± SEM unless otherwise stated. Two-sided P-values < 0.05 were considered significant. Statistical analyses were performed in Stata version 13.1 (College Station, TX, USA) or Graphpad PRISM 6.0 software (La Jolla, CA, USA). Venn diagrams were generated in RStudio Software, version 1.0.136 (Boston, MA, USA).
Supplementary Material
Disclosure of potential conflicts of interest
No potential conflicts of interest were disclosed.
Acknowledgments
We thank the Norwegian Cancer Society (#6786380), the Norwegian Research Council (FRIMEDBIO grant #230691) and the University of Bergen for financing our work. We are grateful to Bendik Nordanger and Guro Gundersen for technical assistance and to the patients and healthy donors who consented to participate in this study. We thank the staff at the neurosurgical department and surgical theatres at Haukeland University Hospital for providing annotated tumor / blood samples for the Brain Tumor Biobank. Flow cytometry and confocal microscopy were performed at the molecular imaging center at the University of Bergen. We are grateful to Dr Janice Nigro for critical discussions, language and manuscript editing.
Funding
Norwegian Cancer Society (#6786380, MC), the Norwegian Research Council (FRIMEDBIO grant #230691, MC) and the University of Bergen (MC and AGN).
Author contributions
Performed the experiments: MB, AGN, MAR, MDV, SSAnalyzed the data: MB, AGN, MDV, MAR, GN, EB, SAL, MCContributed reagents/materials/analysis tools: EU, GN, EK, EB, MCWrote the paper: MB, AGN, MC; revised paper: all authorsConceived, designed and provided funding for the study: MCStatistical analyses: MB, AGN, SAL
References
- 1.Louis DN, Ohgaki H, Wiestler OD, Cavenee WK, Burger PC, Jouvet A, Scheithauer BW, Kleihues P. The 2007 WHO classification of tumours of the central nervous system. Acta Neuropathol 2007; 114:97-109; PMID:17618441; https://doi.org/ 10.1007/s00401-007-0243-4 [DOI] [PMC free article] [PubMed] [Google Scholar]
- 2.Stupp R, Mason WP, van den Bent MJ, Weller M, Fisher B, Taphoorn MJ, Belanger K, Brandes AA, Marosi C, Bogdahn U, et al.. Radiotherapy plus concomitant and adjuvant temozolomide for glioblastoma. N Engl J Med 2005; 352:987-96; PMID:15758009; https://doi.org/ 10.1056/NEJMoa043330 [DOI] [PubMed] [Google Scholar]
- 3.Yamashita Y, Ito Y, Isomura H, Takemura N, Okamoto A, Motomura K, Tsujiuchi T, Natsume A, Wakabayashi T, Toyokuni S, et al.. Lack of presence of the human cytomegalovirus in human glioblastoma. Mod Pathol 2014; 27:922-9; PMID:24336154; https://doi.org/ 10.1038/modpathol.2013.219 [DOI] [PubMed] [Google Scholar]
- 4.Crough T, Khanna R. Immunobiology of human cytomegalovirus: From bench to bedside. Clin Microbiol Rev 2009; 22:76-98; PMID:19136435; https://doi.org/ 10.1128/CMR.00034-08 [DOI] [PMC free article] [PubMed] [Google Scholar]
- 5.Cobbs CS, Harkins L, Samanta M, Gillespie GY, Bharara S, King PH, Nabors LB, Cobbs CG, Britt WJ. Human cytomegalovirus infection and expression in human malignant glioma. Cancer Res 2002; 62:3347-50; PMID:12067971 [PubMed] [Google Scholar]
- 6.Dziurzynski K, Wei J, Qiao W, Hatiboglu MA, Kong LY, Wu A, Wang Y, Cahill D, Levine N, Prabhu S, et al.. Glioma-associated cytomegalovirus mediates subversion of the monocyte lineage to a tumor propagating phenotype. Clin Cancer Res 2011; 17:4642-9; PMID:21490182; https://doi.org/ 10.1158/1078-0432.CCR-11-0414 [DOI] [PMC free article] [PubMed] [Google Scholar]
- 7.Ranganathan P, Clark PA, Kuo JS, Salamat MS, Kalejta RF. Significant association of multiple human cytomegalovirus genomic Loci with glioblastoma multiforme samples. J Virol 2012; 86:854-64; PMID:22090104; https://doi.org/ 10.1128/JVI.06097-11 [DOI] [PMC free article] [PubMed] [Google Scholar]
- 8.Sabatier J, Uro-Coste E, Pommepuy I, Labrousse F, Allart S, Trémoulet M, Delisle MB, Brousset P. Detection of human cytomegalovirus genome and gene products in central nervous system tumours. Br J Cancer 2005; 92:747-50; PMID:15700045; https://doi.org/ 10.1038/sj.bjc.6602339 [DOI] [PMC free article] [PubMed] [Google Scholar]
- 9.Lau SK, Chen YY, Chen WG, Diamond DJ, Mamelak AN, Zaia JA, Weiss LM. Lack of association of cytomegalovirus with human brain tumors. Mod Pathol 2005; 18:838-43; PMID:15578071; https://doi.org/ 10.1038/modpathol.3800352 [DOI] [PubMed] [Google Scholar]
- 10.Poltermann S, Schlehofer B, Steindorf K, Schnitzler P, Geletneky K, Schlehofer JR. Lack of association of herpesviruses with brain tumors. J Neurovirol 2006; 12:90-9; PMID:16798670; https://doi.org/ 10.1080/13550280600654573 [DOI] [PubMed] [Google Scholar]
- 11.Cobbs CS. Cytomegalovirus and brain tumor: Epidemiology, biology and therapeutic aspects. Curr Opin Oncol 2013; 25:682-8; PMID:24097102; https://doi.org/ 10.1097/CCO.0000000000000005 [DOI] [PubMed] [Google Scholar]
- 12.Dolan A, Cunningham C, Hector RD, Hassan-Walker AF, Lee L, Addison C, Dargan DJ, McGeoch DJ, Gatherer D, Emery VC, et al.. Genetic content of wild-type human cytomegalovirus. J Gen Virol 2004; 85:1301-12; PMID:15105547; https://doi.org/ 10.1099/vir.0.79888-0 [DOI] [PubMed] [Google Scholar]
- 13.Boeckh M, Geballe AP. Cytomegalovirus: Pathogen, paradigm, and puzzle. J Clin Invest 2011; 121:1673-80; PMID:21659716; https://doi.org/ 10.1172/JCI45449 [DOI] [PMC free article] [PubMed] [Google Scholar]
- 14.Phillips HS, Kharbanda S, Chen R, Forrest WF, Soriano RH, Wu TD, Misra A, Nigro JM, Colman H, Soroceanu L, et al.. Molecular subclasses of high-grade glioma predict prognosis, delineate a pattern of disease progression, and resemble stages in neurogenesis. Cancer Cell 2006; 9:157-73; PMID:16530701; https://doi.org/ 10.1016/j.ccr.2006.02.019 [DOI] [PubMed] [Google Scholar]
- 15.Brennan CW, Verhaak RG, McKenna A, Campos B, Noushmehr H, Salama SR, Zheng S, Chakravarty D, Sanborn JZ, Berman SH, et al.. The somatic genomic landscape of glioblastoma. Cell 2013; 155:462-77; PMID:24120142; https://doi.org/ 10.1016/j.cell.2013.09.034 [DOI] [PMC free article] [PubMed] [Google Scholar]
- 16.Fan QW, Cheng CK, Gustafson WC, Charron E, Zipper P, Wong RA, Chen J, Lau J, Knobbe-Thomsen C, Weller M, et al.. EGFR phosphorylates tumor-derived EGFRvIII driving STAT3/5 and progression in glioblastoma. Cancer Cell 2013; 24:438-49; PMID:24135280; https://doi.org/ 10.1016/j.ccr.2013.09.004 [DOI] [PMC free article] [PubMed] [Google Scholar]
- 17.Joy A, Ramesh A, Smirnov I, Reiser M, Misra A, Shapiro WR, Mills GB, Kim S, Feuerstein BG. AKT pathway genes define 5 prognostic subgroups in glioblastoma. PLoS One 2014; 9:e100827; PMID:24984002; https://doi.org/ 10.1371/journal.pone.0100827 [DOI] [PMC free article] [PubMed] [Google Scholar]
- 18.Cancer Genome Atlas Research Network Comprehensive genomic characterization defines human glioblastoma genes and core pathways. Nature 2008; 455:1061-8; PMID:18772890; https://doi.org/ 10.1038/nature07385 [DOI] [PMC free article] [PubMed] [Google Scholar]
- 19.Slinger E, Maussang D, Schreiber A, Siderius M, Rahbar A, Fraile-Ramos A, Lira SA, Söderberg-Nauclér C, Smit MJ. HCMV-encoded chemokine receptor US28 mediates proliferative signaling through the IL-6-STAT3 axis. Sci Signal 2010; 3:ra58; PMID:20682912; https://doi.org/ 10.1126/scisignal.2001180 [DOI] [PubMed] [Google Scholar]
- 20.Schuessler A, Smith C, Beagley L, Boyle GM, Rehan S, Matthews K, Jones L, Crough T, Dasari V, Klein K, et al.. Autologous T-cell therapy for cytomegalovirus as a consolidative treatment for recurrent glioblastoma. Cancer Res 2014; 74:3466-76; PMID:24795429; https://doi.org/ 10.1158/0008-5472.CAN-14-0296 [DOI] [PubMed] [Google Scholar]
- 21.Soroceanu L, Matlaf L, Bezrookove V, Harkins L, Martinez R, Greene M, Soteropoulos P, Cobbs CS. Human cytomegalovirus US28 found in glioblastoma promotes an invasive and angiogenic phenotype. Cancer Res 2011; 71:6643-53; PMID:21900396; https://doi.org/ 10.1158/0008-5472.CAN-11-0744 [DOI] [PMC free article] [PubMed] [Google Scholar]
- 22.Schuessler A, Walker DG, Khanna R. Cytomegalovirus as a novel target for immunotherapy of glioblastoma multiforme. Front Oncol 2014; 4:275; PMID:25340042; https://doi.org/ 10.3389/fonc.2014.00275 [DOI] [PMC free article] [PubMed] [Google Scholar]
- 23.Soderberg-Naucler C, Rahbar A, Stragliotto G. Survival in patients with glioblastoma receiving valganciclovir. N Engl J Med 2013; 369:985-6; PMID:24004141; https://doi.org/ 10.1056/NEJMc1302145 [DOI] [PubMed] [Google Scholar]
- 24.Parry HM, Zuo J, Frumento G, Mirajkar N, Inman C, Edwards E, Griffiths M, Pratt G, Moss P. Cytomegalovirus viral load within blood increases markedly in healthy people over the age of 70 years. Immun Ageing 2016; 13:1; PMID:26734066; https://doi.org/ 10.1186/s12979-015-0056-6 [DOI] [PMC free article] [PubMed] [Google Scholar]
- 25.Stowe RP, Peek MK, Cutchin MP, Goodwin JS. Reactivation of herpes simplex virus type 1 is associated with cytomegalovirus and age. J Med Virol 2012; 84:1797-802; PMID:22997083; https://doi.org/ 10.1002/jmv.23397 [DOI] [PMC free article] [PubMed] [Google Scholar]
- 26.Parry HM, Damery S, Hudson C, Maurer MJ, Cerhan JR, Pachnio A, Begum J, Slager SL, Fegan C, Man S, et al.. Cytomegalovirus infection does not impact on survival or time to first treatment in patients with chronic lymphocytic leukemia. Am J Hematol 2016; 91:776-81; PMID:27124884; https://doi.org/ 10.1002/ajh.24403 [DOI] [PMC free article] [PubMed] [Google Scholar]
- 27.Arai Y, Martin-Ruiz CM, Takayama M, Abe Y, Takebayashi T, Koyasu S, Suematsu M, Hirose N, von Zglinicki T. Inflammation, but not telomere length, predicts successful ageing at extreme old age: A longitudinal study of semi-supercentenarians. EBioMedicine 2015; 2:1549-58; PMID:26629551; https://doi.org/ 10.1016/j.ebiom.2015.07.029 [DOI] [PMC free article] [PubMed] [Google Scholar]
- 28.Hellstrand K, Martner A, Bergstrom T. Valganciclovir in patients with glioblastoma. N Engl J Med 2013; 369:2066; PMID:24256397; https://doi.org/ 10.1056/NEJMc1312413 [DOI] [PubMed] [Google Scholar]
- 29.Rahbar A, Peredo I, Solberg NW, Taher C, Dzabic M, Xu X, Skarman P, Fornara O, Tammik C, Yaiw K, et al.. Discordant humoral and cellular immune responses to Cytomegalovirus (CMV) in glioblastoma patients whose tumors are positive for CMV. Oncoimmunology 2015; 4:e982391; PMID:25949880; https://doi.org/ 10.4161/2162402X.2014.982391 [DOI] [PMC free article] [PubMed] [Google Scholar]
- 30.Hegi ME, Diserens AC, Gorlia T, Hamou MF, de Tribolet N, Weller M, Kros JM, Hainfellner JA, Mason W, Mariani L, et al.. MGMT gene silencing and benefit from temozolomide in glioblastoma. N Engl J Med 2005; 352:997-1003; PMID:15758010; https://doi.org/ 10.1056/NEJMoa043331 [DOI] [PubMed] [Google Scholar]
- 31.Wick W, Wick A, Platten M. Good maths is needed to understand CMV data in glioblastoma. Int J Cancer 2014; 134:2991-2; PMID:24248554; https://doi.org/ 10.1002/ijc.28614 [DOI] [PubMed] [Google Scholar]
- 32.Lilley BN, Ploegh HL. Viral modulation of antigen presentation: Manipulation of cellular targets in the ER and beyond. Immunol Rev 2005; 207:126-44; PMID:16181332; https://doi.org/ 10.1111/j.0105-2896.2005.00318.x [DOI] [PubMed] [Google Scholar]
- 33.Lodoen MB, Lanier LL. Viral modulation of NK cell immunity. Nat Rev Microbiol 2005; 3:59-69; PMID:15608700; https://doi.org/ 10.1038/nrmicro1066 [DOI] [PubMed] [Google Scholar]
- 34.Slavuljica I, Krmpotic A, Jonjic S. Manipulation of NKG2D ligands by cytomegaloviruses: Impact on innate and adaptive immune response. Front Immunol 2011; 2:85; PMID:22566874; https://doi.org/ 10.3389/fimmu.2011.00085 [DOI] [PMC free article] [PubMed] [Google Scholar]
- 35.Lucas KG, Bao L, Bruggeman R, Dunham K, Specht C. The detection of CMV pp65 and IE1 in glioblastoma multiforme. J Neurooncol 2011; 103:231-8; PMID:20820869; https://doi.org/ 10.1007/s11060-010-0383-6 [DOI] [PubMed] [Google Scholar]
- 36.Mitchell DA, Xie W, Schmittling R, Learn C, Friedman A, McLendon RE, Sampson JH. Sensitive detection of human cytomegalovirus in tumors and peripheral blood of patients diagnosed with glioblastoma. Neuro Oncol 2008; 10:10-8; PMID:17951512; https://doi.org/ 10.1215/15228517-2007-035 [DOI] [PMC free article] [PubMed] [Google Scholar]
- 37.Scheurer ME, Bondy ML, Aldape KD, Albrecht T, El-Zein R. Detection of human cytomegalovirus in different histological types of gliomas. Acta Neuropathol 2008; 116:79-86; PMID:18351367; https://doi.org/ 10.1007/s00401-008-0359-1 [DOI] [PMC free article] [PubMed] [Google Scholar]
- 38.Ghazi A, Ashoori A, Hanley PJ, Brawley VS, Shaffer DR, Kew Y, Powell SZ, Grossman R, Grada Z, Scheurer ME, et al.. Generation of polyclonal CMV-specific T cells for the adoptive immunotherapy of glioblastoma. J Immunother 2012; 35:159-68; PMID:22306904; https://doi.org/ 10.1097/CJI.0b013e318247642f [DOI] [PMC free article] [PubMed] [Google Scholar]
- 39.Morantz RA, Wood GW, Foster M, Clark M, Gollahon K. Macrophages in experimental and human brain tumors. Part 2: Studies of the macrophage content of human brain tumors. J Neurosurg 1979; 50:305-11; PMID:422981; https://doi.org/ 10.3171/jns.1979.50.3.0305 [DOI] [PubMed] [Google Scholar]
- 40.Siemens DR, Hu N, Sheikhi AK, Chung E, Frederiksen LJ, Pross H, Graham CH. Hypoxia increases tumor cell shedding of MHC class I chain-related molecule: Role of nitric oxide. Cancer Res 2008; 68:4746-53; PMID:18559521; https://doi.org/ 10.1158/0008-5472.CAN-08-0054 [DOI] [PubMed] [Google Scholar]
- 41.Banchereau J, Steinman RM. Dendritic cells and the control of immunity. Nature 1998; 392:245-52; PMID:9521319; https://doi.org/ 10.1038/32588 [DOI] [PubMed] [Google Scholar]
- 42.Butcher EC, Picker LJ. Lymphocyte homing and homeostasis. Science 1996; 272:60-6; PMID:8600538; https://doi.org/ 10.1126/science.272.5258.60 [DOI] [PubMed] [Google Scholar]
- 43.Champagne P, Ogg GS, King AS, Knabenhans C, Ellefsen K, Nobile M, Appay V, Rizzardi GP, Fleury S, Lipp M, et al.. Skewed maturation of memory HIV-specific CD8 T lymphocytes. Nature 2001; 410:106-11; PMID:11242051; https://doi.org/ 10.1038/35065118 [DOI] [PubMed] [Google Scholar]
- 44.Sallusto F, Lenig D, Forster R, Lipp M, Lanzavecchia A. Two subsets of memory T lymphocytes with distinct homing potentials and effector functions. Nature 1999; 401:708-12; PMID:10537110; https://doi.org/ 10.1038/44385 [DOI] [PubMed] [Google Scholar]
- 45.Weninger W, Manjunath N, von Andrian UH. Migration and differentiation of CD8+ T cells. Immunol Rev 2002; 186:221-33; PMID:12234374; https://doi.org/ 10.1034/j.1600-065X.2002.18618.x [DOI] [PubMed] [Google Scholar]
- 46.Olsson J, Wikby A, Johansson B, Lofgren S, Nilsson BO, Ferguson FG. Age-related change in peripheral blood T-lymphocyte subpopulations and cytomegalovirus infection in the very old: The Swedish longitudinal OCTO immune study. Mech Ageing Dev 2000; 121:187-201; PMID:11164473 [DOI] [PubMed] [Google Scholar]
- 47.Pedicord VA, Montalvo W, Leiner IM, Allison JP. Single dose of anti-CTLA-4 enhances CD8+ T-cell memory formation, function, and maintenance. Proc Natl Acad Sci U S A 2011; 108:266-71; PMID:21173239; https://doi.org/ 10.1073/pnas.1016791108 [DOI] [PMC free article] [PubMed] [Google Scholar]
- 48.Almehmadi M, Hammad A, Heyworth S, Moberly J, Middleton D, Hopkins MJ, Hart IJ, Christmas SE. CD56+ T cells are increased in kidney transplant patients following cytomegalovirus infection. Transpl Infect Dis 2015; 17:518-26; PMID:26039898; https://doi.org/ 10.1111/tid.12405 [DOI] [PubMed] [Google Scholar]
- 49.Davis ZB, Cooley SA, Cichocki F, Felices M, Wangen R, Luo X, DeFor TE, Bryceson YT, Diamond DJ, Brunstein C, et al.. Adaptive natural killer cell and killer cell immunoglobulin-like receptor-expressing T cell responses are induced by cytomegalovirus and are associated with protection against cytomegalovirus reactivation after allogeneic donor hematopoietic cell transplantation. Biol Blood Marrow Transplant 2015; 21:1653-62; PMID:26055301; https://doi.org/ 10.1016/j.bbmt.2015.05.025 [DOI] [PMC free article] [PubMed] [Google Scholar]
- 50.Almehmadi M, Flanagan BF, Khan N, Alomar S, Christmas SE. Increased numbers and functional activity of CD56(+) T cells in healthy cytomegalovirus positive subjects. Immunology 2014; 142:258-68; PMID:24433347; https://doi.org/ 10.1111/imm.12250 [DOI] [PMC free article] [PubMed] [Google Scholar]
- 51.Chan WK, Rujkijyanont P, Neale G, Yang J, Bari R, Das Gupta N, Holladay M, Rooney B, Leung W. Multiplex and genome-wide analyses reveal distinctive properties of KIR+ and CD56+ T cells in human blood. J Immunol 2013; 191:1625-36; PMID:23858032; https://doi.org/ 10.4049/jimmunol.1300111 [DOI] [PMC free article] [PubMed] [Google Scholar]
- 52.Chan DV, Gibson HM, Aufiero BM, Wilson AJ, Hafner MS, Mi QS, Wong HK. Differential CTLA-4 expression in human CD4+ versus CD8+ T cells is associated with increased NFAT1 and inhibition of CD4+ proliferation. Genes Immun 2014; 15:25-32; PMID:24173147; https://doi.org/ 10.1038/gene.2013.57 [DOI] [PMC free article] [PubMed] [Google Scholar]
- 53.Buchbinder EI, Desai A. CTLA-4 and PD-1 pathways: Similarities, differences, and implications of their inhibition. Am J Clin Oncol 2016; 39:98-106; PMID:26558876; https://doi.org/ 10.1097/COC.0000000000000239 [DOI] [PMC free article] [PubMed] [Google Scholar]
- 54.Keir ME, Butte MJ, Freeman GJ, Sharpe AH. PD-1 and its ligands in tolerance and immunity. Annu Rev Immunol 2008; 26:677-704; PMID:18173375; https://doi.org/ 10.1146/annurev.immunol.26.021607.090331 [DOI] [PMC free article] [PubMed] [Google Scholar]
- 55.Wherry EJ. T cell exhaustion. Nat Immunol 2011; 12:492-9; PMID:21739672; https://doi.org/ 10.1038/ni.2035 [DOI] [PubMed] [Google Scholar]
- 56.Gras Navarro A, Bjorklund AT, Chekenya M. Therapeutic potential and challenges of natural killer cells in treatment of solid tumors. Front Immunol 2015; 6:202; PMID:25972872; https://doi.org/ 10.3389/fimmu.2015.00202 [DOI] [PMC free article] [PubMed] [Google Scholar]
- 57.Kmiecik J, Poli A, Brons NH, Waha A, Eide GE, PØ Enger, Zimmer J, Chekenya M. Elevated CD3+ and CD8+ tumor-infiltrating immune cells correlate with prolonged survival in glioblastoma patients despite integrated immunosuppressive mechanisms in the tumor microenvironment and at the systemic level. J Neuroimmunol 2013; 264:71-83; PMID:24045166; https://doi.org/ 10.1016/j.jneuroim.2013.08.013 [DOI] [PubMed] [Google Scholar]
- 58.Crough T, Beagley L, Smith C, Jones L, Walker DG, Khanna R. Ex vivo functional analysis, expansion and adoptive transfer of cytomegalovirus-specific T-cells in patients with glioblastoma multiforme. Immunol Cell Biol 2012; 90:872-80; PMID:22508289; https://doi.org/ 10.1038/icb.2012.19 [DOI] [PubMed] [Google Scholar]
- 59.Hodi FS, O'Day SJ, McDermott DF, Weber RW, Sosman JA, Haanen JB, Gonzalez R, Robert C, Schadendorf D, Hassel JC, et al.. Improved survival with ipilimumab in patients with metastatic melanoma. N Engl J Med 2010; 363:711-23; PMID:20525992; https://doi.org/ 10.1056/NEJMoa1003466 [DOI] [PMC free article] [PubMed] [Google Scholar]
- 60.Robert C, Thomas L, Bondarenko I, O'Day S, Weber J, Garbe C, Lebbe C, Baurain JF, Testori A, Grob JJ, et al.. Ipilimumab plus dacarbazine for previously untreated metastatic melanoma. N Engl J Med 2011; 364:2517-26; PMID:21639810; https://doi.org/ 10.1056/NEJMoa1104621 [DOI] [PubMed] [Google Scholar]
- 61.Robert L, Tsoi J, Wang X, Emerson R, Homet B, Chodon T, Mok S, Huang RR, Cochran AJ, Comin-Anduix B, et al.. CTLA4 blockade broadens the peripheral T-cell receptor repertoire. Clin Cancer Res 2014; 20:2424-32; PMID:24583799; https://doi.org/ 10.1158/1078-0432.CCR-13-2648 [DOI] [PMC free article] [PubMed] [Google Scholar]
- 62.Yuan J, Ginsberg B, Page D, Li Y, Rasalan T, Gallardo HF, Xu Y, Adams S, Bhardwaj N, Busam K, et al.. CTLA-4 blockade increases antigen-specific CD8(+) T cells in prevaccinated patients with melanoma: Three cases. Cancer Immunol Immunother 2011; 60:1137-46; PMID:21465316; https://doi.org/ 10.1007/s00262-011-1011-9 [DOI] [PMC free article] [PubMed] [Google Scholar]
- 63.Robert C, Long GV, Brady B, Dutriaux C, Maio M, Mortier L, Hassel JC, Rutkowski P, McNeil C, Kalinka-Warzocha E, et al.. Nivolumab in previously untreated melanoma without BRAF mutation. N Engl J Med 2015; 372:320-30; PMID:25399552; https://doi.org/ 10.1056/NEJMoa1412082 [DOI] [PubMed] [Google Scholar]
- 64.Robert C, Schachter J, Long GV, Arance A, Grob JJ, Mortier L, Daud A, Carlino MS, McNeil C, Lotem M, et al.. Pembrolizumab versus ipilimumab in advanced melanoma. N Engl J Med 2015; 372:2521-32; PMID:25891173; https://doi.org/ 10.1056/NEJMoa1503093 [DOI] [PubMed] [Google Scholar]
- 65.Muntasell A, Vilches C, Angulo A, Lopez-Botet M. Adaptive reconfiguration of the human NK-cell compartment in response to cytomegalovirus: A different perspective of the host-pathogen interaction. Eur J Immunol 2013; 43:1133-41; PMID:23552990; https://doi.org/ 10.1002/eji.201243117 [DOI] [PubMed] [Google Scholar]
- 66.Dominguez-Valentin M, Gras Navarro A, Rahman AM, Kumar S, Retière C, Ulvestad E, Kristensen V, Lund-Johansen M, Lie BA, Enger PØ, et al.. Identification of a natural killer cell receptor allele that prolongs survival of cytomegalovirus-positive glioblastoma patients. Cancer Res 2016; 76(18):5326-36; PMID:27406829; https://doi.org/ 10.1158/0008-5472.CAN-16-1162 [DOI] [PubMed] [Google Scholar]
- 67.Lopez-Verges S, Milush JM, Pandey S, York VA, Arakawa-Hoyt J, Pircher H, Norris PJ, Nixon DF, Lanier LL. CD57 defines a functionally distinct population of mature NK cells in the human CD56dimCD16+ NK-cell subset. Blood 2010; 116:3865-74; PMID:20733159; https://doi.org/ 10.1182/blood-2010-04-282301 [DOI] [PMC free article] [PubMed] [Google Scholar]
- 68.Rahbar A, Orrego A, Peredo I, Dzabic M, Wolmer-Solberg N, Strååt K, Stragliotto G, Söderberg-Nauclér C. Human cytomegalovirus infection levels in glioblastoma multiforme are of prognostic value for survival. J Clin Virol 2013; 57:36-42; PMID:23391370; https://doi.org/ 10.1016/j.jcv.2012.12.018 [DOI] [PubMed] [Google Scholar]
- 69.Griscelli F, Barrois M, Chauvin S, Lastere S, Bellet D, Bourhis JH. Quantification of human cytomegalovirus DNA in bone marrow transplant recipients by real-time PCR. J Clin Microbiol 2001; 39:4362-9; PMID:11724846; https://doi.org/ 10.1128/JCM.39.12.4362-4369.2001 [DOI] [PMC free article] [PubMed] [Google Scholar]
- 70.Habbal W, Monem F, Gartner BC. Comparative evaluation of published cytomegalovirus primers for rapid real-time PCR: Which are the most sensitive? J Med Microbiol 2009; 58:878-83; PMID:19502375; https://doi.org/ 10.1099/jmm.0.010587-0 [DOI] [PubMed] [Google Scholar]
- 71.Wada K, Kubota N, Ito Y, Yagasaki H, Kato K, Yoshikawa T, Ono Y, Ando H, Fujimoto Y, Kiuchi T, et al.. Simultaneous quantification of Epstein-Barr virus, cytomegalovirus, and human herpesvirus 6 DNA in samples from transplant recipients by multiplex real-time PCR assay. J Clin Microbiol 2007; 45:1426-32; PMID:17376882; https://doi.org/ 10.1128/JCM.01515-06 [DOI] [PMC free article] [PubMed] [Google Scholar]
- 72.Edvardsen K, Hellesen A, Husebye ES, Bratland E. Analysis of cellular and humoral immune responses against cytomegalovirus in patients with autoimmune Addison's disease. J Transl Med 2016; 14:68; PMID:26956521; https://doi.org/ 10.1186/s12967-016-0822-z [DOI] [PMC free article] [PubMed] [Google Scholar]
Associated Data
This section collects any data citations, data availability statements, or supplementary materials included in this article.