

Summary
The nitrate () transporter has been selected as an important gene maker in the process of environmental adoption in rice cultivars. In this work, we transferred another native OsNAR2.1 promoter with driving OsNAR2.1 gene into rice plants. The transgenic lines with exogenous
pOsNAR2.1:OsNAR2.1 constructs showed enhanced OsNAR2.1 expression level, compared with wild type (WT), and 15N influx in roots increased 21%–32% in response to 0.2 mm and 2.5 mm
 and 1.25 mm
15
NH
4
15
NO
3. Under these three N conditions, the biomass of the
pOsNAR2.1:OsNAR2.1 transgenic lines increased 143%, 129% and 51%, and total N content increased 161%, 242% and 69%, respectively, compared to WT. Furthermore in field experiments we found the grain yield, agricultural nitrogen use efficiency (ANUE), and dry matter transfer of
pOsNAR2.1:OsNAR2.1 plants increased by about 21%, 22% and 21%, compared to WT. We also compared the phenotypes of
pOsNAR2.1:OsNAR2.1 and
pOsNAR2.1:OsNRT2.1 transgenic lines in the field, found that postanthesis N uptake differed significantly between them, and in comparison with the WT. Postanthesis N uptake (PANU) increased approximately 39% and 85%, in the
pOsNAR2.1:OsNAR2.1 and
pOsNAR2.1:OsNRT2.1 transgenic lines, respectively, possibly because OsNRT2.1 expression was less in the
pOsNAR2.1:OsNAR2.1 lines than in the
pOsNAR2.1:OsNRT2.1 lines during the late growth stage. These results show that rice NO
3
– uptake, yield and NUE were improved by increased OsNAR2.1 expression via its native promoter.
and 1.25 mm
15
NH
4
15
NO
3. Under these three N conditions, the biomass of the
pOsNAR2.1:OsNAR2.1 transgenic lines increased 143%, 129% and 51%, and total N content increased 161%, 242% and 69%, respectively, compared to WT. Furthermore in field experiments we found the grain yield, agricultural nitrogen use efficiency (ANUE), and dry matter transfer of
pOsNAR2.1:OsNAR2.1 plants increased by about 21%, 22% and 21%, compared to WT. We also compared the phenotypes of
pOsNAR2.1:OsNAR2.1 and
pOsNAR2.1:OsNRT2.1 transgenic lines in the field, found that postanthesis N uptake differed significantly between them, and in comparison with the WT. Postanthesis N uptake (PANU) increased approximately 39% and 85%, in the
pOsNAR2.1:OsNAR2.1 and
pOsNAR2.1:OsNRT2.1 transgenic lines, respectively, possibly because OsNRT2.1 expression was less in the
pOsNAR2.1:OsNAR2.1 lines than in the
pOsNAR2.1:OsNRT2.1 lines during the late growth stage. These results show that rice NO
3
– uptake, yield and NUE were improved by increased OsNAR2.1 expression via its native promoter.
Keywords: OsNAR2.1 promoter, OsNAR2.1, Oryza sativa, Nitrogen uptake efficiency
Introduction
Nitrogen (N) is an essential macronutrient for plant growth and crop productivity. is the main inorganic N nutrient for plants in aerobic uplands, and is the main form in anaerobic paddy fields (Foyer et al., 1998; Scheible et al., 2004; Stitt, 1999). In upland cultivation system, is readily dissolved in soil water and very mobile in soil and therefore it was very easily lost into environment (Jin et al., 2015; Zarabi and Jalali, 2012). is acquired by roots through transporters and then transported throughout the plant, or it can be assimilated with carbon into amino acids before being redistributed (Katayama et al., 2009; Miller et al., 2007; Xu et al., 2012). In plants, seed dormancy can be broken by as a signalling molecule (Alboresi et al., 2005; Matakiadis et al., 2009), regulating lateral root development (Zhang and Forde, 1998; Zhang et al., 1999) and leaf growth (Hsu and Tsay, 2013; Rahayu et al., 2005), integrating the expression of nitrate‐induced genes for growth and development (Dechorgnat et al., 2012; Ho and Tsay, 2010; Huang et al., 2015; O'Brien et al., 2016; Wang et al., 2012) and altering flowering time (Castro Marin et al., 2011).
As for adapting to the low and high concentrations in soil, the plants have developed two different absorption systems (Léran et al., 2014; Miller et al., 2007; Siddiqi et al., 1990), including the low affinity system (LATS) and high affinity system (HATS) (Crawford and Glass, 1998). As we know the NPF (NRT1/PTR) and NRT2 families contribute to LATS and HATS responding the uptake and translocation in plants (Fan et al., 2005; Léran et al., 2014; Miller et al., 2007; Orsel et al., 2006; Szczerba et al., 2006).
Some NRT2 family members in plant are needed NAR2 partners in transporting nitrate crossing cell membrane (Galván et al., 1996; Liu et al., 2014; Okamoto et al., 2006; Orsel et al., 2006; Quesada et al., 1994; Tong et al., 2005; Zhuo et al., 1999). In Chlamydomonas reinhardtii Quesada et al. (1994) firstly found that CrNar2 and CrNar3 can restore absorption of the uptake‐defective mutants. Zhou et al. (2000) further demonstrated that CrNar2 was a partner protein of CrNRT2.1 in transporting cross the oocyte cell membrane. Okamoto et al. (2006) reported that, based on NAR2‐type gene expression, both NAR2s and NRT2s constitute the inducible HATS, but not the LATS in Arabidopsis, such as AtNRT3, although the protein had no known transport activity. Yong et al. (2010) reported that in vivo NAR2.1 and NRT2.1 forming a complex on plasma membrane and played the role in absorbing low concentration of nitrate in Arabidopsis roots. Orsel et al. (2006) used oocyte expression and yeast split‐ubiquitin systems to show that AtNAR2.1 and AtNRT2.1 are partners in a two‐component HATS.
Two‐component NRT2‐NAR2 system also exists in rice transport process. Feng et al. (2011) used an oocyte expression system to show that only OsNAR2.1, but not OsNAR2.2, interacts with OsNRT2.3a or OsNRT2.1/2.2 to promote uptake. Katayama et al. (2009) reported that overexpression of OsNRT2.1 improved the growth of rice seedlings, but did not increase nitrogen uptake. Tang et al. (2012) showed that rice OsNRT2.3a gene is involved in root transport of to shoots. The OsNRT2.3a or OsNRT2.1/2.2 and OsNAR2.1 interaction at the protein level was demonstrated using bimolecular fluorescence complementation, the yeast two‐hybrid system and Western blot analysis (Liu et al., 2014; Yan et al., 2011). Furthermore Yan et al. (2011) also reported that knockdown of OsNAR2.1 by RNA interference (RNAi) can suppress expression of OsNRT2.3a, OsNRT2.2 and OsNRT2.1 in mutants roots and demonstrated that OsNAR2.1 does a key function in both high and low uptake.
Chen et al. (2016) showed that using OsNAR2.1 promoter instead of ubiquitin promoter driving OsNRT2.1 can improve the ANUE and yield in rice. In this study, we created new construct of OsNAR2.1 promoter to drive the open reading frame (ORF) of the OsNAR2.1, investigated the transformation effects of pOsNAR2.1:OsNAR2.1 on rice uptake, yield and NUE and also presented many different characteristics of pOsNAR2.1:OsNAR2.1 from pOsNAR2.1:OsNRT2.1 transgenic plants.
Results
Generation of transgenic rice expressing pOsNAR2.1:OsNAR2.1
We used the Agrobacterium tumefaciens‐mediated method to introduce the pOsNAR2.1:OsNAR2.1 expression construct (Figure S1) into Wuyunjing 7 (O. sativa L. ssp. Japonica cv., the wild type for this experiment, WT), a high yield rice cultivar used in Jiangsu, China. We obtained 10 lines with increased the expression of OsNAR2.1 (Figure S2a) and analysed biomass and yield of the transgenic plants in the T1 generation. Compared to WT, biomass and yield of the 10 lines of T1 generation increased by approximately 13% and 20%, respectively (Figure S2b). Based on a Southern blot analysis of T2 generation and the data of RNA expression for the T1 and T2 generations (Figures 1c, S2a and 1b), we selected three independent lines of pOsNAR2.1:OsNAR2.1 designated Ox1, Ox2 and Ox3 (Figure 1a).
Figure 1.
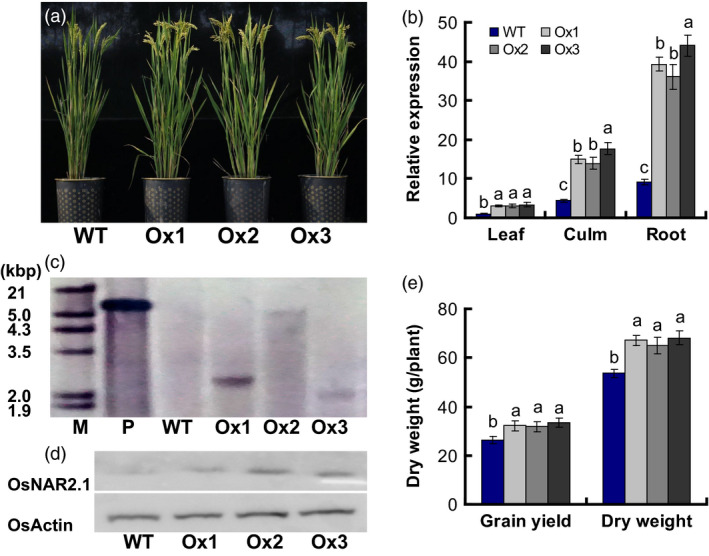
Characterization of pOsNAR2.1:OsNAR2.1 transgenic lines. (a) Phenotype of wild‐type and pOsNAR2.1:OsNAR2.1 transgenic plants (Ox1, Ox2 and Ox3). (b) qRT‐PCR analysis the expression of OsNAR2.1. RNA was extracted from root, culm and Leaf blade I. Error bars: SE (n = 3 plants). (c) Southern blot of genomic DNA isolated from T2 generation transgenic plants and WT. Hybridization using a hygromycin gene probe. P, positive control, M, marker. (d) Western blot of total proteins from shoots of T2 generation transgenic plants and WT. Hybridization with an OsActin‐specific antibody and an OsNAR2.1‐specific antibody. Each lane was loaded with equal quantity of protein (50 μg). (e) Biomass and grain yield per plant in the field. Error bars: SE (n = 5 plants). The different letters indicate a significant difference between the transgenic line and the WT (P < 0.05, one‐way ANOVA).
The expression of OsNAR2.1 in roots was increased four‐ to fivefold in the Ox1, Ox2 and Ox3 lines. OsNAR2.1 expression increased approximately 3.5‐fold in culms and increased approximately 2.6‐fold in leaf blades of the pOsNAR2.1:OsNAR2.1 transgenic plants (Figure 1b). The Western blot showed that the protein level of OsNAR2.1 was increased in shoots of Ox1, Ox2 and Ox3 lines compared with WT (Figure 1d). The field data showed that the transgenic lines exhibited increased grain yield and dry weight, compared with the WT (Figures 1e and S2b). Field data of the T2, T3 and T4 generation lines showed that total aboveground biomass, increased by as much as 23%; yields of T3 transgenic plants grown at Sanya were enhanced by approximately 20%, and the yields of T2 and T4 plants grown at Nanjing increased by 21%–23%, relative to the WT (Table S3).
For the T4 transgenic plants at harvest, height increased 5%, total tiller number per plant increased 26%, panicle length increased approximately 12%, grain weight per panicle increased 25%, seed setting rate increased 13%, grain number per panicle increased 16%, and grain yields increased by 23% relative to the WT; however, 1000‐grain weight had no difference between WT and the transgenic lines (Table 1).
Table 1.
Comparison of agronomic traits of pOsNAR2.1:OsNAR2.1 transgenic lines
| Genotype | WT | Ox1 | Ox2 | Ox3 |
|---|---|---|---|---|
| Plant height (cm) | 83.81b | 87.74a | 87.22a | 88.15a |
| Total tiller number per plant | 20.48b | 26.78a | 25.14a | 25.46a |
| Panicle length (cm) | 13.78b | 15.67a | 15.24a | 15.56a |
| Grain number per panicle | 130.67b | 153.80a | 149.56a | 152.66a |
| Seed setting rate (%) | 72.67b | 83.04a | 80.33a | 82.45a |
| Grain weight (g/panicle) | 2.32b | 3.01a | 2.77a | 2.89a |
| 1000‐grain weight (g) | 25.79a | 25.65a | 25.87a | 25.74a |
| Grain yield (g/plant) | 26.37b | 32.14a | 31.81a | 33.38a |
Statistical analysis of data from T4 generation; n = 3 plots for each mean. The different letters indicate a significant difference between the transgenic line and the WT. (P < 0.05, one‐way ANOVA).
Effects of pOsNAR2.1:OsNAR2.1 expression on plant seedling growth and total nitrogen content
As previous data showed that knockdown of OsNAR2.1 in rice affects N uptake and growth (Yan et al., 2011). We further analysed the effect of pOsNAR2.1:OsNAR2.1 expression on plant seedling growth and nitrogen content by planting WT and transgenic rice seedlings in the solution containing 1 mm of IRRI for 2 weeks and then in 2.5 mm , 0.2 mm , 2.5 mm or 1.25 mm NH4NO3 for 3 more weeks (Figure 2a–d). While the dry weight of roots, leaf sheaths and leaves of the pOsNAR2.1:OsNAR2.1 transgenic line were not affected by growth in 2.5 mm (Figure 2e), they increased, respectively, by 152%, 149% and 151% in 0.2 mm (Figure 2f); by 124%, 181% and 95% in 2.5 mm (Figure 2g); and by 62%, 51% and 47% in 1.25 mm NH4NO3, compared with WT after harvest (Figure 2h).
Figure 2.
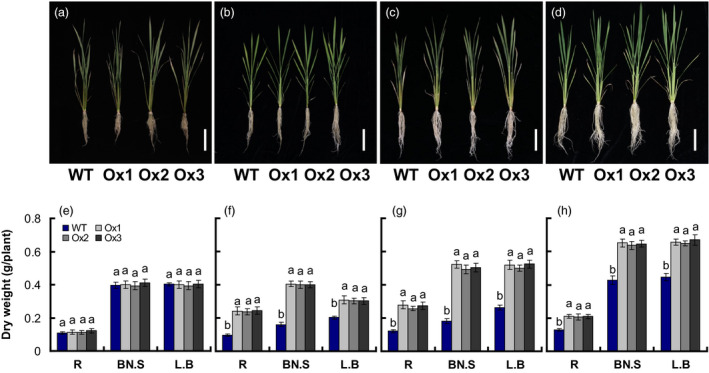
Comparison of growth of pOsNAR2.1:OsNAR2.1 transgenic lines at different nitrogen supply levels. WT and transgenic rice seedlings in the solution containing 1 mm of IRRI for 2 weeks and then in different forms of nitrogen for 3 additional weeks. Phenotype of the pOsNAR2.1:OsNAR2.1 lines (Ox1, Ox2 and Ox3) grown with (a) 2.5 mm , (b) 0.2 mm , (c) 2.5 mm and (d) 1.25 mm NH 4 NO 3; bar = 10 mm; dry weight of seedlings treated with (e) 2.5 mm , (f) 0.2 mm , (g) 2.5 mm and (h) 1.25 mm NH 4 NO 3. L.B, leaf blade; BN.S, basal node and sheath; R, root. Error bars: SE (n = 4 plants). The different letters indicate a significant difference between the transgenic line and the WT (P < 0.05, one‐way ANOVA).
Total N concentrations of roots, leaf sheaths and leaves in pOsNAR2.1:OsNAR2.1 were not affected by 2.5 mm (Figure 3a), but were increased by 19%, 10% and 14%, in 0.2 mm (Figure 3b); by 62%, 25% and 60% in 2.5 mm (Figure 3c); and by 15%, 15% and 8% in 1.25 mm NH4NO3 (Figure 3d), respectively. Total N contents of roots, leaf sheaths and leaves in pOsNAR2.1:OsNAR2.1 were not affected by 2.5 mm (Figure 3e), but were increased by 199%, 174% and 72%, in 0.2 mm (Figure 3f); by 263%, 251% and 212% in 2.5 mm (Figure 3g); and by 87%, 74 and 60% in 1.25 mm NH4NO3, compared with WT (Figure 3h), respectively.
Figure 3.
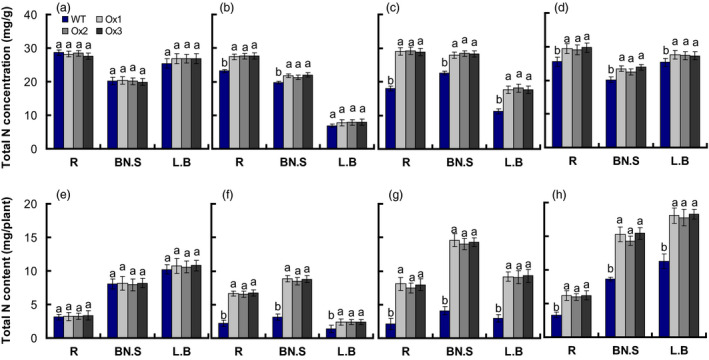
Comparison of total nitrogen concentration and total nitrogen content of pOsNAR2.1:OsNAR2.1 transgenic plants at different nitrogen supply levels. WT and transgenic rice seedlings in the solution containing 1 mm of IRRI for 2 weeks, and in different forms of nitrogen for 3 additional weeks. Total nitrogen concentration of seedlings treated with (a) 2.5 mm , (b) 0.2 mm , (c) 2.5 mm and (d) 1.25 mm NH 4 NO 3; Total N content of seedlings grown with (e) 2.5 mm , (f) 0.2 mm , (g) 2.5 mm and (h) 1.25 mm NH 4 NO 3. L.B, leaf blade; BN.S, basal node and sheath; R, root. Error bars: SE (n = 4 plants). The different letters indicate a significant difference between the transgenic line and the WT (P < 0.05, one‐way ANOVA).
Yan et al. (2011) reported that OsNAR2.1 RNAi affects the expression of interacting proteins with the OsNAR2.1 including OsNRT2.1, OsNRT2.2 and OsNRT2.3a genes. We further analysed whether OsNAR2.1 and OsNRT2s expression in transgenic rice roots was altered at differing N supply rates. Transcription of OsNRT2.3a, OsNRT2.2 and OsNRT2.1 in transgenic plant roots was not affected by growth in 2.5 mm (Figure 4a); but was increased, respectively, by 117, 121 and 129% in 0.2 mm (Figure 4b); by 105%, 118% and 110%, in 2.5 mm (Figure 4c); and by 76%, 68% and 73% in 1.25 mm NH4NO3 (Figure 4d), compared with WT.
Figure 4.
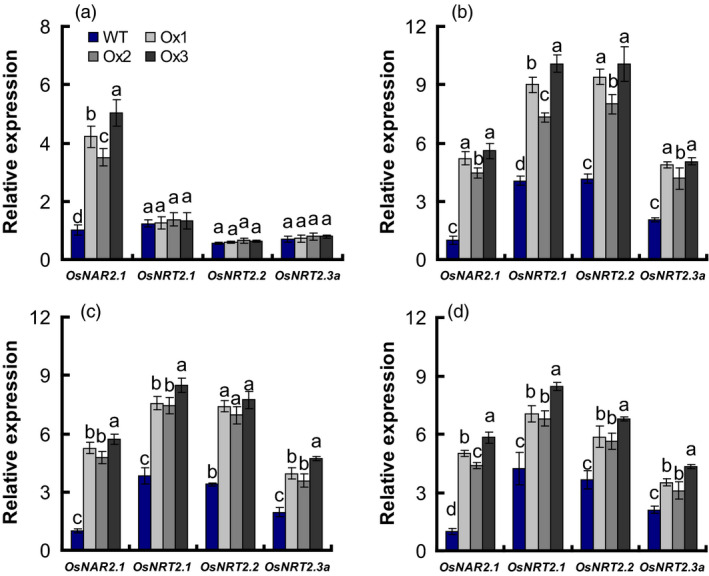
The expression of OsNRT2s and OsNAR2.1 in pOsNAR2.1:OsNAR2.1 transgenic lines. Extraction of total RNA from roots of WT and transgenic lines as showing in Figure 2 and qRT‐PCR result under (a) 2.5 mm , (b) 0.2 mm , (c) 2.5 mm and (d) 1.25 mm NH 4 NO 3 conditions. Error bars: SE (n = 3 plants). The different letters indicate a significant difference between the transgenic line and the WT (P < 0.05, one‐way ANOVA).
Rates of and influx in WT and transgenic plants
We analysed short‐term and uptake in same‐size seedlings of the pOsNAR2.1:OsNAR2.1 transgenic lines and WT by exposing the plants to 2.5 mm
 , 0.2 mm
 , 2.5 mm
 , 1.25 mm
15NH4
15NO3, 1.25 mm
15NH4NO3 or 1.25 mm NH4
15NO3 for 5 min to determine the effect of pOsNAR2.1:OsNAR2.1 expression on root and influx into intact plants. The influx rate of
, 1.25 mm
15NH4
15NO3, 1.25 mm
15NH4NO3 or 1.25 mm NH4
15NO3 for 5 min to determine the effect of pOsNAR2.1:OsNAR2.1 expression on root and influx into intact plants. The influx rate of  in the Ox1, Ox2 and Ox3 transgenic lines did not change compared with that of WT (Figure 5a); however, the influx rate of
  increased 32% and 26% in response to 0.2 mm
 and 2.5 mm
 , respectively, in the pOsNAR2.1:OsNAR2.1 transgenic lines (Figure 5b, c). The influx rate of 15NH4
15NO3 in the transgenic lines increased about 20% in 1.25 mm
15NH4
15NO3 (Figure 5d), and the influx rates of
, respectively, in the pOsNAR2.1:OsNAR2.1 transgenic lines (Figure 5b, c). The influx rate of 15NH4
15NO3 in the transgenic lines increased about 20% in 1.25 mm
15NH4
15NO3 (Figure 5d), and the influx rates of  and
and  increased by 21% and 22% in 1.25 mm
15NH4NO3 and 1.25 mm NH4
15NO3, respectively (Figure S3a, b). The ratio of
increased by 21% and 22% in 1.25 mm
15NH4NO3 and 1.25 mm NH4
15NO3, respectively (Figure S3a, b). The ratio of  to
to  influx in pOsNAR2.1:OsNAR2.1 transgenic and WT plants did not differ in response to 1.25 mm
15NH4NO3 and 1.25 mm NH4
15NO3 (Figure S3c).
influx in pOsNAR2.1:OsNAR2.1 transgenic and WT plants did not differ in response to 1.25 mm
15NH4NO3 and 1.25 mm NH4
15NO3 (Figure S3c).
Figure 5.
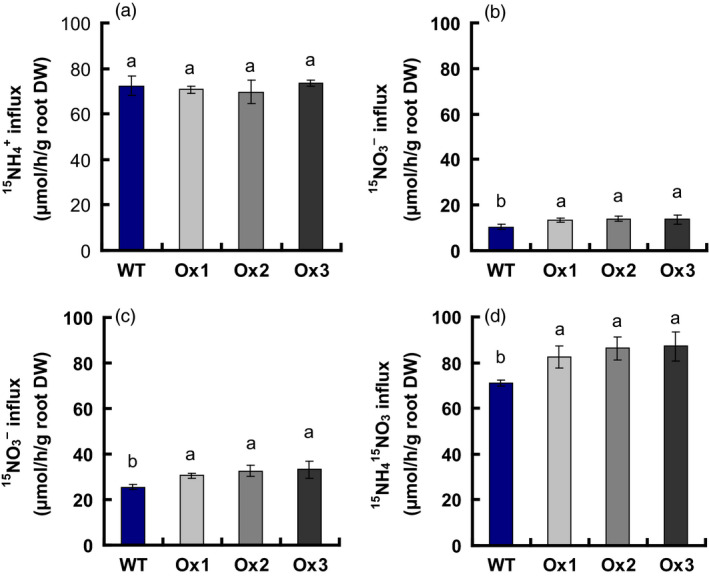
and influx rates of
pOsNAR2.1:OsNAR2.1 transgenic lines measured using 15N‐enriched sources. WT and transgenic seedlings were grown in 1 mm
for 3 weeks and nitrogen starved for 1 week. 15N influx rates were then measured at (a) 2.5 mm
 , (b) 0.2 mm
15
NO
3
–, (c) 2.5 mm
15
NO
3
– and (d) 1.25 mm
15
NH
4
15
NO
3 during 5 min. DW, dry weight. Error bars: SE (n = 4 plants). The different letters indicate a significant difference between the transgenic line and the WT (P < 0.05, one‐way ANOVA).
, (b) 0.2 mm
15
NO
3
–, (c) 2.5 mm
15
NO
3
– and (d) 1.25 mm
15
NH
4
15
NO
3 during 5 min. DW, dry weight. Error bars: SE (n = 4 plants). The different letters indicate a significant difference between the transgenic line and the WT (P < 0.05, one‐way ANOVA).
Translocation of dry matter and nitrogen in WT and transgenic plants
Methods to measure NUE usually depend on calculating plant biomass production per unit of applied N, regardless of the crop and whether the root, leaf, fruit, or seed is measured, the transfer of N to plant organs and yield is known as “nutrient utilization efficiency” (Good et al., 2004; Xu et al., 2012). We analysed the dry matter, total nitrogen concentration and the total nitrogen content of the T4 generation of the pOsNAR2.1:OsNAR2.1 transgenic lines in the anthesis and maturity stages. The result showed that the biomass of panicles, leaves and culms in the transgenic lines increased 26%, 20% and 28%, respectively, in the anthesis stage (Figure 6b), and increased 23%, 29% and 25% in the maturity stage compared to those of WT (Figure 6c). Total nitrogen concentration in leaves of the transgenic lines increased approximately 10% in the anthesis stage, but did not change in panicles or culms compared to those of WT. Total nitrogen concentration of panicles, leaves and culms was not different at the maturity stage compared to that in WT (Figure 6e); total nitrogen content of panicles, leaves and culms in the transgenic lines increased by approximately 34%, 33% and 33%, respectively, during the anthesis stage (Figure 6f), and by 35%, 33% and 34% in the maturity stage, respectively, compared to those in the WT (Figure 6f).
Figure 6.
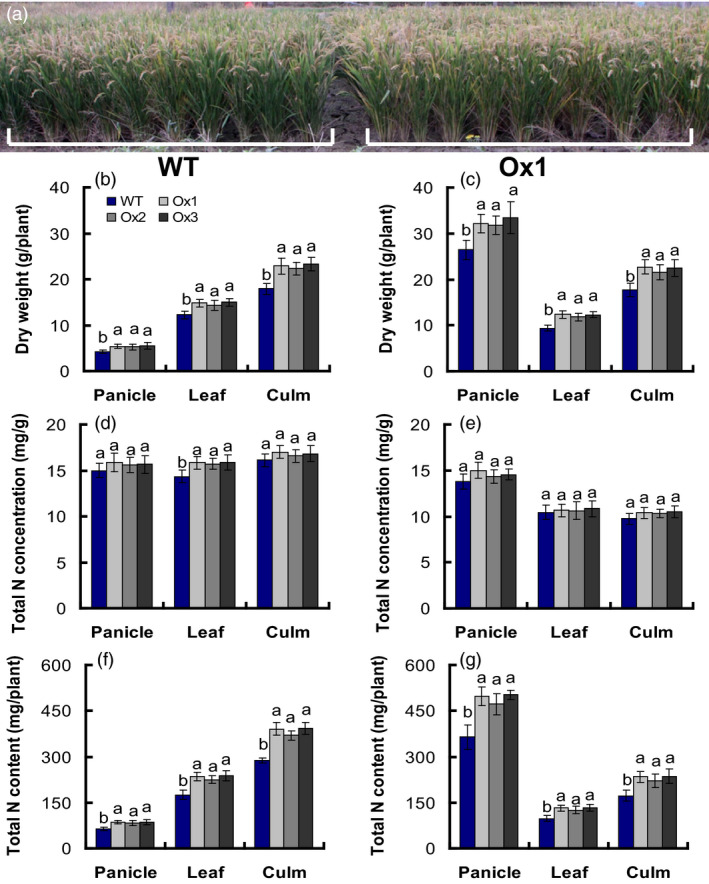
Biomass and nitrogen content in different parts of pOsNAR2.1:OsNAR2.1 transgenic lines at the anthesis stage and maturity stage. (a) Photograph of WT and T4 generation Ox1 in the field experiment. Biomass in various parts of WT and T4 generation transgenic plants at (b) the anthesis stage and (c) maturity stage. Nitrogen concentration in different parts of transgenic lines and WT at the (d) anthesis stage and (e) maturity stage. Nitrogen content in different parts of transgenic lines and WT at the (f) anthesis stage and (g) maturity stage. Error bars: SE (n = 5 plants). The different letters indicate a significant difference between the transgenic line and the WT (P < 0.05, one‐way ANOVA).
We calculated nitrogen and dry matter translocation in plants by determining dry matter at maturity (DMM), dry matter at anthesis (DMA), grain yield (GY), total nitrogen accumulation at maturity (TNAM), grain nitrogen accumulation at maturity (GNAM) and total nitrogen accumulation at anthesis (TNAA). Compared to the WT, DMA, DMM, GY, TNAA, TNAM and GNAM increased by approximately 25%, 25%, 24%, 33%, 34% and 35%, respectively, in pOsNAR2.1:OsNAR2.1 transgenic plants (Table 2).
Table 2.
Biomass and nitrogen content of pOsNAR2.1:OsNAR2.1 transgenic lines
| Dry matter and nitrogen components: | WT | Ox1 | Ox2 | Ox3 |
|---|---|---|---|---|
| DMA (kg/m2) | 0.86b | 1.08a | 1.05a | 1.09a |
| DMM (kg/m2) | 1.34b | 1.68a | 1.63a | 1.70a |
| GY (kg/m2) | 0.66b | 0.81a | 0.80a | 0.84a |
| TNAA (g/m2) | 13.17b | 17.76a | 16.90a | 17.90a |
| TNAM (g/m2) | 15.87b | 21.61a | 20.46a | 21.74a |
| GNAM (g/m2) | 9.11b | 12.44a | 11.79a | 12.55a |
Statistical analysis of data from T4 generation; n = 3 plots for each mean. The different letters indicate a significant difference between the transgenic line and the WT (P < 0.05, one‐way ANOVA).
We also calculated the harvest index (HI), dry matter translocation (DMT), dry matter translocation efficiency (DMTE) and the contribution of pre‐anthesis assimilates to grain yield (CPAY), based on a method described by Chen et al. (2016). DMT increased by approximately 21%, whereas DMTE, CPAY and HI had no difference in pOsNAR2.1:OsNAR2.1 transgenic plants from WT (Table 3). We investigated nitrogen translocation (NT), contribution of pre‐anthesis nitrogen to grain nitrogen accumulation (CPNGN) and NT efficiency (NTE), based on a method described by Chen et al. (2016). NTE and CPNGN did not differ pOsNAR2.1:OsNAR2.1 transgenic plants from WT, whereas NT increased by approximately 33%, relative to that in WT (Table 3).
Table 3.
DMT and NT of the pOsNAR2.1:OsNAR2.1 transgenic lines
| WT | Ox1 | Ox2 | Ox3 | |
|---|---|---|---|---|
| PNUE (g/g) | 51.77a | 50.16a | 51.71a | 52.15a |
| NHI (%) | 57.36a | 57.58a | 57.62a | 57.70a |
| DMT (g/m2) | 182.32b | 223.39a | 213.80a | 226.97a |
| DMTE (%) | 21.20a | 18.86a | 20.43a | 20.74a |
| CPAGY (%) | 27.62a | 27.34a | 26.89a | 27.18a |
| HI (%) | 49.35a | 48.84a | 48.85a | 49.05a |
| NT (g/m2) | 6.40b | 8.59a | 8.23a | 8.69a |
| NTE (%) | 48.61a | 48.39a | 48.70a | 48.57a |
| CPNGN (%) | 70.32a | 69.38a | 69.82a | 69.24a |
PNUE (kg/kg) = (GY – GY of zero‐N plot)/TNAM; NHI (%) = (GNAM/TNAM) × 100%; DMT (kg/ha) = DMA – (DMM – GY); DMTE (%) = (DMT/DMA) × 100%; CPAY (%) = (DMT/GY) × 100%; HI (%) = (GY/DMM) × 100%; NT (kg/ha) = TNAA – (TNAM – GNAM); NTE (%) = (NT/TNAA) × 100%; CPNGN (%) = (NT/GNAM) × 100%. Statistical analysis of data from T4 generation; n = 3 plots for each mean. The different letters indicate a significant difference between the transgenic line and the WT (P < 0.05, one‐way ANOVA).
NUE of pOsNAR2.1:OsNAR2.1 transgenic lines
NUE is inherently compound and can be further defined with component parts, including NUpE, NUtE, ANR, AE NTE, NRE (Xu et al., 2012). Because both yield and biomass were increased in the pOsNAR2.1:OsNAR2.1 transgenic lines, in the meanwhile, we also investigated ANUE in transgenic plants of T2–T4 generations, and nitrogen recovery efficiency (NRE), PANU, nitrogen harvest index (NHI), and physiological nitrogen use efficiency (PNUE) traits in the T4 transgenic plants to determine whether nitrogen use was changed in these lines, using the method described by Chen et al. (2016). Compared to WT, the ANUE of the pOsNAR2.1:OsNAR2.1 transgenic lines was enhanced by approximately 22% in T3 generation grown at Sanya under the tropical climate condition and by 21%–24% in the T2 and T4 plants grown at Nanjing under semi‐tropical condition (Table S3, Figure 7a). NRE and PANU increased approximately 125% and 39% in the T4 generations, compared to those in WT (Figure 7b, c), but PNUE and NHI values had no different between those and WT (Table 3).
Figure 7.
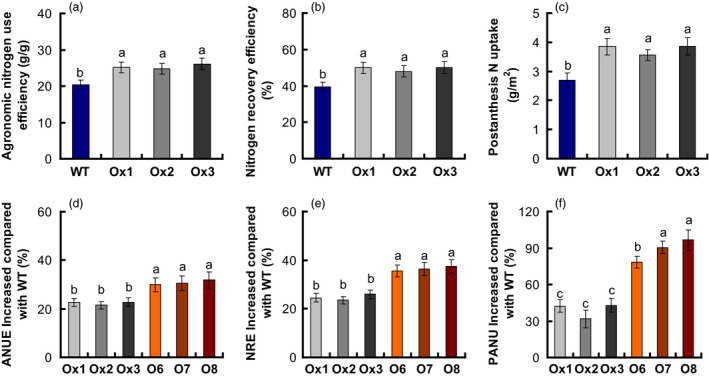
Increased nitrogen use efficiency (NUE) in pOsNAR2.1:OsNAR2.1 and pOsNAR2.1:OsNRT2.1 transgenic plants relative to wild type. Comparison of (a) agronomic nitrogen use efficiency (ANUE), (b) nitrogen recovery efficiency (NRE) and (c) postanthesis N uptake (PANU) between pOsNAR2.1:OsNAR2.1 transgenic lines and wild type. Enhanced percentage of (d) ANUE, (e) NRE and (f) PANU of pOsNAR2.1:OsNAR2.1 and pOsNAR2.1:OsNRT2.1 relative to wild type. n = 3 plots for each mean. The different letters indicate a significant difference between the transgenic line and the WT (P < 0.05, one‐way ANOVA).
Comparison between NUEs in pOsNAR2.1:OsNAR2.1 and pOsNAR2.1:OsNRT2.1 transgenic plants
In the field, PNUE, NHI, DMTE, CPAY, HI and NTE values of pOsNAR2.1:OsNAR2.1 and pOsNAR2.1:OsNRT2.1 transgenic lines were the same as those of WT plants (Table S4). Compared to WT, ANUE increased approximately 22% and 31%, in the pOsNAR2.1:OsNAR2.1 and pOsNAR2.1:OsNRT2.1 transgenic lines, respectively. NRE increased approximately 25% and 36%, and PANU increased approximately 39 and 85% (Figure 7d–f). The CPNGN of pOsNAR2.1:OsNAR2.1 transgenic lines showed no difference compared with WT, but the CPNGN decreased about 15% in pOsNAR2.1:OsNRT2.1 lines (Table S4).
The expression of OsNRT2.1 and OsNAR2.1 in transgenic lines
The expression levels of OsNRT2.1 and OsNAR2.1 in culms were significantly increased in all transgenic lines, compared to the WT plants (Figure 8a, b). The expression of OsNRT2.1 was about 32% and 38% higher in the pOsNAR2.1:OsNAR2.1 and pOsNAR2.1:OsNRT2.1 lines than in WT (Figure 8a). The expression of OsNAR2.1 was 4.1–6.4‐fold higher in the pOsNAR2.1:OsNAR2.1 lines than in WT and 2.3–3.6‐fold higher in the pOsNAR2.1:OsNRT2.1 lines than in WT (Figure 8b). And the expression of OsNRT2.1 showed no difference between the pOsNAR2.1:OsNAR2.1 and pOsNAR2.1:OsNRT2.1 lines throughout the experimental growth period, except at 75 days (Figure 8a). The expression of OsNAR2.1 was significantly higher in the culms of the pOsNAR2.1:OsNAR2.1 lines than of the pOsNAR2.1:OsNRT2.1 lines (Figure 8b).
Figure 8.
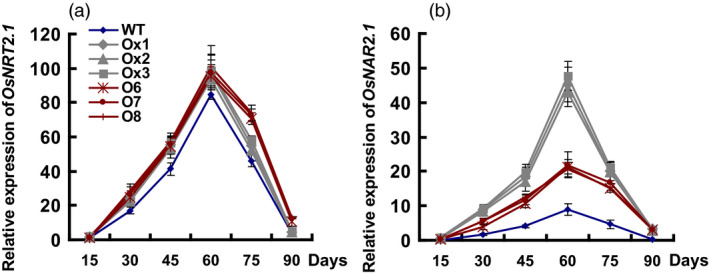
Expression of OsNRT2.1 and OsNAR2.1 in transgenic lines and wild type during the experimental growth period. RNA Samples of T4 generation plant culms were collected every 15 days, from the beginning of rice transplant to mature stage. Error bars: SE (n = 3 plants). D in x‐axis means the day after transplanting.
We also calculated the expression ratio of OsNRT2.1 and OsNAR2.1 in different plants, which was approximately 2.2:1 in the pOsNAR2.1:OsNAR2.1 lines, 4.6:1 in the pOsNAR2.1:OsNRT2.1 lines and 10.6:1 in WT (Figure S4).
Discussion
All levels of plant function were affected by nitrogen nutrition, from metabolism to growth, development and resource allocation (Crawford, 1995; Scheible et al., 1997). is a main available form of nitrogen for plants and is absorbed in the roots by active transport processes and passive transport ion channels, stored in vacuoles of rice shoots (Fan et al., 2007; Kucera, 2003; Li et al., 2008; Pouliquin et al., 2000). OsNRT2.1/2 and OsNRT2.3a need to be combined with OsNAR2.1 protein for uptake and transport of in rice (Liu et al., 2014; Tang et al., 2012; Yan et al., 2011). The expression of OsNAR2.1 is up‐regulated by and down‐regulated by (Feng et al., 2011; Yan et al., 2011).
Feng et al. (2011) reported that the native OsNAR2.1 promoter has strong activities in roots and basal nodes in seedlings. In this study, OsNAR2.1 expression was up‐regulated significantly in both roots and shoots of pOsNAR2.1:OsNAR2.1 transgenic lines (Figure 1b). Previous report had addressed the OsNAR2.1 promoter induction by in rice based on GUS fusion data (Feng et al., 2011); Yan et al. (2011) reported the effect of rice seedling stage and nitrogen uptake on growth after OsNAR2.1 knockdown; moreover Chen et al. (2016) reported the gain function of pOsNAR2.1:OsNRT2.1 expression on rice growth and nitrogen use. Here, we focused on nitrogen uptake and growth at the seedling stage, field yield and NUE in pOsNAR2.1:OsNAR2.1 transgenic lines.
pOsNAR2.1:OsNAR2.1 expression increases uptake of transgenic rice plants
Feng et al. (2011) had proved that OsNAR2.1 interacts with OsNRT2.3a and OsNRT2.1/2.2 in an oocyte expression system to take up . The OsNAR2.1 and OsNRT2.3a or OsNRT2.1/2.2 interaction in the protein level was demonstrated using bimolecular fluorescence complementation, Western blot analysis and a yeast two‐hybrid assay (Liu et al., 2014; Yan et al., 2011). Tang et al. (2012) showed that OsNRT2.3a gene is important in root transport to shoots. Katayama et al. (2009) reported that increased OsNRT2.1 expression slightly improved the growth of rice seedling in hydroponic condition, but did not affect the nitrogen uptake. In this study, we demonstrated that OsNAR2.1 driven by the native OsNAR2.1 promoter increased uptake by rice roots.
As we know, the native OsNAR2.1 was expressed in all parts in rice plant, and mainly expressed roots and leaf sheaths (Chen et al., 2016; Feng et al., 2011; Liu et al., 2014; Yan et al., 2011), but we do not know why one more native promoter driving OsNAR2.1 can increase the expression level of OsNAR2.1 more than one time and in different organs, the increase patterns were different. The possible reason about this was that the methylation level was different in the transferred homologous exogenous promoter sequence compared with the endogenous promoter sequence (Matzke et al., 1989). However more experiments are needed for this understanding.
Rice dry weight and total nitrogen content of pOsNAR2.1:OsNAR2.1 transgenic plants differed clearly from WT plants when the plants were supplied with 1.25 mm NH4NO3, 0.2 mm
or 2.5 mm
(Figures 2 and 3). OsNRT2.3a, OsNRT2.2 and OsNRT2.1 expression which encode OsNAR2.1‐interacting proteins, increased significantly in 1.25 mm NH4NO3, 0.2 mm
and 2.5 mm
, compared with WT (Figure 4). The up‐regulated expression of OsNAR2.1 and OsNRT2.3a, OsNRT2.2 and OsNRT2.1 caused the  influx rates of pOsNAR2.1:OsNAR2.1 transgenic lines in 0.2 mm
 , 2.5 mm
 and 1.25 mm NH4
15NO3 to increase 32%, 26% and 22%, respectively (Figures 5 and S3).
and 1.25 mm NH4
15NO3 to increase 32%, 26% and 22%, respectively (Figures 5 and S3).
Enhanced uptake promotes uptake in rice
Kronzucker et al. (2000) used 13N to show that the presence of promotes uptake, accumulation and metabolism in rice. Duan et al. (2006) found that increasing uptake promotes dry weight and accumulation and assimilation of and by ‘Nanguang’, which is an N‐efficient rice cultivar, during the entire growth period. Li et al. (2006) showed that supplying and enhances OsAMT1;3, OsAMT1;2 and OsAMT1;1 expression compared with supplying only or , thereby enhancing uptake by rice.
High expression of OsNRT2.3b in rice improves the pH‐buffering capacity of the rice resulting in less 15N‐NH4 15NO3 uptake in 5‐min uptake experiment, and more 15N‐15NH4NO3 increased uptake at pH 4 and pH 6 (Fan et al., 2016).
Our results showed that the influx rates of  and
and  increased 22% and 21%, respectively, in pOsNAR2.1:OsNAR2.1 transgenic lines in 1.25 mm NH4
15NO3 or 1.25 mm
15NH4NO3 (Figure S3), and that the ratio of
increased 22% and 21%, respectively, in pOsNAR2.1:OsNAR2.1 transgenic lines in 1.25 mm NH4
15NO3 or 1.25 mm
15NH4NO3 (Figure S3), and that the ratio of  to
to  influx into pOsNAR2.1:OsNAR2.1 transgenic plants was not different from WT in 1.25 mm NH4
15NO3 or 1.25 mm
15NH4NO3 (Figure S3). Eventually, the biomass and total nitrogen content of pOsNAR2.1:OsNAR2.1 transgenic lines increased by 50.7% and 68.9% after 3 weeks in 1.25 mm NH4NO3 (Figures 2d, 2h and 3h).
influx into pOsNAR2.1:OsNAR2.1 transgenic plants was not different from WT in 1.25 mm NH4
15NO3 or 1.25 mm
15NH4NO3 (Figure S3). Eventually, the biomass and total nitrogen content of pOsNAR2.1:OsNAR2.1 transgenic lines increased by 50.7% and 68.9% after 3 weeks in 1.25 mm NH4NO3 (Figures 2d, 2h and 3h).
Exogenous of pOsNAR2.1:OsNAR2.1 transformation in rice enhances ANUE and NRE
During recent years, transporter gene as a target gene was applied in crop high NUE breeding (Fan et al., 2017). For examples, the OsNRT1.1B low‐affinity transporter can increase the indica rice NUE by approximately 30% (Hu et al., 2015). Fan et al. (2016) showed that increased OsNRT2.3b expression improved NUE and grain yield by up to 40% in Japonica cultivars. Chen et al. (2016) reported the ANUE of pOsNAR2.1:OsNRT2.1 transgenic plants increased by 28% of in the same background cultivar (Wuyunjing 7) as this experiment. Our present data show that OsNAR2.1 driven by the native OsNAR2.1 promoter can produce a relatively higher yield and ANUE in rice plants (Figure 7, Figure S2b and Table S3).
Nitrogen redistribution can be altered by the expression change of some nitrogen use relative gene, such as the autophagy gene ATG8c (Islam et al., 2016) and also presents different patterns in different genotypes (Sanchez‐Bragado et al., 2017; Souza et al., 1998). During rice grain filling, 70‐90% of the nitrogen was re‐distributed from the vegetative organs to the panicles (Yoneyama et al., 2016). Dry matter and nitrogen content of pOsNAR2.1:OsNAR2.1 lines were more than WT plants in the anthesis and maturity stages (Figure 6). Although DMT and NT increased by approximately 21% and 33%, compared to that of WT, DMTE and NTE of pOsNAR2.1:OsNAR2.1 transgenic plants and WT were not different (Table 3), suggested that dry matter and nitrogen transfer from shoots to grains did not change significantly between pOsNAR2.1:OsNAR2.1 transgenic plants and WT; thus, the physiological NUE and NHI of pOsNAR2.1:OsNAR2.1 transgenic plants did not increase (Table 3). NRE and ANUE increased 25% and 22% due to the increase in nitrogen accumulation and grain yield, respectively, at maturity in pOsNAR2.1:OsNAR2.1 transgenic lines (Table 2; Figure 7a, b).
Comparison of growth and NUE of pOsNAR2.1:OsNRT2.1 and pOsNAR2.1:OsNAR2.1 transgenic lines
Chen et al. (2016) reported that co‐expressing OsNAR2.1 and OsNRT2.1 in pOsNAR2.1:OsNRT2.1 transgenic lines increased rice grain yield and ANUE. We also compared field growth between pOsNAR2.1:OsNRT2.1 and pOsNAR2.1:OsNAR2.1 transgenic lines. OsNAR2.1 expressed significantly higher in the culms in the pOsNAR2.1:OsNAR2.1 lines than in the pOsNAR2.1:OsNRT2.1 lines, but there was no difference in OsNRT2.1 expression between them, except at 75 days (Figure 8), which is a key period for grain filling and a critical transition period between rice vegetative and reproductive growth (Zhang et al., 2009). OsNRT2.1 expression and N uptake decreased in the pOsNAR2.1:OsNAR2.1 lines during the grain filling stage. Postanthesis N uptake decreased in the pOsNAR2.1:OsNAR2.1 lines compared with the pOsNAR2.1:OsNRT2.1 plants (Figure 7f). N for rice grain filling comes mainly from accumulation before flowering (Table S4). Although DMTE and NTE did not differ between pOsNAR2.1:OsNRT2.1 and pOsNAR2.1:OsNAR2.1 transgenic lines (Table S4), NRE and ANUE of pOsNAR2.1:OsNAR2.1 transgenic lines were significantly lower than those of pOsNAR2.1:OsNRT2.1 transgenic lines (Figure 7d, e).
Designing a genetically modified crop using tissue‐specific expression conferred by selected promoters
Although using either the ubiquitin promoter (pUbi) or OsNAR2.1 promoter (pOsNAR2.1) to drive OsNRT2.1 expression could significantly increase total biomass and grain yield compared with those in WT, ANUE was decreased 17% by pUbi:OsNRT2.1 expression and increased 28% by pOsNAR2.1:OsNRT2.1 expression (Chen et al., 2016). These opposite effects of different promoters driving OsNRT2.1 expression on ANUE were caused mainly by altered tissue localization and abundance of OsNRT2.1 transcripts which may be linked to postflowering transfer of dry matter into grains (Chen et al., 2016). Another transformation example of native promoter driving its ORF is pOsPTR9:OsPTR9 transgene in rice with improving on growth, grain yield and NUE (Fang et al., 2013). Fang et al. (2013) investigated the expression pattern of OsPTR9 and found that it is regulated by nitrogen sources and light. Although OsPTR9 does not appear to directly transport , its overexpression results in enhanced uptake, increased grain yield and promoted lateral root formation (Fang et al., 2013). These results indicate that expression of genes using specific promoters may be a good approach for plant breeding.
Several phloem transporters, such as NPF2.13, NPF1.1 and NPF1.2, are responsible for redistributing xylem‐borne into developing leaves to increase shoot growth (Fan et al., 2009; Hsu and Tsay, 2013). Therefore, selecting and applying the promoters of genes specifically expressed in senescing leaves or other source organs could be used to drive phloem‐expressed , transporters, which would decrease residual N in old vegetative organs and increase growth and NUE.
In this experiment, we demonstrated that rice uptake, yield and NUE of rice were ameliorated by increasing OsNAR2.1 expression using its native promoter.
Experimental procedures
Construction of transgenic rice with pOsNAR2.1:OsNAR2.1
The primers in Table S1 amplified the OsNAR2.1 ORF sequence from the cDNA of Oryza sativa L. ssp. Japonica cv. ‘Nipponbare’. The OsNAR2.1 promoter was amplified from the pOsNAR2.1‐(1,698 bp):GUS constructs (Feng et al., 2011). The PCR amplification products were ligated into pMD19‐T vector (TaKaRa Bio, Shiga, Japan) independently and after sequencing check we construct the pOsNAR2.1:OsNAR2.1 plasmid by subcloning. The constructed pOsNAR2.1:OsNAR2.1 vector is shown in Figure S1 and was transformed into callus of Wuyunjing 7 (O. sativa L. ssp. Japonica cv.) by Agrobacterium tumefaciens strain EHA105 (Chen et al., 2016).
qRT‐PCR and Southern blot analysis
Total RNA was extracted using TRIzol reagent (Vazyme Biotech Co., Ltd, http://www.vazyme.com). DNase I‐treated total RNAs were subjected to reverse transcription (RT) with HiScript Q RT SuperMix for qPCR (+gDNA wiper) kit (Vazyme Biotech Co.). Triplicate quantitative assays were performed using the AceQ qPCR SYBR Green Master Mix kit (Vazyme Biotech Co.) and a Step One Plus Real‐Time PCR System (Applied Biosystems, Foster City, CA). The relative quantitative calculation of real‐time PCR was described in Chen et al. (2016). The primers for PCR are shown in Table S2.
The Southern blot was carried to identify the T‐DNA insertion. The genomic DNA exaction of T2 plant shoots, DNA digestion and hybridization were followed the previous report (Chen et al., 2016)
Western blot
OsNAR2.1 antibody and Western blot process was described in Yan et al. (2011). The total protein of 10 g shoots were sampled and 50 μg of each protein was analysed in gel‐loaded buffer and boiled in 10% SDS‐PAGE. Protein transfer to PVDF membrane and incubated with OsActin (1 : 5000), or OsNAR2.1 (1 : 2000) overnight at 4 °C. The membrane was then incubated with the appropriate secondary antibody (1 : 20 000; Pierce), then carries on the chemiluminescence detection (Tang et al., 2012; Yan et al., 2011).
Field experiments for harvest yield
The rice plants of T0 to T4 generations, except T3 generation, were cultivated in plots at the Experimental Site of Nanjing Agricultural University, Nanjing, with subtropical climate from May to October in a year. For T3 generation, transgenic lines were tested in plots of Experiment Site of Sanya Nanjing Agricultural University with tropical climate from December to April. Soil properties in Nanjing field experiment were described as before (Chen et al., 2016).
T2–T4 generation pOsNAR2.1:OsNAR2.1 and wild‐type plants were planted in three plots with 300 kg N/ha and without nitrogen fertilizer as blank control. The plots were 2 × 2 m in size, and the seedlings were planted in a 10 × 10 array. During rice flowering and mature stages, we collected samples from each plot for further analysis. Random four replicates (each replicate with four individual plants) from each plot were selected within the plots free from the edges, and therefore, the data of total 16 individual plants were pulled into mean value of each plot (Chen et al., 2016).
The agronomic characters of T4 generation plant height, total tiller number per plant, grain weight per panicle, grain number per panicle, seed setting rate, panicle length, 1000‐grain weight, yield and biomass per plant were measured at the maturity stage under 300 kg N/ha N fertilizer condition.
Dry weight, total nitrogen measurement and calculation of nitrogen use efficiency
We harvested T4 generation shoot samples from the field to analyse biomass and nitrogen under 300 kg N/ha fertilizer condition according to our previous method (Chen et al., 2016) DMTE and NTE were calculated according to Chen et al. (2016). DMT (kg/ha) = DMA–(DMM–GY); CPAY (%) = (DMT/GY) × 100%; DMTE (%) = (DMT/DMA) × 100%; HI (%) = (GY/DMM) × 100%; The NUE method was used for the calculation as described by Chen et al. (2016). ANUE (kg/kg) = (GY–GY of zero‐N plot)/N supply; PNUE (kg/kg) = (GY–GY of zero‐N plot)/TNAM; NRE (%) = (TNAM–TNAM of zero‐N plot)/N supply; PANU (kg/ha) = TNAM–TNAA; NHI (%) = (GNAM/TNAM) × 100%; NT (kg/ha) = TNAA–(TNAM–GNAM); CPNGN (%) = (NT/GNAM) × 100%; NTE (%) = (NT/TNAA) × 100%.
Determination of total N content, root 15N‐ influx rate and 15N‐ influx rate in WT and transgenic seedlings
WT and transgenic rice seedlings were grown in the solution containing 1 mm in IRRI solution for 2 weeks and then transferred in different forms of nitrogen for 3 additional weeks. The nitrogen treatments in this experiment included in 2.5 mm , 0.2 mm , 2.5 mm and 1.25 mm NH4NO3. The biomass and nitrogen concentration were measured for each line (n = 4 plants) under each N treatment after 3‐week treatment.
For root 15N uptake experiment, new rice seedlings were grown in 1 mm
for 3 weeks and then were nitrogen starved for 1 week before 15N uptake. 2.5 mm
 , 0.2 mm
 , 2.5 mm
 , 1.25 mm
15NH4NO3, 1.25 mm NH4
15NO3 or 1.25 mm
15NH4
15NO3 (atom % 15N:
, 1.25 mm
15NH4NO3, 1.25 mm NH4
15NO3 or 1.25 mm
15NH4
15NO3 (atom % 15N:  , 99%;
  , 99%) was used, and the 15N influx rate was calculated following the method in Tang et al. (2012).
Statistical analysis
The single‐factor analysis of variance (ANOVA) and Tukey's test data analysis were applied in our data statistical analysis (Chen et al. (2016).
Supporting information
Figure S1 Diagram of pOsNAR2.1:OsNAR2.1 constructs. RB, right border; LB, left border; pOsNAR2.1, OsNAR2.1 promoter; 35S, cauliflower mosaic virus 35S promoter; NOS, nopaline synthase terminator.
Figure S2 Characterization of T1 generation pOsNAR2.1:OsNAR2.1 transgenic lines. (a) qRT‐PCR analysis of endogenous the expression of OsNAR2.1 in culms of wild type and pOsNAR2.1:OsNAR2.1 transgenic lines. Error bars: SE (n = 3 plants). (b) Yield and biomass per plant from wild‐type and pOsNAR2.1:OsNAR2.1 transgenic lines grown in the field. Error bars: SE (n = 5 plants).
Figure S3 Ratio of  to
to  influx in wild‐type and pOsNAR2.1:OsNAR2.1 transgenic lines in 1.25 mm NH4NO3. WT and transgenic seedlings were grown in 1 mm
for 3 weeks and nitrogen starved for 1 week.
influx in wild‐type and pOsNAR2.1:OsNAR2.1 transgenic lines in 1.25 mm NH4NO3. WT and transgenic seedlings were grown in 1 mm
for 3 weeks and nitrogen starved for 1 week.  or
or  influx was measured at (a) 1.25 mm
15NH4NO3 or (b) 1.25 mm NH4
15NO3 for 5 min. DW, dry weight. (c) The
influx was measured at (a) 1.25 mm
15NH4NO3 or (b) 1.25 mm NH4
15NO3 for 5 min. DW, dry weight. (c) The  to
to  influx ratios with 1.25 mm NH4NO3 in the roots of wild‐type and pOsNAR2.1:OsNAR2.1 lines (Ox1, Ox2, and Ox3) are presented. Error bars: SE (n = 4 plants). The different letters indicate a significant difference between the transgenic line and the WT (P < 0.05, one‐way ANOVA).
Figure S4 Expression ratios of OsNRT2.1 to OsNAR2.1 in culms of transgenic lines and wild type. The pOsNAR2.1:OsNRT2.1 lines (O6, O7 and O8), pOsNAR2.1:OsNAR2.1 lines (Ox1, Ox2, and Ox3) and wild type are presented.
Table S1 Primers for amplification OsNAR2.1 ORF.
Table S2 Primers used for qRT‐PCR.
Table S3 Comparison of dry weight, grain yield, and ANUE between the wild‐type and pOsNAR2.1:OsNAR2.1 transgenic lines in the T2–T4 generations. n = 3 plots for each mean. The different letters indicate a significant difference between the transgenic line and the WT (P < 0.05, one‐way ANOVA).
Table S4 Increased nitrogen‐use efficiency in pOsNAR2.1:OsNAR2.1 and pOsNAR2.1:OsNRT2.1 transgenic lines relative to wild type. Statistical analysis of data from T4 generation; n = 3 for each mean. The different letters indicate a significant difference between the transgenic line and the WT (P < 0.05, one‐way ANOVA).
Acknowledgements
This work was supported by China National Key Program for Research and Development (2016YFD0100700), National Natural Science Foundation (Grant 31372122), Jiangsu Science Fund for Distinguished Young Scholars (Grant BK20160030) and the Transgenic Project (Grant 2016ZX08001003‐008). The authors declare no conflict of interest.
References
- Alboresi, A. , Gestin, C. , Leydecker, M.T. , Bedu, M. , Meyer, C. and Truong, H.N. (2005) Nitrate, a signal relieving seed dormancy in Arabidopsis. Plant, Cell Environ. 28, 500–512. [DOI] [PubMed] [Google Scholar]
- Castro Marin, I. , Loef, I. , Bartetzko, L. , Searle, I. , Coupland, G. , Stitt, M. and Osuna, D. (2011) Nitrate regulates floral induction in Arabidopsis, acting independently of light, gibberellin and autonomous pathways. Planta, 233, 539–552. [DOI] [PMC free article] [PubMed] [Google Scholar]
- Chen, J. , Zhang, Y. , Tan, Y. , Zhang, M. , Zhu, L. , Xu, G. and Fan, X. (2016) Agronomic nitrogen‐use efficiency of rice can be increased by driving OsNRT2.1 expression with the OsNAR2.1 promoter. Plant Biotechnol. J. 14, 1705–1715. [DOI] [PMC free article] [PubMed] [Google Scholar]
- Crawford, N.M. (1995) Nitrate: nutrient and signal for plant growth. Plant Cell, 7, 859–868. [DOI] [PMC free article] [PubMed] [Google Scholar]
- Crawford, N.M. and Glass, A.D.M. (1998) Molecular and physiological aspects of nitrate uptake in plants. Trends Plant Sci. 3, 389–395. [Google Scholar]
- Dechorgnat, J. , Patrit, O. , Krapp, A. , Fagard, M. and Daniel‐Vedele, F. (2012) Characterization of the Nrt2.6 gene in Arabidopsis thaliana: a link with plant response to biotic and abiotic stress. PLoS ONE, 7, e42491. [DOI] [PMC free article] [PubMed] [Google Scholar]
- Duan, Y.H. , Zhang, Y.L. , Shen, Q.R. and Wang, S.W. (2006) Nitrate effect on rice growth and nitrogen absorption and assimilation at different growth stages. Pedosphere, 16, 707–717. [Google Scholar]
- Fan, X. , Shen, Q. , Ma, Z. , Zhu, H. , Yin, X. and Miller, A.J. (2005) A comparison of nitrate transport in four different rice (Oryza sativa L.) cultivars. Sci China C Life Sci. 48, 897–911. [PubMed] [Google Scholar]
- Fan, X. , Jia, L. , Li, Y. , Smith, S.J. , Miller, A.J. and Shen, Q. (2007) Comparing nitrate storage and remobilization in two rice cultivars that differ in their nitrogen use efficiency. J. Exp. Bot. 58, 1729–1740. [DOI] [PubMed] [Google Scholar]
- Fan, S.C. , Lin, C.S. , Hsu, P.K. , Lin, S.H. and Tsay, Y.F. (2009) The Arabidopsis nitrate transporter NRT1.7, expressed in phloem, is responsible for source to sink remobilization of nitrate. Plant Cell, 9, 2750–2761. [DOI] [PMC free article] [PubMed] [Google Scholar]
- Fan, X. , Tang, Z. , Tan, Y. , Zhang, Y. , Luo, B. , Yang, M. , Lian, X. et al. (2016) Over expression of a pH sensitive nitrate transporter in rice increases crop yields. Proc. Natl Acad. Sci. USA, 113, 7118–7123. [DOI] [PMC free article] [PubMed] [Google Scholar]
- Fan, X. , Naz, M. , Fan, X. , Xuan, W. , Miller, A.J. and Xu, G. (2017) Plant nitrate transporters: from gene function to application. J. Exp. Bot. doi: 10.1093/jxb/erx011 (online). [DOI] [PubMed] [Google Scholar]
- Fang, Z. , Xia, K. , Yang, X. , Grotemeyer, M.S. , Meier, S. , Rentsch, D. , Xu, X. et al. (2013) Altered expression of the PTR/NRT1 homologue OsPTR9 affects nitrogen utilization efficiency, growth and grain yield in rice. Plant Biotechnol. J. 11, 446–458. [DOI] [PubMed] [Google Scholar]
- Feng, H. , Yan, M. , Fan, X. , Li, B. , Shen, Q. , Miller, A.J. and Xu, G. (2011) Spatial expression and regulation of rice high‐affinity nitrate transporters by nitrogen and carbon status. J. Exp. Bot. 62, 2319–2332. [DOI] [PubMed] [Google Scholar]
- Foyer, C.H. , Valadier, M.H. , Migge, A. and Becker, T.W. (1998) Drought‐induced effects on nitrate reductase activity and mRNA and on the coordination of nitrogen and carbon metabolism in maize leaves. Plant Physiol. 117, 283–292. [DOI] [PMC free article] [PubMed] [Google Scholar]
- Galván, A. , Quesada, A. and Fernández, E. (1996) Nitrate and nitrate are transported by different specific transport systems and by a bispecific transporter in Chlamydomonas reinhardtii. J. Biol. Chem. 271, 2088–2092. [DOI] [PubMed] [Google Scholar]
- Good, A.G. , Shrawat, A.K. and Muench, D.G. (2004) Can less yield more? Is reducing nutrient input into the environment compatible with maintaining crop production? Trends Plant Sci. 12, 597–605. [DOI] [PubMed] [Google Scholar]
- Ho, C.H. and Tsay, Y.F. (2010) Nitrate, ammonium, and potassium sensing and signaling. Curr. Opin. Plant Biol. 13, 604–610. [DOI] [PubMed] [Google Scholar]
- Hsu, P.K. and Tsay, Y.F. (2013) Two phloem nitrate transporters, NRT1.11 and NRT1.12, are important for redistributing xylem‐borne nitrate to enhance plant growth. Plant Physiol. 163, 844–856. [DOI] [PMC free article] [PubMed] [Google Scholar]
- Hu, B. , Wang, W. , Ou, S. , Tang, J. , Li, H. , Che, R. , Zhang, Z. et al. (2015) Variation in NRT1.1B contributes to nitrate‐use divergence between rice subspecies. Nat. Genet. 47, 834–838. [DOI] [PubMed] [Google Scholar]
- Huang, S. , Chen, S. , Liang, Z. , Zhang, C. , Yan, M. , Chen, J. , Xu, G. et al. (2015) Knockdown of the partner protein OsNAR2.1 for high‐affinity nitrate transport represses lateral root formation in a nitrate‐dependent manner. Sci. Rep. 5, 18192. [DOI] [PMC free article] [PubMed] [Google Scholar]
- Islam, M.M. , Ishibashi, Y. , Nakagawa, A.C. , Tomita, Y. , Iwaya‐Inoue, M. , Arima, S. and Zheng, S.H. (2016) Nitrogen redistribution and its relationship with the expression of GmATG8c during seed filling in soybean. J. Plant Physiol. 192, 71–74. [DOI] [PubMed] [Google Scholar]
- Jin, Z. , Zhu, Y. , Li, X. , Dong, Y. and An, Z. (2015) Soil N retention and nitrate leaching in three types of dunes in the Mu Us desert of China. Sci. Rep. 5, 14222. [DOI] [PMC free article] [PubMed] [Google Scholar]
- Katayama, H. , Mori, M. , Kawamura, Y. , Tanaka, T. , Mori, M. and Hasegawa, H. (2009) Production and characterization of transgenic rice plants carrying a high‐affinity nitrate transporter gene (OsNRT2.1). Breeding Sci. 59, 237–243. [Google Scholar]
- Kronzucker, H.J. , Glass, A.D.M. , Siddiqi, M.Y. and Kirk, G.J.D. (2000) Comparative kinetic analysis of ammonium and nitrate acquisition by tropical lowland rice: implications for rice cultivation and yield potential. New Phytol. 145, 471–476. [DOI] [PubMed] [Google Scholar]
- Kucera, I. (2003) Passive penetration of nitrate through the plasma membrane of Paracoccus denitrificans and its potentiation by the lipophilic tetraphenylphosphonium cation. Biochim. Biophys. Acta, 1557, 119–124. [PubMed] [Google Scholar]
- Léran, S. , Varala, K. , Boyer, J.C. , Chiurazzi, M. , Crawford, N. , Daniel‐Vedele, F. , David, L. et al. (2014) A unified nomenclature of NITRATE TRANSPORTER 1/PEPTIDE TRANSPORTER family members in plants. Trends Plant Sci. 19, 5–9. [DOI] [PubMed] [Google Scholar]
- Li, B. , Xin, W. , Sun, S. , Shen, Q. and Xu, G. (2006) Physiological and molecular responses of nitrogen‐starved rice plants to re‐supply of different nitrogen sources. Plant Soil, 287, 145–159. [Google Scholar]
- Li, Y.L. , Fan, X.R. and Shen, Q.R. (2008) The relationship between rhizosphere nitrification and nitrogen‐use efficiency in rice plants. Plant, Cell Environ. 31, 73–85. [DOI] [PubMed] [Google Scholar]
- Liu, X. , Huang, D. , Tao, J. , Miller, A.J. , Fan, X. and Xu, G. (2014) Identification and functional assay of the interaction motifs in the partner protein OsNAR2.1 of the two‐component system for high‐affinity nitrate transport. New Phytol. 204, 74–80. [DOI] [PMC free article] [PubMed] [Google Scholar]
- Matakiadis, T. , Alboresi, A. , Jikumaru, Y. , Tatematsu, K. , Pichon, O. , Renou, J.P. , Kamiya, Y. et al. (2009) The Arabidopsis abscisic acid catabolic gene CYP707A2 plays a key role in nitrate control of seed dormancy. Plant Physiol. 149, 949–960. [DOI] [PMC free article] [PubMed] [Google Scholar]
- Matzke, M.A. , Primig, M. , Trnovsky, J. and Matzke, A.J.M. (1989) Reversible methylation and inactivation of marker genes in sequentially transformed tobacco plants. EMBO J. 8, 643–649. [DOI] [PMC free article] [PubMed] [Google Scholar]
- Miller, A.J. , Fan, X. , Orsel, M. , Smith, S.J. and Wells, D.M. (2007) Nitrate transport and signalling. J. Exp. Bot. 58, 2297–2306. [DOI] [PubMed] [Google Scholar]
- O'Brien, J.A. , Vega, A. , Bouguyon, E. , Krouk, G. , Gojon, A. , Coruzzi, G. and Gutierrez, R.A. (2016) Nitrate transport, sensing, and responses in plants. Mol. Plant. 9, 837–856. [DOI] [PubMed] [Google Scholar]
- Okamoto, M. , Kumar, A. , Li, W. , Wang, Y. , Siddiqi, M.Y. , Crawford, N.M. and Glass, A.D. (2006) High‐affinity nitrate transport in roots of Arabidopsis depends on expression of the NAR2‐like gene AtNRT3.1. Plant Physiol. 140, 1036–1046. [DOI] [PMC free article] [PubMed] [Google Scholar]
- Orsel, M. , Chopin, F. , Leleu, O. , Smith, S.J. , Krapp, A. , Daniel‐Vedele, F. and Miller, A.J. (2006) Characterization of a two‐component high‐affinity nitrate uptake system in Arabidopsis. Physiology and protein‐protein interaction. Plant Physiol. 142, 1304–1317. [DOI] [PMC free article] [PubMed] [Google Scholar]
- Pouliquin, P. , Boyer, J.C. , Grouzis, J.P. and Gibrat, R. (2000) Passive nitrate transport by root plasma membrane vesicles exhibits an acidic optimal pH like the H(+)‐ATPase. Plant Physiol. 122, 265–274. [DOI] [PMC free article] [PubMed] [Google Scholar]
- Quesada, A. , Galvan, A. and Fernandez, E. (1994) Identification of nitrate transporter genes in Chlamydomonas reinhardtii. Plant J. 5, 407–419. [DOI] [PubMed] [Google Scholar]
- Rahayu, Y.S. , Walch‐Liu, P. , Neumann, G. , Römheld, V. , von Wiren, N. and Bangerth, F. (2005) Root‐derived cytokinins as long‐distance signals for NO3 ‐‐induced stimulation of leaf growth. J. Exp. Bot. 56, 1143–1152. [DOI] [PubMed] [Google Scholar]
- Sanchez‐Bragado, R. , Serret, M.D. and Araus, J.L. (2017) The nitrogen contribution of different plant parts to wheat grains: exploring genotype, water, and nitrogen effects. Front Plant Sci. 7, 1986. [DOI] [PMC free article] [PubMed] [Google Scholar]
- Scheible, W.R. , Gonzalez‐Fontes, A. , Lauerer, M. , Muller‐Rober, B. , Caboche, M. and Stitt, M. (1997) Nitrate acts as a signal to induce organic acid metabolism and repress starch metabolism in tobacco. Plant Cell, 9, 783–798. [DOI] [PMC free article] [PubMed] [Google Scholar]
- Scheible, W.R. , Morcuende, R. , Czechowski, T. , Fritz, C. , Osuna, D. , Palacios‐Rojas, N. , Schindelasch, D. et al. (2004) Genome‐wide reprogramming of primary and secondary metabolism, protein synthesis, cellular growth processes, and the regulatory infrastructure of Arabidopsis in response to nitrogen. Plant Physiol. 136, 2483–2499. [DOI] [PMC free article] [PubMed] [Google Scholar]
- Siddiqi, M.Y. , Glass, A.D. , Ruth, T.J. and Rufty, T.W. (1990) Studies of the uptake of nitrate in barley: I. Kinetics of NO(3) influx. Plant Physiol. 93, 1426–1432. [DOI] [PMC free article] [PubMed] [Google Scholar]
- Souza, S.R. , Stark, E.M.L.M. and Fernandes, M.S. (1998) Nitrogen remobilization during the reproductive period in two Brazilian rice varieties. J. Plant Nutr. 21, 2049–2063. [Google Scholar]
- Stitt, M. (1999) Nitrate regulation of metabolism and growth. Curr. Opin. Plant Biol. 2, 178–186. [DOI] [PubMed] [Google Scholar]
- Szczerba, M.W. , Britto, D.T. and Kronzucker, H.J. (2006) The face value of ion fluxes: the challenge of determining influx in the low‐affinity transport range. J. Exp. Bot. 57, 3293–3300. [DOI] [PubMed] [Google Scholar]
- Tang, Z. , Fan, X. , Li, Q. , Feng, H. , Miller, A.J. , Shen, Q. and Xu, G. (2012) Knockdown of a rice stelar nitrate transporter alters long‐distance translocation but not root influx. Plant Physiol. 160, 2052–2063. [DOI] [PMC free article] [PubMed] [Google Scholar]
- Tong, Y. , Zhou, J.J. , Li, Z. and Miller, A.J. (2005) A two‐component high‐affinity nitrate uptake system in barley. Plant J. 41, 442–450. [DOI] [PubMed] [Google Scholar]
- Wang, Y.Y. , Hsu, P.K. and Tsay, Y.F. (2012) Uptake, allocation and signaling of nitrate. Trends Plant Sci. 17, 458–467. [DOI] [PubMed] [Google Scholar]
- Xu, G. , Fan, X. and Miller, A.J. (2012) Plant nitrogen assimilation and use efficiency. Annu. Rev. Plant Biol. 63, 153–182. [DOI] [PubMed] [Google Scholar]
- Yan, M. , Fan, X. , Feng, H. , Miller, A.J. , Sheng, Q. and Xu, G. (2011) Rice OsNAR2.1 interacts with OsNRT2.1, OsNRT2.2 and OsNRT2.3a nitrate transporters to provide uptake over high and low concentration ranges. Plant, Cell Environ. 34, 1360–1372. [DOI] [PubMed] [Google Scholar]
- Yoneyama, T. , Tanno, F. , Tatsumi, J. and Mae, T. (2016) Whole‐plant dynamic system of nitrogen use for vegetative growth and grain filling in rice plants (Oryza sativa L.) as revealed through the production of 350 Grains from a germinated seed over 150 days: a review and synthesis. Front Plant Sci. 7, 1151. [DOI] [PMC free article] [PubMed] [Google Scholar]
- Yong, Z. , Kotur, Z. and Glass, A.D. (2010) Characterization of an intact two‐component high‐affinity nitrate transporter from Arabidopsis roots. Plant J. 63, 739–748. [DOI] [PubMed] [Google Scholar]
- Zarabi, M. and Jalali, M. (2012) Leaching of nitrogen from calcareous soils in western Iran: a soil leaching column study. Environ. Monit. Assess. 184, 7607–7622. [DOI] [PubMed] [Google Scholar]
- Zhang, H. and Forde, B.G. (1998) An Arabidopsis MADS box gene that controls nutrient‐induced changes in root architecture. Science, 279, 407–409. [DOI] [PubMed] [Google Scholar]
- Zhang, H. , Jennings, A. , Barlow, P.W. and Forde, B.G. (1999) Dual pathways for regulation of root branching by nitrate. Proc. Natl Acad. Sci. USA, 96, 6529–6534. [DOI] [PMC free article] [PubMed] [Google Scholar]
- Zhang, Y.L. , Fan, J.B. , Wang, D.S. and Shen, Q.R. (2009) Genotypic differences in grain yield and physiological nitrogen use efficiency among rice cultivars. Pedosphere, 19, 681–691. [Google Scholar]
- Zhou, J.J. , Fernández, E. , Galván, A. and Miller, A.J. (2000) A high affinity nitrate transport system from Chlamydomonas requires two gene products. FEBS Lett. 466, 225–227. [DOI] [PubMed] [Google Scholar]
- Zhuo, D. , Okamoto, M. , Vidmar, J.J. and Glass, A.D. (1999) Regulation of a putative high‐affinity nitrate transporter (Nrt2;1At) in roots of Arabidopsis thaliana. Plant J. 17, 563–568. [DOI] [PubMed] [Google Scholar]
Associated Data
This section collects any data citations, data availability statements, or supplementary materials included in this article.
Supplementary Materials
Figure S1 Diagram of pOsNAR2.1:OsNAR2.1 constructs. RB, right border; LB, left border; pOsNAR2.1, OsNAR2.1 promoter; 35S, cauliflower mosaic virus 35S promoter; NOS, nopaline synthase terminator.
Figure S2 Characterization of T1 generation pOsNAR2.1:OsNAR2.1 transgenic lines. (a) qRT‐PCR analysis of endogenous the expression of OsNAR2.1 in culms of wild type and pOsNAR2.1:OsNAR2.1 transgenic lines. Error bars: SE (n = 3 plants). (b) Yield and biomass per plant from wild‐type and pOsNAR2.1:OsNAR2.1 transgenic lines grown in the field. Error bars: SE (n = 5 plants).
Figure S3 Ratio of to influx in wild‐type and pOsNAR2.1:OsNAR2.1 transgenic lines in 1.25 mm NH4NO3. WT and transgenic seedlings were grown in 1 mm
for 3 weeks and nitrogen starved for 1 week. or influx was measured at (a) 1.25 mm
15NH4NO3 or (b) 1.25 mm NH4
15NO3 for 5 min. DW, dry weight. (c) The to influx ratios with 1.25 mm NH4NO3 in the roots of wild‐type and pOsNAR2.1:OsNAR2.1 lines (Ox1, Ox2, and Ox3) are presented. Error bars: SE (n = 4 plants). The different letters indicate a significant difference between the transgenic line and the WT (P < 0.05, one‐way ANOVA).
Figure S4 Expression ratios of OsNRT2.1 to OsNAR2.1 in culms of transgenic lines and wild type. The pOsNAR2.1:OsNRT2.1 lines (O6, O7 and O8), pOsNAR2.1:OsNAR2.1 lines (Ox1, Ox2, and Ox3) and wild type are presented.
Table S1 Primers for amplification OsNAR2.1 ORF.
Table S2 Primers used for qRT‐PCR.
Table S3 Comparison of dry weight, grain yield, and ANUE between the wild‐type and pOsNAR2.1:OsNAR2.1 transgenic lines in the T2–T4 generations. n = 3 plots for each mean. The different letters indicate a significant difference between the transgenic line and the WT (P < 0.05, one‐way ANOVA).
Table S4 Increased nitrogen‐use efficiency in pOsNAR2.1:OsNAR2.1 and pOsNAR2.1:OsNRT2.1 transgenic lines relative to wild type. Statistical analysis of data from T4 generation; n = 3 for each mean. The different letters indicate a significant difference between the transgenic line and the WT (P < 0.05, one‐way ANOVA).