

Abstract
Background and Purpose
Group III pulmonary hypertension (PH) is a highly lethal and widespread lung disorder that is a common complication in idiopathic pulmonary fibrosis (IPF) where it is considered to be the single most significant predictor of mortality. While increased levels of hyaluronan have been observed in IPF patients, hyaluronan‐mediated vascular remodelling and the hyaluronan‐mediated mechanisms promoting PH associated with IPF are not fully understood.
Experimental Approach
Explanted lung tissue from patients with IPF with and without a diagnosis of PH was used to identify increased levels of hyaluronan. In addition, an experimental model of lung fibrosis and PH was used to test the capacity of 4‐methylumbeliferone (4MU), a hyaluronan synthase inhibitor to attenuate PH. Human pulmonary artery smooth muscle cells (PASMC) were used to identify the hyaluronan‐specific mechanisms that lead to the development of PH associated with lung fibrosis.
Key Results
In patients with IPF and PH, increased levels of hyaluronan and expression of hyaluronan synthase genes are present. Interestingly, we also report increased levels of hyaluronidases in patients with IPF and IPF with PH. Remarkably, our data also show that 4MU is able to inhibit PH in our model either prophylactically or therapeutically, without affecting fibrosis. Studies to determine the hyaluronan‐specific mechanisms revealed that hyaluronan fragments result in increased PASMC stiffness and proliferation but reduced cell motility in a RhoA‐dependent manner.
Conclusions and Implications
Taken together, our results show evidence of a unique mechanism contributing to PH in the context of lung fibrosis.
Abbreviations
- 4MU
4‐methylumbelliferone
- GEFT
guanine nucleotide exchange factor 25
- HABP2
hyaluronan‐binding protein 2
- HAS
hyaluronan synthase
- HYAL
hyaluronidase
- IF
immunofluorescence
- IHC
immunohistochemistry
- IPF
idiopathic pulmonary fibrosis
- LVSP
left ventricle systolic pressure
- mPAP
mean pulmonary arterial pressure
- PASMC
pulmonary artery smooth muscle cell
- PH
pulmonary hypertension
- RVH
right ventricle hypertrophy
- RVSP
right ventricle systolic pressure
- αSMA
α‐smooth muscle actin
Introduction
Pulmonary hypertension (PH) is a disorder of the pulmonary vasculature defined by increased mean pulmonary arterial pressure (mPAP; ≥ 25 mmHg at rest) leading to right ventricle hypertrophy (RVH), right‐sided heart failure and ultimately death (Archer et al., 2010). PH is a common complication in idiopathic pulmonary fibrosis (IPF) where it is strongly associated with increased morbidity and mortality (Nathan et al., 2007; Shorr et al., 2007). The prevalence of PH in IPF ranges between 30–40% (Nathan et al., 2007; Behr and Ryu, 2008) and it is classified as WHO Group III PH (Poor et al., 2012). Patients with Group III PH usually present with lower levels of mPAP compared to WHO Group I PH that only appears to affect the vasculature without involvement of the lung parenchyma. Despite this, the development of PH has devastating consequences in patients with chronic lung diseases such as IPF and it is considered the single most significant predictor of mortality in patients with IPF (Lettieri et al., 2006; Nathan et al., 2007; Patel et al., 2007). The pathological process in PH is characterized by extensive vascular remodelling; including enhanced proliferation of pulmonary artery smooth muscle cells (PASMC) leading to narrowing and obliteration of the vessel lumen resulting in increased vascular tone (Morrell et al., 2001). However, little is known regarding the mechanisms that govern vascular remodelling leading to Group III PH associated with lung fibrosis and as a result, effective treatment options are lacking (Collum et al., 2017).
Hyaluronan (also known as hyaluronate or hyaluronic acid, HA) is a component of the lung extracellular matrix and increased levels of hyaluronan have been observed in patients with IPF (Bjermer et al., 1989; Papakonstantinou and Karakiulakis, 2009) and idiopathic pulmonary arterial hypertension [IPAH; (Aytekin et al., 2008; Papakonstantinou et al., 2008)], a form of PH where the lung parenchyma is not affected. Furthermore, overexpression of hyaluronan synthase 2 (HAS2), an enzyme responsible for the synthesis of hyaluronan, has been implied in severe fibrosis (Li et al., 2011). Taken together these observations suggest a role for hyaluronan in the pathophysiology of PH in IPF. However, hyaluronan‐mediated vascular remodelling and the mechanisms promoting increased hyaluronan synthesis in Group III PH is not fully understood. These observations prompted us to evaluate the presence of elevated hyaluronan in patients with IPF and IPF + PH and to assess the therapeutic potential of a hyaluronan synthase inhibitor in a murine model of PH associated with lung fibrosis.
Our results revealed that increased hyaluronan was associated with remodelled vessels and correlated with increased disease severity, as defined by elevated mPAP values. In addition, we report improvements in PH but not fibrosis following therapy with 4‐methylumbelliferone (4MU), a hyaluronan synthase inhibitor in a murine model of PH associated with lung fibrosis. These observations provide evidence for an independent hyaluronan‐mediated mechanism in the pathogenesis of PH associated with IPF. Furthermore, our results reveal that hyaluronan leads to increased proliferation and stiffness of PASMCs and also affects the ability of these cells to migrate in a RhoA‐dependent manner. Taken together, these results show evidence of a unique mechanism contributing to PH in the context of lung fibrosis.
Methods
Subjects
The use of human material for this study was reviewed by the University of Texas Health Science Center at Houston Committee for the Protection of Human Subjects (Institutional Review Board no. HSC‐MS‐08‐0354). The demographic details of the study population are summarized in Table 1. De‐identified lung explant tissue from patients with IPF and corresponding de‐identified clinical parameters were obtained from the Methodist Hospital (Houston, TX) as described previously (Garcia‐Morales et al., 2016). IPF was diagnosed by board‐certified pulmonologists upon admittance for lung transplantation at the Houston Methodist Hospital using published guidelines (Raghu et al., 2011). Briefly, the criteria for a positive diagnosis of IPF were defined by the exclusion of other known causes of interstitial lung disease, such as domestic and occupational environmental exposures, connective tissue disease, and drug toxicity; the presence of a usual interstitial pneumonia pattern on high‐resolution computed tomography scans and lung function tests consistent with restrictive lung disease (Pellegrino et al., 2005). Pulmonary hypertension was defined as a mean pulmonary pressure ≥ 25 mmHg and a pulmonary capillary wedge pressure ≤ 15 mmHg; the haemodynamic measurements were obtained from the right heart catheterization performed as part of the transplant evaluation. Control lung tissue was obtained from lungs that were declined for transplantation but had no pulmonary chronic disease or contusion. Healthy control lung tissue was obtained from the International Institute for the Advancement of Medicine (Edison, NJ).
Table 1.
Demographic description of study population
| IPF (n = 10) | IPF + PH (n = 9) | P‐value | |
|---|---|---|---|
| Females | 2/10 | 4/9 | >0.05 |
| Males | 8/10 | 5/9 | >0.05 |
| Age (years) | 63.4 ± 2.9 | 57.3 ± 4.6 | >0.05 |
| mPAP (mmHg) | 20.0 ± 1.7 | 31.3 ± 1.5 | <0.05 |
| Systolic PAP (mmHg) | 32 ± 2.5 | 50.2 ± 2.3 | <0.05 |
| Diastolic PAP (mmHg) | 13.3 ± 1.2 | 20.8 ± 1.5 | <0.05 |
| BMI | 27.9 ± 1.7 | 30.0 ± 1.8 | >0.05 |
| FVC % | 57.3 ± 8.4 | 51.5 ± 7.6 | >0.05 |
| DLCO % | 26.0 ± 4.4 | 23.8 ± 3.6 | >0.05 |
| TLC % | 57.9 ± 6.7 | 64.0 ± 4.0 | >0.05 |
| FEV1% | 60.2 ± 9.0 | 48.8 ± 8.0 | >0.05 |
Tissue collection
As described previously (Garcia‐Morales et al., 2016), tissue was collected at the time of lung explantation and processed on site within 20 min. The lobes were identified from each lung explant, and for each lobe, the centre was identified, taking the airway as a reference point. A 1 cm transverse centre cut was performed to obtain a section from the centre of each lobe. Consequently, this tissue was divided into three sections to separate external (closest to pleura), centre and internal (closest to bronchi) portion according to the airway. A piece from each portion was then cut for histology, and an adjacent section was flash frozen in liquid nitrogen.
Animals
All animal care and experimental studies were reviewed and approved by the University of Texas Health Science Center at Houston Animal Welfare Committee Animal studies are reported in compliance with the ARRIVE (Kilkenny et al., 2010; McGrath and Lilley, 2015), institutional and NIH guidelines. Male C57/BL6 mice 4–5 weeks old weighing 20–22 g were purchased from Envigo Industries (Indianapolis, IN, USA). All mice were housed in ventilated cages equipped with microisolator lids and maintained under strict containment protocols. Mice were housed 5 per cage and were provided with variable free paper bedding (Pure‐o'Cel The Andersons, Inc. Maumee, OH, USA) and Nestlets™ provided by Ancare (Bellmore, NY, USA). The red mouse loft (Tecniplast, Buguggiate, Italy) was provided as amusement to all mouse cages. Mice were kept at an ambient temperature of 22°C and in a 12 h dark/light cycle.
A minimum of 5 mice was used for experimental groups; the exact number (N) used for each group is shown in the figure legends. Group sizes were equal by design, and variations are due violation of predetermined criteria that are explained in the methodology and in the individual figure legends. Mice were randomized to treatment groups using a random number generator from www.graphpad.com/quickcalcs. For sample analysis, all mice were ear‐tagged and researchers were blinded to the treatment group. In cases where data was normalized, this was performed to control for unwanted sources of variation. Mice were selected for this experiment as we have been successful in replicating features of lung fibrosis and pulmonary hypertension. Regrettably, in silico models or in vitro studies cannot replicate physiological effects such as blood pressure and as such animals are required to model these aspects of disease.
Experimental design
Mice were treated with 0.035 Ug−1 of bleomycin (TEVA Pharmaceuticals, Sellersville, PA, USA) or vehicle (PBS; Life Technologies, Grand Island, NY) twice a week for 4 weeks i.p. This model of chronic injury presents with fibrotic deposition affecting the distal areas of the lung, which is more representative than the more common intra‐tracheal (IT) instillation of bleomycin (Moore and Hogaboam, 2008). In addition, the i.p. model of bleomycin presents with hallmarks of pulmonary hypertension that we have not been able to reproduce in the IT model of bleomycin‐induced lung fibrosis. On day 15, mice were provided with chow containing 4‐MU (Sigma Aldrich, Saint Louis, MO, USA), at a dose of 20 mg·kg−1 per day or normal chow (vehicle, Teklad, Industries, Indianapolis, IN, USA) for the remainder of the experiment. The dose of 4MU was based on studies by where 4MU inhibited lung metastasis in vivo (Arai et al., 2011). To deliver 20 mg·kg−1 per day 4MU was added to the diet at a concentration of 125 mg·kg−1 diet (assuming mean body weight ~25 g and intake ~4 g·per day). This was calculated by a Nutritionist at Harlan Laboratories (now Envigo) and confirmed by measurements in our lab (Supporting Information Figure S1). We have successfully used medicated chow prepared by Harlan Laboratories to treat chronic lung injury (Karmouty‐Quintana et al., 2012). On day 33, physiological readouts were performed and the animals were then killed for the collection of tissues and fluids for analysis. Mice were assessed bi‐weekly for changes in body weight, lack of grooming or hunched posture by lab personnel and once‐weekly by veterinarians at our facility. In a separate cohort of experiments, 4MU therapy (or control chow) began on day 33 of BLM exposure and lasted for 14 days. Physiological readouts and tissue collection was performed on day 47.
Arterial oxygen saturation
Physiological assessment measuring arterial oxygen saturation was conducted on conscious mice using the pulse MouseOx software analysis (STARR Life Sciences Corp, Oakmont, PA). The hair around the neck was removed from mice in order to use the collar clip light sensor. The MouseOx provides real‐time percent oxygen saturation of functional arterial haemoglobin by utilizing pulse oximetry measurements of light absorption from the red and infrared LEDs (Light Emitting Diodes).
Haemodynamic measurements
Right ventricle systolic pressure (RVSP); heart rate and right ventricle (RV) hypertrophy: This procedure was performed as previously described (Karmouty‐Quintana et al., 2012). Briefly, mice are given 0.75 mg g−1of 5% Avertin (a mixture of tert‐amyl alcohol and 2–2‐2 tribromoethanol, Sigma Aldrich) to induce a surgical plane of anaesthesia. Mice are placed on a heated surgical workstation (Molecular Imaging Products, Bend, OR) and secured with surgical tape. Mice were then tracheotomised with a 19G blunt needle (BRICO, Dayton, NJ) and attached to a small animal ventilator (MiniVent, Hugo‐Sachs Elektronik, March‐Hugstetten, Germany) and ventilated at a stroke volume of 250 μL at 200 strokes per minute. The surgical site was viewed using a surgical microscope (SMZ‐2B, Nikon, Tokyo, Japan). An incision of ∼1 cm in length was made just below the xiphoid process. An alm retractor (ALM‐112, Braintree Scientific, Braintree, MA) was used to expose the abdominal cavity to visualize the diaphragm and the liver. An incision was then made on the diaphragm to expose the heart and the pericardium then removed. The right ventricle was then identified and a puncture made with a 28G needle. A 1 French pressure catheter (SPR‐1000, Millar Instruments, Houston, TX) was then inserted through the puncture. Using the same procedure we recorded left ventricular systolic pressure (LVSP), immediately after RVSP measurements. The heart rate results were continuously recorded using a Powerlab 8‐SP A/D (AD Instruments) converter, acquired at 1000 Hz. All RVSP results were recorder to a PC utilizing Chart8 software. After completion of the measurements, blood was collected and the lungs were excised and flash frozen in liquid nitrogen for RNA extraction. The heart was excised and the atria were removed. The right ventricle was then surgically removed and the dry weights of the RV were used to determine the extent of RV‐hypertrophy (RV/left ventricle [LV] + septum). A heart rate below 250 beats per minute (BPM) during the determination of the RVSP or LVSP was considered as a violation of a predetermined criteria.
RT‐PCR and protein expression
Total RNA was isolated from frozen lung tissue using Trizol reagent (Life Technologies). RNA samples were then DNase treated (ArticZymes, Tromso, Norway) and subjected to quantitative real‐time RT‐PCR. The specific primer sequences used are shown in Supporting Information Tables S1 and S2. Results were normalized to the geometric mean of HPRT1 and SDHA (human) or Tbp or Actb (mouse) to account for variation in expression and following the geNorm method. Here two technical replicates were performed per sample. Prior to RT‐PCR experiments RNA quality was evaluated using a Nanodrop (Thermo Fisher Scientific, Waltham, MA, USA); to evaluate 260 nm / 280 nm absorbance values. Samples with 260/280 absorbance rations below 1.90 or above 2.10 were considered to have poor RNA quality and thus violated a predetermined criteria.
Liquid chromatography tandem mass spectrometry (LC–MS/MS) analysis of 4MU and 4‐methylumbelliferyl‐β‐D‐glucuronide hydrate (4MUG) concentrations in mouse plasma
Sample preparation
4‐Methylumbelliferone‐[13C4] (Toronto Research Chemicals, Ontario, Canada) and 7‐hydroxy coumarin β‐D‐glucuronide (as sodium salt) (Toronto Research Chemicals, Ontario, Canada) were used as the internal standard (IS) for 4MU and 4MUG respectively. The stock solutions of a mixture of 4‐MU and 4‐MUG were diluted in 50% methanol to prepare the spiking solutions ranging from 1 ng mL‐1 to 5000 ng mL‐1. For calibration standards, 25 μL of blank plasma was mixed with 25 μL of the spiking solutions. For unknown samples, 25 μL of test plasma was mixed with 25 μL of 50% methanol to make up the volume. 25 μL of a mixture of the two IS (1000 ng mL‐1 in 50% methanol) was also added. After vortexing all standards and samples, 150 μL of methanol/acetonitrile 20:80 (v/v) was added to the mixture which was further vortexed vigorously for 1 min followed by centrifugation at 850 × g for 10 min. 100 μL of the supernatant was diluted with 200 μL of Milli Q water.
LC–MS/MS analysis
The LC–MS/MS system consists of an AB SCIEX QTRAP 4000 mass spectrometer coupled to a Shimadzu UFLC system. Mobile phase A is HPLC grade water. Mobile phase B is HPLC grade acetonitrile. LC separation was carried out on a Phenomenex Luna PFP(2) column (3 μm, 150 × 2 mm) with isocratic elution using 45% mobile phase B and a flow rate of 0.4 mL min‐1 at room temperature. The analysis time was 2.5 min. 5 μL of the extracted sample was injected. The mass spectrometer was operated in the negative mode with multiple‐reaction monitoring (MRM). The following MRM transitions were used: 4MU (m/z 174.7 → 132.9), IS for 4MU (m/z 178.7 → 134.9), 4MUG (m/z 350.8 → 174.9) and IS for 4MUG (m/z 336.9 → 160.9). Data acquisition and analysis were performed using the Analyst 1.6.1 software (AB SCIEX).
Immunoblots and ELISA
For immunoblots protein from lung tissue lysates or PASMC was extracted with RIPA buffer (Thermo Scientific, Rockford, IL) containing 1 mM of protease and phosphate inhibitor (Sigma Aldrich). Samples (30 μg protein each) were loaded onto 4–12% Mini‐Protean TGX gels (Bio‐Rad, Hercules, CA) for electrophoresis and then transferred on polyvinylidene difluoride (PVDF) membranes (0.45 μm, GE Healthcare Piscataway, NJ). Membranes were then blocked in 5% milk (Bio‐Rad) for 1 h at room temperature and then incubated with the appropriate primary antibody overnight. Secondary antibodies and an ECL kit from (GE Healthcare) were applied for generating chemiluminescent signals. Specific details for the primary antibodies can be found in Supporting Information Table S3. Broncho‐alveolar lavage fluid (BALF) was extracted by flushing the lungs with 0.5 mL of cold PBS twice and collecting the fluid using a 1 mL syringe. The presence of blood in BALF was considered as a violation of pre‐established criteria. Hyaluronan levels in BALF were measured by ELISA using a kit from Echelon Biosciences (Salt Lake City, UT), with two technical replicates per sample.
Hyaluronan fragment size assessment
Lung samples from mice were pulverized and suspended in water. Protease (Pronase Calbiochem #537088) was added to a final concentration of 200u mL‐1. This was digested for 12 h at 55°C. This digestion was repeated six times. Samples were centrifuged at 2400 × g for 10 min. The supernatant was concentrated using Corning Spin‐X UF concentrators (CLS431477). Samples were mixed with 4 μL 2 M sucrose and were run in 0.5% agarose gel in TAE buffer. Hyaluronan size standards were also mixed with sucrose. Gel was stained with 0.005% Stains‐All (Sigma #E‐7762) and then destained in water for 48 h. Images were obtained with the BioRad ChemiDoc Touch.
Histology and immunohistochemistry (IHC)
Lung sections 5 microns thick, were dewaxed using histoclear (National Diagnostics, Atlanta, GA) and re‐hydrated using a gradient of ethanol. Sections were then subject to high temperature antigen retrieval using a citrate buffer, endogenous peroxidase and alkaline phosphatase were inactivated using BLOXALL (Vector Labs, Burlingame, CA) and 2.5% normal horse serum (Vector Labs) was using as a blocking solution prior to incubation with the primary antibody. Following overnight incubation with the primary antibody, sections were treated with the ImmPRESS polymer detection kits for alkaline phosphatase (Vector Labs) based on the host of the primary antibody and developed using Vector red or Vector Blue (Vector Labs). For immunofluorescence chicken anti‐mouse Alexa Fluor 488 (Life Technologies Carlsbad, CA) was used and counterstained DAPI (Abcam). Specific information on the antibodies used for IHC is described in Supporting Information Table S3. Lungs stained with Massons's Tri‐chrome were analysed using a modified Ashcroft scale optimized for mouse lung sections (Hubner et al., 2008). Poor inflation of lungs resulting in a compression of airspaces visualized histologically in normal areas of the lung by an observer blinded to group status, was considered as a violation of a predetermined criteria.
Morphometry
Muscularized arterioles of the lung parenchyma were observed under 40× magnification and noted as being different from both airways and non‐muscularized arterioles. Muscularized arterioles were then photographed under 40× magnification. Micropictographs were then analysed using Image Pro‐Plus software (MediaCybernetics Inc, Bethesda, MD). In short, the overall area of the muscularized portion was measured for each arteriole. To correct for size, the largest diameter for each arteriole was also measured. The area of the arteriole was then divided by the largest diameter to give a relative measurement of muscularization. Poor inflation of lungs resulting in a compression of airspaces visualized histologically in normal areas of the lung by an observer blinded to group status was considered as a violation of a predetermined criteria.
Cell culture experiments and atomic force microscopy (AFM)
Normal control primary PASMC obtained from Dr. Morrell's group (Cambridge, UK) were cultured in DMEM with or without 100 μM fasudil (R&D Systems). For studies performed to evaluate the proliferative effect and cyotoxcity of hyaluronan and fasudil, cells were treated with high molecular weight (HMW; 1350 kDa GLR002 R&D systems, Minneapolis, MN), medium molecular weight (MMW, 289 kDa GLR004 R&D systems), low molecular weight (LMW, 20 kDa, GLR001) or ultra‐low molecular weight (ULMW, 4.8 kDa GLR003) hyaluronan with or without fasudil (100 μM,). Cell proliferation and cytotoxicity was determined using the ApoTox‐Glo™ Triplex Assay (Promega, Madison WI). This method relies on measuring two protease activities: one for cell viability and the other as a marker of cell cytotoxicity. The final part of the assay is the measurement of a luminogenic substrate for caspase 3/7. For AFM experiments control and fasudil were treated with either no hyaluronan, 5.7 mg of medium molecular weight (MMW) hyaluronan (R&D Systems GLR004), or 5.7 mg of ULMW hyaluronan (R&D Systems GLR003). After 24 h the cells were used for AFM measurements at room temperature. The force curves measurements were performed with a Catalyst Bioscope System (Bruker Corporation, Billerica, MA). The AFM was equipped with an inverted light microscope (Olympus IX81) so that the cells were constantly monitored. Silicon nitride cantilevers (Novascan Technologies, Inc., Ames, IA) with approximate spring constant values of 0.06 N m−1 were employed in all AFM experimentations. The AFM probe was purchased from Novascan (the probe has a silicon nitrite cantilever with a 5μm silica spherical particle on the end) with a spring constant of 0.06 N s−1. The cantilever sensitivity was calibrated with the NanoScope 9.0 software by measuring a force curve on a clean silicon wafer. Force curves were acquired at a sampling rate of 1 Hz. The Young's modulus, E, was calculated from obtained force curves based on the Hertzian fit mode using Nanoscope analysis programme from the Bruker Corporation. F = 2πE1−υ2tanαδ2 where F = force, E = Young's modulus, ν = Poisson's ratio (ν = 0.5, in this study), α = half‐angle of the indenter (i.e. tip radius, α = 5000 nm, in this study), and δ = indentation depth.
Data and statistical analysis
The data and statistical analysis comply with the recommendations on experimental design and analysis in pharmacology (Curtis et al., 2015). All analysis was carried out without knowledge of the experimental conditions (blinded). A one‐way ANOVA (ANOVA) with a Newman–Keuls post hoc test was performed for all experiments with more than two groups. For experiments that consisted of two groups only, an un‐paired, two‐tailed Student's t‐test with a Welch correction was used. Categorical data was analysed using a chi‐squared calculation. Statistical significance was defined as P ≤ 0.05 by use of GraphPad Prism version 5 (GraphPad Software, La Jolla, CA). Densitometry analysis from immunoblots were performed using ImageJ (National Institutes of Health, Bethesda, Maryland, USA).
Nomenclature of targets and ligands
Key protein targets and ligands in this article are hyperlinked to corresponding entries in http://www.guidetopharmacology.org, the common portal for data from the IUPHAR/BPS Guide to PHARMACOLOGY (Southan et al., 2016), and are permanently archived in the Concise Guide to PHARMACOLOGY 2015/16 (Alexander et al., 2015a,b).
Results
Hyaluronan is elevated in patients with group III pulmonary hypertension
We first stained lung sections from patients diagnosed with IPF and those with PH associated with IPF. We found increased hyaluronan levels, observed histologically, in IPF patients compared to controls. This increase appeared to be enhanced further in patients with PH associated with IPF adjacent to the smooth muscle but not the endothelial layer (Figure 1A). Interestingly, increased hyaluronan deposition was observed in areas rich in vascular remodelling (Figure 1A). Transcript levels of HAS1, HAS2 and HAS3 (Figure 1B–D) from isolated lung sections revealed a significant correlation between elevated HAS2 and HAS3 expression but not HAS1 expression levels and increased mPAP values for patients with IPF (Figure 1B–D). Interestingly, immunoblots for HAS1 revealed increased signals in IPF, compared with normal lung samples and between IPF + PH and IPF, suggesting increased HAS1 protein levels in IPF + PH (Figure 1B). Similarly, immunofluorescence for HAS2 and HAS3 revealed increased signals for HAS2 and HAS3 in remodelled vessels of patients with IPF + PH but not in IPF or normal (Supporting Information Figure S2A). Immunoblots for HAS1, HAS2 and HAS3 revealed increased expression of HAS1 and HAS2 in IPF + PH samples compared with normal and in IPF + PH compared with IPF groups (Supporting Information Figure S2B).
Figure 1.
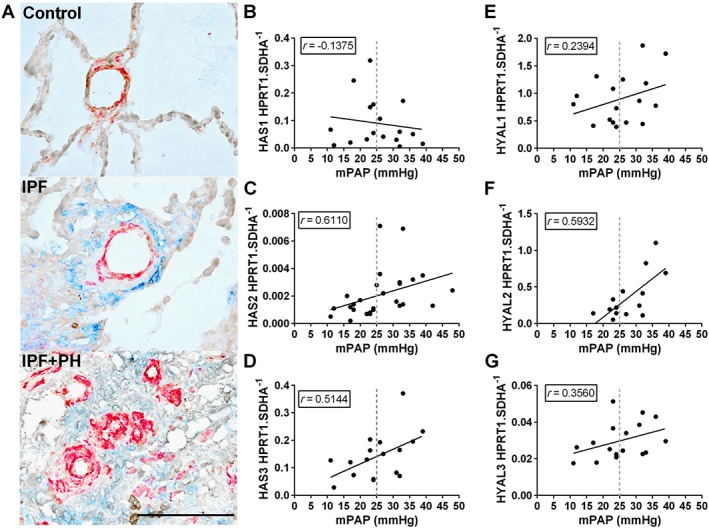
Increased hyaluronan levels and degradation in Group III PH. Lung sections double stained for α‐smooth muscle actin (α‐SMA; red signals) and hyaluronan (blue signals) from normal lungs (top panel) or patients with IPF (middle panel) or IPF + PH (bottom panel) (A). Linear regression and Spearman correlation analysis for mRNA levels for HAS1 (B; r = 0.1375, P>0.05), HAS2 (C; r = 0.6110, P<0.05), HAS3 (D; r = 0.5144, P<0.05), HYAL1 (E; r = 0.2394, P>0.05), HYAL2 (F; r = 0.5932, P<0.05) and HYAL3 (G; r = 0.3560, P>0.05) against mPAP from patients with IPF. The scale bar represents 100 μm. n = 10 (IPF); 9 (IPF + PH). PH is defined as mPAP ≥25 mmHg.
Increased hyaluronan degradation in group III pulmonary hypertension
Hyaluronan can be degraded into low molecular weight fragments by hyaluronidases and increased ROS (Esser et al., 2012; Chowdhury et al., 2016). Interestingly we report a significant correlation between enhanced expression of hyaluronidase 2 (HYAL2) and mPAP (Figure 1F) and elevated HYAL2 signals by immunoblots between IPF and normal but not between IPF and IPF + PH. We also show increased protein levels for HYAL3 between IPF and normal lung but no increases between IPF + PH and IPF but similar results were not seen for HYAL1 or HYAL3. (Figure 1E–G) Immunoblots for HYALs revealed an overall increase in IPF compared with normal groups and a further increase in IPF + PH groups compared with IPF (Supporting Information Figure S2B). Finally we report a significant correlation between increased expression of Nrf2, a marker of increased oxidative stress, and elevated mPAP (Supporting Information Figure S1C). Small MW hyaluronan fragments have been reported to interact with CD44 to mediate pathogenic effects (Lennon and Singleton, 2011; Lorentzen et al., 2016) and we therefore measured CD44 levels. However our data appears to show a reduction in CD44 protein levels despite a correlation between increased CD44 and mPAP levels (Supporting Information Figure S1D, E). Expression levels of all HAS and HYALs (IPF vs. IPF + PH) are shown in Supporting Information Figure S1E. Taken together, these observations show increased hyaluronan deposition in IPF and IPF + PH and suggest that degradation of hyaluronan to smaller MW fragments is mediated by enhanced expression of HYALs and the presence of ROS.
4‐Methylumbelliferone (4MU) reduces hyaluronan levels in a model of lung fibrosis and pulmonary hypertension
4MU also known as hymecromone) is a FDA approved drug for bile therapy (Takeda and Aburada, 1981) and it is also able to inhibit hyaluronan synthesis by depleting the cell of uridine diphosphate‐glucuronic acid (Kakizaki et al., 2004; Kultti et al., 2009), an essential substrate for all HAS isoforms (Kakizaki et al., 2004; Kultti et al., 2009) and by down‐regulation of HAS2 and 3 mRNA expression (Kultti et al., 2009). In this experiment, we treated mice exposed to bleomycin or vehicle, with 4MU starting on day 15, consistent with previous studies from our group where changes in the lung parenchyma are apparent at this time point (Karmouty‐Quintana et al., 2012). On day 33, physiological readouts and tissues were collected (Figure 2A). Hyaluronan levels observed by IHC show increased hyaluronan deposition in bleomycin‐exposed mice that were inhibited by 4MU therapy (Figure 2B). In line with this, BALF revealed a significant elevation in bleomycin‐exposed mice that was attenuated by 4MU treatment (Figure 2C). These observations were consistent with increased levels of Has1, Has2 and Has3 expression in bleomycin‐exposed mice (Figure 2 D‐F) 4MU attenuated Has2 and Has3 but not Has1 expression (Figure 2D–F). Analysis of hyaluronidases demonstrated increased protein levels of Hyal1 and Hyal2 in bleomycin and bleomycin + 4MU treatment groups compared to PBS consistent with increased Hyal2 but not Hyal1 or Hyal3 mRNA expression levels (Supporting Information Figure S3B–D). Transcript levels for Nrf2 were elevated in bleomycin, compared to PBS, groups (Supporting Information Figure S3E). These observations echo our studies with human lung, showing evidence for increased hyaluronan fragment degradation in experimental lung fibrosis. Here we also measured CD44 levels and we report increased both protein and mRNA levels in bleomycin‐exposed mice (Supporting Information Figure S3A, F).
Figure 2.
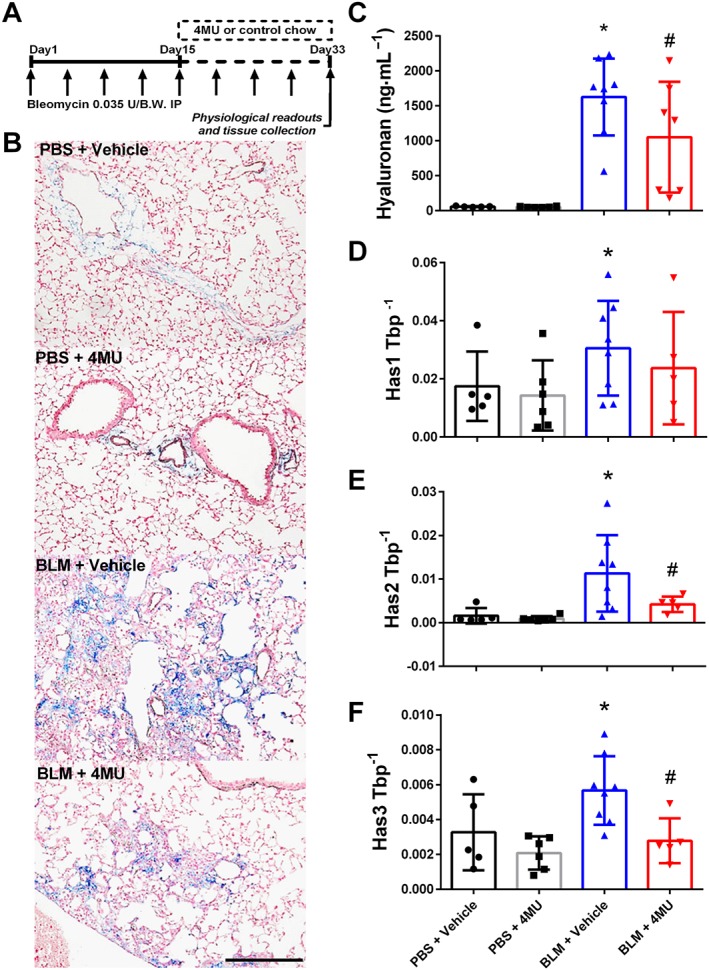
Reduction of hyaluronan levels with 4MU in lung fibrosis and PH. Experimental mice are treated biweekly for 4 weeks with bleomycin (BLM; 0.035 U·g−1, i.p.) or PBS; 20 mg·kg−1·day−1 4MU or normal chow was administered beginning on day 15 until the end of the experiment (A). IHC (B) for hyaluronan from PBS + vehicle, PBS + 4MU, BLM + vehicle and BLM + 4MU treatment groups. Hyaluronan levels determined from BALF (C); mRNA levels from lung lysates for Has1 (D); Has2 (E) and Has3 (F) using TATA‐box binding protein (TBP). Data are shown as scatter plots showing the mean ± SD. * P ≤ 0.05, significant difference between PBS + vehicle and BLM + vehicle treatment; ANOVA. # P < 0.05, significant difference between BLM + vehicle and BLM + 4MU treatment; ANOVA. The scale bar represents 50 μm. The N used for these studies are 5 (PBS + vehicle); 6 (PBS + 4MU); 8 (BLM + vehicle); 7 (BLM + 4MU) for panel C and 5 (PBS + vehicle); 6 (PBS + 4MU); 8 (BLM + vehicle); 5 (BLM + 4MU) for panels D–F. Variations in N are due to violation of a predetermined criteria: presence of blood in BALF (C) or repeatedly poor RNA quality and loss of sample (D–F).
4‐Methylumbelliferone (4MU) prevents vascular remodelling and pulmonary hypertension
Using our mouse model of lung fibrosis and pulmonary hypertension (Karmouty‐Quintana et al., 2012), we show increased vascular α‐smooth muscle actin (αSMA) deposition in addition to Has1, Has2 or Has3 expression consistent with vascular remodelling in bleomycin‐exposed mice compared to controls (Figure 3A). Treatment with 4MU in bleomycin‐exposed mice led to a reduction in αSMA deposition and Has1, Has2 or Has3 expression levels observed by immunofluorescence (Figure 3A) and assessed morphometrically (Figure 3B). These changes are in‐line with physiological readouts of pulmonary hypertension such as RVSP where we report increased pressures in bleomycin‐exposed mice that were significantly attenuated in the bleomycin + 4MU group (Figure 3C). Similarly, the Fulton index, a measure of RVH revealed increased values in bleomycin‐exposed mice that were significantly inhibited in 4MU‐treated bleomycin‐exposed mice (Figure 3D). Lastly, we report a significant improvement in arterial oxygenation (SpO2) in bleomycin+ 4MU treated mice compared with bleomycin‐exposed mice where reduced oxygenation is apparent compared to controls (Figure 3E). No changes in LVSP or heart rate were observed between treatment groups (Supporting Information Figure S4A, B). Taken together our data show that 4MU can prevent vascular remodelling and the subsequent development of pulmonary hypertension in our model. In addition we performed bioanalysis by LC–MS/MS to determine the levels of 4MU and its metabolite 4‐methylumbelliferyl‐β‐D‐glucuronide (4MUG) from plasma samples. Interestingly we report increased levels of 4MU in bleomycin‐exposed 4MU‐treated mice compared with PBS‐exposed 4MU groups (Supporting Information Figure S4C). 4MUG levels were elevated in both bleomycin and PBS exposed mice that received 4MU in the diet (Supporting Information Figure S4D).
Figure 3.
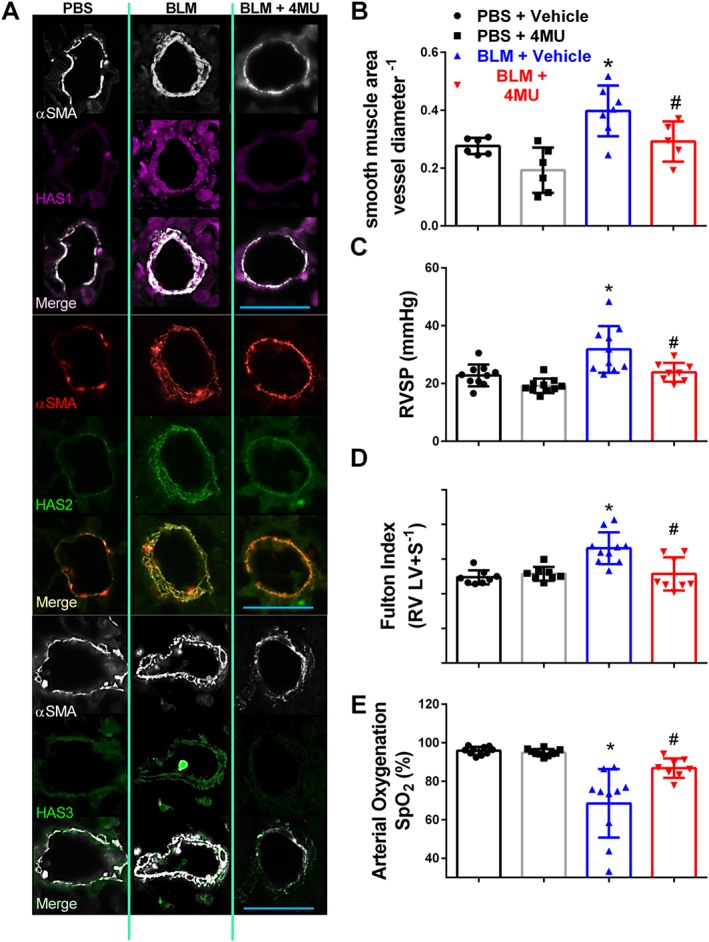
4MU prevents vascular remodelling and pulmonary hypertension. IF‐stained lung sections (A) for αSMA (white or red signals) and Has1 (violet/purple signals); Has2 (green signals); or Has3 (green signals) from mice treated with PBS + vehicle, bleomycin (BLM) + vehicle, or BLM + 4MU. Vascular remodelling determined morphometrically (B); RVSP (C); Fulton index determined from measuring dry weights of RV and LV + septum (D); arterial oxygen (SPO2) determined by pulse oximetry (E) from PBS + vehicle, PBS + 4MU, BLM + vehicle and BLM + 4MU treatment groups. Data are shown as scatter plot showing the mean ± SD. * P ≤ 0.05, significant difference between PBS + vehicle and BLM + vehicle treatment; ANOVA. # P < 0.05, significant difference between BLM + vehicle and BLM + 4MU treatment; ANOVA. The scale bar represents 50 μm. The N used for these studies are 6 (PBS + vehicle); 6 (PBS + 4MU); 7 (BLM + vehicle); 5 (BLM + 4MU) for panel B; and 10 (PBS + vehicle) for panel B and 10 (PBS + 4MU); 10 (BLM + vehicle); and 8 (BLM + 4MU) for panels C, D and E. Variations in the N are due to violation of a predetermined criteria: inadequate inflation of the lung (C) or heart rate below 250 BPM at the time of RVSP or inability to perform pulse oximetry determination (C–E).
Fibrotic deposition is not altered in 4MU‐treated mice
Numerous studies have shown a role for hyaluronan in the pathophysiology of lung fibrosis (Bjermer et al., 1989; Aytekin et al., 2008; Li et al., 2011). Based on these observations, we anticipated that 4MU treatment would diminish the extent of fibrotic deposition in bleomycin‐exposed mice. Interestingly, we report that treatment with 4MU did not reduce the extent of fibrotic scarring in the lungs as shown histologically (Figure 4A) or following Ashcroft score grading (Figure 4B). These observations are consistent with Col1a1 and Fn1 transcript levels showing elevated expression in bleomycin‐exposed mice that were not inhibited in bleomycin + 4MU mice (Figure 4C, D). Consistent with these observations, an immunoblot for fibronectin (FN) shows increased FN signals in bleomycin‐exposed mice compared with controls, that were not altered in bleomycin + 4MU mice (Figure 4E) and staining for SMA shows no difference in myofibroblast deposition between bleomycin‐exposed mice following vehicle or 4MU treatment (Figure 4F). Collectively, these results suggest that 4MU, although able to inhibit vascular remodelling, may not influence fibrotic deposition at the dose and regimen used in this study.
Figure 4.
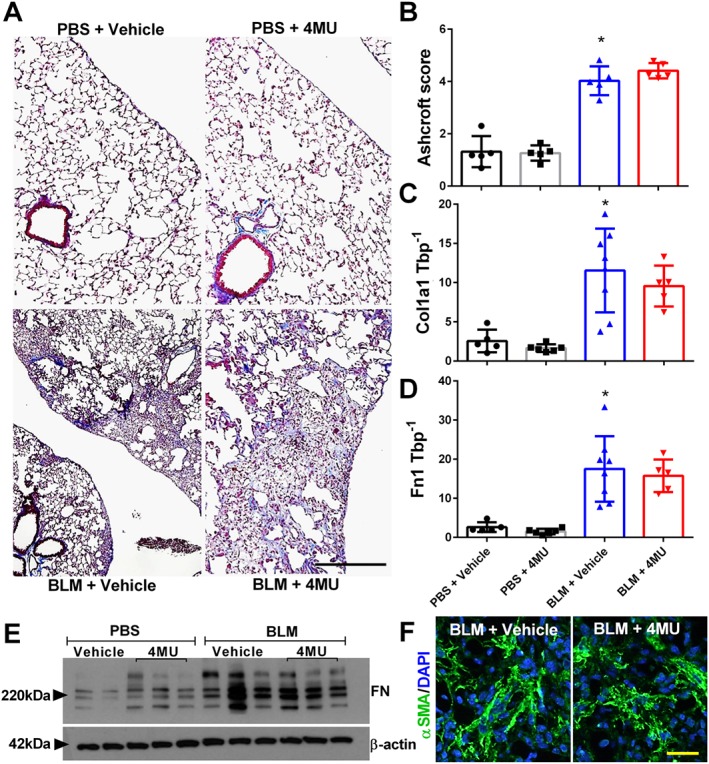
Fibrotic deposition is maintained in 4MU‐treated mice. Masson's trichome (A); Ashcroft scores (B); transcript levels for Col1a1 (C) and Fn1 (D); and immunoblots for FN and β‐actin (E) from PBS + vehicle, PBS + 4MU, bleomycin (BLM) + vehicle and BLM + 4MU treatment groups. Lung sections IF stained for αSMA (green signals) and counterstained with DAPI (blue signals) (F) from BLM + vehicle or BLM + 4MU treatment groups. Data are shown as scatter plot showing the mean ± SD. * P ≤ 0.05, significant difference between PBS + vehicle and BLM + vehicle treatment; ANOVA. The scale bar represents 50 μm. The N used for these studies are 5 (PBS + vehicle); 5 (PBS + 4MU); 5 (BLM + vehicle); and 5 (BLM + 4MU) for panel B and 5 (PBS + vehicle); 6 (PBS + 4MU); 8 (BLM + vehicle); and 5 (BLM + 4MU) for panels C and D. Variations in the N are due to violation of a predetermined criteria: repeatedly poor RNA quality and loss of sample (B–D).
4MU treats established pulmonary hypertension
We next examined the capability of 4MU to treat established PH. In this experiment, mice received 4MU or vehicle (control chow) starting on day 33 (Figure 5A), a time point where PH is present in our model (Figure 5A), for 14 days. Consistent with our previous experiment, 4MU resulted in reduced mRNA expression of Has1, Has2 and Has3 observed from flash‐frozen lung samples and vascular protein levels shown by immunofluorescence (IF) (Figure 5B–D). Remarkably, we report higher RVSP levels on day 47 in mice treated with control chow compared with mice on day 33, that are drastically attenuated following treatment with 4MU (Figure 5E). Interestingly, 4MU did not appear to affect RVH when therapy started on day 33 (Figure 5F). No changes in LVSP were observed in these mice (Figure 5G). Consistent with our previous results, 4MU did not affect fibrotic deposition as observed histologically and through Ashcroft scores (Figure 6A, B). RT‐PCR for Col1a1, Col1a2 and Col3a1 did not reveal differences between bleomycin + 4MU and bleomycin + vehicle treatment groups (Figure 6C–E). Interestingly, no significance differences between Hyal1, Hyal2, Hyal3 and CD44 at the mRNA or protein level were detected between bleomycin + vehicle and bleomycin + 4MU groups (Figure 6F–I). However, reduced levels for RhoA guanine nucleotide exchange factor 25 (GEFT) were found in bleomycin‐exposed 4MU‐treated mice compared to bleomycin‐exposure and vehicle treatment (Figure 6I). Determination of hyaluronan fragment size in isolated lung tissue revealed increased LMW hyaluronan fragments in bleomycin‐exposed mice compared to controls; 4MU treatment reduced total hyaluronan fragment size, particularly LMW‐HA (Figure 6J). Taken together, these results highlight the properties of 4MU in reversing PH associated with lung fibrosis, despite not inhibiting FN and Col1a1 levels. These results also show that 4MU does not appear to have an effect on Hyal expression levels but that it may also alter GEFT levels that may be important for PH.
Figure 5.
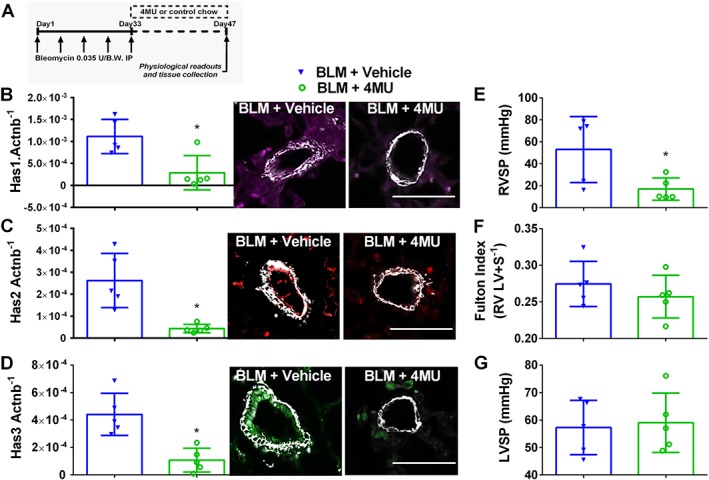
4MU attenuates established pulmonary hypertension. Here mice are treated biweekly for 4 weeks i.p. with bleomycin (BLM; 0.035 U·g−1, i.p.) or PBS; 20 mg·kg−1·day−1 4MU or normal chow was administered beginning on day 33; once PH was established for 2 weeks, measurements were performed on day 47 (A). mRNA expression levels and IF staining for Has1 (violet/purple signals) and αSMA (white signals) (B); Has2 (red signals) and αSMA (white signals) (C) and Has3 (green signals) and αSMA (white signals) (D) normalized to β‐actin (Actnb). RVSP (E), RVH determined from measuring dry RV and LV + septum masses (F); and LVSP (G); BLM + vehicle and BLM + 4MU treatment groups. Data are shown as scatter plot showing the mean ± SD. * P ≤ 0.05, significant difference between BLM + vehicle and BLM + 4MU treatment; unpaired Student's t‐test. The N used for these studies are 5 (BLM + vehicle); and 5 (BLM + 4MU).
Figure 6.
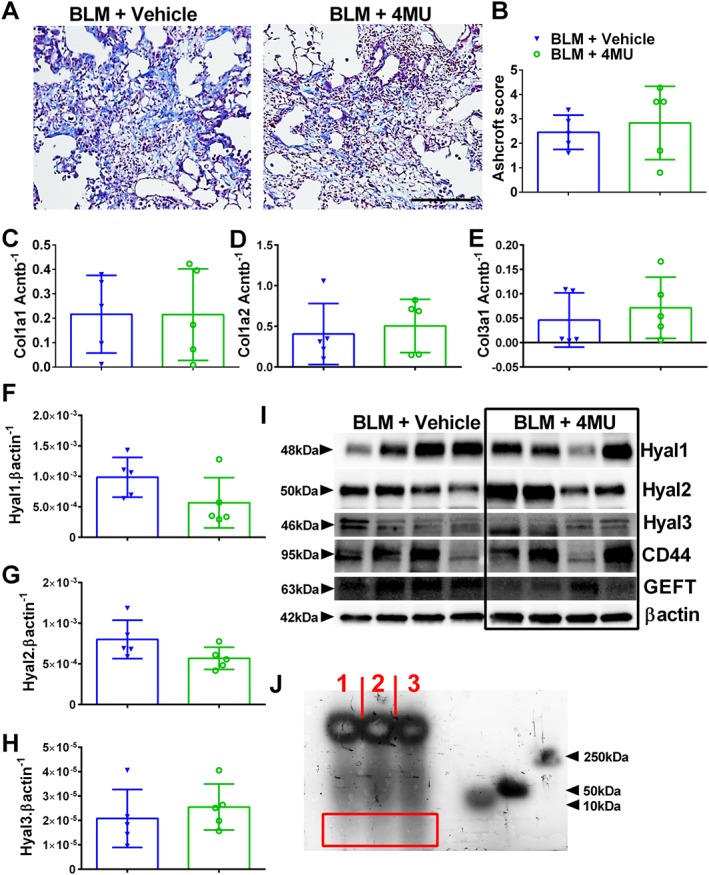
4MU does not affect fibrotic deposition in established PH. Masson's trichrome‐stained lung sections (A) and Ashcroft scores (B) from bleomycin (BLM) or BLM + 4MU‐treated mice. Expression levels of Col1a1 (C), Col1a2 (D), Col3a1 (E), Hyal1 (F), Hyal2 (G) and Hyal3 (H) normalized to β‐actin (Actnb). immunoblots (I) for Hyal1, Hyal2, Hyal3 Cd44, GEFT and β‐actin for four representative mice from BLM + vehicle and BLM + 4MU treatment groups. Hyaluronan fragment size (J) from a PBS (lane 1), BLM + 4MU (lane 2) or a BLM‐exposed (lane 3) lung. The red rectangle highlights an area with LMWHA fragments showing a greater density in lane 3. Data are shown as scatter plot showing the mean ± SD (Panels B–H). The N used for these studies are 5 (BLM + vehicle); and 5 (BLM + 4MU).
Increased vascular hyaluronan‐binding protein 2 (HABP2) is observed
Studies have shown that HA is able to bind with HABP2, an extracellular serine protease that binds hyaluronan and has been implicated in mediating endothelial dysfunction (Mambetsariev et al., 2010). Interestingly, in our study, we show increased levels of HABP2 in remodelled vessels from mice exposed to bleomycin compared with controls, that are subsequently reduced in bleomycin‐exposed mice treated with 4MU (Figure 7). In line with these observations, we report increased HABP2 in and adjacent to remodelled vessels in the lung from patients with IPF + PH compared to IPF and normal lungs (Figure 8A). In support of this data, an immunoblot for HABP2 revealed increased levels in IPF + PH patient samples compared to IPF or normal lungs (Figure 8B, C). Studies have implicated increased signalling of HABP2 and hyaluronan complexes through a RhoA mechanism (Mambetsariev et al., 2010). As such, we examined whether increased signals for GEFT, a protein that interacts with Rho GTPases and is involved in the activation of RhoA and subsequent contraction of vascular smooth muscle (Momotani et al., 2011). Indeed, we report increased GEFT in lung lysates from patients with IPF + PH compared to normal or IPF alone (Figure 8D, E). Remarkably, increased HABP2 was only observed in remodelled vessels and not in fibrotic lesions of the lung as observed in mice lungs exposed to bleomycin and treated with vehicle or 4MU or in fibrotic lesions of patients with IPF + PH (Supporting Information Figure S5). These observations suggest that the interaction between HABP2 and hyaluronan and subsequent RhoA activation may be a unique mechanism contributing to PH associated with lung fibrosis.
Figure 7.
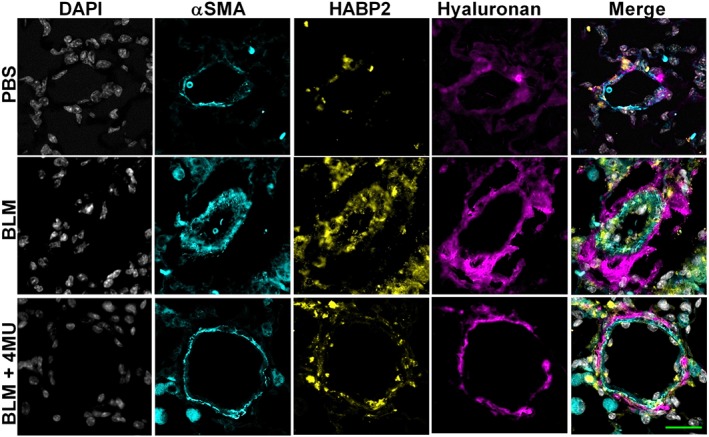
4MU reduces vascular HABP2 levels. Lung sections triple immunofluroescently stained for αSMA (turquoise signals), HABP2 (yellow signals) and hyaluronan (violet/purple signals) and counterstained with DAPI (white/grey signals) from PBS, bleomycin (BLM) or BLM + 4MU‐exposed mice. The scale bar represents 50 μm.
Figure 8.
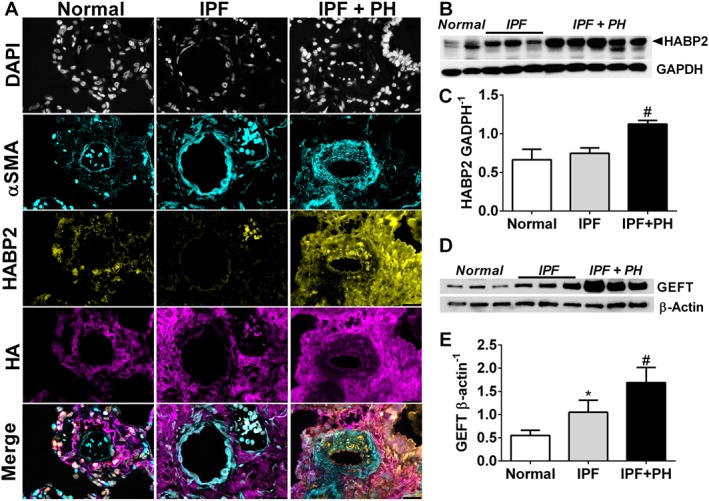
Increased vascular HABP2 is observed in patients with IPF and IPF + PH. Lung sections from a pulmonary vessel showing triple immunofluroescent staining for αSMA (turquoise signals), HABP2 (yellow signals) and HA (violet/purple signals) and counterstained with DAPI (white/grey signals) (A); immunoblots for HABP2 and GADPH (B); densitometry for HABP2 normalized to GADPH (C); immunoblots for GEFT and β‐actin (D); and densitometry for GEFT normalized to β‐actin (E) from normal lung tissue and from lung explants from patients with IPF and IPF + PH. The scale bar represents 50 μm. * P ≤ 0.05, significant difference between normal and IPF + PH values.
Hyaluronan fragments affect PASMC properties
Using human PASMC from normal areas of resected cancer tissue, we demonstrate that MMW and LMW hyaluronan fragments lead to increased proliferation of PASMC that is inhibited by fasudil, a Rho kinase inhibitor (Figure 9A); no significant differences were seen in cytotoxicity between treatment groups (Figure 9B). We next examined the capacity of these cells to migrate using a 3D cell culture protocol (Tseng et al., 2016). In these experiments, we report reduced cell migration in PASMC following treatment with LMW‐HA and ULMW‐HA that was reversed following treatment with Fasudil (Figure 9C). Surprisingly, atomic force microscopy (AFM) experiments revealed that MMW and ULMW‐HA fragments were both able to increase PASMC stiffness that was reversed using fasudil (Figure 9D). AFM measurements were performed in the centre of the cell (Figure 9E). Taken together, these results demonstrate that hyaluronan fragments are able to cause stiffening of PASMC and that LMW‐HA induced increased proliferation but reduced motility of these cells in a Rho‐dependent manner that contribute to the pathophysiology of PH associated with lung fibrosis.
Figure 9.
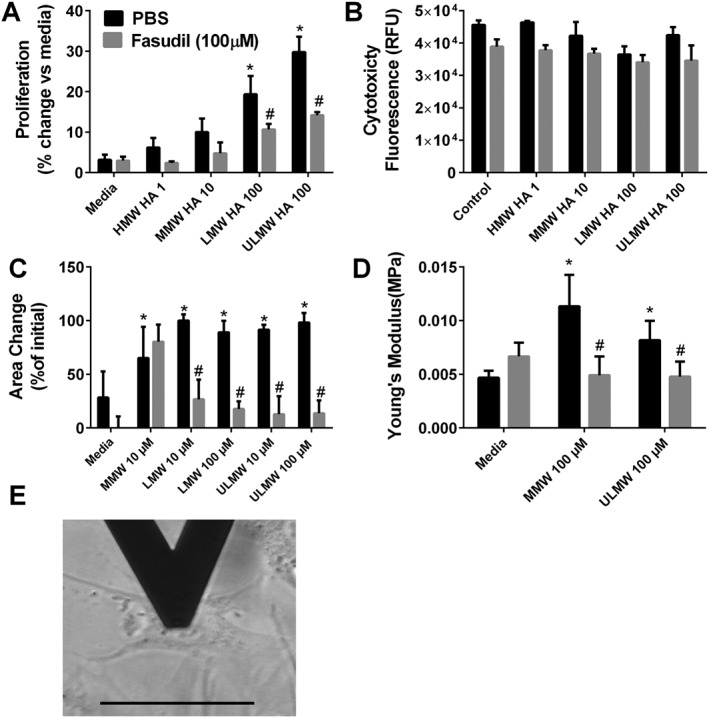
Hyaluronan affects PASMC properties. Cellular proliferation (A) and cytotoxicity (B) from cells exposed to HMW, MMW, LMW or ULMW hyaluronan treated with PBS or fasudil (100 μM). Migration assay for MMW, LMW and ULMW (C). Atomic force microscopy experiments showing increased cells stiffness using Young's modulus for PASMC treated with media only, MMW or ULMW HA (D). Detail of the positioning of the AFM tip on the centre of a PASMC (E). * P ≤ 0.05, significant difference between media and MWM + PBS, LMW + PBS or ULMW + PBS experimental, ANOVA. # P ≤ 0.05, significant difference between PBS and fasudil treatment groups; unpaired Student's t‐test.
Discussion
A major finding of our study is the demonstration that elevated levels of hyaluronan are present in patients with Group III PH and that these correlate not only with increased levels of hyaluronan synthases (HAS) but also with hyaluronidases that degrade HMW hyaluronan to smaller MW fragments that are pathogenic. Provocative results from our study demonstrate that treatment with 4MU, a hyaluronan synthesis inhibitor that also targets HAS mRNA expression, prevented the development of PH and treated established PH associated with lung fibrosis. Our results are remarkable as they show that 4MU is able to attenuate RVSP and vascular remodelling, but it does not appear to affect fibrotic deposition in the lungs. These results point at a unique mechanism for hyaluronan in the pathogenesis of PH. Novel findings from our study demonstrate increased expression of HABP2 and GEFT in remodelled vessels from patients with Group III PH and in experimental models of PH and lung fibrosis. We also show that hyaluronan fragments induce increased PASMC proliferation and stiffness of the cell and also affect cellular migration in a RhoA‐dependent fashion. Taken together, our results demonstrate that elevated hyaluronan is a pathological process modulating PH associated with lung fibrosis that can be treated by inhibiting hyaluronan synthesis or RhoA activation. These results are highly significant given the poor prognosis of patients with chronic lung diseases with an additional diagnosis of PH, where no treatment options are available (Behr and Ryu, 2008).
Elevated hyaluronan has been reported in lung diseases including IPF and PH (Aytekin et al., 2008; Papakonstantinou et al., 2008; Lennon and Singleton, 2011; Li et al., 2011; Garantziotis et al., 2016) and in PH associated with chronic obstructive pulmonary disease (Karmouty‐Quintana et al., 2013). Consistent with these findings, we report increased hyaluronan levels in IPF compared with normal lungs that are elevated further in patients with a diagnosis of PH. Interestingly, our data shows evidence for elevated HAS enzymes in disease. These findings are significant as HAS2 has been shown to promote senescence in fibroblasts in pulmonary fibrosis (Li et al., 2016) suggesting a similar pathogenic role for HAS2 in PASMC. HMW hyaluronan fragments are typically associated with beneficial properties with smaller fragments inducing pathogenic effects through its interaction with cell membrane receptors such as CD44 (Lennon and Singleton, 2011; Wang et al., 2016). Hyaluronidases and ROS have been shown to degrade HMW hyaluronan to lower molecular weight fragments. In line with this, we report increased levels of several hyaluronidases in IPF in addition to a correlation between NRF2 transcripts and elevated mPAP levels in patients in IPF. Taken together, these studies demonstrate that hyaluronan synthesis is up‐regulated, perhaps as a protective response, but that the higher levels of hyaluronidases and oxidative stress lead to degradation of hyaluronan to pathogenic factors. Although the mechanisms that lead to elevated expression of HAS and HYALs are not the focus of this study, we anticipate that activation of the adenosine A2B receptor to modulate this process, consistent with the notion of elevated adenosinergic‐hypoxic axis in PH associated with IPF (Garcia‐Morales et al., 2016) and the role of adenosine in modulating hyaluronan synthesis associated with chronic obstructive pulmonary disease (Karmouty‐Quintana et al., 2013). It is well known that higher molecular fragments of hyaluronan are beneficial (Aytekin et al., 2008). In addition, hyaluronan has been shown to promote progenitor cell renewal and prevent severe fibrosis in mice (Liang et al., 2016). Therefore, an alternative approach to inhibiting hyaluronan synthases would be to prevent the degradation of hyaluronan to the more pathogenic smaller fragments by developing selective inhibitors of hyaluronidases. Interestingly, two patients from our study cohort were treated with N‐acetylcysteine, a compound known to inhibit hyaluronidases (Sunitha et al., 2013). It is worth noting that these patients did not have a diagnosis of PH and one had the lowest levels of mPAP in our cohort.
The mechanisms that lead to the development of PH associated with chronic lung diseases are not fully understood (Hoffmann et al., 2014; Klinger, 2016). Traditional views suggest that eliminating the underlying chronic lung disease such as fibrosis will result in the improvement of PH outcomes. Although studies have shown that inhibition of fibrotic deposition or airspace enlargement in the lungs improves PH (Karmouty‐Quintana et al., 2012; Karmouty‐Quintana et al., 2013), the identification of a unique mechanism leading to PH associated with lung fibrosis has been elusive. Surprisingly, our results show that inhibiting hyaluronan synthesis by 4MU prevents the development of PH and reduces established PH without affecting fibrotic deposition in the lungs. An explanation for these results may reside in the fact that although hyaluronan levels were reduced, the levels may still be high enough to maintain fibroproliferative lesions. Alternatively, findings demonstrating a protective role for hyaluronan in severe fibrosis could also help explain our findings (Liang et al., 2016).
These effects are consistent with reduced Has transcripts and vascular Has levels seen by IF. Consistent with previous publications showing a beneficial effect for 4MU (Arai et al., 2011; McKallip et al., 2013; McKallip et al., 2015), our results demonstrate that 4MU treatment attenuated bleomycin‐induced vascular remodelling, elevated RVSP and RVH and led to an increased arterial oxygenation. It is important to note that in experiments where 4MU was administered in established PH (on day 33 vs. 15), RVSP but not RVH was attenuated. In our model, we believe that lung vascular remodelling precedes RVH; thus, we anticipate that in already established PH, a longer treatment time may be necessary to have an effect on RVH. Despite this, these results point at a potential use for 4MU in patients with IPF with the aim of preventing the development of PH. Lowering elevated mPAP levels in patients with Group III PH and preventing the development of PH in patients with IPF would be a valuable clinical outcome, as PH in IPF is strongly associated with mortality (Klinger, 2016). However, it is important to note that despite these observations, there is still controversy over whether treating PH in the setting of IPF improves survival, despite early improvements in functional status and quality of life (Hoeper et al., 2015). However, in those studies, the effects of a vasodilator were evaluated (Hoeper et al., 2015), and it remains possible that therapies that are aimed to alter the process of vascular remodelling would have greater beneficial effects. It is also important to mention that patients with IPF + PH who have a lung transplant, have worse outcomes that those without PH, suggesting that treating PH might lead to similar outcomes to those patients with IPF and no PH. Moreover, reducing elevated mPAP levels in patients with chronic lung diseases and out‐of‐proportion PH would enable these patients to become eligible for lung transplantation, a procedure that is often unavailable for them. The doses of 4MU we have used here, while lower than some studies, especially those that characterized the pharmacokinetics of this drug, were able to produce a physiological response and detectable levels in the plasma of the treated animals (Kuipers et al., 2016). This dose is similar to the dose used in a human clinical study in motor disorders of the bile ducts (Abate et al., 2001). These results may indicate that inhibition of HA production in the lung is possible with comparatively lower doses of 4MU, leading to the potential to use less drug and consequently produce fewer side effects.
In our effort to identify how elevated hyaluronan may play a role in the development of PH, we identified increased expression of HABP2 in remodelled vessels of patients with Group III PH and in experimental models of PH and lung fibrosis. Interestingly, increased HABP2 appeared to be localized in remodelled vessels and was not observed in areas rich in fibroproliferative injury. Increased HABP2 has been shown to down‐regulate vascular integrity through a RhoA‐dependent mechanism (Mambetsariev et al., 2010). In line with this, we report increased expression of GEFT, an essential component of the RhoA pathway activation that has been linked to hyperplasia of vascular smooth muscle cells (Gadang et al., 2014). In subsequent experiments, we demonstrated that LMW and ULMW hyaluronan fragments induced increased proliferation of isolated human PASMC that were inhibited by the RhoA inhibitor fasudil. These studies are consistent with the capacity of hyaluronan to induce cellular proliferation (Papakonstantinou and Karakiulakis, 2009; Lennon and Singleton, 2011; Garantziotis et al., 2016) and demonstrate a novel role for fasudil in hyaluronan‐induced PASMC proliferation. Furthermore, in contrast to published experiments showing increased cellular migration by hyaluronan (Lennon and Singleton, 2011; Garantziotis et al., 2016; Wang et al., 2016), our studies show that cellular migration PASMC is drastically inhibited by LMW and ULMW hyaluronan fragments in a RhoA‐dependent manner. These differences may derive from the fact that most cells where hyaluronan‐induced cellular migration has been reported are in cancer cells (Papakonstantinou and Karakiulakis, 2009; Lennon and Singleton, 2011; Garantziotis et al., 2016) that are prone to migration. However, our results showing reduced cellular migration are in line with increased PASMC stiffness observed by AFM following exposure to hyaluronan. These observations are consistent with increased vascular stiffness induced by hyaluronan accumulation in the aorta (Lorentzen et al., 2016). Interestingly, in this study, increased proliferation of vascular smooth muscle cells was also associated with increased hyaluronan accumulation. This is consistent with experiments showing increased PASMC proliferation when grown in substrates with similar stiffness as that seen in distal vessels in PH (Liu et al., 2016). Taken together, our results show that increased HABP2 and GEFT are present in remodelled vessels of patients with Group III PH. Our data shows evidence that hyaluronan fragments are able to induce both cellular proliferation and increased stiffness of PASMC while attenuating migration of these cells that contribute to the development of PH. These findings would support the use of fasudil for the treatment of Group III PH. Indeed, fasudil has been used in Group I PH where it has shown promising results (Antoniu, 2012) and is effective in models of lung fibrosis (Jiang et al., 2012; Bei et al., 2013), although its potential as a treatment for Group III PH has not yet been fully evaluated. Another promising approach is the development of inhibitors of HABP2, a protein that is strongly associated with the development of Group III PH and has recently been linked with cancer (Mirzapoiazova et al., 2015).
Author contributions
S.D.C., A.G. and H.K.‐Q. conceived of and designed the study. S.D.C., N.‐Y.C., A.M.H., A.H., T.C.J.M., T.W., F.L., J.G.M., J.A.‐G., O.A.‐J., W.S., N.S. and H.K.‐Q. acquired the data. S.D.C., T.C.J.M., H.S., T.W., J.D., J.A.‐G., K.Y., W.S., I.P.H., N.W.M., J.R., P.L.B., B.H.A., S.J. and H.K.‐Q. performed the analysis and/or interpretation of the data. S.D.C., H.K.‐Q., A.M.H., H.S., N.‐Y.C., and A.H. were responsible for drafting the manuscript. S.D.C., T.C.J.M., T.W., F.L., J.G.M., J.D., I.P.H., N.W.M., J.A.‐G., K.Y., W.S., J.R., P.L.B., B.H.A., O.A.‐J., S.J., N.S., A.G. and H.K.‐Q. revised the manuscript critically for important intellectual content. All of the authors approved the final version of the manuscript for publication.
Conflict of interest
The authors declare no conflicts of interest.
Declaration of transparency and scientific rigour
This Declaration acknowledges that this paper adheres to the principles for transparent reporting and scientific rigour of preclinical research recommended by funding agencies, publishers and other organisations engaged with supporting research.
Supporting information
Table S1 List of primers used.
Table S2 List of BioRad primers used.
Table S3 List of primary antibodies used.
Figure S1 Mass of chow consumed. Mass (g) of chow consumed for mice treated with regular (control) chow or medicated chow with 4MU on days 1 and 30. Data is presented as mean + SEM. n = 5 for all groups.
Figure S2 HAS2, HAS3 NRF2 and CD44 levels in human samples. Immunofluorescence (IF) for HAS2 (red signals), or HAS3 (green signals) and αSMA (white signals) for normal IPF and IPF + PH vessels (A); scale bar represents 50 μm. (B) Immunoblots for HAS1–3, HYAL1–3, CD44 and βactin from 3 normal, 3 IPF and 3 IPF + PH lung tissue samples. Linear regression and Spearman correlation between NRF2 expression levels and mPAP values for patients with IPF with or without a diagnosis of PH (C). Linear regression and Spearman correlation between CD44 expression levels and mPAP values for patients with IPF with or without a diagnosis of PH (D). Expression levels for HAS1–3 and HYAL1–3 showing direct comparisons between IPF and IPF + PH samples (E). Significance levels * P ≤ 0.05 refers to comparisons between IPF and IPF + PH values.
Figure S3 Hyaluronidases in mouse samples. Immunoblots of 2 PBS [+vehicle], 3 BLM [+vehicle] and 3 BLM + 4MU for Hyal1, Hyal2, Hyal3, Cd44 and βactin (A). Transcript levels for Hyal1 (B), Hyal2 (C), Hyal3 (D), Cd44 (E) and Nrf2 (F). The N number used for these studies are 5 (PBS + Vehicle); 6 (PBS + 4MU); 8 (BLM + Vehicle); and 5 (BLM + 4MU). Significance level * P ≤ 0.05 refers to ANOVA comparisons between PBS + Vehicle and BLM + Vehicle treatment groups. Variations in the N number are due to violation of a predetermined criteria: repeatedly poor RNA quality and loss of sample (B‐D).
Figure S4 Additional haemodynamic data and 4MU / 4MUG levels in plasma. Left ventricle systolic pressure (LVSP) (A) and heart rate (B) from PBS (PBS) + vehicle, PBS + 4MU, bleomycin (BLM) + vehicle, and BLM + 4MU treatment groups. Data is shown as a scatter plot showing the mean ± SD. The N number used for these studies are 8 (PBS + Vehicle); 7 (PBS + 4MU); 7 (BLM + Vehicle); and 6 (BLM + 4MU) for panel A and 10 (PBS + Vehicle); 10 (PBS + 4MU); 10 (BLM + Vehicle); and 8 (BLM + 4MU) for panel B. Plasma levels for 4‐methylumbelliferone (4MU) and its metabolite: 4‐methylumbelliferyl‐β‐D‐glucuronide (4MUG) from PBS + Vehicle; PBS + 4MU; BLM + Vehicle; and BLM + 4MU treatment groups. n = 5 for all groups. Significance level * P ≤ 0.05 refers to ANOVA comparisons between PBS + Vehicle and BLM + Vehicle treatment groups. # P ≤ 0.05 refers to ANOVA comparisons between PBS + 4MU and BLM + 4MU treatment groups. Variations in the N number are due a violation of a predetermined criteria: heart rates below 250 BPM at the time LVSP determination (A) or below 250 BPM at the time of RVSP determination (B).
Figure S5 HABP2 expression is not present in the lung parenchyma. Lung sections triple immunofluroescently (IF) stained for αsmooth muscle actin (α‐SMA/ turquoise signals), HABP2 (yellow signals), and hyaluronan (HA; violet/purple signals) and counterstained with DAPI (white/grey signals). No HABP2 signals are observed in the lung parenchyma from patients with IPF.
Acknowledgements
The authors thank Jacob Gage, PhD, and Glauco A Souza, PhD, from N3DNano for their help in performing the migration studies; Jianhua (James) Gu, PhD, from the Houston Methodist Electron Microscopy Core for the help with the AFM study; and Jessica B. Flowers, PhD, RD from Harlan (now Envigo) for the help in preparing the medicated chow with 4MU. We thank the American Heart Association for support (14SDG18550039) to HKQ and for the 2013 Entelligence MD Actelion Award to HKQ.
Collum, S. D. , Chen, N.‐Y. , Hernandez, A. M. , Hanmandlu, A. , Sweeney, H. , Mertens, T. C. J. , Weng, T. , Luo, F. , Molina, J. G. , Davies, J. , Horan, I. P. , Morrell, N. W. , Amione‐Guerra, J. , Al‐Jabbari, O. , Youker, K. , Sun, W. , Rajadas, J. , Bollyky, P. L. , Akkanti, B. H. , Jyothula, S. , Sinha, N. , Guha, A. , and Karmouty‐Quintana, H. (2017) Inhibition of hyaluronan synthesis attenuates pulmonary hypertension associated with lung fibrosis. British Journal of Pharmacology, 174: 3284–3301. doi: 10.1111/bph.13947.
References
- Abate A, Dimartino V, Spina P, Costa PL, Lombardo C, Santini A et al (2001). Hymecromone in the treatment of motor disorders of the bile ducts: a multicenter, double‐blind, placebo‐controlled clinical study. Drugs Exp Clin Res 27: 223–231. [PubMed] [Google Scholar]
- Alexander SPH, Fabbro D, Kelly E, Marrion N, Peters JA, Benson HE et al (2015a). The Concise Guide to PHARMACOLOGY 2015/16: Enzymes. Br J Pharmacol 172: 6024–6109. [DOI] [PMC free article] [PubMed] [Google Scholar]
- Alexander SPH, Davenport AP, Kelly E, Marrion N, Peters JA, Benson HE et al (2015b). The Concise Guide to PHARMACOLOGY 2015/16: G protein‐coupled receptors. Br J Pharmacol 172: 5744–5869. [DOI] [PMC free article] [PubMed] [Google Scholar]
- Antoniu SA (2012). Targeting RhoA/ROCK pathway in pulmonary arterial hypertension. Expert Opin Ther Targets 16: 355–363. [DOI] [PubMed] [Google Scholar]
- Arai E, Nishida Y, Wasa J, Urakawa H, Zhuo L, Kimata K et al (2011). Inhibition of hyaluronan retention by 4‐methylumbelliferone suppresses osteosarcoma cells in vitro and lung metastasis in vivo. Br J Cancer 105: 1839–1849. [DOI] [PMC free article] [PubMed] [Google Scholar]
- Archer SL, Weir EK, Wilkins MR (2010). Basic science of pulmonary arterial hypertension for clinicians: new concepts and experimental therapies. Circulation 121: 2045–2066. [DOI] [PMC free article] [PubMed] [Google Scholar]
- Aytekin M, Comhair SA, de la Motte C, Bandyopadhyay SK, Farver CF, Hascall VC et al (2008). High levels of hyaluronan in idiopathic pulmonary arterial hypertension. Am J Physiol Lung Cell Mol Physiol 295: L789–L799. [DOI] [PMC free article] [PubMed] [Google Scholar]
- Behr J, Ryu JH (2008). Pulmonary hypertension in interstitial lung disease. Eur Respir J 31: 1357–1367. [DOI] [PubMed] [Google Scholar]
- Bei Y, Hua‐Huy T, Duong‐Quy S, Nguyen VH, Chen W, Nicco C et al (2013). Long‐term treatment with fasudil improves bleomycin‐induced pulmonary fibrosis and pulmonary hypertension via inhibition of Smad2/3 phosphorylation. Pulm Pharmacol Ther 26: 635–643. [DOI] [PubMed] [Google Scholar]
- Bjermer L, Lundgren R, Hallgren R (1989). Hyaluronan and type III procollagen peptide concentrations in bronchoalveolar lavage fluid in idiopathic pulmonary fibrosis. Thorax 44: 126–131. [DOI] [PMC free article] [PubMed] [Google Scholar]
- Chowdhury B, Hemming R, Faiyaz S, Triggs‐Raine B (2016). Hyaluronidase 2 (HYAL2) is expressed in endothelial cells, as well as some specialized epithelial cells, and is required for normal hyaluronan catabolism. Histochem Cell Biol 145: 53–66. [DOI] [PubMed] [Google Scholar]
- Collum SD, Amione‐Guerra J, Cruz‐Solbes AS, DiFrancesco A, Hernandez AM, Hanmandlu A et al (2017). Pulmonary hypertension associated with idiopathic pulmonary fibrosis: current and future perspectives. Can Respir J 2017 1430350. [DOI] [PMC free article] [PubMed] [Google Scholar]
- Curtis MJ, Bond RA, Spina D, Ahluwalia A, Alexander SP, Giembycz MA et al (2015). Experimental design and analysis and their reporting: new guidance for publication in BJP. Br J Pharmacol 172: 3461–3471. [DOI] [PMC free article] [PubMed] [Google Scholar]
- Esser PR, Wolfle U, Durr C, von Loewenich FD, Schempp CM, Freudenberg MA et al (2012). Contact sensitizers induce skin inflammation via ROS production and hyaluronic acid degradation. PLoS One 7: e41340. [DOI] [PMC free article] [PubMed] [Google Scholar]
- Gadang V, Konaniah E, Hui DY, Jaeschke A (2014). Mixed‐lineage kinase 3 deficiency promotes neointima formation through increased activation of the RhoA pathway in vascular smooth muscle cells. Arterioscler Thromb Vasc Biol 34: 1429–1436. [DOI] [PMC free article] [PubMed] [Google Scholar]
- Garantziotis S, Brezina M, Castelnuovo P, Drago L (2016). The role of hyaluronan in the pathobiology and treatment of respiratory disease. Am J Physiol Lung Cell Mol Physiol 310: L785–L795. [DOI] [PMC free article] [PubMed] [Google Scholar]
- Garcia‐Morales LJ, Chen NY, Weng T, Luo F, Davies J, Philip K et al (2016). Altered hypoxic‐adenosine axis and metabolism in group III pulmonary hypertension. Am J Respir Cell Mol Biol 54: 574–583. [DOI] [PMC free article] [PubMed] [Google Scholar]
- Hoeper MM, Behr J, Held M, Grunig E, Vizza CD, Vonk‐Noordegraaf A et al (2015). Pulmonary hypertension in patients with chronic fibrosing idiopathic interstitial pneumonias. PLoS One 10: e0141911. [DOI] [PMC free article] [PubMed] [Google Scholar]
- Hoffmann J, Wilhelm J, Marsh LM, Ghanim B, Klepetko W, Kovacs G et al (2014). Distinct differences in gene expression patterns in pulmonary arteries of patients with chronic obstructive pulmonary disease and idiopathic pulmonary fibrosis with pulmonary hypertension. Am J Respir Crit Care Med 190: 98–111. [DOI] [PubMed] [Google Scholar]
- Hubner RH, Gitter W, El Mokhtari NE, Mathiak M, Both M, Bolte H et al (2008). Standardized quantification of pulmonary fibrosis in histological samples. Biotechniques 44: 507–511 514‐507. [DOI] [PubMed] [Google Scholar]
- Jiang C, Huang H, Liu J, Wang Y, Lu Z, Xu Z (2012). Fasudil, a Rho‐kinase inhibitor, attenuates bleomycin‐induced pulmonary fibrosis in mice. Int J Mol Sci 13: 8293–8307. [DOI] [PMC free article] [PubMed] [Google Scholar]
- Kakizaki I, Kojima K, Takagaki K, Endo M, Kannagi R, Ito M et al (2004). A novel mechanism for the inhibition of hyaluronan biosynthesis by 4‐methylumbelliferone. J Biol Chem 279: 33281–33289. [DOI] [PubMed] [Google Scholar]
- Karmouty‐Quintana H, Weng T, Garcia‐Morales LJ, Chen NY, Pedroza M, Zhong H et al (2013). Adenosine A2B receptor and hyaluronan modulate pulmonary hypertension associated with chronic obstructive pulmonary disease. Am J Respir Cell Mol Biol 49: 1038–1047. [DOI] [PMC free article] [PubMed] [Google Scholar]
- Karmouty‐Quintana H, Zhong H, Acero L, Weng T, Melicoff E, West JD et al (2012). The A2B adenosine receptor modulates pulmonary hypertension associated with interstitial lung disease. FASEB journal 26: 2546–2557. [DOI] [PMC free article] [PubMed] [Google Scholar]
- Kilkenny C, Browne W, Cuthill IC, Emerson M, Altman DG (2010). Animal research: reporting in vivo experiments: the ARRIVE guidelines. Br J Pharmacol 160: 1577–1579. [DOI] [PMC free article] [PubMed] [Google Scholar]
- Klinger JR (2016). Group III pulmonary hypertension: pulmonary hypertension associated with lung disease: epidemiology, pathophysiology, and treatments. Cardiol Clin 34: 413–433. [DOI] [PubMed] [Google Scholar]
- Kuipers HF, Nagy N, Ruppert SM, Sunkari VG, Marshall PL, Gebe JA et al (2016). The pharmacokinetics and dosing of oral 4‐methylumbelliferone for inhibition of hyaluronan synthesis in mice. Clin Exp Immunol 185: 372–381. [DOI] [PMC free article] [PubMed] [Google Scholar]
- Kultti A, Pasonen‐Seppanen S, Jauhiainen M, Rilla KJ, Karna R, Pyoria E et al (2009). 4‐Methylumbelliferone inhibits hyaluronan synthesis by depletion of cellular UDP‐glucuronic acid and downregulation of hyaluronan synthase 2 and 3. Exp Cell Res 315: 1914–1923. [DOI] [PubMed] [Google Scholar]
- Lennon FE, Singleton PA (2011). Role of hyaluronan and hyaluronan‐binding proteins in lung pathobiology. Am J Physiol Lung Cell Mol Physiol 301: L137–L147. [DOI] [PMC free article] [PubMed] [Google Scholar]
- Lettieri CJ, Nathan SD, Barnett SD, Ahmad S, Shorr AF (2006). Prevalence and outcomes of pulmonary arterial hypertension in advanced idiopathic pulmonary fibrosis. Chest 129: 746–752. [DOI] [PubMed] [Google Scholar]
- Li Y, Jiang D, Liang J, Meltzer EB, Gray A, Miura R et al (2011). Severe lung fibrosis requires an invasive fibroblast phenotype regulated by hyaluronan and CD44. J Exp Med 208: 1459–1471. [DOI] [PMC free article] [PubMed] [Google Scholar]
- Li Y, Liang J, Yang T, Monterrosa Mena J, Huan C, Xie T et al (2016). Hyaluronan synthase 2 regulates fibroblast senescence in pulmonary fibrosis. Matrix Biol 55: 35–48. [DOI] [PMC free article] [PubMed] [Google Scholar]
- Liang J, Zhang Y, Xie T, Liu N, Chen H, Geng Y et al (2016). Hyaluronan and TLR4 promote surfactant‐protein‐C‐positive alveolar progenitor cell renewal and prevent severe pulmonary fibrosis in mice. Nat Med 22: 1285–1293. [DOI] [PMC free article] [PubMed] [Google Scholar]
- Liu F, Haeger CM, Dieffenbach PB, Sicard D, Chrobak I, Coronata AM et al (2016). Distal vessel stiffening is an early and pivotal mechanobiological regulator of vascular remodeling and pulmonary hypertension. JCI insight 1 pii: e86987. [DOI] [PMC free article] [PubMed] [Google Scholar]
- Lorentzen KA, Chai S, Chen H, Danielsen CC, Simonsen U, Wogensen L (2016). Mechanisms involved in extracellular matrix remodeling and arterial stiffness induced by hyaluronan accumulation. Atherosclerosis 244: 195–203. [DOI] [PubMed] [Google Scholar]
- Mambetsariev N, Mirzapoiazova T, Mambetsariev B, Sammani S, Lennon FE, Garcia JG et al (2010). Hyaluronic acid binding protein 2 is a novel regulator of vascular integrity. Arterioscler Thromb Vasc Biol 30: 483–490. [DOI] [PMC free article] [PubMed] [Google Scholar]
- McGrath JC, Lilley E (2015). Implementing guidelines on reporting research using animals (ARRIVE etc.): new requirements for publication in BJP. Br J Pharmacol 172: 3189–3193. [DOI] [PMC free article] [PubMed] [Google Scholar]
- McKallip RJ, Ban H, Uchakina ON (2015). Treatment with the hyaluronic acid synthesis inhibitor 4‐methylumbelliferone suppresses LPS‐induced lung inflammation. Inflammation 38: 1250–1259. [DOI] [PubMed] [Google Scholar]
- McKallip RJ, Hagele HF, Uchakina ON (2013). Treatment with the hyaluronic acid synthesis inhibitor 4‐methylumbelliferone suppresses SEB‐induced lung inflammation. Toxins 5: 1814–1826. [DOI] [PMC free article] [PubMed] [Google Scholar]
- Mirzapoiazova T, Mambetsariev N, Lennon FE, Mambetsariev B, Berlind JE, Salgia R et al (2015). HABP2 is a novel regulator of hyaluronan‐mediated human lung cancer progression. Front Oncol 5: 164. [DOI] [PMC free article] [PubMed] [Google Scholar]
- Momotani K, Artamonov MV, Utepbergenov D, Derewenda U, Derewenda ZS, Somlyo AV (2011). p63RhoGEF couples Galpha(q/11)‐mediated signaling to Ca2+ sensitization of vascular smooth muscle contractility. Circ Res 109: 993–1002. [DOI] [PMC free article] [PubMed] [Google Scholar]
- Moore BB, Hogaboam CM (2008). Murine models of pulmonary fibrosis. Am J Physiol Lung Cell Mol Physiol 294: L152–L160. [DOI] [PubMed] [Google Scholar]
- Morrell NW, Yang X, Upton PD, Jourdan KB, Morgan N, Sheares KK et al (2001). Altered growth responses of pulmonary artery smooth muscle cells from patients with primary pulmonary hypertension to transforming growth factor‐beta(1) and bone morphogenetic proteins. Circulation 104: 790–795. [DOI] [PubMed] [Google Scholar]
- Nathan SD, Noble PW, Tuder RM (2007). Idiopathic pulmonary fibrosis and pulmonary hypertension: connecting the dots. Am J Respir Crit Care Med 175: 875–880. [DOI] [PubMed] [Google Scholar]
- Papakonstantinou E, Karakiulakis G (2009). The ‘sweet’ and ‘bitter’ involvement of glycosaminoglycans in lung diseases: pharmacotherapeutic relevance. Br J Pharmacol 157: 1111–1127. [DOI] [PMC free article] [PubMed] [Google Scholar]
- Papakonstantinou E, Kouri FM, Karakiulakis G, Klagas I, Eickelberg O (2008). Increased hyaluronic acid content in idiopathic pulmonary arterial hypertension. Eur Respir J 32: 1504–1512. [DOI] [PubMed] [Google Scholar]
- Patel NM, Lederer DJ, Borczuk AC, Kawut SM (2007). Pulmonary hypertension in idiopathic pulmonary fibrosis. Chest 132: 998–1006. [DOI] [PubMed] [Google Scholar]
- Pellegrino R, Viegi G, Brusasco V, Crapo RO, Burgos F, Casaburi R et al (2005). Interpretative strategies for lung function tests. Eur Respir J 26: 948–968. [DOI] [PubMed] [Google Scholar]
- Poor HD, Girgis R, Studer SM (2012). World Health Organization Group III pulmonary hypertension. Prog Cardiovasc Dis 55: 119–127. [DOI] [PubMed] [Google Scholar]
- Raghu G, Collard HR, Egan JJ, Martinez FJ, Behr J, Brown KK et al (2011). An official ATS/ERS/JRS/ALAT statement: idiopathic pulmonary fibrosis: evidence‐based guidelines for diagnosis and management. Am J Respir Crit Care Med 183: 788–824. [DOI] [PMC free article] [PubMed] [Google Scholar]
- Shorr AF, Wainright JL, Cors CS, Lettieri CJ, Nathan SD (2007). Pulmonary hypertension in patients with pulmonary fibrosis awaiting lung transplant. Eur Respir J 30: 715–721. [DOI] [PubMed] [Google Scholar]
- Southan C, Sharman JL, Benson HE, Faccenda E, Pawson AJ, Alexander SPH et al (2016). The IUPHAR/BPS guide to PHARMACOLOGY in 2016: towards curated quantitative interactions between 1300 protein targets and 6000 ligands. Nucl Acids Res 44: D1054–D1068. [DOI] [PMC free article] [PubMed] [Google Scholar]
- Sunitha K, Suresh P, Santhosh MS, Hemshekhar M, Thushara RM, Marathe GK et al (2013). Inhibition of hyaluronidase by N‐acetyl cysteine and glutathione: role of thiol group in hyaluronan protection. Int J Biol Macromol 55: 39–46. [DOI] [PubMed] [Google Scholar]
- Takeda S, Aburada M (1981). The choleretic mechanism of coumarin compounds and phenolic compounds. J Pharmacobiodyn 4: 724–734. [DOI] [PubMed] [Google Scholar]
- Tseng H, Gage JA, Haisler WL, Neeley SK, Shen T, Hebel C et al (2016). A high‐throughput in vitro ring assay for vasoactivity using magnetic 3D bioprinting. Sci Rep 6: 30640. [DOI] [PMC free article] [PubMed] [Google Scholar]
- Wang D, Narula N, Azzopardi S, Smith RS, Nasar A, Altorki NK et al (2016). Expression of the receptor for hyaluronic acid mediated motility (RHAMM) is associated with poor prognosis and metastasis in non‐small cell lung carcinoma. Oncotarget 7: 39957–39969. [DOI] [PMC free article] [PubMed] [Google Scholar]
Associated Data
This section collects any data citations, data availability statements, or supplementary materials included in this article.
Supplementary Materials
Table S1 List of primers used.
Table S2 List of BioRad primers used.
Table S3 List of primary antibodies used.
Figure S1 Mass of chow consumed. Mass (g) of chow consumed for mice treated with regular (control) chow or medicated chow with 4MU on days 1 and 30. Data is presented as mean + SEM. n = 5 for all groups.
Figure S2 HAS2, HAS3 NRF2 and CD44 levels in human samples. Immunofluorescence (IF) for HAS2 (red signals), or HAS3 (green signals) and αSMA (white signals) for normal IPF and IPF + PH vessels (A); scale bar represents 50 μm. (B) Immunoblots for HAS1–3, HYAL1–3, CD44 and βactin from 3 normal, 3 IPF and 3 IPF + PH lung tissue samples. Linear regression and Spearman correlation between NRF2 expression levels and mPAP values for patients with IPF with or without a diagnosis of PH (C). Linear regression and Spearman correlation between CD44 expression levels and mPAP values for patients with IPF with or without a diagnosis of PH (D). Expression levels for HAS1–3 and HYAL1–3 showing direct comparisons between IPF and IPF + PH samples (E). Significance levels * P ≤ 0.05 refers to comparisons between IPF and IPF + PH values.
Figure S3 Hyaluronidases in mouse samples. Immunoblots of 2 PBS [+vehicle], 3 BLM [+vehicle] and 3 BLM + 4MU for Hyal1, Hyal2, Hyal3, Cd44 and βactin (A). Transcript levels for Hyal1 (B), Hyal2 (C), Hyal3 (D), Cd44 (E) and Nrf2 (F). The N number used for these studies are 5 (PBS + Vehicle); 6 (PBS + 4MU); 8 (BLM + Vehicle); and 5 (BLM + 4MU). Significance level * P ≤ 0.05 refers to ANOVA comparisons between PBS + Vehicle and BLM + Vehicle treatment groups. Variations in the N number are due to violation of a predetermined criteria: repeatedly poor RNA quality and loss of sample (B‐D).
Figure S4 Additional haemodynamic data and 4MU / 4MUG levels in plasma. Left ventricle systolic pressure (LVSP) (A) and heart rate (B) from PBS (PBS) + vehicle, PBS + 4MU, bleomycin (BLM) + vehicle, and BLM + 4MU treatment groups. Data is shown as a scatter plot showing the mean ± SD. The N number used for these studies are 8 (PBS + Vehicle); 7 (PBS + 4MU); 7 (BLM + Vehicle); and 6 (BLM + 4MU) for panel A and 10 (PBS + Vehicle); 10 (PBS + 4MU); 10 (BLM + Vehicle); and 8 (BLM + 4MU) for panel B. Plasma levels for 4‐methylumbelliferone (4MU) and its metabolite: 4‐methylumbelliferyl‐β‐D‐glucuronide (4MUG) from PBS + Vehicle; PBS + 4MU; BLM + Vehicle; and BLM + 4MU treatment groups. n = 5 for all groups. Significance level * P ≤ 0.05 refers to ANOVA comparisons between PBS + Vehicle and BLM + Vehicle treatment groups. # P ≤ 0.05 refers to ANOVA comparisons between PBS + 4MU and BLM + 4MU treatment groups. Variations in the N number are due a violation of a predetermined criteria: heart rates below 250 BPM at the time LVSP determination (A) or below 250 BPM at the time of RVSP determination (B).
Figure S5 HABP2 expression is not present in the lung parenchyma. Lung sections triple immunofluroescently (IF) stained for αsmooth muscle actin (α‐SMA/ turquoise signals), HABP2 (yellow signals), and hyaluronan (HA; violet/purple signals) and counterstained with DAPI (white/grey signals). No HABP2 signals are observed in the lung parenchyma from patients with IPF.