

Tissue matrix scaffold is an advanced tissue-mimicry 3D culture system for biomedical research and drug screening.
Abstract
Most of the anticancer drug candidates entering preclinical trials fail to be approved for clinical applications. The following are among the main causes of these failures: studying molecular mechanisms of cancer development, identifying therapeutic targets, and testing drug candidates using inappropriate tissue culture models, which do not recapitulate the native microenvironment where the cancer cells originate. It has become clear that three-dimensional (3D) cell cultures are more biologically and clinically relevant than 2D models. The spatial and mechanical conditions of 3D cultures enable the cancer cells to display heterogeneous growth, assume diverse phenotypes, express distinct gene and protein products, and attain metastatic potential and resistance to drugs that are reminiscent of tumors in humans. However, the current 3D culture systems using synthetic polymers or selected components of the extracellular matrix (ECM) are defective (particularly the biophysical and biochemical properties of the native ECM) and remain distant to optimally support the signaling cue–oriented cell survival and growth. We introduce a reconstitutable tissue matrix scaffold (TMS) system fabricated using native tissue ECM, with tissue-like architecture and resilience. The structural and compositional properties of TMS favor robust cell survival, proliferation, migration, and invasion in culture and vascularized tumor formation in animals. The combination of porous and hydrogel TMS allows compartmental culture of cancerous and stromal cells, which are distinguishable by biomarkers. The response of the cancer cells grown on TMS to drugs well reflects animal and clinical observations. TMS enables more biologically relevant studies and is suitable for preclinical drug screening.
INTRODUCTION
Cancer cells in human tissues have contacts with the extracellular matrix (ECM) in all directions and interact with other cells of the same (or different) type in their vicinity. The biological activities of the cells not only are passively affected by the physicochemical changes of the ECM but also actively modify the ECM by applying expansion forces and by secreting enzymes that facilitate the survival and spread of the cancer cells. It is conceivable that the tumor locus is a spatial and temporal microenvironment undergoing consistent remodeling with molecular relays at extracellular, intercellular, and intracellular levels. With the increasing understanding of the microenvironment of tumor tissues and the signaling cue–oriented cell phenotypes, many tumor biomedical studies that investigate cell signaling, gene and small-molecule expression, and drug sensitivities have adopted different three-dimensional (3D) tissue culture models (1). Overall, cancer cells grown in 3D cultures display different morphologies, motilities, and proliferation capacities (2, 3) and exhibit higher resistance to anticancer drugs (4, 5) compared to those on flat surfaces.
Cell spheroids and scaffolds are the most popular 3D tissue culture models currently used in the field. Spheroids are clusters of cells that are often applied to mimic breast acinar structures, model epithelial cancer formation, and assess endothelial cell angiogenesis (2, 6, 7). However, they are not considered ideal models for cancer studies because of the inconsistencies in their formation [which varies with cell types (6)], the challenges encountered in handling them, the absence of tissue ECM components, and their controversial biological relevance (8). Scaffolds exist in hydrogel or porous forms and are made from either natural materials or synthetic polymers, as previously described (1, 9, 10). Hydrogels prepared from specific component(s) of the ECM (such as collagen and fibronectin), nonmammalian biomaterial alginate, and hydrophilic synthetic polymers [such as poly(ethylene glycol)] have been used in various 3D cell cultures. However, the lack of the necessary tissue ECM components limits the applications of these types of hydrogels in studies of mammalian cell biology and compromises the reliability of the related data for the interpretation of human pathophysiological conditions. On the other hand, the broadly used laminin-rich ECM (lrECM) hydrogel or its equivalent Matrigel generated from the basement membrane (BM) extracts of the Engelbreth-Holm-Swarm (EHS) mouse sarcoma contains more complex ECM proteins and growth factors (11–13). Because the tumor and normal tissue ECM are different, and the ECM components are critical for the expression of specific cell surface receptors (14), the tumor-derived laminin- and collagen IV–rich hydrogel may not be appropriate for certain cell signaling and molecular mechanistic studies that involve culturing normal cells, especially normal stromal cells, or irrelevant cancer cells. Consistent with this notion, the growth factors in Matrigel were found to influence cellular activities (13), and the breast normal epithelial and cancer cells displayed different phenotypes in the lrECM culture, with distinct capacities in depositing their endogenous BM-like material (15). To date, the lrECM hydrogel is mainly used for coating culture vessels, for embedding cells, or as a carrier for testing agents. There are no reports yet regarding lrECM-based solid porous scaffolds.
The current porous scaffolds are mostly synthesized using polymers, such as polycaprolactone (PCL) and poly(lactic-co-glycolic) acid (PLGA), and generally used for tissue engineering studies, although there is an increased implementation of synthetic polymer–based scaffolds in 3D cell cultures (1). Overall, the hydrophobic and nonbiological nature of the polymers, in addition to the adverse effects from their degradation products, hampers the biomedical applications of these types of scaffolds. Decellularized native tissues have been considered as ideal scaffolding materials for bioengineering and biomedical studies (16). However, there is a delay in the development of tissue-derived scaffold models. The decellularized tissues have only been used as a hydrogel to coat plates and have been mixed with synthetic polymers in tissue engineering studies (17), that is, in the “wet” native form for 3D cell culture (18) or as a cryoprotected matrix for transplantation (19). A more advanced, user-friendly, and biologically relevant tissue ECM–based culture model is needed for more in-depth mechanistic and therapeutic studies of human pathophysiological conditions. Here, we present the bench-fabricable porous and hydrogel forms of tissue matrix scaffold (TMS) that were generated using the same native tissue ECM for experimental consistency. The unique physicochemical properties and the versatile functionalities of TMS in tumor modeling, various bioassays, and drug screening are described and discussed.
RESULTS AND DISCUSSION
Fabrication and characterization of TMS
The decellularization and removal of DNA content from the tissues are critical steps during tissue ECM extraction. Mice breast tissues were collected and decellularized (Fig. 1A) as described in Materials and Methods. Compared to the native tissues, an absence of the visible nuclei in the decellularized tissues, which was determined using hematoxylin and eosin (H&E) staining (Fig. 1D, bottom), and the total DNA content <50 ng per mg of dried ECM (>99% of DNA was removed, Fig. 1B) satisfy the decellularization criteria (20). The amount of the main ECM components, such as collagen and glycosaminoglycans (GAGs), retained in the decellularized matrix is very close to that of the native tissues, as measured with the conventional hydroxyproline assay and the 1,9-dimethylmethylene blue method, respectively (Fig. 1B).
Fig. 1. TMS fabrication and structural property characterization.
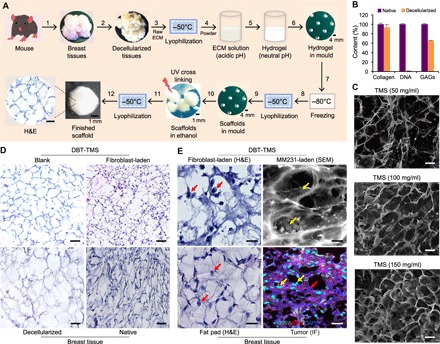
(A) The workflow of the porous TMS fabrication. (1) Collection of breast tissues from 8- to 12-week-old mice. (2) Decellularization of the native tissues to produce ECM. (3) Lyophilization of the ECM at −50°C. (4) Enzymatic digestion of the ground ECM in acidic solution. (5) Neutralization of the acidic ECM solution–generated hydrogel. (6) Loading the hydrogel into the spherical molds. (7) Formation of the pre-scaffolds in the molds at −80°C. (8) Lyophilization of the pre-scaffolds. (9) Formation of the porous scaffolds in the molds. (10) Treatment of the scaffolds with absolute ethanol and cross-linking the ECM proteins under UV light. (11) Lyophilization of the scaffolds to remove the ethanol. (12) Characterization of the finished TMS scaffolds. A microscopic view of the TMS cross sections after H&E staining is shown. Scale bars, 100 μm. (B) Comparison of the composition of the decellularized tissues with that of the native tissues at DNA and major ECM protein levels. Error bars represent the SD of the measurements of three independent batches of the ECM samples. (C) Characterization of the TMS porosity under SEM. Different amounts of the lyophilized ECM powder were used to generate TMSs at different pore sizes. (D) Histological comparison of the cross sections of the blank and the cell-laden DBT-TMS with the decellularized and the native mouse breast tissue. (E) Comparison of the occupancies of the cells grown inside the DBT-TMS with that of the native cells that lived in mouse breast tissues. Left: The closeup views of the H&E-stained cross sections of the fibroblast-laden TMS and the mammary fat pad tissues. Top right: An SEM image showing the occupancies of the MM231 cells on the surface and within the porous TMS. Bottom right: Distribution patterns of the MM231 cells and stromal cells immunostained with Ki-67 (green) and HER2 (red), respectively, on the cross sections of mouse breast tumors that originated from the MM231 cell–laden TMS. DAPI (4′,6-diamidino-2-phenylindole) was used to stain the nuclei of the cells. The red and the yellow arrows indicate stromal and MM231 cells, respectively. Scale bars, 100 μm (C to E).
To better characterize the extracted ECM composition, liquid chromatography–mass spectrometry (LC-MS/MS) was applied. We identified the ECM proteins within the mouse breast tissues (Table 1), which were abundant in different types of collagens, with certain amounts of glycoproteins (including periostin, laminin, fibronectin, fibrillin, and fibrinogen) and proteoglycans/GAGs (such as perlecan and lumican), as well as other less abundant yet important proteins for the structure and functions of the ECM. In contrast, the lrECM is rich in BM proteins (such as laminin, perlecan, nidogen, and type IV collagen), has a low overall collagen content, and has other ECM proteins that are different from those in the breast tissue ECM (table S1 and fig. S1). The breast tissue ECM proteins are more diverse and cover broader components of the connective tissues than those in the lrECM hydrogel, highlighting the distinct biochemical features and potential differences in the structural supports of the two ECM-based systems. We also noticed that although both types of the ECMs contained certain cell cytoskeleton proteins, a range of intracellular proteins was identified in the lrECM hydrogel. The physical localizations of these proteins, among which a small number could be cell-secreted, deserve to be further explored. These findings suggest that understanding the composition of a select ECM is important to address tissue-specific and disease-relevant questions because many cellular activities conducted for the survival and growth of the cells within a tissue environment are initiated by biochemical changes other than the ECM structural modifications in the extracellular space.
Table 1. The major proteins identified in mouse mammary tissue ECM that were preserved in TMS.
The proteins were grouped according to their similarities in a family or their functions within ECM and were listed from high to low spectrum counts. FACIT, fibril-associated collagens with interrupted triple helices.
| # | Protein | Gene |
Accession number |
Protein molecular mass (kDa) |
Spectrum count |
Functions | |
| Collagen | 1 | Collagen type I alpha 1 chain |
Col1a1 | P11087 | 138 | 899 | Strengthens tissue structure; participates in ECM organization; interacts with metal ions and other proteins; regulates cell mobility |
| 2 | Collagen type III alpha 1 chain |
Col3a1 | P08121 | 139 | 812 | Strengthens tissue structure; associates with and facilitates collagen I fibrillogenesis; participates in ECM organization; interacts with metal ions and other proteins; regulates cell mobility |
|
| 3 | Collagen type I alpha 2 chain |
Col1a2 | Q01149 | 130 | 769 | Strengthens tissue structure; participates in ECM organization; interacts with metal ions and other proteins; regulates cell mobility |
|
| 4 | Collagen type V alpha 2 chain |
Col5a2 | Q3U962 | 145 | 143 | Mediates the assembly of other collagen fibrils; participates in ECM organization; interacts with metal ions and other proteins |
|
| 5 | Collagen type VI alpha 3 chain |
Col6a3 | E9PWQ3 | 354 | 123 | A major structural component of microfibrils; links BMs to nearby cells; participates in ECM organization; interacts with other proteins |
|
| 6 | Collagen type II alpha 1 chain |
Col2a1 | P28481 | 142 | 62 | Adds structure and strength to connective tissues that resist compression; participates in ECM organization; interacts with metal ions and other proteins |
|
| 7 | Collagen type V alpha 1 chain |
Col5a1 | O88207 | 184 | 60 | Participates in heterotypic assembly with other collagen fibrils and organization of ECM; interacts with metal ions and other proteins; regulates cell mobility |
|
| 8 | Collagen type VII alpha 1 chain |
Col7a1 | Q63870 | 295 | 56 | A major component of anchoring fibrils that contributes to epithelial BM organization and adherence by interacting with other ECM proteins; participates in ECM organization; regulates cell mobility |
|
| 9 | Collagen type IV alpha 2 chain |
Col4a2 | P08122 | 167 | 47 | A major structural component of BM that forms a meshwork together with laminins, proteoglycans, and nidogen/ entactin; participates in ECM organization; regulates cell adhesion; its cleaved product canstatin inhibits angiogenesis and tumor growth |
|
| 10 | Collagen type V alpha 3 chain |
Col5a3 | Q9JLI2 | 172 | 33 | Participates in heterotypic assembly with other collagen fibrils and organization of ECM; interacts with metal ions and other proteins; regulates cell mobility |
|
| 11 | Collagen type IV alpha 1 chain |
Col4a1 | P02463 | 161 | 27 | A major structural component of BM that forms a meshwork together with laminins, proteoglycans, and nidogen/ entactin; participates in ECM organization; regulates cell adhesion; its cleaved product arresten inhibits angiogenesis and tumor growth |
|
| 12 | Collagen type VI alpha 1 chain |
Col6a1 | Q04857 | 108 | 20 | A major structural component of microfibrils; links BM to nearby cells; participates in ECM organization; interacts with other proteins |
|
| 13 | Collagen type VI alpha 2 chain |
Col6a2 | Q02788 | 110 | 15 | A major structural component of microfibrils; links BM to nearby cells; participates in ECM organization; interacts with other proteins |
|
| 14 | Collagen type XI alpha 2 chain |
Col11a2 | Q64739 | 172 | 7 | Mediates the spacing and width of type II collagen; its proteolytic product poly(ADP-ribose) polymerase is involved in cellular stress response; interacts with calcium and metal ions |
|
| 15 | Collagen type XVI alpha 1 chain |
Col16a1 | A3KFV7 | 122 | 4 | Maintains the integrity of ECM; regulates cell attachment and integrin-mediated cell spreading and morphology changes |
|
| 16 | Collagen type XIV alpha 1 chain |
Col14a1 | B7ZNH7(+2) | 193 | 2 | Interacts with the interstitial collagen fibrils via type I collagen and mediates fibrillogenesis; plays an adhesive role by integrating collagen bundles; participates in ECM organization; regulates cell adhesion |
|
| 17 | Collagen type XXII alpha 1 chain |
Col22a1 | E9Q7P1 | 160 | 2 | A member of the FACIT subgroup of the collagen family; specifically localizes to tissue junctions; acts as a cell adhesion ligand |
|
| 18 | Collagen type XV alpha 1 chain |
Col15a1 | A2AJY2 | 138 | 1 | A member of the FACIT collagen family; its BM expression adheres the BM to the underlying connective tissue stroma; its cleaved product restin inhibits angiogenesis |
|
| 19 | Collagen type IV alpha 3 chain |
Col4a3 | Q9QZS0 | 162 | 1 | A major structural component of BM that forms a meshwork together with laminins, proteoglycans, and nidogen/ entactin; its cleaved fragment tumstatin has antiangiogenic and antitumor activities; participates in ECM organization; regulates cell adhesion |
|
| 20 | Collagen type IV alpha 5 chain |
Col4a5 | Q63ZW6 | 162 | 1 | A major structural component of BM that forms a meshwork together with laminins, proteoglycans, and nidogen/ entactin; participates in ECM organization; regulates cell adhesion |
|
| Glycoprotein and proteoglycan/ GAG |
21 | Periostin | Postn | Q62009 | 93 | 66 | Functions in tissue development and regeneration; binds to integrins to support adhesion and migration of epithelial cells; plays a role in cancer stem cell maintenance and metastasis |
| 22 | Laminin subunit gamma 1 |
Lamc1 | F8VQJ3 | 177 | 26 | The major noncollagenous constituent of BM; regulates cell adhesion, differentiation, migration, signaling, neurite outgrowth, and cancer metastasis; interacts with other ECM components; participates in ECM organization |
|
| 23 | Laminin subunit beta 1 |
Lamb1 | E9QN70(+1) | 202 | 13 | The major noncollagenous constituent of BM; regulates cell adhesion, differentiation, migration, signaling, neurite outgrowth, and cancer metastasis; interacts with other ECM components; participates in ECM organization |
|
| 24 | Laminin subunit alpha 1 |
Lama1 | P19137 | 338 | 9 | The major noncollagenous constituent of BM; regulates cell adhesion, differentiation, migration, signaling, neurite outgrowth, and cancer metastasis; interacts with other ECM components; participates in ECM organization |
|
| 25 | Laminin subunit beta 2 |
Lamb2 | Q61292 | 197 | 8 | The major noncollagenous constituent of BM; regulates cell adhesion, differentiation, migration, signaling, neurite outgrowth, and cancer metastasis; interacts with other ECM components; participates in ECM organization |
|
| 26 | Laminin subunit alpha 5 |
Lama5 | Q61001 | 404 | 5 | The major noncollagenous constituent of BM; regulates cell adhesion, differentiation, migration, signaling, neurite outgrowth, and cancer metastasis; interacts with other ECM components; participates in ECM organization |
|
| 27 | Fibronectin | Fn1 | P11276 | 273 | 23 | Binds cell surface and collagen, fibrin, heparin, DNA, and actin; regulates type I collagen deposition, cell morphology, adhesion, migration, and opsonization; mediates angiogenesis and tumor metastasis; its cleaved product anastellin binds fibronectin and induces fibril formation |
|
| 28 | Fibrillin 1 | Fbn1 | A2AQ53 | 312 | 16 | Fibrillin is secreted into ECM by fibroblasts and incorporated into the insoluble microfibrils, which appear to provide a scaffold for deposition of elastin |
|
| 29 | Fibrinogen alpha chain |
Fga | E9PV24(+1) | 87 | 14 | Forms fibrinogen with fibrinogen beta and gamma chains; thrombin converts fibrinogen to fibrin, which mediates blood clotting; various cleaved products of fibrinogen and fibrin regulate cell adhesion and spreading, display vasoconstrictor and chemotactic activities, and act as mitogens |
|
| 30 | Fibrinogen gamma chain |
Fgg | Q8VCM7 | 49 | 13 | Forms fibrinogen with fibrinogen alpha and beta chains; thrombin converts fibrinogen to fibrin, which mediates blood clotting; various cleaved products of fibrinogen and fibrin regulate cell adhesion and spreading, display vasoconstrictor and chemotactic activities, and act as mitogens |
|
| 31 | Fibrinogen beta chain |
Fgb | Q8K0E8 | 55 | 9 | Forms fibrinogen with fibrinogen alpha and gamma chains; thrombin converts fibrinogen to fibrin, which mediates blood clotting; various cleaved products of fibrinogen and fibrin regulate cell adhesion and spreading, display vasoconstrictor and chemotactic activities, and act as mitogens |
|
| 32 | Nidogen 1/ entactin |
Nid1 | P10493 | 137 | 9 | Essential component of BM; connects the networks formed by collagens and laminins to each other; plays a role in cell-ECM interactions |
|
| 33 | Tenascin-X | Tnxb | O35452 | 435 | 2 | The tenascins have antiadhesive effects, as opposed to fibronectin, which is adhesive; it is thought to function in matrix maturation |
|
| 34 | EMILIN 1 | Emilin1 | Q99K41 | 108 | 1 | Associates with elastic fibers at the interface between elastin and microfibrils; may play a role in the development of elastic tissues including large blood vessels, dermis, heart, and lung |
|
| 35 | Perlecan | Hspg2 | E9PZ16 | 470 | 30 | BM-specific; serves as an attachment substrate for cells; plays essential roles in vascularization; its cleaved products (endorepellin and LG3) have antiangiogenic and antitumor properties; binds to calcium and metal ions; maintains the integrity of BM |
|
| 36 | Lumican | Lum | P51885 | 38 | 13 | A proteoglycan class II member of the small leucine-rich proteoglycan family; binds to other extracellular components and mediates collagen fibril organization; ubiquitously distributed in most mesenchymal tissues; regulates epithelial cell migration and tissue repair |
|
| Other ECM proteins |
37 | Titin | Ttn | A2ASS6 | 3906 | 9 | Essential component of sarcomeres in striated muscles; provides structural support, flexibility, and stability to cell structures; mediates chemical signaling; serves as connections between microfilaments; contributes to the fine balance of forces between the two halves of sarcomere |
| 38 | Perilipin 1 | Plin1 | Q8CGN5 | 56 | 5 | Coats lipid storage droplets in adipocytes, thereby protecting them until they can be broken down by hormone-sensitive lipase; phosphorylation of perilipin is essential for the mobilization of fats in adipose tissues |
|
| 39 | Perilipin 4 | Plin4 | O88492 | 139 | 3 | Highly expressed in white adipose tissues, with lower expression in heart, skeletal muscle, and brown adipose tissues; coats lipid droplets in adipocytes to protect them from lipases |
|
| 40 | Elastin | Eln | P54320 | 72 | 3 | The major component of elastic fibers for structural support of tissues; participates in ECM organization; allows tissues to resume their shape after stretching or contracting; a major contributor to tissue stiffness |
|
| 41 | Dermatopontin | Dpt | Q9QZZ6 | 24 | 3 | A proteoglycan-binding cell adhesion protein that potentially functions in cell-matrix interactions through integrins; may enhance TGFB1 activity, inhibit cell proliferation, accelerate collagen fibril formation, and stabilize collagen fibrils against low-temperature dissociation |
Next, we generated TMS in two forms, hydrogel and porous scaffolds, with the decellularized breast tissue (DBT) ECM (Fig. 1A). The porous TMS can be fabricated in different shapes and sizes with the desired porosity, which can be achieved by adjusting the amount of the ECM dissolved in the acidic solution as analyzed by scanning electron microscopy (SEM; Fig. 1C). The size of the TMS pores was inversely proportional to the ECM amount in the scaffolds. One hundred milligrams of dried ECM per milliliter of the solution gave rise to scaffolds with pore sizes of about 100 μm (Fig. 1C) that were used across the different experiments in this study. The architectural stability of the porous and hydrogel scaffolds can be achieved by cross-linking under ultraviolet (UV) light and adding tyrosinase, respectively, during the fabrication process. Tyrosinase is a physiological oxidase found in melanocytes for melanin generation and has been used as a protein cross-linker to preserve the molecular features of proteins (21). It had no detectable effects on cell morphology, growth, and proliferation under the concentration and culture conditions used in the study. Both the porous and hydrogel scaffolds became spongy in water, phosphate-buffered saline (PBS) solution, and tissue culture medium (movie S1), and were stable for months without any noticeable deformation and degradation.
H&E staining of the cross sections of the porous TMS reconstituted from the DBT tissue ECM (DBT-TMS) revealed close mimicry of the structural characteristics of the decellularized native tissues (Fig. 1D, left). Human GM637 fibroblasts (or NIH/3T3 mouse fibroblasts) seeded on the surface of the porous TMS attached and grew very well, and infiltrated the scaffold in days as demonstrated by the H&E staining of the cross sections of the cell-laden TMS (Fig. 1D, top right), which highly resembled those of the breast tissues (Fig. 1D, bottom right). Closeup inspections of the fibroblasts that infiltrated the TMS (Fig. 1E, top left) revealed cell distribution similar to that of the stromal cells in normal breast tissues (Fig. 1E, bottom left). SEM analysis of breast cancer MDA-MB-231 (MM231) cell–laden TMS showed both surface and intraporous occupancies of the cells (Fig. 1E, top right). This phenotype was consistent with the scattering pattern of the cancer cells in breast tumors that originated from the MM231-laden TMS implants in mouse mammary fat pad, where the cancer cells were distinguishable from the surrounding stromal cells via Ki-67 (green, positive for the MM231 and negative for normal stromal cells) and HER2 (red, positive for the stromal cells and negative for the MM231 cells) immunofluorescence (IF) staining (Fig. 1E, bottom right). These data collectively indicate that the tissue-like architecture and the compliance of TMS ensure its mechanistic mimicry of the tissue’s physical environment that is essential for force-mediated signaling regulation of cell attachment, survival, and migration in the 3D space (22, 23). The essential physicochemical features of a culture substratum are critical for the expression of distinct biomarkers that are otherwise not induced or are difficult to detect in 2D or nonbiologically relevant 3D cultures.
Cell survival and growth status on TMS
The normal mammary epithelial MCF10A cells and the MM231 cancer cells were seeded on separate TMSs (Fig. 2A) and evaluated for proliferation using the Cell Counting Kit-8 (CCK-8) for over 2 weeks of culture under optimal conditions. The results showed that both cell types proliferated substantially in the TMS cultures, with the MM231 cells proliferating at higher levels (Fig. 2B), possibly due to the aggressive growth nature of the cells. H&E staining of the cross sections of the samples also exhibited a marked increase in cell numbers within the TMSs in 2 weeks (Fig. 2, C to F). The survival status of the MM231 cells grown on the TMSs was investigated using Live/Dead Cell staining, where the green and red fluorescent probes labeled the live and dead cells, respectively, followed by fluorescence microscopy. The cancer cells gradually occupied the surface and inner space of the TMSs over time (Fig. 2, G to J). Only few dead cells were detected during the course of the observations (Fig. 2, I and J), indicating that robust cell survival and propagation were established in the cultures. It is plausible that the number of dead cells may increase over an extended period of culture with the growing size of the tumoroid that gradually limits the access of some cells to the nutrients in the culture.
Fig. 2. Cell survival and proliferation in TMS.
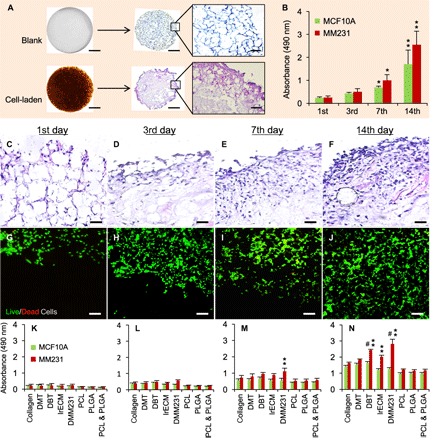
(A) Macroscopic and microscopic views of the blank and cell-laden porous DBT-TMSs. Scale bars, 1 mm (for the macroscopic views and the microscopic views of the H&E-stained cross sections) and 200 μm (for the regional blowups of the H&E-stained cross sections). (B) Proliferation of MCF10A and MM231 cells grown on DBT-TMSs over a period of 14 days. Error bars represent the SD of the means of the values from three independent experiments. *P < 0.01; **P < 0.001, compared to the first-day culture. (C to F) The proliferation and distribution of the MM231 cells on the DBT-TMSs were examined on the cross sections of the scaffolds using H&E staining coupled with light microscopy. Scale bars, 100 μm. (G to J) Live/Dead Cell assays showing robust survival and proliferation of the MM231 cells on the DBT-TMSs over time. Scale bars, 100 μm. The images (C to J) are top (surface) to bottom (center) views of the cross sections of the scaffolds. (K to N) Comparison of MCF10A and MM231 cell proliferation profiles on different 3D scaffolds within the defined time frame. Error bars represent the SD of the means of three independent experiments. **P < 0.01, compared to the proliferation profiles on the PCL/PLGA scaffolds; #P < 0.05, compared to the proliferation profiles on the collagen scaffolds.
We then compared the proliferation of the MCF10A and the MM231 cells grown on the TMSs [mouse DBT; decellularized muscle tissue (DMT)] with the proliferation of those on other 3D porous scaffolds generated from the natural ECM component (collagen or lrECM), decellularized MM231 ECM scaffolds (DMM231), and the synthetic polymer scaffolds (PLGA and/or PCL). At the indicated time points, cell proliferation on the scaffolds was measured using CCK-8. The results showed that there was an increase in cell numbers across all the types of the scaffolds tested over time (Fig. 2, K to N). The MM231 cells grown on the DMM231 scaffolds had the greatest cell proliferation rate compared to those on the other scaffolds (Fig. 2, K to N). A similar phenotype was reported in MCF7 breast cancer cells cultured on decellularized tumor tissues (24). These observations indicate that cancer cells grow better within a tumor-supporting tissue microenvironment. The DBT-TMS also supported cancer cell proliferation to a higher extent than the collagen or the lrECM scaffold-based cultures, especially after a week of culturing, whereas the DMT-TMS cultures displayed a moderate increase in cell numbers (Fig. 2, K to N). All of the scaffolds derived from the natural biomaterials showed better support for the proliferation of both the MCF10A and the MM231 cells than the synthetic polymer–based scaffolds. The MCF10A cells displayed similar proliferation patterns among the collagen, lrECM, DMT, and DBT groups, as well as the PCL, PLGA, and PCL + PLGA scaffold groups. Still, the DBT scaffolds demonstrated the best support for the proliferation of the MCF10A cells across the different cultures (Fig. 2, K to N). These data collectively indicate that the full tissue matrix–based TMS is a competent 3D culture system supporting robust cell survival and proliferation in a tissue-mimicking microenvironment.
Compartmental culture of cancer cells with stromal cells in multilayered TMS
In addition to interacting with ECM and the cells of the same origin, cancer cells in tissues also interact with stromal (for example, fibroblasts) or other types of cells, a process that is essential for intercellular and intracellular signaling and for the growth, proliferation, migration, and invasion of the cancer cells. It was shown that tumor-derived stroma was able to induce desmoplastic differentiation and morphological changes of normal fibroblasts and displayed matrix characteristics supporting the migratory and proliferative phenotypes of cancer cells that were reminiscent of tumor progression (25). On the other hand, carcinoma-associated, but not normal, fibroblasts stimulated tumorigenesis from initiated epithelial cells (26), implicating a tumor stroma-directed transformation and promotion of cancer development. In addition, the interactions of fibroblasts, macrophages, and/or endothelial cells with breast cancer cells in cocultures promoted the secretion of tumor-promoting factors from the cancer cells, as well as their proliferation and migration (27). These observations strongly suggest the need to include stromal cells in a culture system when studying tumor biology to reveal the signaling-oriented molecular mechanisms governing tumor progression.
To mimic the complex cell-cell or cell-ECM interaction in tissues, different coculture models have been developed, including the collagen/hyaluronic acid scaffold (28), the Matrigel method (29), the heterogeneous spheroid (30), and the nanoshuttle-magnetic levitation model (31). Although these models support cell growth and interactions in 3D, the straight mix of cell populations in a single compartment limits the dynamic and detailed observations of cell-cell and cell-matrix interactions. The microfluidic flow cell method allows compartmentalized culture of cells (32, 33) but does not support direct interactions and free migration of different cells that could potentially affect the ECM disposition and the biological behaviors of the cells. Recently, the generation and application of layered hydrogel scaffolds have been described by Ladet et al. (chitosan gel) (34), Fang et al. (alginate gel) (35), and Todhunter et al. (DNA-programmed assembly of cells in a Matrigel-collagen mixture) (36). Although these layered culture models are able to provide physical support for cells to grow, their ECM compositional cues are insufficient. Therefore, the models lack the essential signaling supports for tumor initiation and the related biomolecular studies.
Taking advantage of the fact that our fabrication methods can generate TMS in both porous and hydrogel forms from the same tissue ECM, we have produced a multilayered tissue culture platform. As shown in Fig. 3A, 1 × 10⁵ MM231 cells per scaffold were seeded on the porous DBT-TMS, followed by either straight 3D culture or coating one or more layers of TMS hydrogel (Fig. 3, A to C). Normally, the medium-diluted hydrogel does not gelatinize well because of the poor cross-linking efficiency of the ECM proteins. By adding tyrosinase into the TMS hydrogel and culture medium mixture, the hydrogel was polymerized and displayed tissue-like resilience (similar sponginess as shown in movie S1 for the porous TMS). The first gel layer without cells served as an intercompartmental region for the observations of cell migration and invasion (Fig. 3B). A second layer of hydrogel containing a different type of cells (for example, human GM637 or mouse NIH/3T3 fibroblasts) was applied (Fig. 3, A and C). After gel polymerization, the multilayered assembly was cultured in optimal medium, which was replaced 12 hours after the initial culture. The distribution of the cells within the multilayered TMS after 3 days of culture was checked by DAPI staining of the cell nuclei (Fig. 3D). The progressive cell growth, proliferation, migration, and invasion into the first layer of the hydrogel were examined using Live/Dead Cell staining of the cross sections of the scaffolds (Fig. 3, F to I). The robust cell survival, proliferation, and mobility (spindle-shaped morphology of the migrating cells) within the TMS indicate the easy accessibility to nutrients and oxygen by the cells across the different compartments of the assembly. Alternatively, the cell-laden TMS with or without hydrogel coating can be used for biomarker/drug screening or implanted into animals for tumor formation and therapeutic testing (Fig. 3A).
Fig. 3. Compartmental 3D tissue culture using the TMS system.
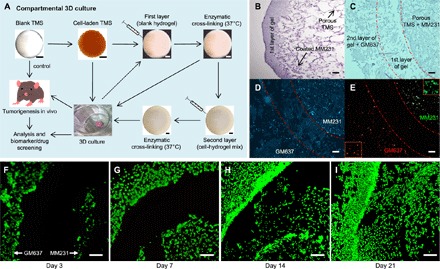
(A) Generation of the multilayered/compartmentalized TMS culture system. MM231 cells were cultured on the porous DBT-TMS followed by either covering them with a layer of blank TMS hydrogel or directly placing them into culture for in vitro or in vivo experiments. Hydrogel premixed with another type of cells different from those coated on the porous TMS was applied outside the first layer and enzymatically cross-linked, forming a second gel layer. The multilayered TMS assembly was then subjected to culture and/or implantation into animals for further analysis or applications. (B) H&E staining of the cross sections of a TMS coated with MM231 cells and a layer of hydrogel. (C) H&E staining of the cross sections of a multilayered TMS containing the porous TMS core coated with MM231 cells and two hydrogel layers with the second gel layer containing the human GM637 fibroblasts. The middle region outlined by dotted lines was a blank hydrogel layer. (D) DAPI staining of the cross sections of the compartmentally cultured cells grown in the multilayered TMS after 3 days of culture, as shown in (C). (E) IF microscopic view of Ki-67 (green, MM231 cells) and HER2 (red, GM637 cells) staining on the cross sections of the compartmental TMS samples. Selected regional blowups of the Ki-67 and HER2 staining are shown as insets. (F to I) Live/Dead Cell staining of the cross sections of the compartmentally cultured MM231 cells (on the porous TMS, right side of the blank hydrogel layer) and the human GM637 fibroblasts (within the second hydrogel layer, left side of the blank hydrogel layer) at different time points of the cultures. Scale bars, 100 μm.
One of the important profiles of the biological activities conducted by a specific cell population is the expression of select biomarkers. To assess cellular biomarker expression within the TMS, we seeded MM231 cells and GM637 cells on the porous TMS and in the second layer of the hydrogel, respectively, spaced with a blank hydrogel layer. After 3 days of culture, the TMS was harvested, cross-sectioned, and immunofluorescently stained for the cell proliferation marker Ki-67 and the HER2 receptors. Consistent with the IF staining results seen in the native tumors derived from the MM231 cell–laden TMS (Fig. 1E, bottom right), MM231 cells were stained positive for Ki-67 (Fig. 3E, green) and negative for HER2 (red), and the GM637 cells were stained positive for HER2 and negative for Ki-67. It was also noticeable that both the MM231 and the GM637 cells started to migrate into the blank gel layer of the TMS (Fig. 3E). Because native tumors are heterogeneous tissues, where gene and protein expression patterns of different cell populations are difficult to sort out, it would be worthwhile to explore cancer cell– or cancer type–specific biomarker expression using the multilayered TMS that is able to differentiate the induced expression of intracellular and extracellular biomarkers of cancer cells from those of the stromal cells. Together, these data demonstrate that the compartmental TMS system not only can mimic the “layered tissue” structures (for example, the epithelial cell, BM, and connective tissue unities in certain parts of human or animal tissues, such as the mammary tissues) but also is a convenient tool to observe multiple phenotypes of different cell populations in a single system and to screen tumor biomarkers.
TMS support of tumor formation in animals
Injection of human breast cancer cells into mice mammary fat pad to induce tumor formation has been commonly used in the field (37). However, this method may cause shear and survival stresses to the cells precultured in 2D substratum, and the tumor induction takes a long time (usually above 6 weeks before collection) with quite variable sizes. Similarly, Matrigel and collagen plugs carrying breast cancer cells form tumors in animals over an extended period of time (38). Synthetic polymer scaffolds were also tested in supporting tumor development in animals. However, the large number of cells used, the longer than 2 weeks of preculturing of the cells on the scaffolds, and the limited tumor mass formation in weeks indicate that the scaffolds may not provide optimal cell growth conditions (39). Because the TMS and the DMM231 scaffolds demonstrated superior support for cell survival and proliferation in tissue cultures, we further tested the efficiencies of the scaffolds in supporting tumor development in mice. MM231 cells were seeded on the porous DBT-TMS, DMM231, and PLGA scaffolds with or without coating of a layer of TMS hydrogel, as shown in Fig. 3A. The blank scaffolds (negative control) and the scaffolds containing the cancer cells in replicates were cultured under optimal conditions for 24 hours and implanted into the mammary fat pads of female mice. Tumor formation within the tissues was analyzed at multiple levels after 4 weeks of implantation.
First, the status and sizes of the tumors of the individual animal groups were analyzed with x-ray–based computed tomography (CT; fig. S2) before surgical excision, caliper measurement, and observation under a dissection microscope. As shown, the blank DBT-TMS and DMM231 scaffolds were close to complete degradation and absorption, whereas the blank PLGA scaffolds were partially degraded (Fig. 4A, top), indicating that the tissue ECM–derived scaffolds have excellent biodegradability and biocompatibility within the host tissues. The tumors developed from the MM231 cells seeded on the DBT-TMSs were significantly bigger than those supported by the DMM231 scaffolds and the PLGA scaffolds, where the latter corresponded to the least tumor size [Fig. 4, A (middle) and B]. A similar trend was found in the tumor groups derived from the MM231 cells plus a hydrogel layer outside the individual type of the scaffolds [Fig. 4, A (bottom) and B].
Fig. 4. Characterization of TMS support of tumor formation in animals.
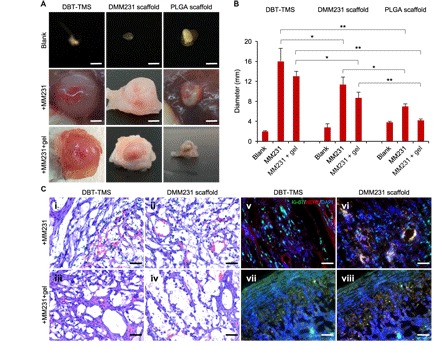
(A) Evaluation of the biodegradability of the scaffolds and their supports on the MM231 cell–originated tumor development (dissection microscopy images). Scale bars, 4 mm. (B) Quantification of the sizes of the tumors formed from the different MM231 cell–laden scaffolds. The plotted values reflect the ex vivo measurements of the tumors. The error bars represent the SD of the sizes of three individual tumors of the same implantation background. *P < 0.05; **P < 0.01, significance of the comparison between the indicated sample groups. (C) (i to iv) H&E staining of the cross sections of the tumors that originated from the MM231 cell–laden DBT-TMS and DMM231 scaffolds with or without hydrogel coverage. The tumor ECM structure, cell distribution, and capillaries (containing the stained red blood cells) are demonstrated. (v to viii) IF staining of Ki-67 (green) and HER2 (red) on the tumor cross sections. The cell nuclei were stained with DAPI (blue). Scale bars, 100 μm (C, i to viii).
Note that the DMM231 scaffolds supported better cell proliferation than the DBT-TMSs in tissue cultures (Fig. 2, K to N), although the tumors that originated from the DBT-TMSs were bigger than those from the DMM231 scaffolds (Fig. 4, A and B). These differences could be due to two major reasons. The first reason is the nature of the scaffolds, which allows the cancer cells to grow better on the supporting ECM derived from their own living environment. Although MM231 cells grown on the DBT-TMS have richer ECM protein support than the cells on the other types of scaffolds tested, they may need to adapt to the tissue ECM condition to establish a fit cancer cell ECM environment. Once an optimal growth microenvironment is formed, the cells will propagate exponentially as reflected on the 7th and 14th day of the 3D cultures shown in Fig. 2 (C to F). Another reason for the in vitro and in vivo differences lies in the tissue environment that is in favor of the DBT-TMS support for cell growth. After the cancer cell–laden TMS was embedded into the mammary tissue, it is possible that the existing tissue ECM within the DBT-TMS permitted rapid infiltration of the surrounding fibroblasts, endothelial cells, and other cells necessary to support the expansion of the cancer cells with minimum effort to build up the ECM networks because most of the ECM components were already locally available. In this situation, the cancer cells on the surface of the TMS can migrate more efficiently both inward into the scaffold and outward into the surrounding host tissues (fig. S3, A and B), where they could potentially stimulate the fibroblasts to proliferate and to differentiate into cancer-associated fibroblasts (40), which then generate collagen for the migration and spread of the cancer cells (41). On the other hand, although the DMM231 scaffold in the animals can support the growth of the MM231 cells well, it may not be an ideal environment for the infiltrated stromal cells, which will need to produce the required stromal ECM proteins to satisfy the expansion of the tumor mass.
Another intriguing finding was that the addition of the TMS hydrogel layer seemed to slow down the tumor growth, which was almost deficient in the PLGA scaffold group [Fig. 4, A (bottom) and B]. This phenotype may be partly due to the physical constraint of the gel on the growth of the tumors and to the possibly retarded accessibilities of the cells to the surrounding nutrients and O2 supply.
Second, histological examination of the cross sections of the tumor tissues revealed that the tumors of the DBT-TMS + MM231 ± gel groups had thicker and more organized ECM structures and more capillaries close to the outer regions of the tumors compared to those of the DMM231 scaffold + MM231 ± gel groups (Fig. 4C, i to iv, and figs. S3, A to D, and S4). The matrix structures of the DBT-TMS and the DMM231 scaffolds were already difficult to discern from the native tumor tissue ECM (Fig. 4C, i to iv, and fig. S3, A to D). These marked tumor tissue characteristics are distinguishable from the normal breast tissue structures (Fig. 1D, bottom right), where rich adipose and less connective tissues are present (42). The slightly loose intratumoral structures within the DMM231 scaffold–supported tumors could be a reflection of the underdeveloped tumor ECM (Fig. 4C, ii and iv), as speculated above. Noticeably, there is a cell-dense zone close to the outer sections of the tumors, with fewer cells distributed along the inward radius toward the center of the tumor (fig. S3, A to D). Within the tumors developed from the MM231 cell–laden scaffolds covered by hydrogel, the cell population close to the outer edge of the tumors seemed to be rallied expanding outward (fig. S3, C and D). The ECM architecture within the tumors of the PLGA scaffold groups was not well maintained, with barren capillaries that generated challenges for tissue sectioning (fig. S5). It appeared that the capillaries within the tumors developed more efficiently in the absence of the hydrogel coverage as contrasted between the DMM231 scaffold + MM231 ± gel tumor samples (Fig. 4C, ii versus iv, and fig. S4), and the degree of the tumor vascularization was proportional to the tumor size (Fig. 4, A and C). In addition, a better tumor ECM architecture was linked to enhanced microvessel formation (Fig. 4C and fig. S4).
Third, IF staining of Ki-67 (green) and HER2 (red) on the cross sections of the DBT-TMS/DMM231 scaffold + MM231 tumors demonstrated that the cancer cells are interwoven with fibroblasts, endothelial cells, and other cells, and displayed identifiable capillary structures (Fig. 4C, v and vi). These results are in agreement with the observation that the infiltrated fibroblasts and macrophages were able to induce angiogenesis (43, 44) and promote cancer cell proliferation through secretion of growth- and other tumor-promoting factors (41, 45). However, the functional capability of the angiogenically formed microvessels in supporting tumor growth needs to be further investigated. Some of the fibroblasts and endothelial cells within the tumors of the DMM231 scaffold + MM231 type were costained (orange color) for both Ki-67 and HER2, implying that the cells were highly proliferative to meet the need for stroma and microvessel generation (Fig. 4C, vi). In contrast, within the tumors derived from the DBT-TMS/DMM231 scaffold + MM231 + gel implants, most of the Ki-67–positive cancer cells accumulated toward the edge of the tumors (consistent with the phenotypes observed in fig. S3, C and D), whereas some remained mixed with stromal cells in deeper regions where some fibroblasts and endothelial cells were costained for Ki-67 and HER2 (Fig. 4C, vii and viii). Our data are consistent with previous reports, which suggested that the cancer cell–oriented stroma could induce differentiation of normal fibroblasts (25), could stimulate tumorigenesis of the initiated epithelial cells (26), and was dynamically modified with improved microenvironment (46) that is essential for tumor-promoting gene expression, cell migration, invasion (47, 48), and tumor growth (49). The need for a favorable stroma niche for the establishment of a tumor is also supported by the observation that the colonization of the metastatic cancer stem cells in a secondary site required secretion of select signaling enzymes into the ECM by the local fibroblasts (50).
Drug screening studies
Because the cancer cell–laden TMS in culture formed a tumoroid (Fig. 2A, bottom) that resembled the solid tumor in vivo (Fig. 4, A and C, and fig. S3), we investigated the performance of the TMS in testing anticancer drugs and in predicting treatment efficacies. Two estrogen receptor (ER)–positive breast cancer cell lines, T47D and BT474 (luminal subtype) that represent the most common type of breast cancer diagnosed to date and which respond to hormone therapy, were chosen for the experiments. We began with assessing the proliferation of the two types of cells on the selected kinds of scaffolds. The results showed that both T47D and BT474 cells proliferated faster on the DBT-TMS than those on the lrECM, collagen, and PLGA scaffolds (fig. S6A), displaying a similar proliferation pattern to the MM231 cells grown on the scaffolds (Fig. 2, K to N) but at a milder rate, which could be due to the slower proliferation nature of the T47D and the BT474 cells compared to the MM231 cells in vitro.
Two anticancer drugs—tamoxifen, a common ER antagonist drug in the active metabolite form of 4-hydroxytamoxifen (HT), and paclitaxel (Taxol), a cell mitotic arrest inducer drug—were selected for the tests. After growing the T47D or the BT474 cells in both 2D and 3D cultures for 7 days, the drugs were administered on alternate days starting on day 7 through day 13 (a total treatment of four times). As described above, the T47D and the BT474 cells proliferated faster on the 3D scaffolds with distinguishable growth trends between the scaffold groups (Fig. 5A) and more robust proliferation was seen in the 2D cultures (Fig. 5B). Administration of the drugs time-dependently inhibited cell proliferation in both the 3D and the 2D cultures (Fig. 5, A and B). However, the effect of the drug inhibition in the 3D cultures appeared to be less marked than that in the 2D cultures, which is consistent with previous reports (4, 5), with a better posttreatment recovery of cell proliferation after the 14th day as measured on the 21st day (Fig. 5, A and B).
Fig. 5. Comparison of the sensitivities of the cancer cells grown on the different scaffolds to anticancer drugs.
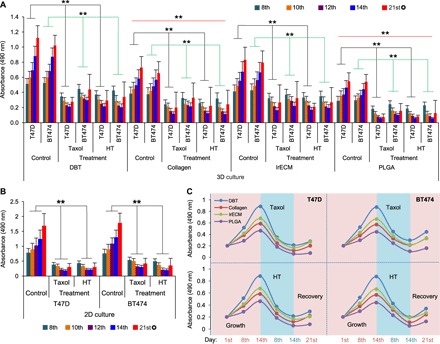
(A) The impact of the anticancer drugs on cell growth and proliferation supported by the DBT-TMS, collagen, lrECM, and PLGA scaffolds was analyzed and compared. The drug administration pattern and cell proliferation measurements are detailed in Materials and Methods. The error bars represent the SD of three independent experiments. The black and green lines within the plot area indicate the comparison of the average T47D or BT474 cell proliferation (day 8 to day 14) between the drug-treated groups and the nontreated control groups. The red lines indicate the comparison of the average cell proliferation between the collagen or PLGA scaffold groups and the DBT-TMS groups. **P < 0.01; ✪ , posttreatment recovery measurement. (B) Evaluation of the cell proliferation in response to Taxol or HT treatment in 2D cultures. Error bars represent the SD of the means of three independent experiments. **P < 0.01, comparison of the average cell proliferation (day 8 to day 14) between the drug-treated groups and the nontreated control groups. ✪ , posttreatment recovery measurement. (C) Proliferation/inhibition curve plots. The means (from three independent experiments) of the cell proliferation status on the different scaffolds on day 1 (the start date of cell proliferation), day 8 (1 day after the first treatment), day 14 (1 day after the last treatment), and day 21 (the end of recovery) as shown in (A) were plotted.
In agreement with a stronger support for cell survival and growth from the DBT-TMS than from the other 3D scaffolds (Fig. 2, K to N), except for the DMM231 scaffold as discussed above, cell proliferation on the DBT-TMS was the least inhibited by the drugs compared to those on the collagen, lrECM, and PLGA scaffolds as depicted in the proliferation/inhibition curve plots (Fig. 5C) summarized from Fig. 5A. Consistently, the posttreatment recovery of the cells that proliferated on the DBT-TMS was better than that on the other scaffolds (Fig. 5C). Overall, the cells grown on the scaffolds generated using tissue-derived materials (DBT, collagen, and lrECM) showed faster posttreatment recovery than those cultured on the PLGA scaffolds (Fig. 5, A and C). These data suggest that the less sensitive TMS cell cultures may recapitulate the complex native tissue microenvironment better, which not only supports optimal cell survival but also limits the penetration of the drugs. In addition, the trend of the cancer cell responses to the drugs in the 3D cultures, especially the TMS cultures, nicely resembles clinical and animal model observations of tumor growth status during the disease development and intervention phases (51–53), where therapeutic applications cause cancer cell death and tumor shrinkage, and the tumor resumes growth and progresses (relapses) when the treatment is stopped or discontinued (fig. S6B). When Live/Dead Cell staining was performed on the cross sections of the scaffold cultures collected at different time points of the experiments, as shown by the results from the T47D-laden DBT-TMSs (fig. S7) and the PLGA scaffolds (fig. S8), the robust cell proliferation and clustering were markedly attenuated over the period of HT or Taxol treatment. A recovery of the proliferative phenotype was detected on day 21, similar to what was seen in the proliferation experiments (figs. S7 and S8 and Fig. 5, A and C). These data collectively indicate that TMS is a competent tissue-mimicry culture system suitable for anticancer drug screening.
In conclusion, TMS represents an advanced native ECM–based 3D culture model that can be tailored for systemic biomedical research ranging from molecular mechanistic studies to animal models. It is potentially useful in predicting drug sensitivities or toxicities in vivo and cancer prognosis and in providing suggestions for additional therapeutics after the initial treatment. Because the TMS hydrogel can be self-polymerized in the presence of tyrosinase at body temperature, the drug-carrier functions of the system in tumor therapeutic applications need to be explored.
MATERIALS AND METHODS
Reagents
SDS, sodium bicarbonate, and fetal bovine serum (FBS) were purchased from Thermo Fisher Scientific. Triton X-100, perchloric acid, Sigmacote, chloroform, absolute ethanol, xylene, Organo/Limonene mounting media, H&E solutions, pepsin, tyrosinase, CCK-8, Hydroxyproline Assay Kit for collagen content measurement, collagen from bovine skin, lrECM from EHS mouse sarcoma, PLGA, and PCL were purchased from Sigma-Aldrich. Live/Dead Cell Staining Kit II was purchased from PromoKine (PK-CA707-30002).
Cells and culture media
MCF10A, MDA-MB-231, T47D, BT474, and NIH/3T3 cells were purchased from the American Type Culture Collection (ATCC). The simian virus 40–transformed human normal fibroblast GM637 cell line was a gift from R. Anderson (University of Wisconsin-Madison). The cell culture media 1× Dulbecco’s Modified Eagle’s Medium (DMEM)/F12 50/50 [for MCF10A cells; supplemented with 5% horse serum, EGF (20 ng/ml), hydrocortisone (0.5 μg/ml), cholera toxin (100 ng/ml), insulin (10 μg/ml), and 1% penicillin-streptomycin] and 1× DMEM (for the cancer cells; supplemented with 10% FBS and 1% penicillin-streptomycin) were purchased from Mediatech Inc.
Antibodies
Primary rabbit antibody for HER2 (#2165) and mouse antibody for Ki-67 (#9449) were purchased from Cell Signaling Technology. Alexa Fluor dye–conjugated anti-rabbit and anti-mouse secondary antibodies were purchased from Thermo Fisher Scientific.
Anticancer drugs
(Z)-HT and paclitaxel (Taxol) were purchased from Abcam (#ab1419430) and Sigma-Aldrich (#T19120), respectively.
Microscopy
Zeiss Imager M2 upright epifluorescence microscopy at the Washington State University (WSU) Microscopy Core facility was used for both bright-field and fluorescence imaging. FEI Quanta 200F SEM at the WSU Franceschi Microscopy and Imaging Center was used for SEM imaging.
Hydrogel and porous TMS fabrication from animal tissues
Mammary or muscle tissues were isolated from nonobese diabetic (NOD)/severe combined immunodeficient (SCID) female mice (8 to 12 weeks old). Decellularization of the tissues was performed following an improved protocol based on previous reports (17, 24, 54). Briefly, the collected tissues were sliced into small pieces, centrifuged to remove fatty oil, and washed three times in 1× PBS. SDS solution (0.5% for the mammary tissues and 1% for the muscle tissues) in 1× PBS was used to decellularize the tissues at room temperature (RT) for 48 hours (replacing the solution every 10 to 12 hours). The processed mammary tissues were treated with isopropyl alcohol for 48 hours (replacing the solution every 10 to 12 hours), and the muscle tissues were treated with 1% Triton X-100 solution in PBS for 30 to 60 min. After several rounds of washing in 1× PBS, the DBTs or DMTs (the ECM) were lyophilized in a freeze-dryer (115 mT of vacuum drying rate, Millrock Technology) at −50°C for 24 to 48 hours depending on the volume of the samples. The DBT and DMT were then ground separately in liquid nitrogen to make powder forms of the ECM. The required amount of the decellularized ECM was digested in an acidic pepsin solution (10 mg of pepsin in 1 ml of 1% acetic acid solution in 1× PBS) until it was completely dissolved at RT or 37°C. Perchloric acid (0.1%) in 4% of ethanol was added into the acidic gel-like solution and mixed for 4 to 6 hours. The solution was neutralized using 0.1 N NaOH solution to form hydrogel at 4°C and stored until use.
Porcelain files containing hemispherical molds at desired diameters (2, 3, or 4 mm) were generated and coated with the hydrophobic microscopically thin film of chlorinated organopolysiloxane colorless solution (Sigmacote) according to the manufacturer’s instructions. An equal amount of the prepared hydrogel was slowly added into the wells of the molds to create spherical structures at 4°C and then at −80°C for 1 to 4 hours to preserve the shape of the pre-scaffolds. When solidified, the pre-scaffolds were lyophilized at −50°C for 24 hours. After lyophilization, the scaffolds were dipped into absolute ethanol and exposed to UV light (20,000 kJ) for 30 s to cross-link the ECM followed by another round of lyophilization for 3 to 6 hours. The finished porous scaffolds were collected and kept dry at 4°C for further experiments.
Characterization of the decellularized animal tissue ECM
The complete decellularization of the animal tissues was verified both microscopically over H&E staining of the decellularized tissues that were devoid of visible cell nuclei and quantitatively via DNA content (<50 ng per milligram of ECM), as described previously (17). The fluorescence intensity of DNA was measured at 430 nm after digestion of the extracted ECM with acidic pepsin solution (pH 6.5) at 65°C for 24 hours. The quality of the ECM retrieval was further measured by analyzing the major ECM protein components, such as collagen and GAGs. The total ECM collagen was estimated using the conventional hydroxyproline assay (55). The GAG content was analyzed as previously described (56), which quantified the amount of sulfated GAGs presented in tissues using 1,9-dimethylmethylene blue solution.
Mass spectrometry
Enzymatic “in liquid” digestion of DBT-ECM and lrECM
The lyophilized DBT-ECM was solubilized in 8 M urea containing 0.07% ProteaseMAX (Promega), 50 mM NH4HCO3 (pH 8.5), and 10 mM tris-HCl (pH 7.0) to a concentration of ~10 mg/ml. The suspension was sonicated in a sonicator bath three times for 1 min each. Meanwhile, 100 μg of lrECM extract (10 μl) was denatured in 30 μl of 8 M urea and 4.4 μl of 1% ProteaseMAX. Both the DBT-ECM and the lrECM solutions were stored overnight at 4°C to facilitate further solubilization. The homogeneously reconstituted samples were taken for the downstream 400-μl digestion, where the samples were diluted to 240 μl for a reduction step with 10 μl of 25 mM dithiothreitol (DTT), 115 μl of 25 mM NH4HCO3 (pH 8.5), 20 μl of MeOH, 40 μl of 8 M urea, and 35 μl of 0.2% ProteaseMAX; incubated at 52°C for 15 min; and cooled on ice down to RT. Then, 12 μl of 55 mM iodoacetic acid was added for alkylation and incubated in the dark at RT for 15 min. The reactions were quenched by adding 32 μl of 25 mM DTT. Subsequently, each sample was split into two portions. One portion was digested without further handling, whereas the second portion was treated with 6 μl of PNGase F enzyme (Promega) at 37°C for 2 hours. For protease digestion, 20 μl of trypsin/LysC mix solution [trypsin (50 ng/μl) from Promega and LysC (50 ng/μl) from WAKO in 25 mM NH4HCO3] and 40 μl of 25 mM NH4HCO3 (pH 8.5) were added to a final volume of 200 μl. Digestion was conducted at 42°C for 2 hours followed by the addition of 10 μl of trypsin/LysC solution and further digestion at 37°C overnight. The reactions were terminated by acidification with 2.5% trifluoroacetic acid (TFA) (0.3% final concentration).
NanoLC-MS/MS
The digested protein solutions (50 μg) were cleaned up using the OMIX C18 SPE cartridges (Agilent) following the manufacturer’s protocol, eluted in 20 μl of 60:40:0.1% ACN/H2O/TFA, completely dried in speed-vac, and reconstituted in 25 μl of 0.1% formic acid. Peptides were analyzed by NanoLC-MS/MS (Biotechnology Center, University of Wisconsin-Madison) using the Agilent 1100 Nanoflow system (Agilent) connected to a new-generation hybrid linear ion trap-orbitrap mass spectrometer (LTQ Orbitrap Elite, Thermo Fisher Scientific) equipped with an EASY-Spray electrospray source. Peptide chromatography before mass spectral analysis was accomplished using a capillary emitter column (PepMap C18, 3 μM, 100 Å, 150 mm × 0.075 mm, Thermo Fisher Scientific), onto which 2 μl of extracted peptides was automatically loaded. A nano–high-performance liquid chromatography (HPLC) system delivered solvents A [0.1% (v/v) formic acid] and B [99.9% (v/v) acetonitrile with 0.1% (v/v) formic acid] at 0.50 μl/min to load the peptides (over a period of 30 min) and at 0.3 μl/min to elute peptides directly into the nano-electrospray with a gradual gradient from 3 to 20% (v/v) solvent B over 154 min and concluded with a 12-min fast gradient from 20 to 50% (v/v) solvent B, at which time a 5-min flash-out from 50 to 95% (v/v) solvent B took place. As peptides eluted from the HPLC column/electrospray source, MS scans were acquired in Orbitrap with a resolution of 120,000 followed by MS2 fragmentation of the 20 most intense peptides detected in the MS1 scan from 380 to 1800 mass/charge ratio; redundancy was limited by dynamic exclusion.
Data analysis
Raw MS/MS data were converted to an mgf file format using MSConvert (ProteoWizard: Open Source Software for Rapid Proteomics Tools Development). The resulting mgf files were used to search against Mus musculus amino acid sequence database with decoy reverse entries and a list of common contaminants (87,154 total entries with 43,539 mouse proteins from UniProt database downloaded 18 September 2014) using in-house Mascot search engine 2.2.07 (Matrix Science) with variable methionine and proline oxidation and with asparagine and glutamine deamidation. Peptide mass tolerance was set at 15 parts per million, and fragment mass was set at 0.6 Da. Protein annotations, significance of identification, and spectrum-based quantification were carried out using Scaffold software (version 4.3.2, Proteome Software Inc.). Protein identifications were accepted if they could be established at greater than 80.0% probability within 1% false discovery rate and contained at least two identified peptides. Protein probabilities were assigned by the Protein Prophet algorithm (57). Proteins that contained similar peptides and that could not be differentiated on the basis of MS/MS analysis alone were grouped to satisfy the principles of parsimony. The spectrum counts presented in Table 1 and table S1 were expressed as average values from the protein samples that were processed using deglycosylation and glycosylation methods.
Characterization of the porosity and compliance of the TMS
The DBT-ECM powder was homogenized in an acidic pepsin solution at final concentrations of 50, 100, and 150 mg/ml followed by neutralization, molding, freeze-drying, and cross-linking (UV irradiation for solid porous and tyrosinase for hydrogel forms of TMS), as described above. The scaffolds were either subjected to SEM or optimal cutting temperature (OCT) compound–embedded, cross-sectioned, H&E-stained, and imaged under a light microscope. For SEM, the scaffolds were fixed with 2.5% glutaraldehyde for 30 min, washed five times in distilled water, kept at −80°C for an hour, and freeze-dried for at least 24 hours. The dried scaffolds were then exposed to SEM under low vacuum for imaging. The compliance or sponginess of the TMS scaffolds was demonstrated by retaining the shapes after gently pressing and releasing the scaffolds with the forceps (movie S1).
Scaffold fabrication from cell cultures
The cell ECM–based scaffolds were generated following the tissue TMS fabrication protocol with modifications on the decellularization process. The MM231 cells were collected by scraping from tissue culture dishes, pelleted by centrifugation, and subjected to rapid freeze-thaw cycles (RFTCs; 5 to 10 min in liquid nitrogen and 20 to 30 min on ice depending on the cell pellet size). After three rounds of RFTC, the pellet was washed three times in 1× PBS containing 0.05% of SDS followed by another three rounds of the RFTC and washing in 1× PBS. The decellularized MM231 ECM was pelleted, characterized, and processed for scaffold generation as for the decellularized tissue ECM.
Fabrication of 3D scaffolds using collagen or lrECM hydrogel
Collagen powder was dissolved in the acidic pepsin solution, as described above. Freeze-dried lrECM was reconstituted in distilled H2O. Both the collagen and the lrECM hydrogel solutions were prepared at the same concentration as that of the hydrogel derived from the DBTs or the MM231 cell cultures for the production of porous scaffolds, as described above.
Fabrication of 3D scaffolds from synthetic polymers
PCL and PLGA were dissolved in chloroform at final concentrations of 0.5 and 1 g/ml, respectively. Sodium bicarbonate (1 g/ml) was then added into the PCL and PLGA solution and mixed. The solutions were dispensed slowly into the Sigmacote-coated molds as described above and freeze-dried at −50°C for 48 hours to obtain spherical scaffolds. The scaffolds were washed in 0.1 N hydrochloric acid solution at RT for 6 hours (replacing the solution hourly) and then washed several times in distilled water until the pH of the water became neutral. The scaffolds were soaked in 70% ethanol for 3 to 5 hours, washed three to five times with 1× PBS, and kept in 1× PBS until use.
In vitro 3D tissue culture
Regular 3D culture
The porous DBT-TMS, DMT-TMS, DMM231, collagen, lrECM, PLGA, and PCL scaffolds were washed several times with sterile 1× PBS and preconditioned with culture medium in 24-well culture plates, a process that allows the settling down of the scaffolds at the bottom of the plates. A total of 1 × 10⁵ cells (human GM637 fibroblasts, mouse NIH/3T3 fibroblasts, and MCF10A or MM231 cells) in 10 to 20 μl of medium per scaffold (cell number can be adjusted according to the size of the scaffold used) were seeded onto the scaffolds after removing the medium from the wells. The cell-laden scaffolds were placed in a tissue culture incubator (37°C, 5% CO2) for 45 min to allow the cells to attach to the scaffolds. Then, optimal culture medium was added and replaced according to the experimental plans. The cultured samples were collected at the indicated time points, analyzed, or used in downstream experiments.
Compartmental 3D tissue culture
This is a multilayered scaffolding design involving the use of both porous and hydrogel forms of TMS derived from the same tissue ECM. After the cells were seeded on the porous scaffold as described above, a layer of hydrogel (0.5 to 1 mm thick) with or without cells was applied outside the cell-laden porous TMS followed by coating with additional layer(s) of the hydrogel with or without cells as desired. Here, MM231 cells were seeded on the porous TMS, and human or mouse fibroblasts were blended into the outer layer of the hydrogel, spaced with a blank hydrogel layer for the sake of observing cell proliferation, migration, and invasion into the blank gel layer. To ensure the spongy structure of the hydrogel layer(s) and good conductivity of nutrients and O2, we added tyrosinase (two parts; final concentration, 50 U/ml) into the mixture of cold culture medium (two parts) and the TMS hydrogel (six parts) on ice, and we kept it in the dark before coating onto the porous scaffold. The hydrogel coating was conducted in the hemispherical molds of the porcelain file with a bigger diameter than the scaffolds to be coated. For instance, the 2-mm-diameter cell-laden scaffolds can be coated in 3- or 4-mm-diameter molds. If a centralized positioning of the cell-laden TMS is desired, then a two-step hydrogel coating can be applied, where the bottom and the top portions of the hydrogel were casted separately. The file carrying the TMS assemblies was placed into an incubator (37°C, 5% CO2) for 45 min, during which the tyrosinase cross-linked the hydrogel. Then, the assemblies were transferred into the wells of culture plates and cultured under optimal conditions, as described above.
Proliferation assay in 3D culture
The proliferation of the cells grown on the different scaffolds or treated with the different drugs was measured using the CCK-8 reagent at the time points indicated. Briefly, the cell-laden scaffolds (triplicates for each condition) were cultured in 96-well plates. CCK-8 solution was added at a 1:10 dilution into the cultures. The colorimetric absorbance of the supernatants of the cultures that reflects the cell proliferation rate was measured at 490 nm using a Synergy 2 microplate reader (BioTek) after 4 hours of incubation (37°C, 5% CO2). Error bars represent SDs of the means of three independent experiments.
Live/Dead Cell staining
The survival of the cells grown on the 3D scaffolds was assessed using the Live/Dead Cell Staining Kit. The cell-carrying scaffolds at different time points or under different treatment conditions were collected and manually sectioned at a thickness of 250 to 500 μm. The sections were washed twice with 1× PBS (37°C), incubated in the staining solution (2 μM calcein-AM and 4 μM EthD-III in 1× PBS) at RT for 45 min, and imaged using fluorescence microscopy. Calcein-AM stains live cells green (under EGFP filter), whereas EthD-III stains dead cells red (under Texas Red filter).
In vivo experiments
MM231 cells (1 × 10⁵ per scaffold) were seeded on 2-mm-diameter spherical porous scaffolds (DBT, DMM231, and PLGA) and cultured under optimal conditions for 24 hours before implantation. Another group of the cell-laden scaffolds was coated with a layer of DBT-hydrogel an hour before the implantation as described before. The blank scaffolds without cells were used as negative controls. The scaffolds were implanted into the mammary fat pads of the 8-week-old female NOD/SCID mice (Charles River Laboratories). Each implantation condition was tested in triplicate over three different mice. The implants and tumors were assessed (size measurement with caliper and CT imaging), retrieved 4 weeks after implantation, and subjected to histological processing and extended analysis. The experiments in animals followed the Institutional Animal Care and Use Committee guidelines.
Histology and immunostaining
The cell-laden scaffolds from the tissue cultures and the harvested tumors from mice were washed twice with ice-cold 1× PBS and fixed in 10% neutral buffer formalin solution for 24 to 48 hours at 4°C. After rinsing with cold 1× PBS, the 3D cultures and the tumor samples were embedded into OCT or paraffin following standard protocols and sectioned at a thickness of 10 μm using a cryostat or a microtome. For the sections produced using the paraffin fixation, a deparaffinization and rehydration process was performed, followed by antigen retrieval using the tris-EDTA buffer [10 mM tris base, 1 mM EDTA solution, and 0.05% Tween 20 (pH 9.0)]. The sections were washed several times with water, stained with H&E or IF antibodies (corresponding primary and Alexa fluorophore–conjugated secondary antibodies) as described previously (7), and imaged using light or fluorescence microscopy for further analysis. The capillary and solid tissue occupancies (surface areas) on three consecutive cross sections (H&E-stained) of three replicate tumors were quantified using the ImageJ 1.49v software (National Institutes of Health) for statistical significance.
Drug screening
The T47D and BT474 breast cancer cells were used to test the efficacies of the two anticancer drugs, HT and Taxol, in 2D and 3D cultures. We seeded 2 × 10³ cells per well and 1 × 10⁵ cells per scaffold (in triplicates) on the 2D surface and the 3D scaffolds, respectively, and cultured them in 96-well plates for 7 days. The drugs at the final concentration of 1 μM were administered separately to the cultures on days 7, 9, 11, and 13 of culture for 24 hours, and cell survival and proliferation status were assessed on days 1, 8, 10, 12, 14, and 21 using the CCK-8 reagent and the Live/Dead Cell assay, respectively. After the measurement on day 14, a 7-day recovery period was included to evaluate the posttreatment proliferation potential of the cells. Three independent experiments were performed for statistical significance.
Statistical analysis
The statistical data were expressed as means ± SD with one-way analysis of variance (ANOVA) using the StatPlus (AnalystSoft Inc.; Build 6.0.0/Core v5.9.92). Error bars represent the SD of the means.
Supplementary Material
Acknowledgments
We thank C. S. Bathula and B. M. Ledall from Li’s laboratory and other WSU colleagues for discussions and critical comments. We are also thankful for the consistent support from the WSU Spokane Vivarium, led by M. J. Heineke, in collecting animal tissues and experiments using animals. We appreciate G. Sabat from the Biotechnology Center (Proteomics-Mass Spectrometry) of the University of Wisconsin-Madison for advice and discussions on the MS analyses. We apologize to scientists whose relevant publications were not cited because of space limitations. Funding: This project was supported by a WSU Startup Fund to W.L. A patent pertaining to this work entitled “Three-dimensional tissue matrix scaffold system” has been filed. Author contributions: W.L. and G.R. designed the project and wrote the manuscript. G.R. characterized the TMS and performed the experiments. Competing interests: G.R. and W.L. are authors on an international patent application related to this work (application no. PCT/US2017/039135, filed 23 June 2017). The authors declare that they have no other competing interests. Data and materials availability: All data needed to evaluate the conclusions in the paper are present in the paper and/or the Supplementary Materials. Additional data related to this paper may be requested from the authors. The MS proteomics data have been deposited to the ProteomeXchange Consortium via the PRoteomics IDEntifications repository with the data set identifier PXD005697 and 10.6019/PXD005697 for TMS and PXD005696 and 10.6019/PXD005696 for lrECM/Matrigel.
SUPPLEMENTARY MATERIALS
Supplementary material for this article is available at http://advances.sciencemag.org/cgi/content/full/3/9/e1700764/DC1
fig. S1. Comparision of the differences of the major proteins identified from TMS/mouse mammary tissue ECM versus those from lrECM hydrogel.
fig. S2. Monitor tumor growth with x-ray–based imaging.
fig. S3. Tumor development from the cancer cell–laden scaffolds in mice mammary tissues.
fig. S4. Quantification of the capillary areas on the cross sections of the tumors.
fig. S5. Histological examination of the tumors developed from the cancer cells grown on the PLGA scaffolds.
fig. S6. Analysis of T47D and BT474 cell proliferation on the different scaffolds and the potential of using the systems in drug screening.
fig. S7. Cancer cell survival and growth status on TMS after drug treatment.
fig. S8. Cancer cell survival and growth status on PLGA scaffolds after drug treatment.
table S1. The major proteins identified in the lrECM.
movie S1. Testing the sponginess of the TMS scaffolds.
REFERENCES AND NOTES
- 1.Rijal G., Li W., 3D scaffolds in breast cancer research. Biomaterials 81, 135–156 (2016). [DOI] [PubMed] [Google Scholar]
- 2.Debnath J., Brugge J. S., Modelling glandular epithelial cancers in three-dimensional cultures. Nat. Rev. Cancer 5, 675–688 (2005). [DOI] [PubMed] [Google Scholar]
- 3.Vargo-Gogola T., Rosen J. M., Modelling breast cancer: One size does not fit all. Nat. Rev. Cancer 7, 659–672 (2007). [DOI] [PubMed] [Google Scholar]
- 4.Hakanson M., Textor M., Charnley M., Engineered 3D environments to elucidate the effect of environmental parameters on drug response in cancer. Integr. Biol. 3, 31–38 (2011). [DOI] [PubMed] [Google Scholar]
- 5.Deiss F., Mazzeo A., Hong E., Ingber D. E., Derda R., Whitesides G. M., Platform for high-throughput testing of the effect of soluble compounds on 3D cell cultures. Anal. Chem. 85, 8085–8094 (2013). [DOI] [PMC free article] [PubMed] [Google Scholar]
- 6.Kenny P. A., Lee G. Y., Myers C. A., Neve R. M., Semeiks J. R., Spellman P. T., Lorenz K., Lee E. H., Barcellos-Hoff M. H., Petersen O. W., Gray J. W., Bissell M. J., The morphologies of breast cancer cell lines in three-dimensional assays correlate with their profiles of gene expression. Mol. Oncol. 1, 84–96 (2007). [DOI] [PMC free article] [PubMed] [Google Scholar]
- 7.Li W., Petrimpol M., Molle K. D., Hall M. N., Battegay E. J., Humar R., Hypoxia-induced endothelial proliferation requires both mTORC1 and mTORC2. Circ. Res. 100, 79–87 (2007). [DOI] [PubMed] [Google Scholar]
- 8.Zanoni M., Piccinini F., Arienti C., Zamagni A., Santi S., Polico R., Bevilacqua A., Tesei A., 3D tumor spheroid models for in vitro therapeutic screening: A systematic approach to enhance the biological relevance of data obtained. Sci. Rep. 6, 19103 (2016). [DOI] [PMC free article] [PubMed] [Google Scholar]
- 9.Lee K. Y., Mooney D. J., Hydrogels for tissue engineering. Chem. Rev. 101, 1869–1879 (2001). [DOI] [PubMed] [Google Scholar]
- 10.Kraehenbuehl T. P., Langer R., Ferreira L. S., Three-dimensional biomaterials for the study of human pluripotent stem cells. Nat. Methods 8, 731–736 (2011). [DOI] [PubMed] [Google Scholar]
- 11.Kibbey M. C., Maintenance of the EHS sarcoma and Matrigel preparation. J. Tissue Cult. Methods 16, 227–230 (1994). [Google Scholar]
- 12.Orkin R. W., Gehron P., McGoodwin E. B., Martin G. R., Valentine T., Swarm R., A murine tumor producing a matrix of basement membrane. J. Exp. Med. 145, 204–220 (1977). [DOI] [PMC free article] [PubMed] [Google Scholar]
- 13.Vukicevic S., Kleinman H. K., Luyten F. P., Roberts A. B., Roche N. S., Reddi A. H., Identification of multiple active growth factors in basement membrane Matrigel suggests caution in interpretation of cellular activity related to extracellular matrix components. Exp. Cell Res. 202, 1–8 (1992). [DOI] [PubMed] [Google Scholar]
- 14.Kleinman H. K., McGarvey M. L., Hassell J. R., Star V. L., Cannon F. B., Laurie G. W., Martin G. R., Basement membrane complexes with biological activity. Biochemistry 25, 312–318 (1986). [DOI] [PubMed] [Google Scholar]
- 15.Petersen O. W., Ronnov-Jessen L., Howlett A. R., Bissell M. J., Interaction with basement membrane serves to rapidly distinguish growth and differentiation pattern of normal and malignant human breast epithelial cells. Proc. Natl. Acad. Sci. U.S.A. 89, 9064–9068 (1992). [DOI] [PMC free article] [PubMed] [Google Scholar]
- 16.Badylak S. F., Xenogeneic extracellular matrix as a scaffold for tissue reconstruction. Transpl. Immunol. 12, 367–377 (2004). [DOI] [PubMed] [Google Scholar]
- 17.Pati F., Jang J., Ha D.-H., Kim S. W., Rhie J.-W., Shim J.-H., Kim D.-H., Cho D.-W., Printing three-dimensional tissue analogues with decellularized extracellular matrix bioink. Nat. Commun. 5, 3935 (2014). [DOI] [PMC free article] [PubMed] [Google Scholar]
- 18.DeQuach J. A., Mezzano V., Miglani A., Lange S., Keller G. M., Sheikh F., Christman K. L., Simple and high yielding method for preparing tissue specific extracellular matrix coatings for cell culture. PLOS ONE 5, e13039 (2010). [DOI] [PMC free article] [PubMed] [Google Scholar]
- 19.Wainwright D. J., Use of an acellular allograft dermal matrix (AlloDerm) in the management of full-thickness burns. Burns 21, 243–248 (1995). [DOI] [PubMed] [Google Scholar]
- 20.Crapo P. M., Gilbert T. W., Badylak S. F., An overview of tissue and whole organ decellularization processes. Biomaterials 32, 3233–3243 (2011). [DOI] [PMC free article] [PubMed] [Google Scholar]
- 21.Radosavljevic J., Nordlund E., Mihajlovic L., Krstic M., Bohn T., Buchert J., Velickovic T. C., Smit J., Sensitizing potential of enzymatically cross-linked peanut proteins in a mouse model of peanut allergy. Mol. Nutr. Food Res. 58, 635–646 (2014). [DOI] [PubMed] [Google Scholar]
- 22.Friedland J. C., Lee M. H., Boettiger D., Mechanically activated integrin switch controls alpha5beta1 function. Science 323, 642–644 (2009). [DOI] [PubMed] [Google Scholar]
- 23.Paszek M. J., Weaver V. M., The tension mounts: Mechanics meets morphogenesis and malignancy. J. Mammary Gland Biol. Neoplasia 9, 325–342 (2004). [DOI] [PubMed] [Google Scholar]
- 24.Lu W.-D., Zhang L., Wu C.-L., Liu Z.-G., Lei G.-Y., Liu J., Gao W., Hu Y.-R., Development of an acellular tumor extracellular matrix as a three-dimensional scaffold for tumor engineering. PLOS ONE 9, e103672 (2014). [DOI] [PMC free article] [PubMed] [Google Scholar]
- 25.Amatangelo M. D., Bassi D. E., Klein-Szanto A. J., Cukierman E., Stroma-derived three-dimensional matrices are necessary and sufficient to promote desmoplastic differentiation of normal fibroblasts. Am. J. Pathol. 167, 475–488 (2005). [DOI] [PMC free article] [PubMed] [Google Scholar]
- 26.Olumi A. F., Grossfeld G. D., Hayward S. W., Carroll P. R., Tlsty T. D., Cunha G. R., Carcinoma-associated fibroblasts direct tumor progression of initiated human prostatic epithelium. Cancer Res. 59, 5002–5011 (1999). [DOI] [PMC free article] [PubMed] [Google Scholar]
- 27.Camp J. T., Elloumi F., Roman-Perez E., Rein J., Stewart D. A., Harrell J. C., Perou C. M., Troester M. A., Interactions with fibroblasts are distinct in Basal-like and luminal breast cancers. Mol. Cancer Res. 9, 3–13 (2011). [DOI] [PMC free article] [PubMed] [Google Scholar]
- 28.Campbell J. J., Davidenko N., Caffarel M. M., Cameron R. E., Watson C. J., A multifunctional 3D co-culture system for studies of mammary tissue morphogenesis and stem cell biology. PLOS ONE 6, e25661 (2011). [DOI] [PMC free article] [PubMed] [Google Scholar]
- 29.Sadlonova A., Novak Z., Johnson M. R., Bowe D. B., Gault S. R., Page G. P., Thottassery J. V., Welch D. R., Frost A. R., Breast fibroblasts modulate epithelial cell proliferation in three-dimensional in vitro co-culture. Breast Cancer Res. 7, R46–R59 (2005). [DOI] [PMC free article] [PubMed] [Google Scholar]
- 30.Correa de Sampaio P., Auslaender D., Krubasik D., Failla A. V., Skepper J. N., Murphy G., English W. R., A heterogeneous in vitro three dimensional model of tumour-stroma interactions regulating sprouting angiogenesis. PLOS ONE 7, e30753 (2012). [DOI] [PMC free article] [PubMed] [Google Scholar]
- 31.Jaganathan H., Gage J., Leonard F., Srinivasan S., Souza G. R., Dave B., Godin B., Three-dimensional in vitro co-culture model of breast tumor using magnetic levitation. Sci. Rep. 4, 6468 (2014). [DOI] [PMC free article] [PubMed] [Google Scholar]
- 32.Sung K. E., Su X., Berthier E., Pehlke C., Friedl A., Beebe D. J., Understanding the impact of 2D and 3D fibroblast cultures on in vitro breast cancer models. PLOS ONE 8, e76373 (2013). [DOI] [PMC free article] [PubMed] [Google Scholar]
- 33.Hwang H., Park J., Shin C., Do Y., Cho Y.-K., Three dimensional multicellular co-cultures and anti-cancer drug assays in rapid prototyped multilevel microfluidic devices. Biomed. Microdevices 15, 627–634 (2013). [DOI] [PubMed] [Google Scholar]
- 34.Ladet S., David L., Domard A., Multi-membrane hydrogels. Nature 452, 76–79 (2008). [DOI] [PubMed] [Google Scholar]
- 35.Fang X., Sittadjody S., Gyabaah K., Opara E. C., Balaji K. C., Novel 3D co-culture model for epithelial-stromal cells interaction in prostate cancer. PLOS ONE 8, e75187 (2013). [DOI] [PMC free article] [PubMed] [Google Scholar]
- 36.Todhunter M. E., Jee N. Y., Hughes A. J., Coyle M. C., Cerchiari A., Farlow J., Garbe J. C., LaBarge M. A., Desai T. A., Gartner Z. J., Programmed synthesis of three-dimensional tissues. Nat. Methods 12, 975–981 (2015). [DOI] [PMC free article] [PubMed] [Google Scholar]
- 37.Kocatürk B., Versteeg H. H., Orthotopic injection of breast cancer cells into the mammary fat pad of mice to study tumor growth. J. Visualized Exp. 2015, 10.3791/51967 (2015). [DOI] [PMC free article] [PubMed] [Google Scholar]
- 38.Iorns E., Drews-Elger K., Ward T. M., Dean S., Clarke J., Berry D., El Ashry D., Lippman M., A new mouse model for the study of human breast cancer metastasis. PLOS ONE 7, e47995 (2012). [DOI] [PMC free article] [PubMed] [Google Scholar]
- 39.Fischbach C., Chen R., Matsumoto T., Schmelzle T., Brugge J. S., Polverini P. J., Mooney D. J., Engineering tumors with 3D scaffolds. Nat. Methods 4, 855–860 (2007). [DOI] [PubMed] [Google Scholar]
- 40.Öhlund D., Elyada E., Tuveson D., Fibroblast heterogeneity in the cancer wound. J. Exp. Med. 211, 1503–1523 (2014). [DOI] [PMC free article] [PubMed] [Google Scholar]
- 41.Cirri P., Chiarugi P., Cancer associated fibroblasts: The dark side of the coin. Am. J. Cancer Res. 1, 482–497 (2011). [PMC free article] [PubMed] [Google Scholar]
- 42.Bhowmick N. A., Neilson E. G., Moses H. L., Stromal fibroblasts in cancer initiation and progression. Nature 432, 332–337 (2004). [DOI] [PMC free article] [PubMed] [Google Scholar]
- 43.Jensen H. M., Chen I., DeVault M. R., Lewis A. E., Angiogenesis induced by “normal” human breast tissue: A probable marker for precancer. Science 218, 293–295 (1982). [DOI] [PubMed] [Google Scholar]
- 44.Lin E. Y., Li J.-F., Gnatovskiy L., Deng Y., Zhu L., Grzesik D. A., Qian H., Xue X.-n., Pollard J. W., Macrophages regulate the angiogenic switch in a mouse model of breast cancer. Cancer Res. 66, 11238–11246 (2006). [DOI] [PubMed] [Google Scholar]
- 45.Su G., Sung K. E., Beebe D. J., Friedl A., Functional screen of paracrine signals in breast carcinoma fibroblasts. PLOS ONE 7, e46685 (2012). [DOI] [PMC free article] [PubMed] [Google Scholar]
- 46.Olsen C. J., Moreira J., Lukanidin E. M., Ambartsumian N. S., Human mammary fibroblasts stimulate invasion of breast cancer cells in a three-dimensional culture and increase stroma development in mouse xenografts. BMC Cancer 10, 444 (2010). [DOI] [PMC free article] [PubMed] [Google Scholar]
- 47.Newman S. A., Frenz D. A., Tomasek J. J., Rabuzzi D. D., Matrix-driven translocation of cells and nonliving particles. Science 228, 885–889 (1985). [DOI] [PubMed] [Google Scholar]
- 48.Ridky T. W., Chow J. M., Wong D. J., Khavari P. A., Invasive three-dimensional organotypic neoplasia from multiple normal human epithelia. Nat. Med. 16, 1450–1455 (2010). [DOI] [PMC free article] [PubMed] [Google Scholar]
- 49.Kenny P. A., Bissell M. J., Tumor reversion: Correction of malignant behavior by microenvironmental cues. Int. J. Cancer 107, 688–695 (2003). [DOI] [PMC free article] [PubMed] [Google Scholar]
- 50.Malanchi I., Santamaria-Martinez A., Susanto E., Peng H., Lehr H.-A., Delaloye J.-F., Huelsken J., Interactions between cancer stem cells and their niche govern metastatic colonization. Nature 481, 85–89 (2012). [DOI] [PubMed] [Google Scholar]
- 51.Patrone M. V., Hubbs J. L., Bailey J. E., Marks L. B., How long have I had my cancer, doctor? Estimating tumor age via Collins’ law. Oncology (Williston Park) 25, 38–43 (2011). [PubMed] [Google Scholar]
- 52.Ferté C., Koscielny S., Albiges L., Rocher L., Soria J.-C., Iacovelli R., Loriot Y., Fizazi K., Escudier B., Tumor growth rate provides useful information to evaluate sorafenib and everolimus treatment in metastatic renal cell carcinoma patients: An integrated analysis of the TARGET and RECORD phase 3 trial data. Eur. Urol. 65, 713–720 (2014). [DOI] [PubMed] [Google Scholar]
- 53.Jordan N. V., Bardia A., Wittner B. S., Benes C., Ligorio M., Zheng Y., Yu M., Sundaresan T. K., Licausi J. A., Desai R., O’Keefe R. M., Ebright R. Y., Boukhali M., Sil S., Onozato M. L., Iafrate A. J., Kapur R., Sgroi D., Ting D. T., Toner M., Ramaswamy S., Haas W., Maheswaran S., Haber D. A., HER2 expression identifies dynamic functional states within circulating breast cancer cells. Nature 537, 102–106 (2016). [DOI] [PMC free article] [PubMed] [Google Scholar]
- 54.Ott H. C., Matthiesen T. S., Goh S.-K., Black L. D., Kren S. M., Netoff T. I., Taylor D. A., Perfusion-decellularized matrix: Using nature’s platform to engineer a bioartificial heart. Nat. Med. 14, 213–221 (2008). [DOI] [PubMed] [Google Scholar]
- 55.Williams G. M., Klein T. J., Sah R. L., Cell density alters matrix accumulation in two distinct fractions and the mechanical integrity of alginate–chondrocyte constructs. Acta Biomater. 1, 625–633 (2005). [DOI] [PubMed] [Google Scholar]
- 56.Buschmann M. D., Gluzband Y. A., Grodzinsky A. J., Hunziker E. B., Mechanical compression modulates matrix biosynthesis in chondrocyte/agarose culture. J. Cell Sci. 108, 1497–1508 (1995). [DOI] [PubMed] [Google Scholar]
- 57.Nesvizhskii A. I., Keller A., Kolker E., Aebersold R., A statistical model for identifying proteins by tandem mass spectrometry. Anal. Chem. 75, 4646–4658 (2003). [DOI] [PubMed] [Google Scholar]
Associated Data
This section collects any data citations, data availability statements, or supplementary materials included in this article.
Supplementary Materials
Supplementary material for this article is available at http://advances.sciencemag.org/cgi/content/full/3/9/e1700764/DC1
fig. S1. Comparision of the differences of the major proteins identified from TMS/mouse mammary tissue ECM versus those from lrECM hydrogel.
fig. S2. Monitor tumor growth with x-ray–based imaging.
fig. S3. Tumor development from the cancer cell–laden scaffolds in mice mammary tissues.
fig. S4. Quantification of the capillary areas on the cross sections of the tumors.
fig. S5. Histological examination of the tumors developed from the cancer cells grown on the PLGA scaffolds.
fig. S6. Analysis of T47D and BT474 cell proliferation on the different scaffolds and the potential of using the systems in drug screening.
fig. S7. Cancer cell survival and growth status on TMS after drug treatment.
fig. S8. Cancer cell survival and growth status on PLGA scaffolds after drug treatment.
table S1. The major proteins identified in the lrECM.
movie S1. Testing the sponginess of the TMS scaffolds.