Abstract
Purpose
To demonstrate the feasibility of biexponential T1ρ relaxation mapping of human knee cartilage in-vivo.
Methods
A 3D customized Turbo-Flash sequence was used to acquire T1ρ-weighted images from healthy volunteers employing a standard 3T MRI clinical scanner. Series of T1ρ-weighted images were fitted using monoexponential as well as biexponential models with two- and four- parametric non-linear approach, respectively. Non-parametric Kruskal-Wallis and Mann-Whitney U statistical tests were used to evaluate the regional relaxation and gender differences respectively with a significance level, p-value of 0.05.
Results
Biexponential relaxations were detected in the cartilage of all volunteers. Short/long relaxation components of T1ρ were estimated to be 6.9/51.0ms respectively. Similarly, the fractions of short/long T1ρ were 37.6/62.4%. The monoexponential relaxation of T1ρ was 32.6ms. The experiments showed good repeatability with coefficient of variation (CV) of less than 20%
Conclusion
Biexponential relaxation model better fit to T1ρ relaxation decay than monoexponential model in the knee cartilage(R2.4.1). Biexponential T1ρ components could potentially be used to increase the specificity to detect early osteoarthritis by measuring different water compartments and their fractions.
Keywords: T1ρ relaxation, bi-exponential fitting, articular cartilage
Graphical abstract
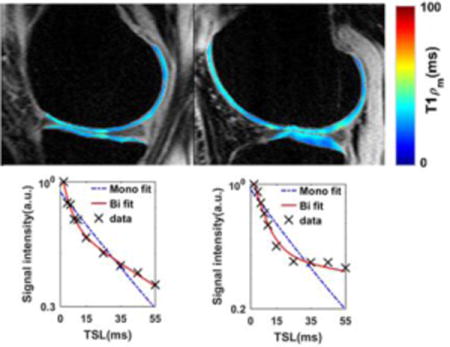
In this study, we demonstrated the feasibility of in-vivo biexponential T1ρ relaxation mapping of knee articular cartilage of 8 healthy volunteers using 3T MRI in clinically feasible scan times. Our preliminary results show that the biexponential model may better represents the T1ρ relaxation decay in articular cartilage. It is possible distinguish between tightly bound and loosely bound water compartments associated with macromolecules in the articular cartilage.
1 INTRODUCTION
Osteoarthritis (OA) is a degenerative, heterogeneous, and multifactorial disease that is mainly identified by the progressive loss of hyaline articular cartilage1. The symptoms include joint pain, limited range of motion, stiffness, and swelling2,3. Several methods including plain radiographs, microfocal radiographs, radionuclide imaging, arthrography, computed tomography (CT), ultrasound, arthroscopy and magnetic resonance imaging (MRI) of articular cartilage have been used to detect OA4,5 among these methods, MRI shows more sensitivity in detecting Osteoarthritis5. Different MRI techniques have been proposed to detect OA6. The standard techniques for imaging cartilage are fat-saturated T2-weighted, proton density-weighted fast spin echo (FSE) sequences, and T1-weighted spoiled gradient echo (SPGR) sequences7. However, these standard techniques are insensitive in detecting the early stage OA8.
Articular cartilage is a connective tissue of arthrodial joints that is composed of a dense extracellular matrix (ECM). ECM is principally composed of collagen (~20%), proteoglycans (PG, ~5%), and water (~75%)9,10. Early stage OA is associated with loss of PG, increase in water content, and changes in the structure of collagen fibers(R2.4.2)11,12. Spin-lattice relaxation in the rotating frame (T1ρ) has been extensively used for quantifying the biochemical changes associated with PG, water content and disruption of collagen and anisotropy8,13–16. Different water compartments in articular cartilage lead to different T1ρ relaxation components. As a result of the change in the biochemistry of cartilage and increase in water content due to OA, an elevated T1ρ relaxation time is expected. T1ρ relaxation time was measured in-vivo and the relationship between the elevation of T1ρ and cartilage degeneration has been demonstrated in previous studies8,11,13,17–20. T1ρ is found to be sensitive to the slow motional interactions between local macromolecular environments and bulk water21, and as a result to proteoglycan content in articular cartilage22.
Different components of relaxation can be identified by MR relaxation experiments on cartilage23–26, such as T1ρ from collagen or proteoglycan (PG) macromolecules, from fragmented PG molecules, from water molecules trapped within collagen fibrils, and from free water molecules(R2.4.3). Hence, biexponential fitting could potentially provide more information on different water compartments than monoexponential fitting. To the best of our knowledge, in all of the previous in-vivo studies8,11,13,14,17,20, T1ρ was described by a monoexponential decay model, which shows the mean of relaxation time from all of the water compartments. In addition biexponential studies have been limited to ex-vivo cartilage tissue specimens or animal studies23,26 and biexponential T1ρ has yet to be reported in-vivo. The goal of this paper is to demonstrate the feasibility of in-vivo biexponential analysis of T1ρ relaxation times of articular cartilage in the human knee joint using 3T MRI in clinically feasible scan times.
2 METHODS
2.1 Monte Carlo Simulations
The mono- exponential T1ρ (T1ρm) relaxation can be estimated by fitting the signal intensities of each pixel at different spin-lock durations (S (TSL)) to:
| [1] |
Similarly, the biexponential relaxation components were estimated using:
| [2] |
Where TSL is the spin-lock duration, T1ρs and T1ρl correspond to the short and long relaxation time components, respectively. The weightings (fractions) of the short (As) and long components (Al) are usually reported in percentage as as % = 100 × As/(As + Al) and al % = 100 × Al/(As + Al), respectively.
Monte Carlo simulations27 were performed to determine a set of TSLs sufficient for estimating four parameters in a(R2.4.4) biexponential model (two relaxation times and the corresponding fractions), as well as covering the possible T1ρ values in the cartilage. For(R2.4.5) given signal to noise ratio (SNR) the smaller set of TSLs is desired to minimize the total acquisition time.
To perform the simulation, a set of signals was generated with different set of spin‐lock durations (TSL) with known T1ρ components fractions (assuming As + Al = 1) and time constants. A random noise with normal distribution N(0, σ) was added to the signal. The SNR is defined as 1/σ28. The relaxation components were then estimated by fitting the biexponential model to the noisy signals. The process was repeated for 1000 independent noise trail and the mean absolute percentage error (MAPE) was calculated as:
| [3] |
Where ya and ye are the actual and estimated values, respectively and n is the total number of noise trail (n = 1000) in Monte Carlo simulation.
2.2 T1ρ-weighted MRI Acquisition
T1ρ-weighted MR images were acquired on a 3T whole body clinical MRI scanner (Prisma, Siemens Healthcare, Erlangen, Germany) with a 15-channel Tx/Rx knee coil (QED, Cleveland OH). A 3D Cartesian turbo-Flash sequence was customized to enable T1ρ imaging with varying spin-lock durations.
The most basic T1ρ preparation module consists of a 90° RF pulse along the x-axis to tip the magnetization to the transverse plane, a long continuous spin-lock pulse along the y-axis to lock the magnetization in the transverse plane, and finally a second 90° RF pulse in the opposite direction of the first one (−x) to tip the magnetization back to its original direction before the readout. However, in practice, the actual spin-lock field strength and direction are affected by the field inhomogeneities. Any Bo or B1 inhomogeneity causes the magnetization to deviate from the transverse plane which leads to a complicated magnetization evolution instead of the exponential decay related only to T1ρ relaxation time29. Several methods were proposed in the literature to compensate for the field inhomogeneities30–36. The paired spin-lock pulse method35,36 which was used in this study tries to self-compensate the B1 inhomogeneities by changing the phase of spin-lock pulse. In this method, the spin-lock pulse was divided into four segments with alternative phase to compensate for B1 inhomogeneities and a refocusing (180°) pulse was applied between two pairs to compensate the B0 inhomogeneities, respectively. The T1ρ imaging pulse sequence diagram is shown in Figure 1. A long delay time was added after each phase line acquisition for T1 recovery.
Figure 1.
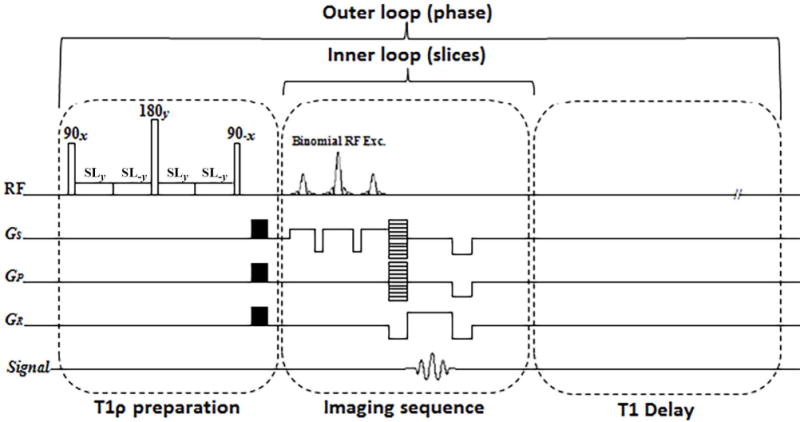
The imaging sequence timing diagram consists of T1ρ preparation, 3D turbo-Flash readout, and T1 recovery delay. To compensate the effect of B1 inhomogeneities, the spin-lock pulse (SL) was divided into four segments with alternative phase. A 180° refocusing pulse was applied between two pairs for B0 inhomogeneity compensation. One phase line from all slices was acquired after applying the preparation module (inner loop). After T1 restoration delay the preparation module was applied again to acquire another phase line (outer loop).
To estimate T1ρ relaxation, multiple sets of 3D scans were acquired with different spin-lock durations (TSL). The sequence acquisition parameters were: TR/TE 1500ms/4ms, flip angle 8°, matrix size 256 × 128 × 64, spin-lock frequency=500Hz, slice thickness = 2mm, field of view (FOV) = 120mm2, and receiver bandwidth = 515 Hz/pixel.
2.3 Ex-vivo Bovine Cartilage Study
Fresh bovine patellae cartilage specimens (n = 3, ~6months old) were obtained from a slaughterhouse (Max Insel Cohen, Inc., Livingston, NJ) and equilibrated in phosphate-buffered saline (PBS) for one hour prior the MRI study. The tissue was covered with parafilm to avoid dehydration during the scans. T1ρ-weighted images were acquired from 3 specimens. The scans were taken in axial plane at 15 different TSLs including 0.5/2/4/6/7/8/10/12/15/20/25/35/45/55/65ms. To investigate the effect of reduced SNR due to GRAPPA(R2.4.6)-parallel imaging37 on the estimated relaxations time, the images were acquired with acceleration factor of AF = 1(fully sampled), 2, 3 and 4. The total acquisition time for 3D data set with 15 TSLs were 46, 27, 22, and 18 minutes for AF = 1 to 4 respectively.
2.4 In-vivo knee Study
Eight healthy volunteers (n=4 females, and n=4 males) were recruited for this study with a mean age of 30±4 years, mean weight of 63±15 kg, and mean height of 169±12cm (female volunteers: mean age of 26 ± 3 years, weight of 52 ± 6 kg and height of 159±6 cm; male volunteers: age of 30±3 years, weight of 74±12 kg and height of 177±3cm). The study was approved by the institutional review board (IRB) and all eight volunteers provided written informed consent prior to MRI scanning.
T1ρ-weighted images were acquired in sagittal plane using a binomial water excitation pulse as RF excitation at 10 different TSLs including 2/4/6/8/10/15/25/35/45/55 ms. The GRAPPA parallel imaging method with the acceleration factor of AF= 3 was used to decrease the total acquisition time from 30 to 15 minutes for in-vivo imaging.
The acquired T1ρ-weighted scans were analyzed using a custom-written script in MATLAB (R2016a, The MathWorks Inc., Natick, MA, USA). T1ρ relaxation maps were calculated pixel by pixel over five consecutive slices in five regions of interest (ROI): medial-tibia (MTC), medial-femoral (MFC), lateral-tibia (LTC), lateral-femoral (LFC), and Patellar (PC) cartilages (Figure 4).
Figure 4.

Regions of interest (ROI) for T1ρ mapping (a) medial femoral cartilage (MFC) in red, medial-tibial-cartilage (MTC) in cyan, (b) lateral-femoral cartilage (LFC) in yellow, lateral-tibial cartilage (LTC) in green, and (c) patellar cartilage (PC) in blue.
In the final biexponential fitting maps, the pixels that were not satisfied the following condition was excluded from the map38.
| [4] |
Statistical Analysis
The mean values of T1ρ were calculated across the volunteers in each ROI. Then, a non-parametric Kruskal-Wallis test was applied to assess the significance of the difference in relaxation times between different ROIs (MTC, MFC, LTC, LFC, and PC). Moreover, Mann-Whitney U test was applied on each ROI to compare between male and female volunteers. In the statistical test, P = 0.05 was considered as the threshold to reject the null hypothesis.
Repeatability
To investigate the repeatability, the experiment was repeated on three volunteers on two different days with two weeks gap. The mean and standard deviation (SD) of T1ρ relaxation times were calculated for each volunteer across two-session and the coefficient of variation (CV) is calculated as CV = SD/Mean to assess intra-subject repeatability.
To evaluate the inter-subject repeatability, the root mean square CV is calculated as:
| [5] |
Where CVi is the CV of an individual volunteer and N is the total number of volunteers (N=3).
3 RESULTS
3.1 Monte Carlo Simulations
The results of Monte Carlo simulations showed that the estimation error for short and long relaxations and their fractions decrease by increasing the number of TSLs (Figure 2.a) at the cost of longer total acquisition time. As shown in Figure 2a, the estimation error for 10 TSL points is less than 10% for all parameters and the improvement using 15 TSL points is not significant considering the fact that the total acquisition time will increase by 50%. Hence, 10 TSL points was selected for the rest of the simulations as well as in-vivo studies.
Figure 2.
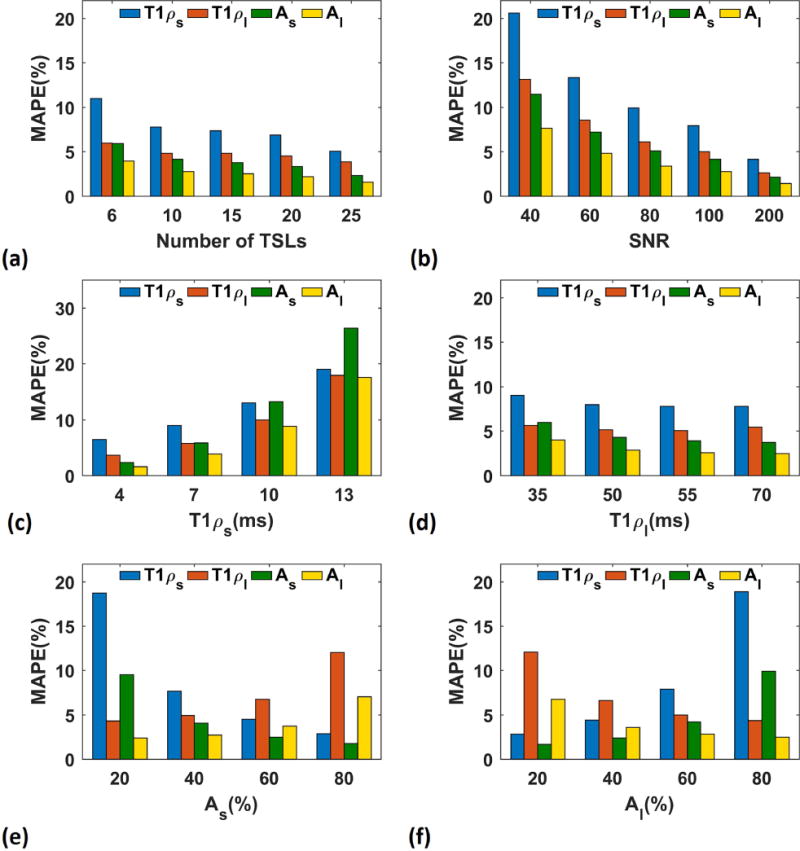
Monte Carlo simulations. Effect of different parameters on biexponential model (a) the estimation mean-absolute percentage error (MAPE) decreases by increasing the number of TSLs, (b) higher SNR leads to less estimation error, (c) the estimation is more accurate for shorter short component (T1ρs), (d) the estimation is more accurate for larger long component (T1ρl), and (e, f) the component with larger fraction (short component, As, in (e) and long component, Al in (f)) has better estimation than the component with shorter fraction.
As shown in Figure 2.b, higher SNR leads to smaller error. The SNR of the in-vivo knee cartilage are around 60 so about 15% error for short component and less than 10% for the long component and fractions are expected in in-vivo study based on the simulation result. As the ranges of the components are different in different tissues and subjects, we investigated the effect of each parameter on the biexponential model. As shown in Figure 2.c and Figure 2.d, the error is higher for longer short components while the longer long component can be estimated more accurately. Moreover, as shown in Figure 2.e and Figure 2.f, the component with larger fraction has smaller error than the component with smaller fraction.
3.2 Ex-vivo bovine cartilage Study
Figure 3a–c shows an example of T1ρ maps of a bovine patella. Comparing the relaxation times estimated from scans with different GRAPPA acceleration factor showed that there was about 5% difference between the estimated values from fully sampled data and GRAPPA with acceleration factor of 3 (Figure3.d) while the total acquisition time decreases more than 50% from 32 to 15 minutes. Figure 3.e shows the difference between the estimation using 15 TSLs as reference and 10 and 6 TSLs. There is less than 5% difference between the estimated value using 15 and 10 TSL points which confirms our simulation study. Hence; 10 TSL points were selected as a good tradeoff between time and accuracy for in-vivo knee studies.
Figure 3.
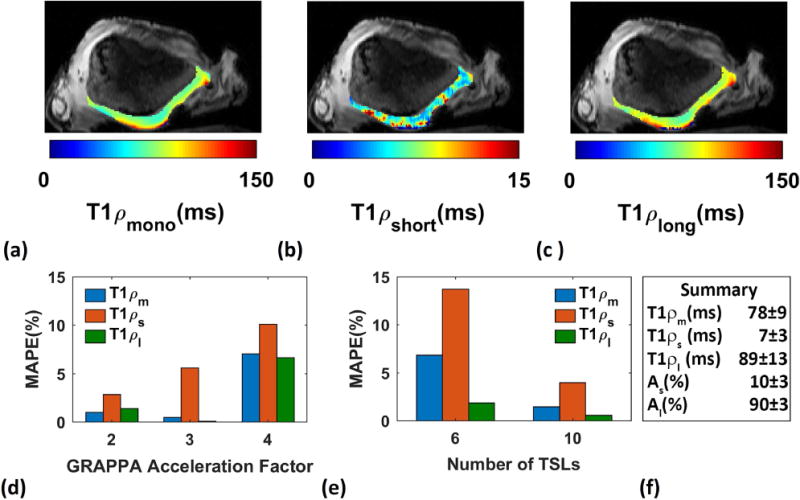
Ex-vivo study on bovine patella. (a) mono (b) short (c) long components spatial T1ρ maps, (d) the estimated parameters from scans acquired with AF 3 have less than 5% difference from the fully sampled scans, (e) the estimated relaxations using 10 TSLs has less than 5% difference from the estimated relaxations using 15 TSL points, and (f) summary of estimation.
3.3 In-vivo Knee Study
Examples of T1ρ maps in medial, lateral and patellar cartilages as well as the locations of pixels with biexponential decay are shown in Figure 5.
Figure 5.
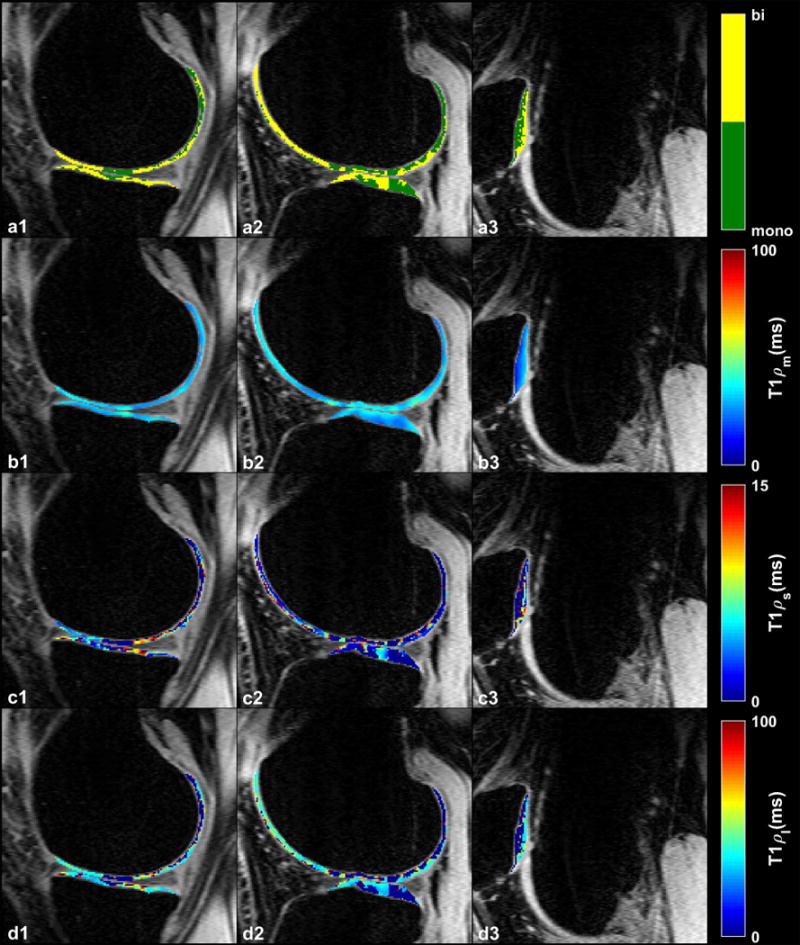
Representative examples of T1ρ maps in (a1–d1) medial (a2–d2) lateral and (a3–d3) patellar cartilages. (a1–a3) Binary maps show the distribution of the pixels with monoexponential and biexponential fitting. (b1–b3) Calculated monoexponential T1ρ map (T1ρm). (c1–c3) Biexponential short (T1ρs) and (d1–d3) long (T1ρl) T1ρ maps.
T1ρ decay in 42% of the pixels in all ROIs was biexponential. The summary of T1ρ descriptive statistics over 8 volunteers are shown in Table 1. The short component has a lower fraction (37.6%) than the long component (62.4%). We expect that the short component is related to water tightly bound to PG and collagen macromolecules while the long component corresponds to the water loosely bound to macromolecules.
Table 1.
Summary of mean values for the monoexponential, short, and long biexponential components of T1ρ and the ratio of biexponential pixels to a total number of pixels calculated in five ROIs.
| ROI | Tmono (ms) | Tshort (ms) | Tlong (ms) | as (%) | al (%) | Ratio (%) | |
|---|---|---|---|---|---|---|---|
| MTC | Mean | 33.24 | 7.98 | 47.88 | 36.86 | 63.14 | 46 |
| SD | 6.95 | 1.48 | 4.50 | 1.48 | 4.50 | 18 | |
| R2 | 0.96 | 0.98 | 0.98 | – | – | – | |
| MFC | Mean | 38.72 | 7.98 | 53.14 | 32.78 | 67.22 | 34 |
| SD | 5.12 | 1.95 | 6.77 | 1.95 | 6.77 | 19 | |
| R2 | 0.95 | 0.97 | 0.97 | – | – | – | |
| LTC | Mean | 34.17 | 6.04 | 48.92 | 39.77 | 60.23 | 44 |
| SD | 4.13 | 0.87 | 5.20 | 0.87 | 5.20 | 17 | |
| R2 | 0.95 | 0.97 | 0.97 | – | – | – | |
| LFC | Mean | 35.62 | 6.67 | 49.83 | 32.98 | 67.02 | 33 |
| SD | 6.14 | 1.56 | 8.96 | 1.56 | 8.96 | 10 | |
| R2 | 0.91 | 0.94 | 0.94 | – | – | – | |
| PC | Mean | 29.39 | 5.53 | 45.27 | 45.63 | 54.37 | 53 |
| SD | 6.50 | 1.62 | 8.98 | 1.62 | 8.98 | 17 | |
| R2 | 0.95 | 0.96 | 0.96 | – | – | – | |
|
| |||||||
| Global | Mean | 34.228 | 6.84 | 49.008 | 37.604 | 62.396 | 42 |
| SD | 5.768 | 1.496 | 6.882 | 1.496 | 6.882 | 16.2 | |
| R2 | 0.944 | 0.964 | 0.964 | – | – | – | |
SD: Standard Deviation
R2: Adjusted R square shows the goodness of fit
(R2.4.7)The deviation of data points from the straight line shows the existence of more than one exponential term. Moreover, the smaller residuals of biexponential model (Figure 6e–h) confirm that. a biexponential fit is better than monoexponential fit. (R2.4.7)
Figure 6.
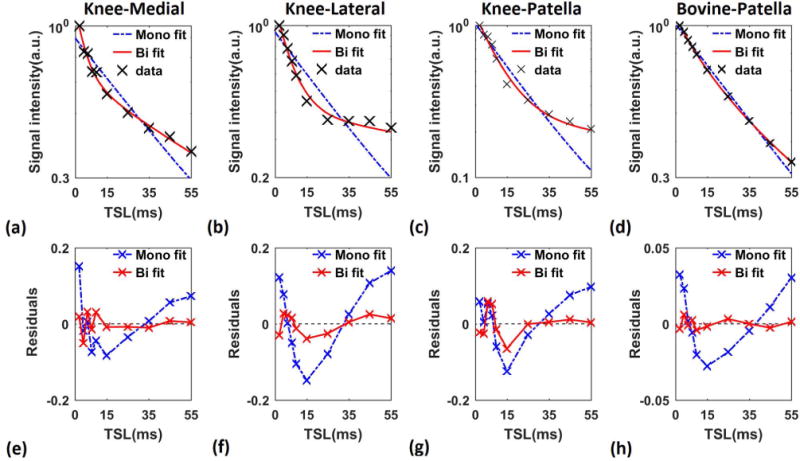
Mono- vs biexponential fitting. T1ρ decay in logarithmic scale and the fit residuals of representative pixels in (a, e) medial (b, f) lateral and (c, g) patellar cartilage of human knee and (d, h) bovine patella. The deviation of the data from the straight line (a–d) shows the existence of more than one exponential term. The smaller biexponential fit residual in comparison with mono exponential (e–h) the biexponential model fits better to the data than the monoexponential model.
Figure 7 shows the mean mono- and biexponential components of T1ρ among all volunteers as well as male and female volunteers. The Mann–Whitney U test results showed no significant difference between male and female for each component per ROI.
Figure 7.

Mean estimated (a) mono (b) long and (c) short T1ρ in female (N=4), male (N=4), and all volunteers (N=8) in the medial-femoral, (MFC), medial-tibial (MTC), lateral-femoral (LFC), lateral-tibial (LTC), and patellar (PC) cartilage.
The Kruskal-Wallis test result showed a statistically significant difference (P = 0.017) in monoexponential T1ρ between medial-tibial and patellar cartilage. No statistically significant difference was observed in biexponential components in different ROIs.
The intra-subject repeatability (i.e. repeating the experiment on the same subject) described by the coefficient of variation (CV) is shown in Table 2. The experiments showed good repeatability in the entire region (CV < 20%). No statistically significant difference was observed between CVs in different ROIs.
Table 2.
The Intra-subject repeatability.
| T1ρm
|
T1ρs
|
T1ρl
|
a1s
|
a1l
|
|||||||||||
|---|---|---|---|---|---|---|---|---|---|---|---|---|---|---|---|
| ROI | Mean (ms) |
SD (ms) |
CV (%) |
Mean (ms) |
SD (ms) |
CV (%) |
Mean (ms) |
SD (ms) |
CV (%) |
Mean (ms) |
SD (ms) |
CV (%) |
Mean (ms) |
SD (ms) |
CV (%) |
| MTC | 29.5 | 0.7 | 2.4 | 7.4 | 0.3 | 3.8 | 43.0 | 2.8 | 6.6 | 34.5 | 4.9 | 14.3 | 65.5 | 4.9 | 7.6 |
| MFC | 36.5 | 2.1 | 5.8 | 7.2 | 0.7 | 9.8 | 55.5 | 2.1 | 3.8 | 36.0 | 0.0 | 0.0 | 64.0 | 0.0 | 0.0 |
| LTC | 31.5 | 0.7 | 2.2 | 6.7 | 0.4 | 6.3 | 47.0 | 1.4 | 3.0 | 38.5 | 4.9 | 12.9 | 61.5 | 4.9 | 8.0 |
| LFC | 26.0 | 0.0 | 0.0 | 7.3 | 1.6 | 21.3 | 50.5 | 4.9 | 9.8 | 47.0 | 2.8 | 6.0 | 53.0 | 2.8 | 5.3 |
| PC | 32.0 | 1.4 | 4.4 | 5.1 | 1.0 | 19.4 | 40.5 | 3.5 | 8.7 | 40.5 | 4.9 | 12.2 | 59.5 | 4.9 | 8.3 |
The inter-subject repeatability was measured as rmsCV (Figure 8). Long T1ρ relaxation has less variability (mean: 7%, range: [9%-18%]) than the short T1ρ relaxation (mean: 17%, range: [~15%-19%])), probably because the short component is more sensitive to change and also has larger potential differences between volunteers39
Figure 8.
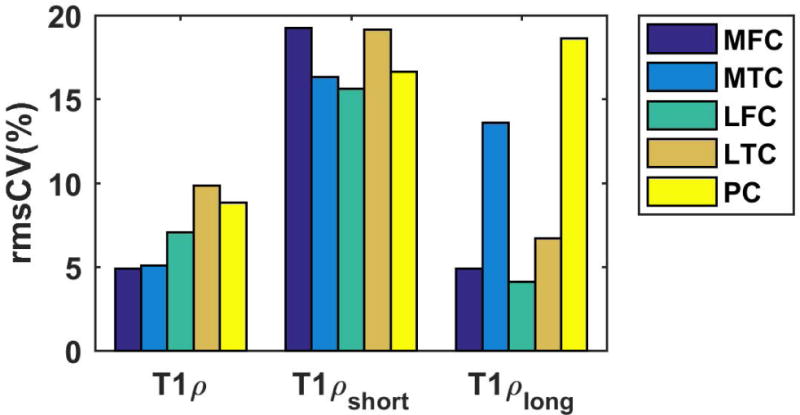
Inter-subject repeatability. The root mean square coefficient of variation (rmsCV) is less than 20% in all the ROIs.
The highest rmsCV of monoexponential T1ρ was observed in lateral-tibial (~10%) cartilage, while the highest rmsCV of short and long components were in medial-femoral (~19) and patellar cartilage (~18) respectively.
4 DISCUSSION
In this paper, we present a 3T MRI technique for in-vivo, bi-component T1ρ analysis of articular cartilage. Five ROIs were defined in the articular cartilage of knee joints and T1ρ were measured in each ROI. The results showed that biexponential fitting may better present and distinguish the different relaxation times in the cartilage due to different water compartments associated with PG and collagen macromolecules.
As demonstrated by Redfield40, in the presence of a spin-lock RF field, the spins will interact with different internal Hamiltonian such as chemical shift, J-coupling, chemical exchange, and dipole-dipole interaction40–41. In general, the interaction can be classified into three categories (1) scalar coupling, (2) dipole–dipole, and (3) chemical exchange processes. Depending upon the tissue environment, several mechanisms may contribute differently to the T1ρ relaxation. This contribution, R1ρ (1/ T1ρ), can be expressed as41:
| [6] |
Where R1ρFD is the dipolar relaxation due to molecular rotational processes (fluctuating dipolar fields), R1ρDiff is the diffusion contribution, R1ρEx is related to exchange processes associated with water protons and other exchangeable protons on macromolecules, and R1ρRDI is the contribution due to residual static dipolar coupling41.
In the cartilage, T1ρ relaxation is predominately affected by spin exchange-mediated relaxation due to glycosaminoglycans (GAG) (e.g. −OH and −NH); residual dipolar interaction of water molecules associated with collagen and it is influenced by the orientation of cartilage41
The estimated monoexponential T1ρ range in this study was comparable(R2.4.8) to the other studies42–45. Some of the previous studies reported a higher value of T1ρ8,11,15,42,46 .The difference is probably due to the partial volume effects (PVE) and limited temporal points. The smaller slice thickness (2mm) in our experiments leads to less PVE and as a result more accurate estimation of relaxation times in comparison with the other studies with a slice thickness of 3mm or 4mm. Moreover, we mapped the relaxation times using 10 data points (TSL), in contrast to other studies which used only 4 or 5 data points42–44. Hence, the lower slice thickness and more temporal points of our study result in more accurate T1ρ estimation. However, the total acquisition time in our experiment is higher than previous works since we acquired more data points. We plan to reduce the total acquisition time by employing compressed sensing47,48 in addition to parallel imaging in the future.
To the best of our knowledge, biexponential T1ρ measurement has only been done on tissue specimens or animal models23,49. For example, a biexponential analysis of T1ρ in rat muscles was reported by Yuan et al49. The mono, short and long T1ρ were measured as (~30 – 33 ms), (~9–11ms) and (~37 – 41ms), respectively. The short and long fractions were (~12–20%) and (~80–88%). 25 temporal points from TSL = 1ms to 60 ms were acquired in this study at the cost of increasing the total acquisition time to ~30 minutes49. Our T1ρ estimations using 10 TSLs acquired in 15 minutes scans are in good agreement with this study considering the difference between knee articular cartilage and rat muscle tissue49 The cartilage extracellular matrix is mainly composed of water (~75%), type II collagen (~20%) and PG (~5%), while the rat skeletal musclemainly consists of both intra and extracellular water (~75%), different types of proteins (~20%, Myosin, Actin, Tropomyosin/Troponin, Myoglobin etc) and other components (~5%, salts, phosphates, ions, glycogen and macronutrients). The difference in chemical compositions may be attributed to differences in relaxation times and corresponding fractions between rat skeletal muscle and articular cartilage (R2.1).
The short component is thought to be related to the water tightly bound to PG and collagen macromolecules while the long component corresponds to water loosely bound to macromolecules. Further investigation is warranted for evaluation of sensitivity and specificity of bicomponent T1ρ for cartilage GAG in different disease models (Knee OA and cartilage repair).
Li et al.45 investigated the repeatability of T1ρ relaxation time measurement and the rmsCV of 4.8%–8.8% for T1ρ has been reported across all the ROIs. Their numbers are in agreement with our experiments where the rmsCV of 4.9%-9.85% was measured for monoexponential T1ρ. Mosher et al9. investigated the reproducibility of measuring T1ρ in healthy control group and osteoarthritis (OA) patients (T1ρ rmsCV: 5.74%-13.58% in healthy volunteers). Similar results were also observed in our study. The good agreement was also observed if we compare the rmsCV in different ROIs. Note that the reproducibility was evaluated in Mosher study by acquiring the data from different sites while we investigated the repeatability by acquiring all the data on the same scanner.
The T1ρ imaging sequences are SAR intensive due to the application of long spin-lock pulse50,51. SAR increases as square of RF pulse flip angle41 which is related to amplitude and duration of the spin-lock pulse. Longer TR is needed for satisfying the SAR limitation. In our proposed method, the long TR (1500ms) used for T1 recovery also eliminates the SAR Problem. Real time SAR monitoring during the in-vivo scans showed that it was always below the limit.
There were a number of limitations to our study. We had a small number of healthy volunteers.(R2.4.9) Moreover, biexponential condition of 4×T1ρs < T1ρl may produce some bias. We chose this condition based on the suggestion by Juras et. al38 and confirmed it with our own experiments.
Field inhomogeneities may also produce some complications since the T1ρ imaging is very sensitive to B0 and B1 inhomogeneities. To compensate this effect, we used the refocusing pulse (B0 inhomogeneity compensation) and paired spin-lock pulse with phase alteration (B1 inhomogeneity compensation) in T1ρ module. In addition, the manual shimming was required before acquiring the scans.
Additionally, the magic angle effect can influence T1ρ value due to the dipolar interactions of fiber orientation with respect to B0. As shown by Henkelman et al.52, in bovine articular cartilage, the biexponential behavior disappeared when the tissue’s orientation to B0 is about 55°. To diminish the magic angle effect, the spin-lock frequency of at least 1–2 kHz is required53 which is not feasible for an in-vivo study. Moreover, at the high spin-lock frequency, as reported in an ex-vivo study23 only the monoexponential behavior can be observed. Hence, we chose a 500Hz spin-lock frequency as a good trade-off between reducing the influence of residual dipole interactions and observing the biexponential behavior.
Finally, only asymptomatic volunteers were scanned in this study. We plan to further investigate the biexponential T1ρ relaxation times in OA patients.
5 CONCLUSION
We have demonstrated the feasibility of biexponential T1ρ analysis of human cartilage in-vivo on a 3T MRI scanner with clinically feasible scan times. Our preliminary results suggest that biexponential T1ρ components could potentially be used to increase the specificity to detect early osteoarthritis by measuring different water compartments and their fractions. No statistically significant difference was observed in biexponential components in different ROIs and between genders(R2.3).
Acknowledgments
This study was supported by NIH grants R01-AR060238, R01 AR067156, and R01 AR068966, and was performed under the rubric of the Center of Advanced Imaging Innovation and Research (CAI2R), a NIBIB Biomedical Technology Resource Center (NIH P41 EB017183).
Abbreviations
- AF
Acceleration factor
- CV
Coefficient of variation
- ECM
Extracellular matrix
- FOV
Field of view
- FSE
Fast spin echo
- GAG
Glycosaminoglycans
- GRAPPA
Generalized auto-calibrating partial parallel acquisition
- LFC
Lateral femoral cartilage
- LTC
Lateral tibia cartilage
- MAPE
Mean absolute percentage error
- MTC
Medial tibial cartilage
- MFC
Medial femoral cartilage
- OA
Osteoarthritis
- PBS
Phosphate-buffered saline
- PC
Patellar cartilage
- PG
Proteoglycan
- PVE
Partial volume effects
- ROI
Region of interest
- R2
Adjusted R square
- SPGR
Spoiled gradient echo
- SD
Standard deviation
- S(TSL)
Signal intensity at different spin-lock durations
- TSL
Spin-lock pulse duration
References
- 1.Brandt KD, Doherty M, Lohmander LS. Osteoarthritis. Oxford University Press; 1998. [Google Scholar]
- 2.National Institutes of Health. Handout on health: Osteoarthritis. National Institute of Arthritis and Musculoskeletal and Skin Diseases. 2016 [Google Scholar]
- 3.Prieto-Alhambra D, Arden N, Hunter DJ. Osteoarthritis: The Facts. OUP; Oxford: 2014. [Google Scholar]
- 4.Bonnin M, Chambat P. Osteoarthritis of the knee. Springer; Paris: 2008. [Google Scholar]
- 5.Chan WP, Lang P, Stevens MP, Sack K, Majumdar S, Stoller DW, Basch C, Genant HK. Osteoarthritis of the knee: comparison of radiography, CT, and MR imaging to assess extent and severity. AJR American journal of roentgenology. 1991;157(4):799–806. doi: 10.2214/ajr.157.4.1892040. [DOI] [PubMed] [Google Scholar]
- 6.Guermazi A, Alizai H, Crema M, Trattnig S, Regatte R, Roemer F. Compositional MRI techniques for evaluation of cartilage degeneration in osteoarthritis. Osteoarthritis and Cartilage. 2015;23(10):1639–1653. doi: 10.1016/j.joca.2015.05.026. [DOI] [PubMed] [Google Scholar]
- 7.Gray ML, Eckstein F, Peterfy C, Dahlberg L, Kim Y-J, Sorensen AG. Toward imaging biomarkers for osteoarthritis. Clinical orthopaedics and related research. 2004;427:S175–S181. doi: 10.1097/01.blo.0000144972.50849.d9. [DOI] [PubMed] [Google Scholar]
- 8.Regatte RR, Akella SV, Lonner J, Kneeland J, Reddy R. T1ρ relaxation mapping in human osteoarthritis (OA) cartilage: comparison of T1ρ with T2. Journal of Magnetic Resonance Imaging. 2006;23(4):547–553. doi: 10.1002/jmri.20536. [DOI] [PubMed] [Google Scholar]
- 9.Mosher TJ, Zhang Z, Reddy R, Boudhar S, Milestone BN, Morrison WB, Kwoh CK, Eckstein F, Witschey WR, Borthakur A. Knee articular cartilage damage in osteoarthritis: analysis of MR image biomarker reproducibility in ACRIN-PA 4001 multicenter trial. Radiology. 2011;258(3):832–842. doi: 10.1148/radiol.10101174. [DOI] [PMC free article] [PubMed] [Google Scholar]
- 10.Sophia Fox AJ, Bedi A, Rodeo SA. The basic science of articular cartilage: structure, composition, and function. Sports health. 2009;1(6):461–468. doi: 10.1177/1941738109350438. [DOI] [PMC free article] [PubMed] [Google Scholar]
- 11.Li X, Benjamin Ma C, Link TM, Castillo DD, Blumenkrantz G, Lozano J, Carballido-Gamio J, Ries M, Majumdar S. In vivo T1ρ and T2 mapping of articular cartilage in osteoarthritis of the knee using 3 T MRI. Osteoarthritis and Cartilage. 2007;15(7):789–797. doi: 10.1016/j.joca.2007.01.011. [DOI] [PMC free article] [PubMed] [Google Scholar]
- 12.Madelin G, Jerschow A, Regatte RR. Sodium relaxation times in the knee joint in vivo at 7T. NMR in Biomedicine. 2012;25(4):530–537. doi: 10.1002/nbm.1768. [DOI] [PMC free article] [PubMed] [Google Scholar]
- 13.Nishioka H, Nakamura E, Hirose J, Okamoto N, Yamabe S, Mizuta H. MRI T1ρ and T2 mapping for the assessment of articular cartilage changes in patients with medial knee osteoarthritis after hemicallotasis osteotomy. Bone and Joint Research. 2016;5(7):294–300. doi: 10.1302/2046-3758.57.BJR-2016-0057.R1. [DOI] [PMC free article] [PubMed] [Google Scholar]
- 14.Akella SV, Reddy Regatte R, Gougoutas AJ, Borthakur A, Shapiro EM, Kneeland JB, Leigh JS, Reddy R. Proteoglycan‐induced changes in T1ρ‐relaxation of articular cartilage at 4T. Magnetic resonance in medicine. 2001;46(3):419–423. doi: 10.1002/mrm.1208. [DOI] [PubMed] [Google Scholar]
- 15.Wang L, Chang G, Xu J, Vieira RL, Krasnokutsky S, Abramson S, Regatte RR. T1rho MRI of menisci and cartilage in patients with osteoarthritis at 3T. European journal of radiology. 2012;81(9):2329–2336. doi: 10.1016/j.ejrad.2011.07.017. [DOI] [PMC free article] [PubMed] [Google Scholar]
- 16.Nishioka H, Hirose J, Nakamura E, Oniki Y, Takada K, Yamashita Y, Mizuta H. T1ρ and T2 mapping reveal the in vivo extracellular matrix of articular cartilage. Journal of Magnetic Resonance Imaging. 2012;35(1):147–155. doi: 10.1002/jmri.22811. [DOI] [PubMed] [Google Scholar]
- 17.Wang L, Regatte RR. T1ρ MRI of human musculoskeletal system. Journal of Magnetic Resonance Imaging. 2015;41(3):586–600. doi: 10.1002/jmri.24677. [DOI] [PMC free article] [PubMed] [Google Scholar]
- 18.Nardo L, Carballido-Gamio J, Tang S, Lai A, Krug R. Quantitative assessment of morphology, T1ρ, and T2 of shoulder cartilage using MRI. European Radiology. 2016:1–8. doi: 10.1007/s00330-016-4322-6. [DOI] [PMC free article] [PubMed] [Google Scholar]
- 19.Pandit P, Talbott JF, Pedoia V, Dillon W, Majumdar S. T1rho and T2 -based characterization of regional variations in intervertebral discs to detect early degenerative changes. Journal of orthopaedic research: official publication of the Orthopaedic Research Society. 2016;34(8):1373–1381. doi: 10.1002/jor.23311. [DOI] [PMC free article] [PubMed] [Google Scholar]
- 20.Duvvuri U, Reddy R, Patel SD, Kaufman JH, Kneeland JB, Leigh JS. T1ρ‐relaxation in articular cartilage: Effects of enzymatic degradation. Magnetic resonance in medicine. 1997;38(6):863–867. doi: 10.1002/mrm.1910380602. [DOI] [PubMed] [Google Scholar]
- 21.Regatte RR, Akella SV, Borthakur A, Kneeland JB, Reddy R. Proteoglycan depletion–induced changes in transverse relaxation maps of cartilage: comparison of T2 and T1ρ. Academic radiology. 2002;9(12):1388–1394. doi: 10.1016/s1076-6332(03)80666-9. [DOI] [PubMed] [Google Scholar]
- 22.Akella SV, Regatte RR, Borthakur A, Kneeland JB, Leigh JS, Reddy R. T1ρ MR imaging of the human wrist in vivo. Academic radiology. 2003;10(6):614–619. doi: 10.1016/s1076-6332(03)80079-x. [DOI] [PubMed] [Google Scholar]
- 23.Wang N, Xia Y. Dependencies of multi-component T 2 and T 1 ρ relaxation on the anisotropy of collagen fibrils in bovine nasal cartilage. Journal of Magnetic Resonance. 2011;212(1):124–132. doi: 10.1016/j.jmr.2011.06.031. [DOI] [PMC free article] [PubMed] [Google Scholar]
- 24.Zhang J, Nissi M, Idiyatullin D, Michaeli S, Garwood M, Ellermann J. Capturing fast relaxing spins with SWIFT adiabatic rotating frame spin–lattice relaxation (T1ρ) mapping. NMR in Biomedicine. 2016;29(4):420–430. doi: 10.1002/nbm.3474. [DOI] [PMC free article] [PubMed] [Google Scholar]
- 25.Reiter DA, Lin PC, Fishbein KW, Spencer RG. Multicomponent T2 relaxation analysis in cartilage. Magnetic resonance in medicine. 2009;61(4):803–809. doi: 10.1002/mrm.21926. [DOI] [PMC free article] [PubMed] [Google Scholar]
- 26.Keinan‐Adamsky K, Shinar H, Navon G. Multinuclear NMR and MRI studies of the maturation of pig articular cartilage. Magnetic resonance in medicine. 2006;55(3):532–540. doi: 10.1002/mrm.20775. [DOI] [PubMed] [Google Scholar]
- 27.Rubinstein RY, Kroese DP. Simulation and the Monte Carlo method. Vol. 707. John Wiley & Sons; 2011. [Google Scholar]
- 28.Qian Y, Williams AA, Chu CR, Boada FE. Multicomponent T2* mapping of knee cartilage: technical feasibility ex vivo. Magnetic resonance in medicine. 2010;64(5):1426–1431. doi: 10.1002/mrm.22450. [DOI] [PMC free article] [PubMed] [Google Scholar]
- 29.Yuan J, Wang Y, Farncombe T, Iniewski K. Chapter 20. T1rho MR imaging: principle, technology, and application. Medical Imaging: Technology and Applications. 2013:565–592. [Google Scholar]
- 30.Dixon WT, Oshinski JN, Trudeau JD, Arnold BC, Pettigrew RI. Myocardial suppression in vivo by spin locking with composite pulses. Magnetic resonance in medicine. 1996;36(1):90–94. doi: 10.1002/mrm.1910360116. [DOI] [PubMed] [Google Scholar]
- 31.Charagundla SR, Borthakur A, Leigh JS, Reddy R. Artifacts in T 1ρ-weighted imaging: correction with a self-compensating spin-locking pulse. Journal of Magnetic Resonance. 2003;162(1):113–121. doi: 10.1016/s1090-7807(02)00197-0. [DOI] [PubMed] [Google Scholar]
- 32.Yuan J, Li Y, Zhao F, Chan Q, Ahuja AT, Wang Y-XJ. Quantification of T1ρ relaxation by using rotary echo spin-lock pulses in the presence of B0 inhomogeneity. Physics in medicine and biology. 2012;57(15):5003. doi: 10.1088/0031-9155/57/15/5003. [DOI] [PubMed] [Google Scholar]
- 33.Witschey WR, Borthakur A, Elliott MA, Mellon E, Niyogi S, Wallman DJ, Wang C, Reddy R. Artifacts in T1ρ-weighted imaging: compensation for B 1 and B 0 field imperfections. Journal of magnetic resonance. 2007;186(1):75–85. doi: 10.1016/j.jmr.2007.01.015. [DOI] [PMC free article] [PubMed] [Google Scholar]
- 34.Chen W, Takahashi A, Han E. Quantitative T 1 ρ imaging using phase cycling for B 0 and B 1 field inhomogeneity compensation. Magnetic resonance imaging. 2011;29(5):608–619. doi: 10.1016/j.mri.2011.02.002. [DOI] [PubMed] [Google Scholar]
- 35.Liu K, Zhao T. System for Reducing Artifacts in Imaging in the Presence of a Spin-lock Radio-Frequency Field. Google Patents. 2014 [Google Scholar]
- 36.Mitrea BG, Krafft AJ, Song R, Loeffler RB, Hillenbrand CM. Paired self-compensated spin-lock preparation for improved T 1 ρ quantification. Journal of Magnetic Resonance. 2016;268:49–57. doi: 10.1016/j.jmr.2016.04.017. [DOI] [PubMed] [Google Scholar]
- 37.Griswold MA, Jakob PM, Heidemann RM, Nittka M, Jellus V, Wang J, Kiefer B, Haase A. Generalized autocalibrating partially parallel acquisitions (GRAPPA) Magnetic resonance in medicine. 2002;47(6):1202–1210. doi: 10.1002/mrm.10171. [DOI] [PubMed] [Google Scholar]
- 38.Juras V, Apprich S, Zbýň Š, Zak L, Deligianni X, Szomolanyi P, Bieri O, Trattnig S. Quantitative MRI analysis of menisci using biexponential T2* fitting with a variable echo time sequence. Magnetic resonance in medicine. 2014;71(3):1015–1023. doi: 10.1002/mrm.24760. [DOI] [PMC free article] [PubMed] [Google Scholar]
- 39.Qian Y, Williams AA, Chu CR, Boada FE. Repeatability of ultrashort echo time‐based two‐component T2* measurements on cartilages in human knee at 3 T. Magnetic resonance in medicine. 2013;69(6):1564–1571. doi: 10.1002/mrm.24392. [DOI] [PMC free article] [PubMed] [Google Scholar]
- 40.Redfield AG. Nuclear magnetic resonance saturation and rotary saturation in solids. Physical Review. 1955;98(6):1787. [Google Scholar]
- 41.Reddy R, Borthakur A, Witschey WR, Kneeland JB. Cartilage Imaging. Springer; 2011. Frontiers in Molecular Imaging of Cartilage: Future Developments; pp. 213–227. [Google Scholar]
- 42.Zarins ZA, Bolbos RI, Pialat JB, Link TM, Li X, Souza RB, Majumdar S. Cartilage and meniscus assessment using T1rho and T2 measurements in healthy subjects and patients with osteoarthritis. Osteoarthritis and Cartilage. 2010;18(11):1408–1416. doi: 10.1016/j.joca.2010.07.012. [DOI] [PMC free article] [PubMed] [Google Scholar]
- 43.Stahl R, Luke A, Li X, Carballido-Gamio J, Ma CB, Majumdar S, Link TM. T1rho, T2 and focal knee cartilage abnormalities in physically active and sedentary healthy subjects versus early OA patients—a 3.0-Tesla MRI study. European radiology. 2009;19(1):132–143. doi: 10.1007/s00330-008-1107-6. [DOI] [PubMed] [Google Scholar]
- 44.Schooler J, Kumar D, Nardo L, McCulloch C, Li X, Link TM, Majumdar S. Longitudinal evaluation of T1ρ and T2 spatial distribution in osteoarthritic and healthy medial knee cartilage. Osteoarthritis and Cartilage. 2014;22(1):51–62. doi: 10.1016/j.joca.2013.10.014. [DOI] [PMC free article] [PubMed] [Google Scholar]
- 45.Li X, Wyatt C, Rivoire J, Han E, Chen W, Schooler J, Liang F, Shet K, Souza R, Majumdar S. Simultaneous acquisition of T1ρ and T2 quantification in knee cartilage: repeatability and diurnal variation. Journal of Magnetic Resonance Imaging. 2014;39(5):1287–1293. doi: 10.1002/jmri.24253. [DOI] [PMC free article] [PubMed] [Google Scholar]
- 46.Pakin SK, Xu J, Schweitzer ME, Regatte RR. Rapid 3D‐T1ρ mapping of the knee joint at 3.0 T with parallel imaging. Magnetic resonance in medicine. 2006;56(3):563–571. doi: 10.1002/mrm.20982. [DOI] [PubMed] [Google Scholar]
- 47.Lustig M, Donoho DL, Santos JM, Pauly JM. Compressed sensing MRI. IEEE signal processing magazine. 2008;25(2):72–82. [Google Scholar]
- 48.Zhou Y, Pandit P, Pedoia V, Rivoire J, Wang Y, Liang D, Xiaojuan L, Leslie Y. Accelerating t1ρ cartilage imaging using compressed sensing with iterative locally adapted support detection and JSENSE. Magnetic resonance in medicine. 2016;75(4):1617–1629. doi: 10.1002/mrm.25773. [DOI] [PMC free article] [PubMed] [Google Scholar]
- 49.Yuan J, Zhao F, Chan Q, Wang Y-XJ. Observation of bi-exponential T1ρ relaxation of in-vivo rat muscles at 3T. Acta Radiologica. 2012;53(6):675–681. doi: 10.1258/ar.2012.120108. [DOI] [PubMed] [Google Scholar]
- 50.Wheaton AJ, Borthakur A, Corbo M, Charagundla SR, Reddy R. Method for reduced SAR T1ρ‐weighted MRI. Magnetic resonance in medicine. 2004;51(6):1096–1102. doi: 10.1002/mrm.20141. [DOI] [PubMed] [Google Scholar]
- 51.Borthakur A, Wheaton A, Charagundla SR, Shapiro EM, Regatte RR, Akella SV, Kneeland JB, Reddy R. Three‐dimensional T1ρ‐weighted MRI at 1.5 Tesla. Journal of Magnetic Resonance Imaging. 2003;17(6):730–736. doi: 10.1002/jmri.10296. [DOI] [PubMed] [Google Scholar]
- 52.Henkelman RM, Stanisz GJ, Kim JK, Bronskill MJ. Anisotropy of NMR properties of tissues. Magnetic resonance in medicine. 1994;32(5):592–601. doi: 10.1002/mrm.1910320508. [DOI] [PubMed] [Google Scholar]
- 53.Akella SV, Regatte RR, Wheaton AJ, Borthakur A, Reddy R. Reduction of residual dipolar interaction in cartilage by spin‐lock technique. Magnetic resonance in medicine. 2004;52(5):1103–1109. doi: 10.1002/mrm.20241. [DOI] [PubMed] [Google Scholar]


