

Abstract
There has been a long-standing controversy regarding the effect of chemical denaturants on the dimensions of unfolded and intrinsically disordered proteins: A wide range of experimental techniques suggest that polypeptide chains expand with increasing denaturant concentration, but several studies using small-angle X-ray scattering (SAXS) reported no such increase of the radius of gyration (Rg). This inconsistency challenges our current understanding of the mechanism of chemical denaturants, which are widely employed to investigate protein folding and stability. Here, we use a combination of single-molecule Förster resonance energy transfer (FRET), SAXS, dynamic light scattering (DLS), and two-focus fluorescence correlation spectroscopy (2f-FCS) to characterize the denaturant dependence of the unfolded state of the spectrin domain R17 and the intrinsically disordered protein ACTR in two different denaturants. Standard analysis of the primary data clearly indicates an expansion of the unfolded state with increasing denaturant concentration irrespective of the protein, denaturant, or experimental method used. This is the first case in which SAXS and FRET have yielded even qualitatively consistent results regarding expansion in denaturant when applied to the same proteins. To more directly illustrate this self-consistency, we have used both SAXS and FRET data in a Bayesian procedure to refine structural ensembles representative of the observed unfolded state. This analysis demonstrates that both of these experimental probes are compatible with a common ensemble of protein configurations for each denaturant concentration. Furthermore, the resulting ensembles reproduce the trend of increasing hydrodynamic radius with denaturant concentration obtained by 2f-FCS and DLS. We were thus able to reconcile the results from all four experimental techniques quantitatively, to obtain a comprehensive structural picture of denaturant-induced unfolded state expansion, and to identify the most likely sources of earlier discrepancies.
TOC image
Introduction
Understanding the properties of unfolded and disordered proteins is an important goal in biophysics. This is firstly because the unfolded state of globular proteins represents the starting point for protein folding, and its properties are closely connected to theories of folding1–6. Secondly, for the large class of intrinsically disordered proteins (IDPs), which do not fold even under physiological conditions (at least in the absence of their binding partners)7,8, the physical properties of their disordered states should be intimately related to their function, as has been demonstrated in several cases9,10. A number of powerful experimental techniques have emerged which can shed light on highly disordered conformations, including single-molecule Förster resonance energy transfer (FRET)11,12, nuclear magnetic resonance (NMR)13, small angle X-ray (or neutron) scattering (SAXS or SANS)14, dynamic light scattering (DLS)15, two-focus fluorescence correlation spectroscopy (2f-FCS)16 and photoinduced electron transfer (PET)17. Ideally then, it should be possible to construct a self-consistent description of unfolded and disordered states based on information from these different experiments.
However, a discrepancy has emerged in the literature regarding the effect of chemical denaturants on the radius of gyration (Rg) of unfolded proteins. With some exceptions18–20, several studies using SAXS and SANS experiments did not find a statistically significant change in unfolded state Rg over the experimentally accessible range of denaturant concentration, for two-state folding proteins20–24 and for an IDP25. For larger proteins, collapse upon denaturant dilution has been observed in time-resolved SAXS experiments, but in those cases the presence of stable folding intermediates modulating the observed Rg cannot be excluded26–28. In contrast, FRET11,29–35 and PET34,36 data show an increase in the average distance between labeled sites with denaturant, and NMR20, DLS15,37, 1- and 2f-FCS38–40, as well as analytical size exclusion chromatography studies41 provide evidence for an increase in hydrodynamic radius (Rh) with increasing denaturant concentration. Such an expansion would be consistent with improved solvation by the denaturant solution33,42,43, currently understood to be the mechanism by which denaturant destabilizes folded proteins33. The increase in average distance observed by FRET is accompanied by an increase of the polymer scaling exponent for the unfolded state40. However, even the fractal dimension (the inverse of the scaling exponent) measured by SAXS has been reported to be denaturant independent for several IDPs or the unfolded state of two-state proteins23,25, although a urea-dependent fractal dimension has been found for reduced RNase A44. Thus, while the analysis of each type of experiment appears internally consistent, the outcomes from SAXS and FRET experiments have led to qualitatively different conclusions. Indeed, for the single protein which has been investigated by both methods so far (protein L21,23,31,45), very different results have been obtained from SAXS and FRET experiments. The discrepancy persisted in recent follow-up efforts on protein L in which the experimental conditions in SAXS were matched to FRET23, and even in the effect of denaturant on the Rg of polyethylene glycol (PEG) when monitored by SANS and FRET22 (as for proteins, both urea and guanidinium chloride are known to associate favorably to PEG46). In contrast, changes in the Rg of unfolded proteins upon variation in pH or reduction of disulfide bridges have been unequivocally identified by SAXS, illustrating its fundamental suitability for identifying changes in unfolded state dimensions47,48. Therefore, a reconciliation of the observations from SAXS and FRET in denaturant is still lacking. Clearly it is critical to resolve this issue, because it implies that at least one of the experiments is being incorrectly interpreted, with implications for their application to other problems related to unfolded and intrinsically disordered proteins. Furthermore, the absence of denatured-state expansion would contradict common theories for the mechanism of chemical denaturation33,49,50, and would overturn our understanding of this important process.
Here, we have set out to understand the origin of this disagreement. To do so, we have chosen to systematically study two different proteins by a broad array of experimental and computational techniques, using identical solution conditions and samples across the different types of experiment. As much as possible, the same protein constructs were used for all experiments, apart from the addition of donor and acceptor chromophores for FRET and a single dye for 2f-FCS. For the proteins, we selected a destabilized mutant of the spectrin R17 domain (R17 C66A/L90A or R17d) and the intrinsically disordered activator for thyroid hormone and retinoid receptors (ACTR)51,52. This choice was motived by the desire to capture different sequence properties, since ACTR lacks a stable fold whereas R17 folds into a three-helix bundle, as well as a difference in size (by 39 residues, sequences in Table S1). Importantly, both proteins can be studied over a wide range of denaturant concentrations, because ACTR does not fold in the absence of a binding partner51–53, and R17d is completely unfolded even at low denaturant concentration (note, however, that the collapse behavior is not affected by the destabilizing amino acid exchange in R17d and is very similar to other spectrin domains54). Therefore, there is no need to separate out a folded-state population, otherwise a major complication for ensemble-averaged experiments. Furthermore, previous work has shown ACTR to have only low helical content in water51,55, and residual helical structure was not detected for unfolded R1756. Therefore, these proteins should also not have an unusual predisposition toward collapse in water due to secondary structure formation. Both proteins are highly soluble, so that potential aggregation problems occurring at relatively high protein concentrations required by SAXS and DLS are minimized. We study each protein in both of the most commonly used chemical denaturants, urea and guanidinium chloride (GdmCl).
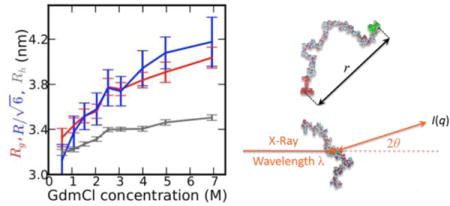
We investigated the degree of unfolded-state expansion via four different experimental techniques that probe directly either intramolecular distances or the hydrodynamic radii (Figure 1). In the first class are single-molecule FRET experiments, which probe distance distributions between individual pairs of residues, exploiting the Förster relation between the FRET efficiency and the distance between pairs of fluorophore-labeled residues57 (Figure 1a). The resulting average intramolecular distances and the Rg can then be estimated by using the statistics of a suitable polymer model58. The Rg can be obtained more directly from SAXS experiments, by using a Guinier analysis of the scattering at very small angles from a monodisperse protein solution59: Provided the noise in the data is small enough, the linear region of the Guinier plot yields a model-free estimate of the Rg (Figure 1b). Chain expansion can also be directly probed with SAXS by analyzing the fractal dimension at intermediate scattering angles60. Another quantity which is related to molecular size is the hydrodynamic radius, Rh, defined as the radius of a spherical object having the same translational diffusion coefficient, D, as the protein, according to the Stokes-Einstein relation. Although there is no simple quantitative relation between Rh and Rg for unfolded proteins, Rh is nevertheless expected to follow the same qualitative trend as Rg with increasing denaturant concentration. We have used both 2f-FCS16 and DLS61 to obtain independent measures of Rh. 2f-FCS (Figure 1c) uses the correlations between photons from a labeled protein, recorded from overlapping detection volumes displaced by a fixed distance to measure D, and is thus less prone to instrumental artifacts (such as changes in the size of the observation volume with refractive index) than conventional single-focus FCS16. Dynamic light scattering (Figure 1d) estimates D by analyzing the time correlation of light scattering intensity fluctuations due to the movement of the protein molecules in solution. D obtained by 2f-FCS and DLS can then be used to calculate Rh.
Figure 1.

Schematic illustration of the different types of experiments used. (a) FRET efficiency, E, reports on the inter-chromophore distance, r; R0 is the Förster radius; (b) SAXS intensity, I(q), is related to the radius of gyration, rg, for small values of momentum transfer, q; (c) 2f-FCS measures the translational diffusion coefficient (D) from the fluorescence intensity cross-correlation of a molecule diffusing through two partially overlapping confocal laser foci separated by a distance δ and generated by orthogonally-polarized pulsed interleaved beams of width w; (d) DLS measures D from the time correlation function of light scattering intensity fluctuations caused by changes of the mutual positions of molecules. Lower case r and rg indicate the mean squared distance and the radius of gyration of an individual conformation, respectively, as opposed to their capital counterparts signifying a value averaged over multiple conformations. Equations beneath figures are only meant to convey the important quantities evaluated in each technique and a general idea of how these observables are then used for data analysis.
Thus, we have four independent measures of the effect of denaturant on unfolded state dimensions. For each type of experiment, we apply the standard analysis methods in order to extract the denaturant dependence of the average intramolecular distance (FRET), Rg (SAXS), or Rh (DLS and 2f-FCS). In addition, we have integrated the SAXS and FRET data with molecular simulations via a Bayesian reweighting procedure62, from which we infer representative ensembles of protein configurations that explain all of the experimental results. Each of the experimental techniques and the integrated analysis suggest that the chains expand with increasing denaturant concentration; moreover, the fitted ensembles are able to explain quantitatively both the FRET and SAXS data as well as the two measures of Rh, indicating that all of the different types of experimental data can be interpreted consistently. Our results suggest a number of possible reasons for the apparent discrepancies reported previously. In particular, it is very challenging to observe expansion in equilibrium SAXS experiments, due to (i) a smaller relative change in Rg than in the end-to-end distances probed by FRET, (ii) half of the expansion happening at low denaturant concentrations (inaccessible to ensemble-averaged measurements for stable folded proteins), and (iii) pronounced sensitivity of Guinier analysis to the range of scattering angles employed. Secondly, standard analysis of FRET experiments can slightly overestimate expansion.
Results
Single-molecule FRET
Förster resonance energy transfer probes the distance between a pair of residues labeled with chromophores via the well-known distance dependence of the transfer efficiency described by Förster theory57. Three different pairs of labeling positions were used both in ACTR and in R17d to map different segments of the chain (SI Table 11), and the 6 corresponding variants were measured in both GdmCl and urea. In Figure 2a,b, we show example FRET efficiency histograms at low and high denaturant concentration (protein concentration ~50 pM) for the N-/C-terminally labelled variants R17d–R1C/Q116C and ACTR S1C/S73C (“R17d 1-116” and “ACTR 1-73” in the rest of the paper), demonstrating the existence of a single (unfolded) population under all conditions, whose position shifts continuously with denaturant concentration (a larger set of histograms is shown in Figure S1). Equilibrium ensemble denaturation curves determined by intrinsic tryptophan fluorescence of R17d (unlabeled protein used for SAXS and DLS) confirm complete unfolding above ~0.2 M GdmCl (Figure S2). In Figure 2c,d we summarize the variation in mean transfer efficiency with denaturant concentration computed from FRET efficiency histograms for the four combinations of terminally labeled proteins and denaturants. Consistent results were obtained from the analysis of fluorescence lifetimes (Figure S3). In each case, there is a clear decrease in efficiency as the denaturant concentration is increased*, indicating that the protein chain is expanding, a similar result to that obtained with other proteins11,35,40,64.
Figure 2.

Single-molecule FRET analysis of R17d 1-116 (left column, circles) and ACTR 1-73 (right column triangles) (Table S1). (a–b) FRET efficiency histograms at low and high denaturant concentrations. (c–d) Dependence of measured transfer efficiencies on GdmCl (cyan) and urea (magenta) concentration. Statistical errors from repeated measurements are reported as vertical and horizontal error bars; systematic errors in transfer efficiencies primarily due to instrument calibration (±0.02) are indicated as shaded areas of the corresponding color. (e–f) Root-mean-squared values of the end-to-end distance, R, as estimated by assuming the distance distributions of a Gaussian chain (cyan) or a self-avoiding walk (SAW, dark blue). Light shaded areas represent systematic errors propagated from those in transfer efficiency. (g–h) Root-mean-squared radii of gyration (Rg) as inferred from R (e,f) and the expected universal ratios for the Gaussian chain (R2/Rg2 = 6) or the SAW model (R2/Rg2 ≈ 6.26)68. Light gray shaded areas indicate the uncertainties from propagation of error in transforming R2 to Rg2 (systematic errors from the assumed uncertainties of ± 0.02 on measured transfer efficiencies have comparable values). (i–j) Scaling exponents obtained by fitting the inter-dye distances of the three different protein labeling variants (Table S1) simultaneously to with a fixed B of 0.55 nm,40 where i and j are the labeling positions of the respective variants, for both the Gaussian and SAW cases. Values and standard deviations from the fit are reported for the inter-dye distances obtained assuming a Gaussian chain (cyan) and a SAW model (blue). The fits (solid lines) represent a weak binding model, including a polyampholyte contribution for ACTR in GdmCl63. The corresponding data in urea are shown in Figure S17.
The FRET efficiency reports on the pair distance between the probe chromophores, but since a broad distribution of distances contributes to the observed signal, additional assumptions are needed to obtain quantitative distance information.† The most commonly used analysis procedure assumes, as an approximation, the distance distribution, P(r), of a suitable polymer model whose shape is determined by a single adjustable parameter, which is thus uniquely determined by the experimental transfer efficiency30,31,35,58,65. From the resulting P(r), a measure of the average interdye distance can be obtained, most commonly in terms of the root mean square distance, . We have used the P(r) of several different polymer models to perform the conversion from transfer efficiency to R, namely the Gaussian chain, the worm-like chain, the Sanchez model31,33, and a self-avoiding walk (SAW), corresponding to a chain with excluded volume (details in SI Text). The results illustrate some variability in the resulting R values due to the choice of P(r), with the Gaussian chain and SAW yielding the largest and smallest values of R, respectively (Figure 2e,f), but all showing a clear swelling of the unfolded chain with increasing denaturant concentration, well outside the experimental error. Based on the analysis of molecular simulations including both excluded volume and attractive interactions, the P(r) of a Gaussian chain provides reasonable values of R for relatively compact chains but tends to overestimate R for more expanded chains (Figure S4)58,65,66, leading to the largest apparent change in unfolded state expansion, while the SAW chain recapitulates the R from simulation remarkably well.
For a more direct comparison to SAXS data, an estimate of Rg can be made based on polymer theory that approximates the relation between R and , where rg is the radius of gyration of an individual conformation). Unfolded proteins commonly explore a range of compactness between two limits: the Θ-state, where attractive and repulsive chain-chain and chain-solvent interactions are balanced such that the polypeptide chain obeys the length scaling of an ideal chain67, and the excluded volume limit, typically approached at high denaturant concentration, where the chain interacts preferentially with the solvent and is dominated by repulsive intrachain interactions40. In this interval, R2/Rg2 is expected to vary between 6 and 6.26 for a Gaussian chain and a SAW, respectively68, the values that we use here for estimating bounds on Rg from FRET (Figure 2g,h, see SI Text for details). Note that 50% of the change in chain dimensions occurs below ~2.5 M GdmCl or ~3.5 M urea, with less variation over the higher concentrations, which are those commonly accessible in equilibrium ensemble-averaged experiments on folding-competent proteins. Although the observed increase in Rg of the unfolded ensemble is robust towards the choice of the particular polymer model, possible quantitative limitations of these simple models have been suggested earlier63,65,66, prompting us to employ a Bayesian reweighting analysis based on ensembles of unfolded structures generated by molecular simulations to avoid these problems.
An alternative measure of chain expansion is the scaling exponent, ν, which relates the average distance between points in the chain to their separation in sequence, N, via scaling laws of the form R = B Nν (see also SI), and which can thus be estimated from the FRET-derived values of R. The value of ν is expected to be 1/3 in poor solvent, i.e. conditions where the chain interacts strongly with itself and therefore is very compact (a regime not commonly explored by natural unfolded proteins), ~1/2 under Θ-conditions (approximately corresponding to native buffer40,44), and ~3/5 in good solvent (e.g. at high denaturant concentration40,69,70).67 Taking advantage of the observation that the prefactor, B, for proteins varies only within a narrow range40, we estimated the scaling exponent as a function of denaturant concentration from the analysis of the data from the three labeling variants of each protein in GdmCl and urea (see SI for details). Figure 2i,j shows the results, with a transition from values of ν close to 1/2 at low to values of ~3/5 at high denaturant concentrations, reflecting the expansion of the chain with increasing solvent quality.
SAXS
X-ray scattering from dilute, monodisperse protein solutions provides rich information on the distributions of interatomic distances within each molecule. We have recorded solution X-ray scattering intensities, I(q), for ACTR and R17d over a wide range of GdmCl and urea concentrations (between 0.32 and 6.95 M GdmCl, and between 0.58 and 9.02 M urea). In addition, we have recorded data at multiple protein concentrations ranging from ~4.0 to ~0.6 mg/mL (Figure S5) to check for the absence of artifacts due to intermolecular correlations and protein aggregation (further discussed in the DLS section below). We first apply the Guinier analysis as the most direct method to extract the radius of gyration from the data at small momentum transfer, q, where . Therefore, in the limit q → 0, the slope of the Guinier plot of versus q2 should yield Rg directly. The Guinier plots for a representative set of denaturant concentrations are shown in Figure 3a, for each protein and denaturant combination. Despite the seeming similarity of the full SAXS curves (Figure S5), we find a clear systematic variation of the slope in the Guinier region that indicates an increasing Rg with increasing denaturant concentration.
Figure 3.

Small angle X-ray scattering analysis of unfolded R17d and ACTR. (a) Guinier fits for R17d and ACTR in GdmCl and urea. Increasing denaturant concentrations colored from light to dark as indicated in the legend. For direct comparison, a copy of each fitted curve is also shown as a dashed line shifted down to the curve at the highest denaturant concentration. (b) Guinier fits within different ranges of qmaxRg for R17d in 4.96 M GdmCl as an example to show the underestimation of denaturant-induced expansion with increasing fitted qmaxRg-range, and (c) the corresponding Rg for all GdmCl concentrations (see legend for color code of maximum qmaxRg in fitting). (d) Fitting mass fractal dimension, Dm, to the intermediate q range of R17d data in GdmCl (see legend for color code of GdmCl concentration), and (e) the corresponding GdmCl-dependent Dm for R17d (data in the other protein-denaturant combinations are given in Figure S8). Mass fractal dimension from fitting SAXS intensity and from the inverse of the length scaling exponent from FRET with different polymer models (Figure 2i) and from reweighted structural ensembles are compared (see legend for color code).
The Guinier approximation is valid only for a very limited range of q ≤ qmax, the accepted range for folded proteins being . However, this range is known to be more limited for unfolded proteins, since the higher order terms in the expansion from which the Guinier approximation is derived are larger for more extended conformations44,71. Indeed, using increasing values of qmax for Guinier fits leads to a systematic underestimation of Rg, as seen in Figure 3b, where we have fitted the Guinier region for R17d in 4.96 M GdmCl to different ranges of , clearly showing that the fitted radii of gyration become progressively smaller as increases. It is noteworthy that we observe a similar dependence of Rg on qmaxRg for lower protein concentrations, suggesting that this is not an artifact due to weak protein association (Figure 3b). To examine the influence of qmax on the resulting expansion with increasing denaturant concentration, we also show in Figure 3c the estimated Rg as a function of GdmCl concentration for R17d, using different limits for qmaxRg. Employing larger qmaxRg limits to define the Guinier region results in a progressive suppression of the denaturant-induced increase in Rg. Similar results are obtained for other protein/denaturant combinations (Figure S6). However, as is decreased, the reduced number of data points available results in very large errors, such that it becomes harder to detect a systematic change in Rg as is varied in the range 1.1–1.3 for R17d at any single denaturant concentration (Fig. 5e). However, an inverse-variance weighted average of the ratio over all R17d data points in urea and GdmCl equals 1.018 and the corresponding value for equals 1.009. The trend is clearer for ACTR due to its smaller size and larger number of data points in a given qmaxRg range, resulting in higher precision for the fitted Rg values - the corresponding averaged ratios are 1.039 and 1.025. These observations indicate systematic differences in the Rg values determined throughout the entire commonly used range of 1.0 to 1.3 for both proteins studied here.
Figure 5.

Results from refined ensembles using SAXS and FRET data of R17d (left) and ACTR (right) in GdmCl. (a) Examples of calculated scattering curves from the ensemble model compared to SAXS data in GdmCl and residuals (below). (b) FRET efficiencies calculated from the same models compared to experimental results for three different sets of labeling positions (see legend for label positions). Shaded bands represent experimental data (width of bands corresponding to systematic error). (c) Variation of rg and end-to-end distance (r) distributions of ensembles for different denaturant concentrations (colors as labelled in (a)). The corresponding root-mean-squared end-to-end distances, R, are shown as vertical dashed lines. (d) Rg, R, and Rh from the reweighted ensembles as a function of GdmCl concentration. We plot to place R on the same scale as Rg and Rh. (e) Variation of Rg from Guinier fits as a function of qmaxRg, for direct fits to experimental scattering curves (green symbols and error bars), the I(q) calculated from the reweighted ensemble starting at q=0 (purple line) and starting at the smallest q accessible experimentally (blue line), and the actual Rg computed from the ensemble coordinates (red shaded region with a width corresponding to the uncertainty based on posterior sampling of the ensemble space). The corresponding results for urea are shown in Figure S12.
To complement the experimental analysis, we have performed Guinier analysis on the scattering intensities calculated from all-atom MD simulations of ACTR72, where scattering curves can be computed accurately down to much smaller angles than experimentally possible, and which are free from concerns about sample imperfections (Figure S7) or data precision. In this case we find that Guinier estimates of Rg achieve an accuracy better than 0.05 nm only for qmaxRg < 0.9. Importantly, this range shrinks with protein chain expansion, which could lead to larger suppression of an apparent fitted Rg relative to the true value at higher denaturant concentrations. This detrimental effect is further amplified by the removal of the experimental lowest-q data inaccessible due to beam stop shadowing, stray scattering, sample nonidealities, as well as by the decrease in the precision of these data due to a small number of detector pixels recording them and the increased capillary scattering, emphasizing the challenges of extracting the radius of gyration from the rather noisy experimental data at low angles. Finally, as was observed with FRET, half of all the expansion occurs at the lower denaturant concentrations (below ~2.5 M GdmCl or ~3.5 M urea).
We can also obtain a direct estimate of the polymer scaling exponent, ν, from the SAXS intensities. At intermediate scattering angles above the Guinier range, the intensity has a power law dependence on q, i.e., , where is the mass fractal dimension. We estimate Dm by fitting the linear region of a plot of log(I) against log(q), at intermediate q. Such fits are shown in Figure 3d for R17d in GdmCl (corresponding plots for R17d and ACTR in urea are given in Figure S8). It is important to note that, while the linear region in this plot is expected to exist, its bounds may vary with the experimental conditions and become harder to select with confidence with the decreasing experimental signal/noise associated with the poorer contrast at high denaturant concentrations. We have chosen the linear region by minimizing for a linear fit as a function of the position and width of the fitting window (details in Figure S8). Although the data at these q values are less precise than those within the Guinier range, we can nonetheless identify a systematic change in slope with denaturant concentration. The decrease in Dm obtained from SAXS, shown in Figure 3e, is consistent with the increase of ν inferred from FRET, and is similar to the decrease of Dm with increasing urea concentration previously observed for RNase A44.
2f-FCS
To obtain an additional independent measure of protein expansion, we also quantified the hydrodynamic radius, Rh, of each protein as a function of denaturant concentration from its translational diffusion coefficient and the (independently measured) solvent viscosity using the Stokes-Einstein relation (details in SI Text). 2f-FCS with a purely optical generation of two laterally displaced but overlapping foci (resulting in a fixed and well-defined distance) is a recently developed method for determining diffusion coefficients from fluorescently labeled molecules with high precision, by measuring the correlation between photons detected in the two foci16. It avoids some of the technical challenges of conventional (single-focus) FCS, such as optical saturation effects and changes in refractive index (a particularly important aspect for measurements at different denaturant concentrations). We have measured Rh from 2f-FCS for R17d-Q116C singly labeled with a donor dye (R17d-488) and ACTR-S1C singly labeled with an acceptor dye (ACTR-594), both in GdmCl and urea, and find an increase in Rh with denaturant concentration in each case (Figure 4). However, the relative change in Rh over the accessible range of denaturant concentration is much smaller than for R and Rg, similar to previous observations of the coil-to-globule transition of homopolymers73.
Figure 4.
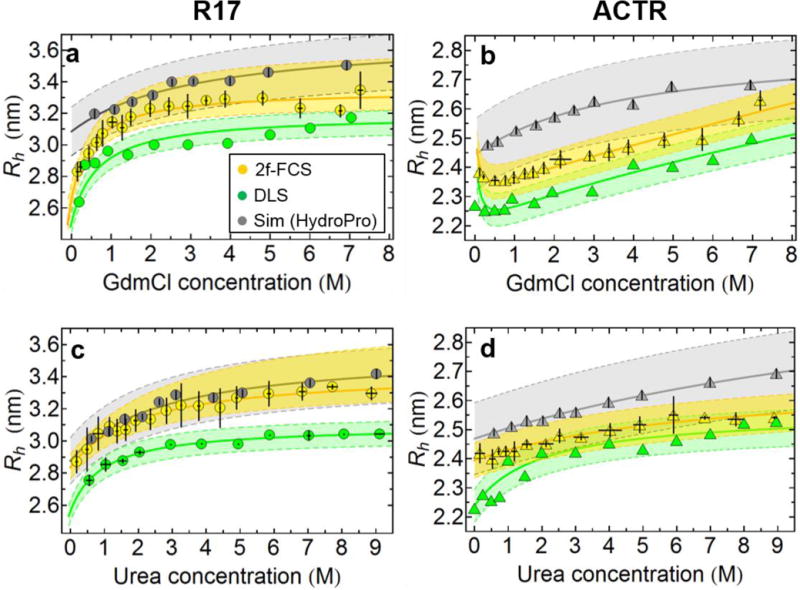
Denaturant dependence of the hydrodynamic radius (Rh) for R17d-488 (a and c) and ACTR-594 (b and d) in GdmCl and urea from 2f-FCS (yellow symbols) and for R17d and ACTR (both unlabeled) from DLS (green symbols). Also plotted is Rh calculated (using HydroPro74) from the ABSINTH structure ensembles with weights determined from combined fits to the SAXS and FRET data (gray symbols). Values of Rh from 2f-FCS are the average of three or more independent measurements; error bars show the resulting standard deviations. Shaded areas indicate a 2.5% systematic error estimated for 2f-FCS and DLS measurements, and a 5% average model error for the HydroPro calculation74. Rh values shown from DLS are either extrapolated to infinite protein dilution (d) or measured at the lowest possible protein concentration with sufficient signal to noise (see Figure S9a,b for plots of the protein concentration dependence of Rh in DLS experiments). The solid lines are fits to a weak binding model, including a polyampholyte contribution describing the initial collapse of ACTR at low GdmCl concentrations63.
Dynamic Light Scattering
A second, independent, way of determining hydrodynamic radii is via DLS. In this case, the experiments were performed with unlabeled protein at concentrations of denaturant between 0.2 and 6.95 M GdmCl and between 0.58 and 9.02 M urea. The method uses the correlation times of scattering intensity fluctuations to determine molecular translational diffusion coefficients, and hence Rh61, and is sensitive to small variations in this parameter75. Effects from the nonideality of the solution due to the high protein concentrations required were investigated systematically by measurements at different protein concentrations (see SI Text and Figure S9a,b). Again, we observe an increase in Rh with increasing denaturant concentration for all samples, very similar to that calculated from 2f-FCS (Figure 4). We note that, although both DLS and 2f-FCS can measure Rh with high precision (corresponding to reliable relative changes in chain expansion), systematic errors (e.g. from determining the distance between the foci in 2f-FCS of about 2.5%) must be taken into account for the accuracy of the results (corresponding to the absolute values of Rh). Accordingly, both statistical and systematic errors are reported in Figure 4. Note also that the values from 2f-FCS are generally slightly larger than from DLS, consistent with an increase in size due to the additional fluorophore attached to the protein for 2f-FCS. This result further suggests that the labelling with our fluorophores only increase the protein size slightly, while dye-protein interactions do not exert a detectable effect on the change in unfolded state expansion. An additional benefit of using DLS is that it allowed us to quantify even small fractions of protein aggregates present in our samples, in a range that would be difficult to detect by SAXS. Although R17 and ACTR are highly soluble proteins, and we employed strict handling protocols to minimize aggregation (see SI Text), we still found detectable traces of slow-diffusing particles in our samples (see SI Text and Figure S9c,d): for both R17d and ACTR they amounted to less than 1% of weight concentration in all denaturant concentrations, and their presence was significantly reduced after centrifugation, which was part of the SAXS sample processing protocol before data acquisition (see SI). However, in order to estimate the magnitude of the possible impact of such large particles on the Rg values determined via the Guinier fits of the experimental data, we simulated the structure of a hypothetical protein aggregate consistent with the ~80 nm size extracted from DLS measurements (Figure S9d). Close packing of the members of the ensemble determined via the SAXS/FRET fit of the R17d data in 1 M GdmCl results in aggregates containing ~27000 monomeric subunits. The scattering profiles predicted for such particles fall off by ~4 orders of magnitude from the zero scattering angle to q=0.005 Å−1 and lead to changes in the fitted Rg not exceeding 0.02–0.03 nm, well below our experimental uncertainties.
In summary, all four experimental techniques we have employed expose a clear change in unfolded state expansion with increasing denaturant concentration, for both proteins and both denaturants investigated (i.e., 16 different combinations). However, the relative changes in the quantities accessible from the different methods are significantly different (Table S2), raising the question whether these results can be accounted for consistently. We have analyzed all experiments by using standard techniques with the simplest possible models. However, each experiment carries its own uncertainties due to the way the data are interpreted. For example, FRET experiments must employ a specific model to obtain the distribution of donor-acceptor distances P(r) over which the transfer efficiency is averaged. With SAXS, the extraction of the radius of gyration from raw data is relatively model-free. In practice, however, it is complicated by the narrow range of the Guinier region for a heterogeneous ensemble, and the large experimental noise at the low protein concentrations necessary to ensure the absence of inter-particle repulsion or protein association effects, as well as at higher denaturant concentrations due to poorer protein/solvent contrast. Ideally, one would use all of the available scattering data to estimate the molecular size. However, model-free analysis of the wider angle data is more challenging: P(r) distance distribution function and associated Rg are commonly calculated via a regularized Fourier transform, which creates a regularizer bias towards distributions characteristic of globular folded particles and may thus be ill-suited for the analysis of structurally diverse IDPs. Accurate extraction of Rg via P(r) methods is further complicated by the inevitable underestimation of the maximum dimensions for an unfolded protein, motivating the development of ensemble refinement methods76. Alternatively, wide-angle data can be fitted to the Debye analytical expression for a Gaussian chain77, but our scaling exponent data suggest deviations from Θ-conditions in most cases, and the Debye model is known to fit poorly for chains with excluded volume at larger q78. Lastly, we would ideally like to compare the results for R, Rg and Rh more directly, and there is no generally applicable analytical relation between them. Is there a way to obtain all the desired parameters by employing the different experimental data at our disposal, and concomitantly overcoming the inherent uncertainties and limitations of each individual technique?
Bayesian Reweighting of Structure Ensembles
One way to achieve all of these goals is to use an explicit molecular model that accounts for the expected conformational heterogeneity of unfolded proteins. Such approaches using ensembles of structures have previously been successful in interpreting combinations of many types of data, including those from SAXS, NMR, EPR, and FRET experiments79–84. Here, we approach this task by first generating a trial initial ensemble via simulations with the ABSINTH implicit solvent model85. The SAXS intensity for each structure in the initial ensemble is then calculated by using CRYSOL86, in which the default background electron density and hydration shell are used. A comparison between the SAXS calculation using continuum or atomistic representations of solvent can be found in a related work72, showing that the continuum model reproduces excellently the Guinier region of SAXS intensity (q<0.04 Å−1) and the corresponding Rg, so that any effects of solvent structure must have little impact on Rg. FRET efficiencies are calculated for each structure using the Förster relation57. We then apply a reweighting procedure to achieve agreement with the experimental data using the EROS method62,81. A key feature of the analysis is a regularization procedure to prevent overfitting of the data to the very large number of structures in the initial ensemble relative to the number of experimental data76,81,87–90 (described in SI Text and Figure S10). To test whether we are able to recover a representative ensemble, we first applied the procedure to synthetic FRET efficiencies and SAXS intensities calculated from all-atom, explicit solvent simulations of ACTR in urea72, in which case the true properties of the molecular ensemble are known. We find that the distributions of Rg, R, and Rh recovered from the reweighting of the implicit-solvent model to match the synthetic FRET and SAXS data, agree very well with those estimated directly from the all-atom simulations72 (much better than the unweighted implicit solvent models) (Figure S11). Note that the differences between SAXS curves calculated from simulations with increasing denaturant concentrations are quite subtle, as in experiment, yet associated with a clear increase in Rg.
We thus applied the same Bayesian ensemble reweighting approach to a joint analysis of the FRET and SAXS data, whose quantitative relation to the structure ensemble is more straightforward than for hydrodynamic data. In Figure 5a, we show examples of the quality of fit and residuals, for the reweighted ensembles for R17d and ACTR SAXS data in GdmCl (results for Urea are given in Figure S12), and in Figure 5b, the quality of the fit to the FRET data using multiple labeling positions. We find that we are able to fit both data sets very well, showing that they are mutually compatible. There is a small deviation from the experimental SAXS data for Å−1, however differences are expected at larger q due to the lack of a realistic model of solvent structure: a comparison of a SAXS calculation using both protein and solvent molecules from an all-atom simulation with one using only the protein and a continuum solvent model also starts to show deviations at q ~ 0.1Å−1.72 Below this q, however, both calculations give very similar results, demonstrating that a detailed solvent model is not required to account for this low q range72.
The distributions of rg from the resulting ensembles reweighted using the experimental data, shown in Figure 5c, reveal a systematic expansion with increasing denaturant concentration. We note that this expansion is determined both by the SAXS and FRET data: separate reweighted ensembles using only SAXS or only FRET data recover a similar trend in Rg to that from the combined fit (Figure S13). The consistency with the Rg from the ensembles determined using only one type of data also shows that the ensemble using both SAXS and FRET is not simply “interpolating” between the data sets, but, rather, both experiments are pointing to the same outcome. An additional independent test of the molecular ensembles is their comparison with the results from 2f-FCS and DLS. Thus we have computed hydrodynamic radii from the reweighted ensembles determined by reweighting based on FRET and SAXS data with the shell model in the program HydroPro74. As shown in Figure 4, these back-calculated hydrodynamic radii (and especially their changes with denaturant concentration) are in reasonable agreement with those estimated from 2f-FCS and DLS measurements, further cross-validating the simulated ensembles and indicating the consistency of all four experimental techniques used. Accompanying the increase of Rg and Rh is a modest increase in asphericity (Figure S14) with increasing denaturant concentration, consistent with theoretical expectations66,91.
We have also tested whether the ensemble analysis is sensitive to the consistency of the experimental data sets with each other. To do this, we have combined the ACTR SAXS data from the present work with FRET data collected with some of the most hydrophobic chromophores available for FRET (as quantified by reversed-phase HPLC, Figure S15), Atto 647N and Abberior STAR 635. In the absence of denaturant, a pronounced increase in FRET efficiency was observed for ACTR labeled with these dyes, indicating further collapse relative to the commonly employed hydrophilic dyes containing charged groups (e.g. Alexa Fluor 488 and 594, Table S3). While it is possible to select a sub-ensemble which fits both SAXS and FRET data using the hydrophobic dyes, there are two indications that the fit is poor (Table S4): First, a much stronger reweighting of the original ensemble is required, as measured by the lower fit entropy, compared to when the data based on the hydrophilic dyes are used. Secondly, if only the SAXS data are used to reweight the simulations, FRET for the hydrophilic chromophore pairs is in reasonable agreement with experiment, but the agreement for the hydrophobic chromophore pairs is poor. Similarly, if only the FRET data are used for reweighting, reasonable agreement with the SAXS data is obtained for the hydrophilic dye pair, but not for the hydrophobic dyes. In summary, the analysis used here not only provides molecular ensembles compatible with all experimental data used, but it also enables inconsistent results to be identified.
Discussion
Overall, the results from all methods we employed indicate an expansion of the polypeptide chain with increasing denaturant concentration and are mutually compatible. To illustrate this consistency, we show in Figure 6 the denaturant dependencies of R and Rg from the direct analysis of the FRET and/or SAXS experiments as well as from the reweighted ensembles. In all cases, we find an expansion with denaturant concentration, with the most pronounced changes occurring at the lower denaturant concentrations. The steeper increase in Rg at lower denaturant concentrations is consistent with the expectations of a binding model of denaturant interactions (where saturation must occur at some point) and with previous FRET studies on unfolded and intrinsically disordered proteins6,35,58,92. Similarly, the polymer scaling exponents increase with denaturant concentration, whether estimated from FRET, SAXS fractal dimension, or the dependence of the intramolecular distances on the sequence separation in the reweighted ensembles (Figure 2–3; Figure S16). While all of the experimental data indicate an expansion with increasing denaturant concentration, the ensembles resulting from our analysis illustrate a noteworthy difference in the denaturant sensitivity of the observables monitored (Figure 5d): over the experimentally accessible denaturant ranges, the increase in R is 28–43 %, in Rg 20–29 %, and in Rh only 9–11 % (ranges denote the largest and smallest change across all protein/denaturant combinations (Table S2)). A corresponding analysis of conformational ensembles from unbiased molecular simulations of ACTR yields similar trends (Table S2). These different measures of chain size thus result in different relative amplitudes upon expansion or collapse. Since FRET measurements are most directly related to R, the transfer efficiency is intrinsically most responsive to chain expansion. These differences in relative amplitudes are expected both from polymer theory, simulations, and previous experiments. Specifically, an increase in the ratio R/Rg is predicted upon the expansion of polymers from Θ- to good-solvent conditions by renormalization group theory68 and from simulations of homopolymers93 and unfolded proteins65, as the effective attraction between monomers is reduced. Rg is also expected to exhibit a larger change upon expansion than Rh from theory68,94, simulations95, and experiments on homopolymers73. The sensitivity of FRET is further amplified by the highly nonlinear distance dependence of the transfer efficiency E, such that E changes are larger than 50% from the lowest to the highest denaturant concentration in all cases. The combination of these effects helps to explain why unfolded state expansion has invariably been detected in single-molecule FRET experiments. However, why do we observe an increase in Rg using SAXS, while such an expansion was not resolved in some earlier studies?
Figure 6.

Denaturant-induced expansion of R17d and ACTR as seen from multiple methods. Panels a-d show the average end-to-end distances R in GdmCl and urea for R17d and ACTR. The corresponding radii of gyration are shown in panels e-h. Data are from a Guinier analysis of SAXS data with qmaxRg ≤ 1.11 (green), from the analysis of FRET data with the Gaussian chain model as an upper bound (cyan) and a self-avoiding walk (SAW) as a lower bound (blue), from the ensemble refinement (red), and from all-atom molecular dynamics simulations of ACTR (black)72.
As our data illustrate, detecting changes of Rg from SAXS data is challenging due to the subtle variations in the shape of I(q) with denaturant concentration and the large associated errors for each data set (Figure S5), as previously suggested42. The trend becomes clear only with repeated independent data collections for each combination of protein and denaturant concentration, sampling a sufficiently large number of denaturant concentrations, and careful control of the effects of inter-particle interference and protein self-association. The latter necessitates the use of low protein concentrations, requiring high flux of the incident beam. Even with the undulator beamline and third generation synchrotron source at the Argonne National Laboratory, the dependence of Rg on denaturant concentration is noisy, particularly at the higher denaturant concentrations, where the decreased protein/buffer contrast and higher X-ray absorption increase the uncertainty of the experimental data. Both a reduction of the applicable range of the Guinier approximation with the expansion of the protein at higher denaturant concentration, and the lack of reliable lowest-q data, reduce the apparent fitted Rg progressively as the denaturant concentration increases. A systematic analysis of the validity of the Guinier fit to the primary SAXS data is challenging because of the experimental noise, but we can use the smooth I(q) calculated from the structure ensembles to illustrate this point: in Figure 5e we show the dependence of the Guinier-fitted Rg on qmaxRg. If the fit is started from q=0, then the systematic error of the fit reaches ~0.1 nm for qmaxRg ~ 0.9. However, if the fit is started at the q corresponding to the first experimental data point (always q>0), the underestimation of Rg is even greater (blue curve in Figure 5e). Finally, for equilibrium SAXS measurements, reliable radii of gyration can only be extracted well above the denaturation midpoint, due to the difficulty of accounting for native state scattering at lower denaturant concentration18–20. Our results are in fact consistent with the earlier findings of little variation in Rg above typical midpoint denaturation concentrations23.
To illustrate the difficulty of observing an Rg change at high denaturant concentration, we fit the dependence of Rg from the SAXS Guinier region on denaturant concentration (Figure 6) with two linear models: one with both slope and intercept as free parameters and the other with only the intercept, and zero slope. Since the model with two parameters always fits better, we introduce the Bayesian information criterion (BIC)96 to evaluate whether the fit is significantly better if the slope is not fixed to zero. In Table S5, we show that if we fit Rg over all denaturant concentrations, the BIC score indicates with high significance that the two-parameter model with nonzero denaturant dependence is better. However, when restricting the fit to data from denaturant concentrations above 3 M (urea or GdmCl), in three of the four cases, the SAXS data fail to indicate a statistically meaningful change of Rg with denaturant concentration, and in the fourth (ACTR in GdmCl), the improvement when including denaturant dependence of Rg is of marginal significance. These results stress the importance of making as many measurements of Rg over as wide a range of denaturant conditions as possible in order to have the best chance of resolving any variation. In principle, for stably folded proteins, time-resolved SAXS measurements could provide access to the low-denaturant region, where we find Rg expansion to be most prominent. However, in most cases time-resolved SAXS measurements also suggest no collapse after denaturant dilution, even when the final denaturant concentration is very low21–24. We cannot comment directly on these results except to note that these measurements, performed with very short exposures, would have even larger errors than static scattering data.
The potential presence of small amounts of aggregates or other larger particles in the sample may distort the Rg extracted from the SAXS measurements. To mitigate this problem, we firstly selected highly soluble proteins and secondly used sample aliquots coming from the exact same batch (i.e. identical samples) for SAXS and DLS experiments, following the same handling protocols for both techniques, as described in the supporting information. In this way, we were able to use the sensitivity of DLS to aggregation to determine that we always had ≤ 1% of slow-diffusing particles in our samples at every denaturant concentration. Simulations of the effect of hypothetical protein aggregates consistent with the ~80 nm size extracted from DLS measurements show the effect on SAXS data to be negligible in that range. We note, however, that higher concentrations of aggregates could lead to an overestimation of Rg, especially at the lowest denaturant concentrations, where aggregation is most likely to occur.
A potential complication in FRET experiments is whether the extrinsic fluorophores themselves influence the results, perhaps inducing collapse, although molecular simulations suggest this to be a small effect72,97. To probe for this contribution, we have tested some of the most hydrophobic chromophores currently available, which lead to a pronounced collapse of ACTR in the absence of denaturant. However, the resulting transfer efficiencies are incompatible with our SAXS data, in the sense that the structural ensembles produced using both the SAXS data and the hydrophobic dyes require rather extreme reweighting, or ensembles produced with SAXS or FRET alone do not reproduce the respective other data set (Table S3). In contrast, the SAXS data are consistent with the FRET data collected from the protein labeled with the hydrophilic dyes used here and in many other experiments. Further direct evidence for the absence of an effect from the labels comes from the agreement of the 2f-FCS results on labeled protein with the DLS measurements on unlabeled protein, indicating at most a modest Rh increase, possibly due to the contribution of the fluorophores to the protein mass (+6% or +10% for R17d and ACTR, respectively). Lastly, in many experiments using identical dye pairs, large differences in FRET-based intramolecular distances have been observed for different polypeptide sequences, demonstrating that changes in the charge composition and hydrophobicity of the polypeptide chain itself are dominant over any effects from the fluorophores40,63,98.
For a quantitative determination of average distance, R, and radius of gyration, Rg, from single-molecule FRET, and comparison with SAXS without using ensemble refinement, important considerations are the uncertainty in the transfer efficiency and the need to assume a specific polymer model. From more than a decade of measurements in our laboratory, using different instruments and dye pairs, we estimate an accuracy in the transfer efficiency, ΔE, of ~0.02, mainly arising from instrument calibration and other corrections; the precision of transfer efficiency measurements performed on a single instrument on the same day is <0.005. Therefore, the greater challenge for the quantitative interpretation of single-molecule FRET experiments on unfolded proteins is the model-dependence of the conversion of E to R and Rg. Our results indicate that using the P(r) of simple polymer models may overestimate the degree of expansion. As pointed out previously, using P(r) of a Gaussian chain leads to an overestimation of chain dimensions by ~10% at the highest denaturant concentrations65 but often provides a better approximation at low denaturant (Figure 6). On the other hand, P(r) of a SAW tends to underestimate chain dimensions at low denaturant concentrations but provides a better approximation at high denaturant concentrations (Figure 6). Given the crossover99 from Θ- to good solvent conditions during denaturant-induced chain expansion40, this observation is not entirely surprising and can contribute to the apparent discrepancy with SAXS results. Using the distance distribution of a SAW, we find that we are able to more accurately recover the distance R and radius of gyration Rg from the transfer efficiency, when applied to synthetic data from simulations (Figure S4). In the absence of molecular simulations for ensemble refinement, polymer models thus provide useful estimates of chain dimensions, but the choice of the model leads to a variability of ~10 % in chain dimensions (Figure 6). The conversion of R to Rg involves additional assumptions regarding the ratio of the two quantities, which depends on solvent quality68,99, and thus introduces additional uncertainty.
Because of the controversy we aim to address, our analysis has been focused mainly on the radius of gyration and related quantities that probe large-scale features and overall dimensions of the sampled molecular conformations. Obtaining a consistent value of this most basic property of an unfolded or disordered protein states, when measured by different techniques, is clearly a prerequisite for developing structural models for these states. Nonetheless, the ensemble of states populated by an IDP or unfolded protein cannot always be reduced to a description in terms of simple polymer theories, and specific local interactions and structure may be important in many cases100,101. Resolving the apparent disagreement between SAXS and FRET experiments opens the way to the integration of both types of data in detailed structural models of disordered proteins.
Conclusions
Previously, qualitative discrepancies regarding the effect of chemical denaturants on the dimensions of unfolded and disordered proteins have been reported, when comparing the results from SAXS and other experimental methods, especially FRET. However, the two methods had previously only been applied to one protein in common, protein L. In the present work, by comparing two different proteins in two different denaturants, and using four different experimental methods, we find that all results are self-consistent, and show an increase of the average distance between FRET labels, radius of gyration, polymer scaling exponent and hydrodynamic radius of the chains with increasing denaturant concentration. These findings are consistent with expectations based on the improved solvent quality in concentrated denaturant solutions33,42,43,49,50,102,103. We stress that, while the proteins considered here do collapse as the denaturant concentration is reduced, they do not form a fully collapsed globule in water.6,35,58,92 Instead, they populate a partially compacted ensemble close to the Θ-state, in which protein and solvent interactions are balanced, a situation also obtained for other proteins40,44. A careful analysis of our results helps to explain the apparent discrepancies in earlier work. First, the FRET efficiency is inherently more sensitive to changes in protein expansion, due to the greater relative change of R with denaturant than Rg or Rh, and due to the nonlinear distance dependence of FRET. In addition, the use of polymer-based distance distributions for obtaining average distance and radius of gyration from FRET can lead to an overestimation of the degree of chain expansion with denaturant. On the other hand, probing expansion by SAXS is complicated by several factors which may lead to an underestimation, including most prominently (i) the sensitivity of Rg to the fitting range used in the Guinier analysis, and (ii) the difficulty of determining Rg at the lowest denaturant concentrations, where the largest changes in protein dimensions occur, in equilibrium ensemble-averaged techniques such as SAXS that are restricted to measurements sufficiently far above the unfolding midpoint. The integrated experimental approach presented here, combined with Bayesian ensemble refinement, suggests a plausible resolution to a long-standing controversy.
Supplementary Material
Acknowledgments
We thank Ad Bax, William Eaton, Gilad Haran, and Dave Thirumalai for helpful comments and suggestions, Jane Clarke for an expression plasmid for R17, Franziska Zosel for a high-yield expression plasmid for ACTR, and Andrea Holla for help in identifying suitable alternative FRET pairs. R.B. and W.Z. were supported by the intramural research program of the National Institute of Diabetes and Digestive and Kidney Diseases of the National Institutes of Health. This work utilized the computational resources of the NIH HPC Biowulf cluster (http://hpc.nih.gov). Work at the University of Zurich was supported by funding from the Swiss National Science foundation and the European Research Council. For the SAXS experiments, we gratefully acknowledge use of SAXS Core facility of Center for Cancer Research, National Cancer Institute (NCI). Scattering data were acquired using the shared scattering beamline 12-ID-B resource allocated under the PUP-24152 agreement between the National Cancer Institute and Argonne National Laboratory (ANL). We thank Dr. Lixin Fan (NCI), and Dr. Xiaobing Zuo (ANL) for their expert support. The Advanced Photon Source, a U.S. Department of Energy (DOE) Office of Science User Facility, is operated for the DOE Office of Science by Argonne National Laboratory under Contract No. DE-AC02-06CH11357.
Footnotes
For ACTR, an initial increase in transfer efficiency is observed at low concentrations of GdmCl because of screening of the electrostatic repulsion commonly observed in charged IDPs.58,63
Additional aspects influencing the analysis, such as fluorescence lifetime and rotational averaging of the fluorophores, are discussed in the SI.
Supporting Information
Description of experiment and simulation methods, data analysis and additional figures are given in the Supporting Information.
References
- 1.Wolynes PG, Onuchic JN, Thirumalai D. Science. 1995;267:1619. doi: 10.1126/science.7886447. [DOI] [PubMed] [Google Scholar]
- 2.Bryngelson JD, Wolynes PG. Proc Natl Acad Sci USA. 1987;84:7524. doi: 10.1073/pnas.84.21.7524. [DOI] [PMC free article] [PubMed] [Google Scholar]
- 3.Leopold PE, Montal M, Onuchic JN. Proc Natl Acad Sci USA. 1992;89:8721. doi: 10.1073/pnas.89.18.8721. [DOI] [PMC free article] [PubMed] [Google Scholar]
- 4.Šali A, Shakhnovich EI, Karplus M. Nature. 1994;369:248. doi: 10.1038/369248a0. [DOI] [PubMed] [Google Scholar]
- 5.Dill KA, Chan HS. Nature Structural Biology. 1997;4:10. doi: 10.1038/nsb0197-10. [DOI] [PubMed] [Google Scholar]
- 6.Schuler B, Eaton WA. Curr Opin Struct Biol. 2008;18:16. doi: 10.1016/j.sbi.2007.12.003. [DOI] [PMC free article] [PubMed] [Google Scholar]
- 7.Theillet F-X, Binolfi A, Frembgen-Kesner T, Hingorani K, Sarkar M, Kyne C, Li C, Crowley PB, Gierasch L, Pielak GJ, Elcock AH, Gershenson A, Selenko P. Chem Rev. 2014;114:6661. doi: 10.1021/cr400695p. [DOI] [PMC free article] [PubMed] [Google Scholar]
- 8.Van der Lee R, Buljan M, Lang B, Weatheritt RJ, Daughdrill GW, Dunker AK, Fuxreiter M, Gough J, Gsponer J, Jones DT, Kim PM, Kriwacki RW, Oldfield CJ, Pappu RV, Tompa P, Uversky VN, Wright PE, Babu MM. Chem Rev. 2014;114:6589. doi: 10.1021/cr400525m. [DOI] [PMC free article] [PubMed] [Google Scholar]
- 9.Mittag T, Orlicky S, Choy W-Y, Tang X, Lin H, Sicheri F, Kay LE, Tyers M, Forman-Kay J. Proc Natl Acad Sci USA. 2008;105:17772. doi: 10.1073/pnas.0809222105. [DOI] [PMC free article] [PubMed] [Google Scholar]
- 10.Marsh JA, Dancheck B, Ragusa MJ, Allaire M, Forman-Kay J, Peti W. Structure. 2010;18:1094. doi: 10.1016/j.str.2010.05.015. [DOI] [PMC free article] [PubMed] [Google Scholar]
- 11.Michalet X, Weiss S, Jäger M. Chem Rev. 2006;106:1785. doi: 10.1021/cr0404343. [DOI] [PMC free article] [PubMed] [Google Scholar]
- 12.Schuler B, Hofmann H. Curr Opin Struct Biol. 2013;23:36. doi: 10.1016/j.sbi.2012.10.008. [DOI] [PubMed] [Google Scholar]
- 13.Meier S, Blackledge M, Grzesiek S. J Chem Phys. 2008;128:052204. doi: 10.1063/1.2838167. [DOI] [PubMed] [Google Scholar]
- 14.Graewert MA, Svergun DI. Curr Opin Struct Biol. 2013;23:748. doi: 10.1016/j.sbi.2013.06.007. [DOI] [PubMed] [Google Scholar]
- 15.Nöppert A, Gast K, Müller-Frohne M, Zirwer D, Damaschun G. FEBS Lett. 1996;380:179. doi: 10.1016/0014-5793(96)00048-8. [DOI] [PubMed] [Google Scholar]
- 16.Dertinger T, Pacheco V, Von der Hocht I, Hartmann R, Gregor I, Enderlein J. Chem Phys Chem. 2007;8:433. doi: 10.1002/cphc.200600638. [DOI] [PubMed] [Google Scholar]
- 17.Doose S, Neuweiler H, Sauer M. Chem Phys Chem. 2009;10:1389. doi: 10.1002/cphc.200900238. [DOI] [PubMed] [Google Scholar]
- 18.Smith CK, Bu Z, Anderson KS, Sturtevant JM, Engelman DM, Regan L. Protein Sci. 1996;5:2009. doi: 10.1002/pro.5560051007. [DOI] [PMC free article] [PubMed] [Google Scholar]
- 19.Flanagan JM, Kataoka M, Fujisawa T, Engelman DM. Biochemistry. 1993;32:10359. doi: 10.1021/bi00090a011. [DOI] [PubMed] [Google Scholar]
- 20.Choy WY, Mulder FAA, Crowhurst KA, Muhandiram DR, Millet IS, Doniach S, Forman-Kay JD, Kay LE. J Mol Biol. 2002;316:101. doi: 10.1006/jmbi.2001.5328. [DOI] [PubMed] [Google Scholar]
- 21.Plaxco KW, Millet IS, Segal DJ, Doniach S, Baker D. Nat Struct Biol. 1999;6:554. doi: 10.1038/9329. [DOI] [PubMed] [Google Scholar]
- 22.Watkins HM, Simon AJ, Sosnick TR, Lipman EA, Hjelm RP, Plaxco KW. Proc Natl Acad Sci USA. 2015;112:6631. doi: 10.1073/pnas.1418673112. [DOI] [PMC free article] [PubMed] [Google Scholar]
- 23.Yoo TY, Meisberger SP, Hinshaw J, Pollack L, Haran G, Sosnick TR, Plaxco K. J Mol Biol. 2012;418:226. doi: 10.1016/j.jmb.2012.01.016. [DOI] [PMC free article] [PubMed] [Google Scholar]
- 24.Jacob J, Krantz B, Dothager RS, Thiyagarajan P, Sosnick TR. J Mol Biol. 2004;338:369. doi: 10.1016/j.jmb.2004.02.065. [DOI] [PubMed] [Google Scholar]
- 25.Johansen D, Trewhella J, Goldenberg DP. Protein Sci. 2011;20:1955. doi: 10.1002/pro.739. [DOI] [PMC free article] [PubMed] [Google Scholar]
- 26.Kimura T, Akiyama S, Uzawa T, Ishimori K, Morishima I, Fujisawa T, Takahashi S. J Mol Biol. 2005;350:349. doi: 10.1016/j.jmb.2005.04.074. [DOI] [PubMed] [Google Scholar]
- 27.Uzawa T, Kimura T, Ishimori K, Morishima I, Matsui T, Ikeda-Saito M, Takahashi S, Akiyama S, Fujisawa T. J Mol Biol. 2006;357:997. doi: 10.1016/j.jmb.2005.12.089. [DOI] [PubMed] [Google Scholar]
- 28.Konuma T, Kimura T, Matsumoto S, Goto Y, Fujisawa T, Fersht AR, Takahashi S. J Mol Biol. 2011;405:1284. doi: 10.1016/j.jmb.2010.11.052. [DOI] [PubMed] [Google Scholar]
- 29.Deniz AA, Laurence TA, Beligere GS, Dahan M, Martin AB, Chemla DS, Dawson PE, Shultz PG, Weiss S. Proc Natl Acad Sci USA. 2000;97:5179. doi: 10.1073/pnas.090104997. [DOI] [PMC free article] [PubMed] [Google Scholar]
- 30.Schuler B, Lipman EA, Eaton WA. Nature. 2002;419:743. doi: 10.1038/nature01060. [DOI] [PubMed] [Google Scholar]
- 31.Sherman E, Haran G. Proc Natl Acad Sci USA. 2006;103:11539. doi: 10.1073/pnas.0601395103. [DOI] [PMC free article] [PubMed] [Google Scholar]
- 32.Möglich A, Joder K, Kiefhaber T. Proc Natl Acad Sci USA. 2006;103:12394. doi: 10.1073/pnas.0604748103. [DOI] [PMC free article] [PubMed] [Google Scholar]
- 33.Ziv G, Haran G. J Am Chem Soc. 2009;131:2942. doi: 10.1021/ja808305u. [DOI] [PMC free article] [PubMed] [Google Scholar]
- 34.Soranno A, Longhi R, Bellini T, Buscaglia M. Biophys J. 2009;96:1515. doi: 10.1016/j.bpj.2008.11.014. [DOI] [PMC free article] [PubMed] [Google Scholar]
- 35.Haran G. Curr Opin Struct Biol. 2012;22:14. doi: 10.1016/j.sbi.2011.10.005. [DOI] [PMC free article] [PubMed] [Google Scholar]
- 36.Buscaglia M, Lapidus LJ, Eaton WA, Hofrichter J. Biophys J. 2006;91:276. doi: 10.1529/biophysj.105.071167. [DOI] [PMC free article] [PubMed] [Google Scholar]
- 37.Holthauzen LMF, Rösgen J, Bolen DW. Biochemistry. 2010;49:1310. doi: 10.1021/bi9015499. [DOI] [PMC free article] [PubMed] [Google Scholar]
- 38.Guo L, Chowdhury P, Glasscock JM, Gai F. J Mol Biol. 2008;384:1029. doi: 10.1016/j.jmb.2008.03.006. [DOI] [PMC free article] [PubMed] [Google Scholar]
- 39.Sherman E, Itkin A, Kuttner YY, Rhoades E, Amir D, Haas E, Haran G. Biophys J. 2008;94:4819. doi: 10.1529/biophysj.107.120220. [DOI] [PMC free article] [PubMed] [Google Scholar]
- 40.Hofmann H, Soranno A, Borgia A, Gast K, Nettels D, Schuler B. Proc Natl Acad Sci USA. 2012;109:16155. doi: 10.1073/pnas.1207719109. [DOI] [PMC free article] [PubMed] [Google Scholar]
- 41.Kaplon TM, Michnik A, Drzazga Z, Richter K, Kochman M, Ozyhar A. Biochem Biophys Acta. 2009;1794:1616. doi: 10.1016/j.bbapap.2009.07.010. [DOI] [PubMed] [Google Scholar]
- 42.Liu Z, Reddy G, Thirumalai D. J Phys Chem B. 2016 doi: 10.1021/acs.jpcb.6b00327. [DOI] [PubMed] [Google Scholar]
- 43.O’Brien E, Ziv G, Brooks BR, Thirumalai D. Proc Natl Acad Sci USA. 2008;105:13403. doi: 10.1073/pnas.0802113105. [DOI] [PMC free article] [PubMed] [Google Scholar]
- 44.Wang Y, Trewhella J, Goldenberg DP. J Mol Biol. 2008;377:1576. doi: 10.1016/j.jmb.2008.02.009. [DOI] [PMC free article] [PubMed] [Google Scholar]
- 45.Merchant KA, Best RB, Louis JM, Gopich IV, Eaton WA. Proc Natl Acad Sci USA. 2007;104:1528. doi: 10.1073/pnas.0607097104. [DOI] [PMC free article] [PubMed] [Google Scholar]
- 46.Knowles DB, Shkel I, Phan NM, Sternke M, Lingeman E, Cheng X, Cheng L, O’Connor K, Record MT. Biochemistry. 2015;54:3528. doi: 10.1021/acs.biochem.5b00246. [DOI] [PMC free article] [PubMed] [Google Scholar]
- 47.Uversky VN, Gillespie JR, Millett IS, Khodyakova AV, Vasiliev AM, Chernovskaya TV, Vasilienko RN, Kozlovskaya GD, Dolgikh DA, Fink AL, Doniach S, Abramov VM. Biochemistry. 1999;38:15009. doi: 10.1021/bi990752+. [DOI] [PubMed] [Google Scholar]
- 48.Gast K, Damaschun H, Eckert K, Schulze-Forster K, Maurer HR, Müller-Frohne M, Zirwer D, Czarnecki J, Damaschun G. Biochemistry. 1995;34:13211. doi: 10.1021/bi00040a037. [DOI] [PubMed] [Google Scholar]
- 49.Frank HS, Franks F. J Chem Phys. 1968;48:4746. [Google Scholar]
- 50.Nozaki Y, Tanford C. J Biol Chem. 1963;238:4074. [PubMed] [Google Scholar]
- 51.Demarest SJ, Martinez-Yamout M, Chung J, Chen H, Xu W, Dyson HJ, Evans RM, Wright PE. Nature. 2002;415:549. doi: 10.1038/415549a. [DOI] [PubMed] [Google Scholar]
- 52.Soranno A, Koenig I, Borgia MB, Hofmann H, Zosel F, Nettels D, Schuler B. Proc Natl Acad Sci USA. 2014;111:4874. doi: 10.1073/pnas.1322611111. [DOI] [PMC free article] [PubMed] [Google Scholar]
- 53.Kjaergaard M, Teilum K, Poulsen FM. Proc Natl Acad Sci USA. 2010;107:12535. doi: 10.1073/pnas.1001693107. [DOI] [PMC free article] [PubMed] [Google Scholar]
- 54.Borgia A, Wensley BG, Soranno A, Nettels D, Borgia MB, Hoffmann A, Pfeil SH, Lipman EA, Clarke J, Schuler B. Nature Comm. 2012;3:1195. doi: 10.1038/ncomms2204. [DOI] [PMC free article] [PubMed] [Google Scholar]
- 55.Kjaergaard M, Nørholm A-B, Hendus-Altenburger R, Pedersen SF, Poulsen FM, Kragelund BB. Protein Sci. 2010;19:1555. doi: 10.1002/pro.435. [DOI] [PMC free article] [PubMed] [Google Scholar]
- 56.Scott KA, Batey S, Hooton KA, Clarke J. J Mol Biol. 2004;344:195. doi: 10.1016/j.jmb.2004.09.037. [DOI] [PubMed] [Google Scholar]
- 57.Förster T. Ann Phys. 1948;6:55. [Google Scholar]
- 58.Schuler B, Soranno A, Hofmann H, Nettels D. Annu Rev Biophys. 2016;45:207. doi: 10.1146/annurev-biophys-062215-010915. [DOI] [PubMed] [Google Scholar]
- 59.Lipfert J, Doniach S. Annu Rev Biophys Biomol Struct. 2007;36:307. doi: 10.1146/annurev.biophys.36.040306.132655. [DOI] [PubMed] [Google Scholar]
- 60.Putnam CD, Hammel M, Hura GL, Tainer JA. Q Rev Biophys. 2007;40:191. doi: 10.1017/S0033583507004635. [DOI] [PubMed] [Google Scholar]
- 61.Gast K, Modler AJ. In: Protein Folding Handbook. Buchner J, Kiefhaber T, editors. Vol. 2. Wiley-VCH; Weinheim: 2005. p. 673. [Google Scholar]
- 62.Köfinger J, Hummer G. J Chem Phys. 2015;143:243150. doi: 10.1063/1.4937786. [DOI] [PubMed] [Google Scholar]
- 63.Müller-Späth S, Soranno A, Hirschfeld V, Hofmann H, Rüegger S, Reymond L, Nettels D, Schuler B. Proc Natl Acad Sci USA. 2010;107:14609. doi: 10.1073/pnas.1001743107. [DOI] [PMC free article] [PubMed] [Google Scholar]
- 64.Laurence TA, Kong X, Jäger M, Weiss S. Proc Natl Acad Sci USA. 2005;102:17348. doi: 10.1073/pnas.0508584102. [DOI] [PMC free article] [PubMed] [Google Scholar]
- 65.O’Brien E, Morrison G, Brooks BR, Thirumalai D. J Chem Phys. 2009;130:124903. doi: 10.1063/1.3082151. [DOI] [PMC free article] [PubMed] [Google Scholar]
- 66.Song J, Gomes G-N, Gradinaru CC, Chan H-S. J Phys Chem B. 2015;119:15191. doi: 10.1021/acs.jpcb.5b09133. [DOI] [PubMed] [Google Scholar]
- 67.De Gennes P-G. Scaling Concepts in Polymer Physics. Cornell University Press; Ithaca and London: 1979. [Google Scholar]
- 68.Schäfer L. Excluded Volume Effects in Polymer Solutions as Explained by the Renormalization Group. Springer; Berlin: 1999. [Google Scholar]
- 69.Kohn JE, Millett IS, Jacob J, Zagrovic B, Dillon TM, Cingel N, Dothager RS, Seifert S, Thiyagarajan P, Sosnick TR, Hasan MZ, Pande VS, Ruczinski I, Doniach S, Plaxco AKW. Proc Natl Acad Sci USA. 2004;101:12491. doi: 10.1073/pnas.0403643101. [DOI] [PMC free article] [PubMed] [Google Scholar]
- 70.Calmettes P, Durand D, Desmadril M, Minard P, Receveur V, Smith JC. Biophys Chem. 1994;53:105. doi: 10.1016/0301-4622(94)00081-6. [DOI] [PubMed] [Google Scholar]
- 71.Calmettes P, Durand D, Smith JC, Desmadril M, Minard P, Douillard R. J Phys IV France. 1993;3(C8):C8. [Google Scholar]
- 72.Zheng W, Borgia A, Buholzer K, Grishaev A, Schuler B, Best RB. Submitted. 2016 doi: 10.1021/jacs.6b05443. [DOI] [PMC free article] [PubMed] [Google Scholar]
- 73.Sun ST, Nishio I, Swislow G, Tanaka TJ. J Chem Phys. 1980;73:5971. [Google Scholar]
- 74.Ortega A, Amorós D, García de la Torre J. Biophys J. 2011;101:892. doi: 10.1016/j.bpj.2011.06.046. [DOI] [PMC free article] [PubMed] [Google Scholar]
- 75.Perez RB, Tischer A, Auton M, Whitten ST. Proteins. 2014;82:3373. doi: 10.1002/prot.24692. [DOI] [PMC free article] [PubMed] [Google Scholar]
- 76.Bernado P, Mylonas E, Petoukhov MV, Blackledge M, Svergun DI. J Am Chem Soc. 2007;129:5656. doi: 10.1021/ja069124n. [DOI] [PubMed] [Google Scholar]
- 77.Debye P. J Phys Chem. 1947;51:18. doi: 10.1021/j150451a002. [DOI] [PubMed] [Google Scholar]
- 78.Petrescu A-J, Receveur V, Calmettes P, Durand D, Smith JC. Protein Sci. 1998;7:1396. doi: 10.1002/pro.5560070616. [DOI] [PMC free article] [PubMed] [Google Scholar]
- 79.Lange OF, Lakomek N-A, Fares C, Schröder GF, Walter KFA, Becker S, Meiler J, Grubmüller H, Griesinger C, De Groot BL. Science. 2008;320:1471. doi: 10.1126/science.1157092. [DOI] [PubMed] [Google Scholar]
- 80.Lindorff-Larsen K, Best RB, Depristo MA, Dobson CM, Vendruscolo M. Nature. 2005;433:128. doi: 10.1038/nature03199. [DOI] [PubMed] [Google Scholar]
- 81.Boura E, Rózycki B, Herrick DZ, Chung HS, Vecer J, Eaton WA, Cafiso DS, Hummer G, Hurley JH. Proc Natl Acad Sci USA. 2011;108:9437. doi: 10.1073/pnas.1101763108. [DOI] [PMC free article] [PubMed] [Google Scholar]
- 82.Allison JR, Rivers RC, Christodoulou JC, Vendruscolo M, Dobson CM. Biochemistry. 2014;53:7170. doi: 10.1021/bi5009326. [DOI] [PMC free article] [PubMed] [Google Scholar]
- 83.Schwalbe M, Ozenne V, Bibow S, Jaremko M, Gajda M, Ringkjøbing-Jensen M, Biernat J, Becker S, Mandelkow E, Zweckstetter M, Blackledge M. Structure. 2014;22:238. doi: 10.1016/j.str.2013.10.020. [DOI] [PubMed] [Google Scholar]
- 84.Brookes DH, Head-Gordon T. J Am Chem Soc. 2016 doi: 10.1021/jacs.6b00351. In press. [DOI] [PubMed] [Google Scholar]
- 85.Vitalis A, Pappu RV. J Comput Chem. 2008;30:673. doi: 10.1002/jcc.21005. [DOI] [PMC free article] [PubMed] [Google Scholar]
- 86.Svergun D, Barberato C, Koch MHJ. J Appl Cryst. 1995;28:768. [Google Scholar]
- 87.Beauchamp KA, Pande VS, Das R. Biophys J. 2014;106:1381. doi: 10.1016/j.bpj.2014.02.009. [DOI] [PMC free article] [PubMed] [Google Scholar]
- 88.Antonov LD, Olsson S, Boomsma W, Hamelryck T. Phys Chem Chem Phys. 2015;18:5832. doi: 10.1039/c5cp04886a. [DOI] [PubMed] [Google Scholar]
- 89.Foerster F, Webb B, Krukenberg KA, Tsuruta H, Agard DA, Sali A. J Mol Biol. 2008;382:1089. doi: 10.1016/j.jmb.2008.07.074. [DOI] [PMC free article] [PubMed] [Google Scholar]
- 90.Yang S, Blachowicz L, Makowski L, Roux B. Proc Natl Acad Sci USA. 2010;107:15757. doi: 10.1073/pnas.1004569107. [DOI] [PMC free article] [PubMed] [Google Scholar]
- 91.Jagodzinski O, Eisenriegler E, Kremer K. J Phys I. 1992;2:2243. [Google Scholar]
- 92.Ziv G, Thirumalai D, Haran G. Phys Chem Chem Phys. 2009;11:83. doi: 10.1039/b813961j. [DOI] [PMC free article] [PubMed] [Google Scholar]
- 93.McCrackin FL, Mazur J, Guttman CM. Macromolecules. 1973;6:859. [Google Scholar]
- 94.Grosberg AY, Kuznetsov DV. Macromolecules. 1992;25:1996. [Google Scholar]
- 95.Dunweg B, Reith D, Steinhauser M, Kremer K. J Chem Phys. 2002;117:914. [Google Scholar]
- 96.Schwarz G. Annals of Statistics. 1978;6:461. [Google Scholar]
- 97.Zerze GH, Best RB. Biophys J. 2014;107:1654. doi: 10.1016/j.bpj.2014.07.071. [DOI] [PMC free article] [PubMed] [Google Scholar]
- 98.Wuttke R, Hofmann H, Nettels D, Borgia MB, Mittal J, Best RB, Schuler B. Proc Natl Acad Sci USA. 2014;111:5213. doi: 10.1073/pnas.1313006111. [DOI] [PMC free article] [PubMed] [Google Scholar]
- 99.Oono Y, Freed KF. J Phys A. 1982;15:1931. [Google Scholar]
- 100.Francis CJ, Lindorff-Larsen K, Best RB, Vendruscolo M. Proteins. 2006;65:145. doi: 10.1002/prot.21077. [DOI] [PubMed] [Google Scholar]
- 101.Allison JR, Varnai P, Dobson CM, Vendruscolo M. J Am Chem Soc. 2009;131:18314. doi: 10.1021/ja904716h. [DOI] [PubMed] [Google Scholar]
- 102.Holehouse AS, Garai K, Lyle N, Vitalis A, Pappu RV. J Am Chem Soc. 2015;137:2984. doi: 10.1021/ja512062h. [DOI] [PMC free article] [PubMed] [Google Scholar]
- 103.Zheng W, Borgia A, Borgia MB, Schuler B, Best RB. J Chem Theor Comput. 2015;11:5543. doi: 10.1021/acs.jctc.5b00778. [DOI] [PMC free article] [PubMed] [Google Scholar]
Associated Data
This section collects any data citations, data availability statements, or supplementary materials included in this article.