

Abstract
FeFe hydrogenases are the most efficient H2 producing enzymes, but inactivation by O2 is an obstacle to using them in biotechnological devices. Here we combine electrochemistry, site-directed mutagenesis, molecular dynamics and quantum chemical calculations to uncover the molecular mechanism of O2 diffusion within the enzyme and its reactions at the active site. We find that the partial reversibility of the reaction with O2 results from the four-electron reduction of O2 to water. The third electron/proton transfer step is the bottleneck for water production, competing with formation of the highly reactive OH radical and hydroxylated cysteine, consistent with recent crystallographic evidence. The rapid delivery of electrons and protons to the active site is therefore crucial to prevent the accumulation of these aggressive species at prolonged O2 exposure. These findings should provide important clues for the design of hydrogenase mutants with increased resistance to oxidative damage.
Introduction
One of the grand scientific challenges facing society is the design of cheap catalysts for efficient production and oxidation of carbon neutral energy carriers such as molecular hydrogen. A very promising perspective in this regard is to harness the catalytic power of NiFe and FeFe hydrogenases, the enzymes that have evolved over millions of years to produce and oxidize H2.1 Living microorganisms that express hydrogenases, or purified hydrogenases, could be used in this context; these highly efficient enzymes are also an invaluable source of inspiration for inorganic chemists to design synthetic mimics.
However, a major obstacle to using either type of hydrogenases is their sensitivity to oxidation,2 and the characterisation of their inactivation by O2 has become a major field of research. NiFe hydrogenases that naturally resist O2 have recently been identified,3,4 and attempts to increase the resistance of O2 sensitive NiFe hydrogenases have been partially sucessful.5 However, the O2 resistance of NiFe hydrogenases (whether natural or engineered) always appears to be paid for by a low H2 production activity. A different solution is to incorporate the enzyme into a redox polymer film that provides a self-activated O2 shield,6,7 but it is unknown if this strategy can protect the enzyme under conditions of reductive catalysis.
This paper deals with FeFe hydrogenases, which are more active for H2-production and less inhibited by H2 than NiFe hydrogenases.8 Their active site, the “H-cluster”, consists of a [Fe2(CO)3(CN)2 (dithiomethylamine)] subsite9,10,51 covalently bound to a 4Fe4S subcluster. Figure 1A shows the structure of a the FeFe hydrogenase from Clostridium pasteurianum (Cp), a structural homolog of the FeFe hydrogenase from Clostridium acetobutylicum (Ca),9 which covalently binds four FeS clusters in addition to the H-cluster. The enzyme from the photosynthetic organism Chlamydomonas reinhardtii (Cr) has no cofactor other than the H-cluster.11 Due to the sensitivity of FeFe hydrogenases to molecular oxygen, understanding the mechanism of O2 inhibition is a prerequisite for using genetic engineering to increase their O2-tolerance. This is crucial in the case of the enzyme from Cr, since this green alga could be used for biological H2 photoproduction12 if its hydrogenase were less inhibited by the O2 produced by photosynthesis.
Figure 1.
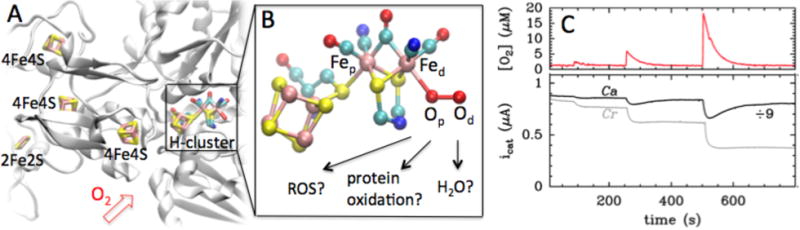
A: Crystal structure of FeFe hydrogenase from Clostridium pasteurianum (Cp, PDB id 3C8Y), a structural homologue of Ca FeFe hydrogenase. The protein backbone is shown in cartoon representation and the FeS- and H-clusters in licorice representation. Color code: Fe: pink, S: yellow, O: red, N: blue, C: cyan. B: Enlarged view of the H-cluster with O2 bound to the distal iron, Fed, and a nitrogen atom in the dithiomethyl bridge.10,51 Possible reaction products are indicated, ROS refers to reactive oxygen species, e.g. O2H, H2O2 or OH. C: Ca and Cr FeFe hydrogenases behaviour upon exposure to O2. The top panel shows the instantaneous O2 concentration, the bottom panel shows catalytic H2-oxidation current against time for Ca (black) and Cr (gray) FeFe hydrogenases (T = 12°C, 1 bar H2, pH = 7, data reproduced from ref13).
Aerobic inhibition of FeFe hydrogenase involves the diffusion of O2 through the protein14 and its initial attack on the vacant site on the Fe that is remote from the cubane (the so-called distal iron, Fed, see Figure 1B).13,15,16 Quantum chemical calculations rule out outer-sphere electron transfer to O2,17 but what happens after O2 attachment is unclear. According to X-ray absorption measurements, exposing the enzyme from Cr to O2 damages the 4Fe4S subcluster; this suggested that O2 binding to Fed results in the formation of a reactive oxygen species (ROS) that diffuses towards the 4Fe4S subcluster and destroys it.16,18 According to the DFT studies of Reiher19,20 and Pachter,21 this ROS could be the OOH radical or H2O2. However, this mechanism conflicts with a recent report according to which the O2-damaged enzyme from Cr harbors an intact 4Fe4S subsite and no 2Fe subcluster, and the observation that the O2-damaged enzyme is repaired upon insertion of a synthetic analogue of the 2Fe subcluster.22
Protein film electrochemistry (whereby the enzyme is adsorbed onto an electrode and electron transfer is direct) has been useful for characterizing the kinetics of aerobic inhibition of hydrogenases, because the activity can be recorded as a current while the enzyme is exposed to controlled “bursts” of oxygen.13 Figure 1C shows the response of Ca and Cr hydrogenases to pulses of O2. The activity of Ca hydrogenase is mostly recovered after a brief exposure to O2, but the enzyme is irreversibly inactivated by a prolonged exposure to O2. The enzyme from Cr is inhibited more strongly and less reversibly than that from Ca, but we have recently demonstrated that the mechanism of inhibition for both enzymes is actually described by the same kinetic scheme:13
| (1) |
The active enzyme “A” reacts with O2 (second order rate constant ki) to form an inactive species “I” that can either reactivate (first order rate constant ka) or irreversibly transform into a dead-end, irreversibly inactivated species “D” (k3).
Here, we examine how the above-defined rate constants depend on electrode potential, pH, replacement of H2O with D2O, and on protein mutations. We combine this experimental information with the results of theoretical chemistry calculations23 — molecular dynamics (MD) simulations and Markov State models describing O2 diffusion to the enzyme active site, coupled with density functional theory (DFT) calculations of the reaction products — to deduce the molecular mechanism of each step in the above kinetic scheme.
Results
We used the method described in ref 13 to examine how the kinetics of inhibition of FeFe hydrogenase by O2 depends on the experimental conditions. Figure 2 shows raw electrochemical data, and Figure 3 summarizes the changes in ki, ka and k3 (defined in eq. 1) against electrode potential (E), for experiments performed in H2O at 3 pH values, and one set of experiments performed with the enzyme oxidizing D2 in D2O at pD 7.
Figure 2.
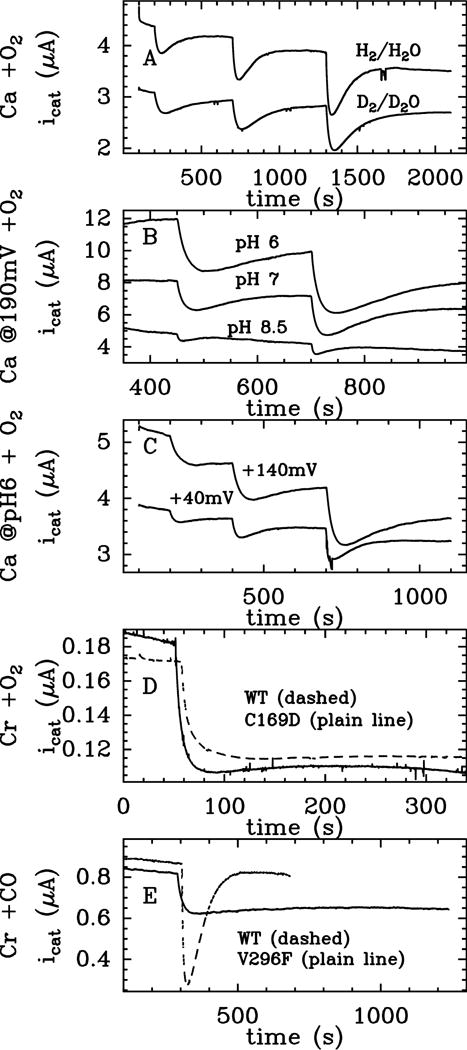
Change in catalytic H2-oxidation current against time, in experiments where Ca (panels A, B and C) or Cr (panels D and E) FeFe hydrogenases are exposed to “bursts” of O2 (panels A–D) or CO (panel E). See also Figure 3. Panel D shows the effect of replacing a conserved cysteine with aspartate on the O2 response of the enzyme from Chlamydomonas reinhardtii. Panel E compares the reaction with CO of WT Chlamydomonas reinhardtii hydrogenase and the designed mutant V296F. A: Ca, pH or pD = 7.1, E = 90 mV, T = 12°C, 1 bar H2 or D2. (Experiment with H2 oxidation in H2O, [O2]0 = 6.25 μM, τ = 49 s; 12.5 μM, 50 s; 25 μM, 53 s; experiment with D2 oxidation in D2O, [O2]0 = 6.25 μM, τ = 43 s; 12.5 μM, 40 s; 25 μM, 7 s). B: Ca, pH = 6, 7 and 8.5, E = 190 mV, T = 12°C, [O2]0 = 12.5 and 25 μM, τ = 38 and 39 s at pH 6; 39 and 36 s at pH 7; 25 and 25 s at pH 8.5. C: Ca, pH = 6, E = 40 and 140 mV, T = 12°C, [O2]0 = 6.25, 12.5 and 25 μM, τ = 35, 34 and 35 s at 40 mV; τ = 33, 32 and 33 s at 140mV D: Cr WT and Cr C169D, pH = 7, E = 40 mV, T = 3°C, [O2]0 = 25 μM, τ = 45 s for Cr WT and 49 s for Cr C169D. E: Cr WT and Cr V296F, pH = 7, 1 bar H2, ω = 3 krpm, E = −158 mV, T = 30°C, [CO]0 = 2.4 μM, τ = 20 s for Cr WT and 17.5 s for Cr V296F.
Figure 3.
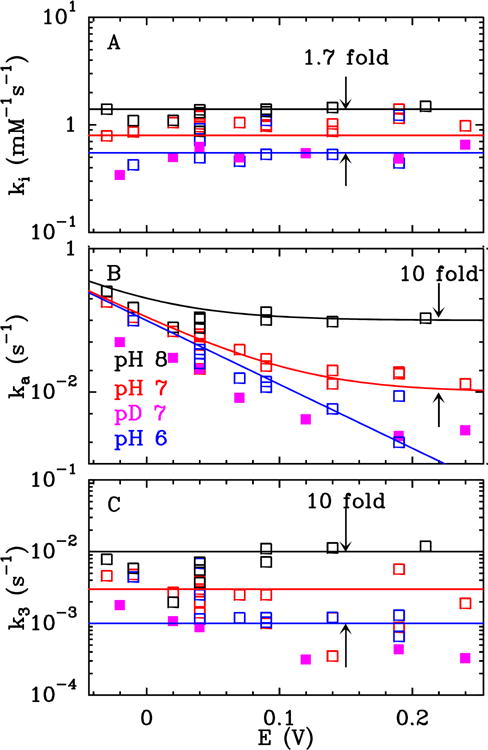
Potential dependence of the three rate constants defined in eq. 1, for the aerobic inhibition of Ca FeFe hydrogenase at pH 6 (blue), 7 (red) and 8 (black), and pD 7 (pink, see Methods). All at T = 12°C, 1 bar H2 or D2.
Initial O2 attack (rate constant ki)
Figure 3A shows that the second order rate constant of O2 binding, ki, is independent of E and pH (it increases less than 2-fold over 2 pH units), with no significant isotope effect, consistent with ki simply describing the diffusion of O2 through the protein and its binding at the active site. The rate ki of conversion from A to I in eq 1 can be calculated from the rate constants in the following scheme:24,25
| (2) |
Above, k+1 is the second-order rate constant for the diffusion of O2 from the solvent to the active site and k−1 is the first-order rate constant for the diffusion in the opposite direction. In the resulting state G (for “Geminate”), O2 is in the active site pocket but it is not yet chemically bound to the active site. The formation and breaking of the chemical bond is described by the first-order rate constants k+2 and k−2, respectively. As shown in supporting information (SI) section 1 and refs23,24, the measured rate constant ki is related to the rate constants in eq 2 by:
| (3) |
We have previously investigated the chemical binding of O2 to the H-cluster, and determined a binding free energy of −7.2 kcal/mol and an activation free energy of 12.9 kcal/mol from quantum chemical calculations;17 this gives k+2 = 2.2 × 10³ s−1 and k−2 = 1.1 × 10⁻² s−1 at T = 298 K. The value of k+2 is three orders of magnitude larger than the experimental (pseudo-first order) inhibition rate at typical ligand concentrations of 1 mM, ki × 1 mM, indicating that intraprotein diffusion is an essential part of the binding kinetics.
We obtained the pathways of intraprotein O2 diffusion from atomistic MD simulations of Cp FeFe hydrogenase (for which a high-quality X-ray structure is available26) in the presence of O2 molecules. We calculated the corresponding diffusion rate constants k±1 by careful analysis of the atomistic dynamics based on a Markov state model (MSM).27,28 In the MSM, the access of O2 to the H-cluster is described as a series of discrete jumps, from the solvent to protein cavities, and between protein cavities. The dynamics of hopping between these cavities is given by a kinetic master equation with transition rate constants obtained from the MD data (see Methods and SI section 2 for details).
Figure 4A shows the structure of the Cp FeFe hydrogenase, the microstates obtained from the MSM, and the two pathways (1 and 2) with the highest diffusive flux towards the active site. The dominant path (1) was also identified by Schulten and co-workers as the most important access tunnel (“pathway A” in ref. 14). Diffusion along pathway 2 is less likely to occur, as the gas molecule needs to get around the sidechain of F417 (see Figures 4B and S3). The bottleneck for ligand diffusion along the dominant pathway 1 is the last transition, involving the jump from site 7 to the geminate site. Only when thermal fluctuations increase the distance between Cys299-Pro324 and Cys299-F417 is the passage of O2 into the active site possible (see Fig. 4C), but these events are rare. From the MSM we obtain the values k+1 = 2.0 × 10³ s−1 mM−1 and k−1 = 7.3 × 10⁷ s−1 (see Figure S4). Combining k+1, k−1 and k+2 according to Eq. 3, we calculate ki = 5.8 × 10⁻² s−1 mM−1. The 20-fold difference with measured ki (1.1 s−1 mM−1) could result from small, cumulative errors on k1, k−1 and k2.
Figure 4.

Markov state model for O2 diffusion into Cp hydrogenase. A: Location of gas molecule microstates identified from the MD simulations (transparent spheres) overlaid on the structure of Cp hydrogenase (white). Atomic detail is shown only for the inorganic clusters. Red and blue solid spheres mark the microstates that are involved in the two paths (1 and 2, in blue and red) to the H-cluster. Microstates 5 (red with orange dotted line) and 7 (blue, with cyan dotted line) are those directly connected to the geminate site (G, green), as derived from flux calculations. Example paths arriving through pathways 1 and 2 are shown as blue and red lines, respectively. B: Zoom into the vicinity of the H-cluster. The geminate, 5 and 7 sites are shown colour coded as in A. C: Distance between key residues (shown in panel B), that block the access to the active site, as obtained from low force pulling simulations. Note the increase in distance between the sidechains of Cys299 and those of Pro324 (middle panel) and Phe417 (bottom panel) at about 320 ps (red dashed line), facilitating the transition of an O2 molecule from microstate 7 to the geminate site G.
The molecular-scale picture of the diffusion process obtained from MD simulation of the Cp hydrogenase is supported by experimental results on the binding of the competitive inhibitor CO to WT and mutant forms of the structurally homologous Cr hydrogenase. (CO binds reversibly to Fed under oxidizing conditions.29) Replacing F417 (Cp numbering, fig 4B) with a tryptophan unfortunately renders the enzyme inactive (we observed that the F290W mutant of Cr hydrogenase has no activity), but replacing the valine that lines the path from site 7 to the geminate site with a larger phenylalanine (V296F in the Cr enzyme) decreases the rates of CO binding and release about ten-fold (Figure 2E), from and to 6 ± 2 s−1mM−1 and 0.0014 ± 0.0002 s−1 (n = 3), respectively, at 30°C, pH 7, E = −158 mV. Explicit MD simulations of the corresponding mutant of the Cp enzyme (V423F, see Fig 4B and SI), in either of the two most probable rotameric states of the mutated residue, predict a ~2-fold decrease in ki and ka. Hence, experiment and simulation concur that the transition from site 7 to the geminate site is a key step in ligand diffusion to the active site.
Reactivation (ka)
The rate constant ka in eq. 1 corresponds to the transformation of the O2-adduct into an active form of the enzyme. However, we show that this reaction is more complex than the mere release of bound O2. Indeed, reactivation is slowed by replacing H2O and H2 with D2O and D2 (Figure 2A, kinetic isotope effect (KIE) in the range 2.4–4 at T = 12°C, depending on potential), and the value of ka is strongly dependent on pH and electrode potential E (Figure 2B and C). Moreover, the observation in Figure 3B that ka decreases exponentially as E increases and then levels off at high E provides unambiguous evidence that two distinct processes contribute to the reactivation: one that is triggered by a reduction (hence the sigmoidal increase in ka as E decreases, the observed exponential variation being the foot of this sigmoid) and one that is non-redox and predominates at high E and high pH. The value of ka in Figure 3B is the sum of the two corresponding reactivation rates.
We first consider the non-redox reactivation, whose rate is independent of potential and increases ten-fold per pH unit between pH 6 and 8 (Figure 3B). This shows that the non-redox reactivation occurs only from the basic form of a species whose protonation/deprotonation is fast compared to ka. Theoretical calculations (see SI section 3) suggest that the two protonation states are Fed-O2H+ and Fed-O2 and that protonation occurs via a neighbouring Cys that is part of a proton transfer chain connecting the active site to the solvent (Cys299 in Cp hydrogenase, Cys169 in the Cr enzyme).23,30–33 In the alkaline limit where [Fed-O2H+] ≪ [Fed-O2], the computed ka = k−2 = 1.1 × 10⁻² s−1, compares favourably with the experimental estimate of ka > 1.0 × 10⁻¹ s−1 (see SI section 3 for further discussion).
We now turn our attention to reductive reactivation, which dominates at low E (fig 3B). We propose that the reactivation process is the reduction of bound oxygen to a species whose dissociation from the active site gives back the active state. This hypothesis is confirmed by extensively validated theoretical calculations (see SI section 4) for consecutive ET/PT coupled reduction of O2 bound to the active site (Figure 5). Calculations suggest that the 4 electron/4 proton reduction of O2 is possible without formation of high energy intermediates, and the species dissociating from the active site is indeed water. During the first ET/PT step (2→3, −6.2 kcal/mol) the O-O bond length is elongated from 1.30 to 1.46 Å, which is best interpreted as a change from a superoxide to a hydro-peroxide species, see inset “3” in Figure 5. The second step may proceed via two pathways. The proton can attach either to the proximal Fe-bound oxygen to form hydrogen peroxide (3→5) or to the distal oxygen atom, upon which the O-O bond breaks and the first water molecule is formed (3→4). We found that the formation of water is highly exothermic (−34.9 kcal/mol) and strongly preferred over the endothermic formation of hydrogen peroxide (+8.6 kcal/mol). Rather unexpectedly, the proximal oxygen atom easily abstracts the hydrogen atom from Cys299, which results in a shift of electron spin density from oxygen to sulfur. The sulfur atom of Cys299 now serves as a hydrogen bond acceptor, while the newly formed water molecule stabilizes the Fe-bound hydroxy group by hydrogen bonding, see inset “4” in Figure 5. In the third step (4→6), which is mildly uphill (+0.7 kcal/mol), the sulfur atom is re-protonated and the Fe-bound hydroxy radical is reduced to OH−. Finally, in the fourth step (6→7, −12.9 kcal/mol) the Fe-bound hydroxide is reduced to water and the di-iron site returns to its initial redox state.
Figure 5.

Graphical representation of the relative energies with respect to SHE at pH = 7 of the most important states (1–9) involved in oxygen reduction to water at the active site of the FeFe hydrogenase. State 1 is equivalent to species “A” in eq. 3. For structures 2, 3, 4 and 9, the most important interatomic distances are shown in the respective insets. The first coordination sphere of the distal iron atom is presented in ball and stick representation (color code: Fe pink, O red, C turquoise, N dark blue, S yellow, H white).
The irreversible formation of dead-end species (k3)
In the kinetic model, the partial irreversibility of the reaction with O2 is accounted for by the irreversible transformation of the O2 adduct, with a first order rate constant k3. Figure 3C shows that the value of k3 is independent of E and increases about ten-fold over two pH units (Figure 2B shows that the inhibition is more reversible at high pH, but that is because ka is greater (cf Figure 3B) and the O2 adduct is therefore short lived). Replacing H2O with D2O decreases k3 five-fold. These observations suggest that k3 is the rate of the non-redox transformation of one of the species shown in Figure 5.
The conversion of 4 to 6 is the least exergonic step in the reduction of O2; state 4 may therefore be a bottleneck for water reduction and the starting point for the irreversible formation of various dead-end products. Indeed, calculations reveal the Fe-bound hydroxy radical can readily attack the deprotonated sulphur atom of Cys299 to form sulphenic acid (inset “9” in Figure 5, −14.0 kcal/mol). The latter is strongly stabilised by a hydrogen bond to the CN− ligand. Alternatively, the dissociation of the OH radical from the distal iron into the active site pocket is also energetically favourable by −14.7 kcal/mol; this highly reactive species could readily oxidize either the H-cluster or surrounding protein residues.20
Our proposal that Cys299-SOH and/or free OH radicals are involved in the irreversible inactivation is further supported by the following observations: (i) The formation of Cys299-SOH requires Cys299 to be deprotonated, consistent with the observed increase in k3 when the pH is increased, and the observed KIE. Besides, an increase in pH makes the 3rd ET/PT step even more endothermic, leading to an increase in concentration of 4 and eventually of dead-end product. (ii) Swanson et. al. have observed the oxidation of Cys169 (Cys299 in the enzyme from Cp).22 (iii) The replacement of Cys169 with Asp in the Cr enzyme,34 which has no effect on the spectroscopic signatures of the H-cluster,35 decreases the value of k3 about ten-fold, from k3 = 24±3 × 10⁻³ s−1 in the WT to 21±8 × 10⁻⁴ s−1 in the C169D mutant (ref 13 and Figure S9, see SI section 5 for details). Figure 2D confirms that the inhibition of the C169D mutant is significantly more reversible than that of the WT enzyme.
Discussion
Figure 6 summarizes our proposed mechanism of aerobic inactivation of FeFe hydrogenase, including diffusion of O2 from the solvent, O2 binding at the active site and the reactions that follow.
Figure 6.
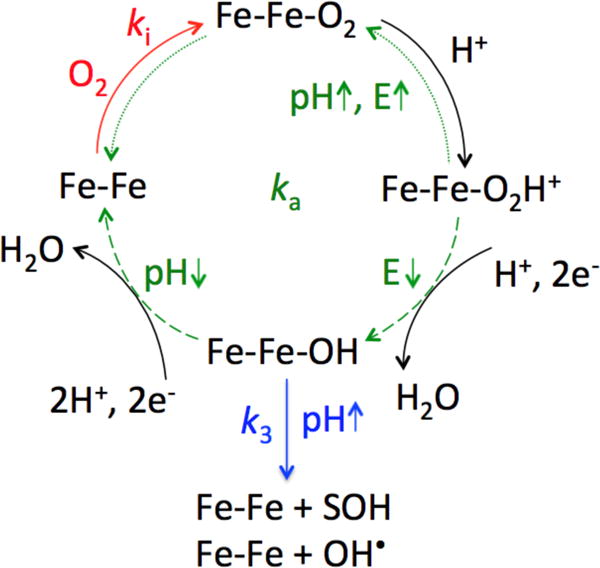
Proposed mechanism for aerobic inhibition of FeFe hydrogenase. The binding of O2 with rate constant ki × [O2] is indicated in red, the two paths that contribute to the rate constant of reactivation ka are shown in green. The re-activation path that dominates at high pH and high electrode potential E is indicated by dotted arrows and the re-activation that dominates at low pH and low potential is indicated by dashed arrows. The reaction with rate constant k3, which makes the inhibition partly irreversible, is depicted in blue.
Our conclusion from MD calculations that amino acid side chains along the pathway shown in figure 4A determine the rates of diffusion of O2 to the active site is supported by the observation that the V296F mutation in Cr hydrogenase strongly decreases the rates of binding and release of the competitive inhibitor CO. We found that the rate of inhibition by O2 of WT FeFe hydrogenase (ki) is the product of two parameters, the ratio k+1/k−1 and the chemical binding rate k+2 (cf eq. 3, k−1 ≫ k+2). Both ligand diffusion into the active site (k+1) and chemical bond formation (k+2) occur on the 0.1–1 millisecond time scale, but the observed inhibition rate is about 4 orders of magnitude slower, because k+1/k−1 ≈ 10−4mM−1. This also means that a mutation that decreases both k+1 and k−1 is expected to slow O2 inhibition only if it makes k−1 lower than k+2 (cf eq. 3), as observed previously in a series of NiFe hydrogenase channel mutants.24
The partial reversibility of the reaction with O2 (Figure 2 and ref 13) could not be detected in experiments where the enzyme was exposed to a constant concentration of O2,22,36 and as a consequence, all previous computational studies of the inhibition of hydrogenase have aimed at explaining the alleged irreversibility of the reaction. Studying the reversibility of this reaction therefore requires a major change in paradigm. We have shown that the reactivation results from the combined effects of the release of O2 and its four-electron four-proton reduction to water (Figure 6), consistent with recent evidence for O2 reduction by synthetic analogues of the H-cluster.37
According to our calculations, no high energy intermediate is formed en-route to water formation. By contrast, the formation of hydrogen peroxide requires an endothermic ET/PT step and is therefore unlikely. The two-electron, two-proton reduced state (4 in Figure 5) can readily interconvert to produce harmful OH radicals, which could be responsible for H-cluster degradation as observed previously,16,22 or to hydroxylate the neighbouring cysteine residue, consistent with recent crystallographic evidence.22 Since this residue is involved in proton transfer from the active site,38,39 its oxidation alone should be enough to make the enzyme inactive. That irreversible damage follows the two-electron/two-proton reduction of O2 is consistent with the observation that enzyme lyophilization (which suppresses the source of protons) protects from O2.40
We conclude that the resistance of FeFe hydrogenases to O2 is largely dependent upon the availability of the electrons that are required for completely reducing the attacking O2 to water. This reaction also allows certain NiFe hydrogenases to resist O2;3,4,41,42 O2 reduction by NiFe hydrogenases uses electrons produced upon H2 oxidation and requires the presence of a peculiar FeS cluster that is near the NiFe active site. Considering FeFe hydrogenases, the four electrons required cannot be produced at the H-cluster after O2 binding and must originate externally. When the enzyme is adsorbed onto an electrode, as occurs in our experiments and in many situations where one seeks to use hydrogenases as a supported catalyst, the electrode functions as an electron reservoir. However, “electron poor” conditions have been used in XAS and X-ray crystallography investigations of the structure of the degradation products,16,22 with the enzyme in the oxidized state and no H2 or any electron donor (although we note that X-rays can sometimes reduce inorganic active sites52). If the O2 reduction cycle that we described cannot proceed due to a lack of electrons, the O2 adduct 2 may oxidize either the aminoacids around the active site, or the H-cluster of other proteins in solution (in an intermolecular reaction). Differences in proton/electron availability may account for some of the variability as to the nature of the degradation products described in the literature,16,22 when FeFe hydrogenases are exposed to O2.
The present investigation shows that side chain fluctuations, availability of electrons and protons, and the presence of ionizable protein residues in the active site pocket all contribute to defining the O2 sensitivity of FeFe hydrogenase. Our combined experimental and computational study revealed key residues that are likely to control the access of O2 to the active site. We also identified the two electron-two proton reduced state as a critical branching point for the formation of water vs reactive oxygen species. These findings provide clues for increasing the O2 resistance of the enzyme by protein engineering, as required in the context of biological H2 photoproduction.12
Methods
Biochemistry and molecular biology
The methods for the purification of the two WT enzymes have all been fully described previously.43 The production and electrochemical characterization of the C169D, F290W and V296F mutants is described in SI.
Electrochemistry
All potentials are quotted with respect to SHE. The method for measuring ki, ka and k3 has been fully described in ref 13. In short, the method consists in performing anaerobic experiments (voltammetry and chronoamperometry) to determine all the parameters that define the anaerobic inhibition of the enzyme under oxidizing conditions,43 then recording the response of the enzyme to repeated exposure to O2 while monitoring the O2 concentration, and fitting a model based on eq. 1 to these data, adjusting only the values of ki, ka and k3, all other parameters being fixed to their independently determined values. For determining the isotope effects, the pD was measured with a glass electrode using the correction pD = 0.4 + pH meter reading.53 With hydrogenase on the electrode, the open circuit potential in experiments carried out at pH 7 under one atm. of H2 was within 10 mV of the value at pD 7 under 1 atm. of D2. The electrochemical data were analyzed using the new home-made, open source program QSoas, which can be downloaded from our web site www.qsoas.org, and installed on Windows, Mac OSX and Linux computers.
Molecular dynamics
We have used the Gromacs software package44 to run atomistic molecular dynamics (MD) simulations of Cp hydrogenase (PDB 3C8Y9) in explicit water. Simulations were run using an optimized force field for both protein45 and water,46 and a published set of parameters for the inorganic clusters,47 and in presence of 50 O2 molecules (see further details in SI section 2). We have analyzed the simulation trajectories to construct a Markov state model, using the same methodology as described before.28 Using this approach the dynamics of the gas molecules as they diffuse within the protein is described by a rate matrix K, containing rate coefficients kji corresponding to transitions between pairs of microstates i and j. These microstates are defined from pockets within the protein frequently populated by the O2 molecules. In our extensive equilibrium MD runs, the gas molecules did not sufficiently sample transitions corresponding to the binding to the geminate site (G). We hence combined the equilibrium rate matrix with rate constants for the i →G process obtained from pulling simulations from multiple initial states. The rate coefficients kGi at zero force were derived from a kinetic theory for force induced transitions.48 From the rate matrix we can obtain the binding (k+1) and dissociation (k−1) rate constants as described before.27 We use the Berezhkovskii-Hummer-Szabo method49 to estimate fluxes from the solvent to the geminate site and obtain the two pathways from which the H-cluster can be accessed.
Quantum chemical calculations
Calculations were performed with the model system (see Figure S6) extracted from the crystal structure of the Cp protein (Hox state) and consist of a small diiron subsite linked to the iron-sulfur cubane [Fe4S4]. Anchoring cysteine residues as well as the proximal cysteine, important in the reaction studied here, were replaced with methenethiols and their carbon atom coordinates were fixed to the crystal positions. In order to compensate a high negative charge of the active site (−3) we included three protonated CH3NH3+ molecules at the positions occupied by the lysine residues in the crystal structure. All molecules considered in this study have lowest possible spin state (singlet or doublet) except dioxygen and OOH+ which have a triplet ground state. Single point energy calculations were performed with B3LYP+D3 functional and the COSMO solvation model to obtain more accurate energy changes and to account for the charge screening by the protein matrix, respectively. For the latter we used a typical dielectric constant of 4, while ε = 78 was used for water. The def2-TZVP basis set was used throughout the study. We note that the selected methodology (moderate amount of the Hartree-Fock exchange in the density functional, large basis set on the sulfur and oxygen atoms as well as a pairwise correction for the dispersion interactions) gives also an accurate description of the isomerisation reactions involving sulfoxy-genated species.50 Further details of the calculations, validation of the density functional against high-level ab initio calculations and references relevant to this section can be found in SI section 4. XYZ coordinates of all molecular structures discussed are given in SI section 6.
Supplementary Material
Acknowledgments
The French teams were supported by CNRS, INSA, CEA, Agence Nationale de la Recherche (ANR-12-BS08-0014, ANR-14-CE05-0010) and the A*MIDEX grant (ANR-11-IDEX-0001-02) funded by the French Government “Investissements d’Avenir” program. The authors thank Robert van Lis for constructing the V296F and F290W mutants. D.D.S. acknowledges support from the EPSRC Grant EP/J016764/1 and an Ikerbasque Research Fellowship. A.K. was supported by the EPSRC Grant EP/J015571/1. R.B.B. was supported by the Intramural Research Program of the National Institute of Diabetes and Digestive and Kidney Diseases of the National Institutes of Health. J.B. thanks the Royal Society for a University Research Fellowship. This work was carried out on the HECToR and Archer computing facilities (Edinburgh), access to which was granted through the Materials Chemistry Consortium (EPSRC Grants EP/F067496 and EP/L000202). The authors acknowledge the use of the UCL Legion High Performance Computing Facility (Legion@UCL) and associated support services in the completion of this work. D.D.S. acknowledges PRACE for awarding us access to resource FERMI based in Italy at CINECA. D.D.S. acknowledges Attila Szabo and Edina Rosta for helpful discussions.
References
- 1.Lubitz W, Ogata H, Rüdiger O, Reijerse E. Chem Rev. 2014;114:4081–4148. doi: 10.1021/cr4005814. [DOI] [PubMed] [Google Scholar]
- 2.Caputo CA, Gross MA, Lau VW, Cavazza C, Lotsch BV, Reisner E. Angew Chem Int Edit. 2014;53:11538–11542. doi: 10.1002/anie.201406811. [DOI] [PMC free article] [PubMed] [Google Scholar]
- 3.Fritsch J, Scheerer P, Frielingsdorf S, Kroschinsky S, Friedrich B, Lenz O, Spahn CM. Nature. 2011;479:249–252. doi: 10.1038/nature10505. [DOI] [PubMed] [Google Scholar]
- 4.Volbeda A, Darnault C, Parkin A, Sargent F, Armstrong FA, Fontecilla-Camps JC. Structure. 2013;21:184–190. doi: 10.1016/j.str.2012.11.010. [DOI] [PubMed] [Google Scholar]
- 5.Hamdan AA, Liebgott P-P, Fourmond V, Gutiérrez-Sanz O, De Lacey AL, Infossi P, Rousset M, Dementin S, Léger C. Proc Nat Acad Sc USA. 2012;109:19916–19921. doi: 10.1073/pnas.1212258109. [DOI] [PMC free article] [PubMed] [Google Scholar]
- 6.Plumeré N, Rüdiger O, Oughli AAA, Williams R, Vivekananthan J, Pöller S, Schuhmann W, Lubitz W. Nat Chem. 2014;6:822–827. doi: 10.1038/nchem.2022. [DOI] [PubMed] [Google Scholar]
- 7.Fourmond V, Stapf S, Li H, Buesen D, Birrell J, Rüdiger O, Lubitz W, Schuhmann W, Plumeré N, Léger C. J Am Chem Soc. 2015;137:5494–5505. doi: 10.1021/jacs.5b01194. [DOI] [PubMed] [Google Scholar]
- 8.Fourmond V, Baffert C, Sybirna K, Dementin S, Abou-Hamdan A, Meynial-Salles I, Soucaille P, Bottin H, Léger C. Chem Comm. 2013;49:6840–6842. doi: 10.1039/c3cc43297a. [DOI] [PubMed] [Google Scholar]
- 9.Pandey AS, Harris TV, Giles LJ, Peters JW, Szilagyi RK. J Am Chem Soc. 2008;130:4533–4540. doi: 10.1021/ja711187e. [DOI] [PubMed] [Google Scholar]
- 10.Berggren G, Adamska A, Lambertz C, Simmons TR, Esselborn J, Atta M, Gambarelli S, Mouesca J-MM, Reijerse E, Lubitz W, Happe T, Artero V, Fontecave M. Nature. 2013;499:66–69. doi: 10.1038/nature12239. [DOI] [PMC free article] [PubMed] [Google Scholar]
- 11.Mulder DW, Boyd ES, Sarma R, Lange RK, Endrizzi JA, Broderick JB, Peters JW. Nature. 2010;465:248–251. doi: 10.1038/nature08993. [DOI] [PubMed] [Google Scholar]
- 12.Ghirardi ML. Photosynthesis research. 2015;125:383–393. doi: 10.1007/s11120-015-0158-1. [DOI] [PubMed] [Google Scholar]
- 13.Orain C, Saujet L, Gauquelin C, Soucaille P, Meynial-Salles I, Baffert C, Fourmond V, Bottin H, Léger C. Journal of the American Chemical Society. 2015;137:12580–12587. doi: 10.1021/jacs.5b06934. [DOI] [PubMed] [Google Scholar]
- 14.Cohen J, Kim K, King P, Seibert M, Schulten K. Structure. 2005;13:1321–1329. doi: 10.1016/j.str.2005.05.013. [DOI] [PubMed] [Google Scholar]
- 15.Baffert C, Demuez M, Cournac L, Burlat B, Guigliarelli B, Soucaille P, Bertrand P, Girbal L, Léger C. Angew Chem Int Edit. 2008;47:2052–2055. doi: 10.1002/anie.200704313. [DOI] [PubMed] [Google Scholar]
- 16.Stripp ST, Goldet G, Brandmayr C, Sanganas O, Vincent KA, Haumann M, Armstrong FA, Happe T. Proc Nat Acad Sc USA. 2009;106:17331–17336. doi: 10.1073/pnas.0905343106. [DOI] [PMC free article] [PubMed] [Google Scholar]
- 17.Kubas A, Sancho DD, Best R, Blumberger J. Angew Chem Int Ed. 2014;53:4081–4084. doi: 10.1002/anie.201400534. [DOI] [PMC free article] [PubMed] [Google Scholar]
- 18.Lambertz C, Leidel N, Havelius KGV, Noth J, Chernev P, Winkler M, Happe T, Haumann M. J Biol Chem. 2011;286:40614–40623. doi: 10.1074/jbc.M111.283648. [DOI] [PMC free article] [PubMed] [Google Scholar]
- 19.Bruska MK, Stiebritz MT, Reiher M. J Am Chem Soc. 2011;133:20588–20603. doi: 10.1021/ja209165r. [DOI] [PMC free article] [PubMed] [Google Scholar]
- 20.Finkelmann AR, Stiebritz MT, Reiher M. Inorg Chem. 2014;53:11890–11902. doi: 10.1021/ic501049z. [DOI] [PubMed] [Google Scholar]
- 21.Hong G, Pachter R. ACS Chem Biol. 2012;7:1268–1275. doi: 10.1021/cb3001149. [DOI] [PubMed] [Google Scholar]
- 22.Swanson KD, Ratzloff MW, Mulder DW, Artz JH, Ghose S, Hoffman A, White S, Zadvornyy OA, Broderick JB, Bothner B, King PW, Peters JW. J Am Chem Soc. 2015;137:1809–1816. doi: 10.1021/ja510169s. [DOI] [PubMed] [Google Scholar]
- 23.Greco C, Fourmond V, Baffert C, Wang P-h, Dementin S, Bertrand P, Bruschi M, Blumberger J, de Gioia L, Leger C. Energy & Environ Sci. 2014;7:3543–3573. [Google Scholar]
- 24.Liebgott P-P, et al. Nat Chem Biol. 2010;6:63–70. doi: 10.1038/nchembio.276. [DOI] [PubMed] [Google Scholar]
- 25.Wang P-h, Blumberger J. Proc Natl Acad Sci USA. 2012;109:6399–6404. doi: 10.1073/pnas.1121176109. [DOI] [PMC free article] [PubMed] [Google Scholar]
- 26.Pandey AS, Harris TV, Giles LJ, Peters JW, Szilagyi RK. J Am Chem Soc. 2008;130:4533–4540. doi: 10.1021/ja711187e. [DOI] [PubMed] [Google Scholar]
- 27.Wang P-h, Best RB, Blumberger J. J Am Chem Soc. 2011;133:3548–3556. doi: 10.1021/ja109712q. [DOI] [PubMed] [Google Scholar]
- 28.De Sancho D, Kubas A, Wang P-H, Blumberger J, Best RB. J Chem Theory Comput. 2015;11:1919–1927. doi: 10.1021/ct5011455. [DOI] [PMC free article] [PubMed] [Google Scholar]
- 29.Baffert C, Bertini L, Lautier T, Greco C, Sybirna K, Ezanno P, Etienne E, Soucaille P, Bertrand P, Bottin H, Meynial-Salles I, De Gioia L, Léger C. J Am Chem Soc. 2011;133:2096–2099. doi: 10.1021/ja110627b. [DOI] [PubMed] [Google Scholar]
- 30.Cornish AJ, Gärtner K, Yang H, Peters JW, Hegg EL. J Biol Chem. 2011;286:38341–7. doi: 10.1074/jbc.M111.254664. [DOI] [PMC free article] [PubMed] [Google Scholar]
- 31.Knörzer P, Silakov A, Foster CE, Armstrong FA, Lubitz W, Happe T. J Biol Chem. 2012;287:1489–99. doi: 10.1074/jbc.M111.305797. [DOI] [PMC free article] [PubMed] [Google Scholar]
- 32.Hong G, Cornish AJ, Hegg EL, Pachter R. Biochim Biophys Acta. 2011;1807:510–7. doi: 10.1016/j.bbabio.2011.01.011. [DOI] [PubMed] [Google Scholar]
- 33.Long H, King PW, Chang CH. J Phys Chem B. 2014;118:890–900. doi: 10.1021/jp408621r. [DOI] [PubMed] [Google Scholar]
- 34.Morra S, Giraudo A, Di Nardo G, King PW, Gilardi G, Valetti F. PloS one. 2012;7:e48400. doi: 10.1371/journal.pone.0048400. [DOI] [PMC free article] [PubMed] [Google Scholar]
- 35.Morra S, Maurelli S, Chiesa M, Mulder DW, Ratzloff MW, Giamello E, King PW, Gilardi G, Valetti F. Biochim Biophys Acta. 2016;1857:98–106. doi: 10.1016/j.bbabio.2015.10.005. [DOI] [PubMed] [Google Scholar]
- 36.Goldet G, Brandmayr C, Stripp ST, Happe T, Cavazza C, Fontecilla-Camps JC, Armstrong FA. J Am Chem Soc. 2009;131:14979–14989. doi: 10.1021/ja905388j. [DOI] [PubMed] [Google Scholar]
- 37.Dey S, Rana A, Crouthers D, Mondal B, Das PKK, Darensbourg MY, Dey A. J Am Chem Soc. 2014;136:8847–8850. doi: 10.1021/ja5021684. [DOI] [PubMed] [Google Scholar]
- 38.Mulder DW, Ratzloff MW, Bruschi M, Greco C, Koonce E, Peters JW, King PW. J Am Chem Soc. 2014;136:15394–15402. doi: 10.1021/ja508629m. [DOI] [PubMed] [Google Scholar]
- 39.Ginovska-Pangovska B, Ho M-H, Linehan JC, Cheng Y, Dupuis M, Raugei S, Shaw WJ. Biochim Biophys Acta. 2014;1837:131–138. doi: 10.1016/j.bbabio.2013.08.004. [DOI] [PubMed] [Google Scholar]
- 40.Noth J, Kositzki R, Klein K, Winkler M, Haumann M, Happe T. Scientific reports. 2015;5 doi: 10.1038/srep13978. [DOI] [PMC free article] [PubMed] [Google Scholar]
- 41.Pandelia M-EE, Bykov D, Izsak R, Infossi P, Giudici-Orticoni M-TT, Bill E, Neese F, Lubitz W. Proc Nat Acad Sc USA. 2013;110:483–488. doi: 10.1073/pnas.1202575110. [DOI] [PMC free article] [PubMed] [Google Scholar]
- 42.Wulff P, Day CC, Sargent F, Armstrong FA. Proc Nat Acad Sc USA. 2014;111:6606–6611. doi: 10.1073/pnas.1322393111. [DOI] [PMC free article] [PubMed] [Google Scholar]
- 43.Fourmond V, Greco C, Sybirna K, Baffert C, Wang P-HH, Ezanno P, Montefiori M, Bruschi M, Meynial-Salles I, Soucaille P, Blumberger J, Bottin H, De Gioia L, Léger C. Nat Chem. 2014;6:336–342. doi: 10.1038/nchem.1892. [DOI] [PubMed] [Google Scholar]
- 44.Pronk S, Páll S, Schulz R, Larsson P, Bjelkmar P, Apostolov R, Shirts MR, Smith JC, Kasson PM, van der Spoel D, Hess B, Lindahl E. Bioinformatics. 2013;29:845–854. doi: 10.1093/bioinformatics/btt055. [DOI] [PMC free article] [PubMed] [Google Scholar]
- 45.Best RB, Mittal J. J Phys Chem B. 2010;114:14916–14923. doi: 10.1021/jp108618d. [DOI] [PubMed] [Google Scholar]
- 46.Abascal JLF, Vega C. J Chem Phys. 2005;123:234505–234512. doi: 10.1063/1.2121687. [DOI] [PubMed] [Google Scholar]
- 47.Chang CH, Kim K. J Chem Theory Comput. 2009;5:1137–1145. doi: 10.1021/ct800342w. [DOI] [PubMed] [Google Scholar]
- 48.Dudko OK, Hummer G, Szabo A. Phys Rev Lett. 2006;96:108101–108104. doi: 10.1103/PhysRevLett.96.108101. [DOI] [PubMed] [Google Scholar]
- 49.Berezhkovskii A, Hummer G, Szabo A. J Chem Phys. 2009;130:205102–205105. doi: 10.1063/1.3139063. [DOI] [PMC free article] [PubMed] [Google Scholar]
- 50.Liu C, Liu T, Hall MB. J Chem Theory Comput. 2015;11:205–214. doi: 10.1021/ct500594z. [DOI] [PubMed] [Google Scholar]
Associated Data
This section collects any data citations, data availability statements, or supplementary materials included in this article.