

Summary
Human bone marrow stromal cells, or mesenchymal stem cells (BM-MSCs), need expansion prior to use as cell-based therapies in immunological and tissue repair applications. Aging and expansion of BM-MSCs induce epigenetic changes that can impact therapeutic outcomes. By applying sequencing-based methods, we reveal that the breadth of DNA methylation dynamics associated with aging and expansion is greater than previously reported. Methylation changes are enriched at known distal transcription factor binding sites such as enhancer elements, instead of CpG-rich regions, and are associated with changes in gene expression. From this, we constructed hypo- and hypermethylation-specific regulatory networks, including a sub-network of BM-MSC master regulators and their predicted target genes, and identified putatively disrupted signaling pathways. Our genome-wide analyses provide a broader overview of age- and expansion-induced DNA methylation changes and a better understanding of the extent to which these changes alter gene expression and functionality of human BM-MSCs.
Keywords: epigenetics, DNA methylation, enhancer elements, stem cell biology, bone marrow MSCs, aging
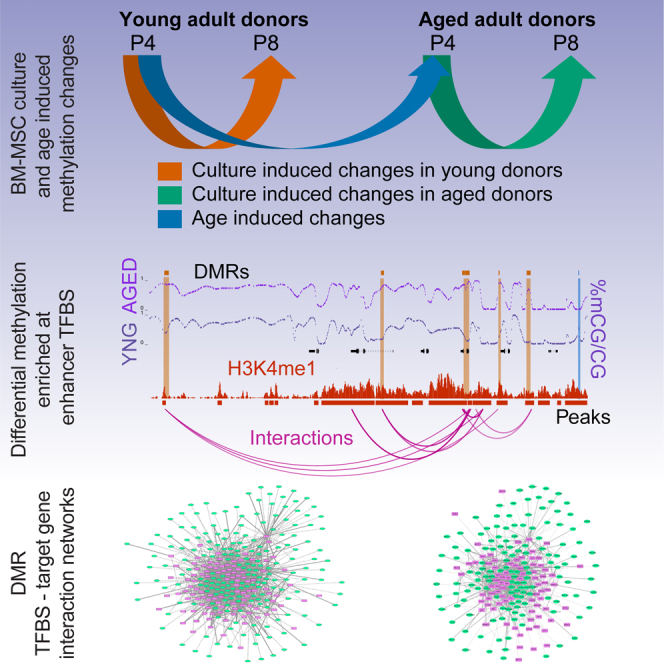
Graphical Abstract
Highlights
-
•
Global DNA methylome analysis for human bone marrow mesenchymal stromal cells
-
•
Young versus aged adult donors compared at early and late passages
-
•
Differential methylation is enriched at distal transcription factor binding sites
-
•
These TFBSs are frequently found within BM-MSC enhancers indicated by H3K4me1
Bone marrow MSCs are of great therapeutic interest. Hawkins and colleagues show that sequencing-based approaches to study differential DNA methylation induced by donor age or cell passage reveal more extensive changes than previous array-based studies. These changes are enriched at known transcription factor binding sites within BM-MSC enhancer elements and can be associated with changes in gene expression.
Introduction
Mesenchymal stem cells (MSCs), including bone marrow (BM) stromal cells, are of great therapeutic interest due to their diverse regenerative and immunomodulatory properties (Phinney and Prockop, 2007). Successful MSC therapy requires in vitro expansion and the proliferative capacity and lifespan of MSCs vary across donors (Wagner et al., 2010a). The variation in cell divisions before entering the senescent stage (Hayflick limit) may be a result of occasional transient clonal aneuploidies, telomeric shortening, and changes in epigenomic profiles (Bentivegna et al., 2013). Molecular profiling has shed light on the role of epigenetic factors including DNA methylation and microRNAs in cellular senescence of MSCs (Bork et al., 2010, Koch et al., 2012, Koch et al., 2013, Schellenberg et al., 2011). Hypermethylation due to the long-term expansion of cells in culture, at genes related to MSC senescence, DNA replication, cell-cycle and adipogenic differentiation was reported previously (Choi et al., 2012). Senescence-associated DNA methylation changes are enriched in intergenic and non-promoter regions (Koch et al., 2013).
Previous studies in BM-MSCs made significant advancements in determining DNA methylation changes induced by age and expansion of cells in culture using array-based technologies, but are largely biased toward promoters or CpG-rich regions and with limited CpG representation. Methylation changes at functional elements, such as distal transcription factor binding sites (TFBSs), DNase I hypersensitive sites (DHSs), and enhancer elements, therefore, remain largely unexplored. Moreover, DNA methylation changes specifically at BM-MSC enhancers have not been reported. Studies using high-resolution genome-wide technologies reported that significant methylation changes occur outside of transcription start sites (TSSs) and are predominantly at introns, enhancers, DHSs, and regions with lower CpG densities (Hon et al., 2013, Lister et al., 2009, Stadler et al., 2011). Broadening our view of the DNA methylation landscape in BM-MSCs will reveal additional changes with age and expansion in culture that impact our understanding of cellular aging and ultimately how these cells are maintained and characterized prior to therapeutic use.
Using enhanced reduced representation bisulfite sequencing (ERRBS), we performed a global DNA methylation profiling across CpG-rich regions along with regions having variable CpG densities and distal regulatory elements from human BM-MSCs from young and aged adults at early and late passages. To further corroborate our findings we performed whole genome bisulfite sequencing (WGBS) on a limited number of BM-MSC donors from young and aged adults at early passage. These high-resolution genome-wide maps in BM-MSCs confirm that distal regulatory elements are highly variable in age-related methylation changes. Through the integration of DNA methylation dynamics with functional elements including enhancers, TFBSs and DHSs we gained a more complete understanding of the influence of DNA methylation on gene expression changes during culture expansion (referred to as “culture-induced”) and biological aging (referred to as “age-induced”).
Results
High-Resolution Global Methylation Analysis of Age- and Culture-Induced Changes
We performed ERRBS to obtain single nucleotide resolution methylation data (Akalin et al., 2012). The methylation status of CpGs from young and aged donors were compared at an early passage (p4) to determine age-associated changes, and culture-induced changes were determined by profiling young and aged donors at passage 4 (p4) and passage 8 (p8) (Figure 1A). Since we have previously generated gene expression data for these samples (Kilpinen et al., 2013), we further focused on the integrative analysis of DNA methylation, gene expression, and additional epigenomic data identifying regulatory elements.
Figure 1.

Schematic Representation of Datasets and Methylation Status in MSCs
(A) BM-MSCs from multiple donors were grouped into three subsets to evaluate culture-induced changes and biological aging: p4_vs_p8_aged indicates the comparison of early and late passage groups of MSCs from aged donors (green). p4_vs_p8_yng indicates the comparison of early and late passage group of MSCs from young donors (orange). p4_yng_vs_aged indicates the comparison of differences between young and aged adult donors at early passages (blue). These colors are used throughout.
(B) Heatmaps of top 20% most differentially methylated CpGs in each dataset showing each donor and passage.
(C) Number of CpGs captured in each dataset as: invariant (yellow), hyper- (red), and hypomethylated (blue). The proportion of invariant CpGs and variant CpGs (DMCs) are different across the three comparisons and statistically significant.
(D) The proportions of hyper- and hypomethylated CpGs of each datasets. The proportion of hyper and hypo DMCs significantly vary across the three comparisons. The p values are computed using Fisher's exact test. See also Figure S1.
We identified invariant and differentially methylated CpGs (DMCs) between passage- and age-grouped donors (Figures 1B and S1). DMCs were further classified into hyper- and hypomethylated. The majority of CpGs were invariant (Figure 1C). For culture-induced methylation drift, cells from aged donors showed the highest degree of methylation changes (12.6% of CpGs analyzed) with equal proportions of hypo- and hypermethylation (Figures 1C and 1D). Young donors showed minimal changes in methylation (only 5.6% of CpGs analyzed), with the majority of the CpGs exhibiting hypomethylation. In biological aging cells from aged donors gained methylation relative to young donors.
Methylation Changes at Genic Elements
Previous MSC studies reporting methylation changes largely focused on promoter regions. Bork et al. (2010) identified 84 DMCs in long-term culture and 644 promoter DMCs during aging, assessing 27,000 CpGs. Another study identified 64,142 DMCs during aging, with 70.8% being hypomethylated (Fernández et al., 2014). We overlapped mapped CpGs and DMCs with various genic elements including promoters, first exons, remaining other exons, introns, 5′ and 3′ UTRs. The gain of methylation in promoters and first exons are usually inversely correlated with gene expression (Brenet et al., 2011). For each comparison, we sampled at least 47% of all promoters and 39% of all first exons (Figure 2A; Table S1). Most CpGs at these elements are not differentially methylated, and, therefore, may not account for the majority of changes in gene expression (Figure 2B; Table S1). The dominant methylation changes are found at introns, other exons, and 3′ UTRs when measuring the percentage of DMCs relative to mapped CpGs at these elements (Figure 2B), and this was used to eliminate the bias toward larger representation of genic elements in the genome. Of total DMCs identified in each comparative dataset, 37%–38% are present at intronic elements (Table S1). This may implicate regulatory elements embedded within these elements. A larger number of CpGs were differentially methylated in the aged donors during culture and biological aging, while there were minimal changes in young donors across genic elements (Figure 2B; Table S1). This trend continues when assessing other elements (see below), and suggests that the methylomes of young donors are more refractory to culture-induced changes.
Figure 2.

Distribution of Differential Methylation across Genic and CpG Annotation Elements
Bar plot indicates the percent of (A) genic elements or (C) CpG annotation elements mapped to total elements present in the genome in the three datasets. Bubble plot indicates the differential methylation enrichment as percent of DMCs to mapped CpGs overlapping genic elements (B) or CpG annotation elements (D). See also Figure S2, and Tables S1, S2, and S3.
Methylation Changes Are Inversely Proportional to CpG Density
CpG density is highest at CpG islands (CGIs) and decreases moving outward from CGIs to shores, shelves, and then open seas (intergenic regions). As expected, we have more mapped CpGs at CGI covering 68.5%–71.9% of total CGIs, followed by 34%–41% of total shores and 11%–18% of total shelves in each comparison (Figure 2C). Although differential methylation was observable at all CGI-related elements, the percentage of DMCs to CpGs mapped was highest in shelves (11.73%–18.12%) followed by shores (6%–14.16%) and least in CGIs (1.71%–6.69%). Similar observations were reported previously in other cell types (Irizarry et al., 2009, Sandoval et al., 2011). The differential methylation at open seas was at least twice that of CGIs (Figure 2D). We observed that CpGs proximal to TSSs, such as at promoters, first exons and 5′ UTRs are relatively invariant across comparisons, as opposed to CpGs at introns, 3′ UTRs and especially open seas (Figures 2B, 2D, and S2). While CGIs are highly represented relative to distal regions in ERRBS, the shelves and open seas contain a higher proportion of DMCs. This suggests that distal regulatory elements may be more susceptible to culture- and age-associated methylation changes. The enrichment of DMCs at various annotations (Figure 2) are statistically significant as opposed to expected by chance (p < 0.001; see Table S3 for individual p values). Differential methylation across CGIs, shores, and shelves once again indicated that a larger number of CpGs were altered in aged donors during culture or biological aging compared with young donors (Figures 2B and 2D; Table S2).
DNA Methylation Dynamics at Known TFBSs
DNA methylation at TFBSs can determine the binding of TFs at their sequence motifs, i.e., DNA methylation is either occlusive or facilitative for the binding of TFs (Blattler and Farnham, 2013), which in turn might affect gene expression. To investigate the overlap with TFBSs, we collected TFBS data from ENCODE only for TFs that are expressed in human BM-MSCs (ENCODE Project Consortium et al., 2012). Because these TFBSs are derived from different cell types, each site may not be bound in BM-MSCs due to differences in chromatin structure; however, this analysis aids in distinguishing DMCs with a potential to affect gene expression. TFBSs were conspicuous at regions harboring differential methylation. Among the culture-induced comparisons, 41% of hypermethylated DMCs from aged donors and 47% from young donors overlapped TFBSs. Age-induced hyper- and hypomethylation changes overlap TFBSs in equal proportions (Figure 3A). Among DMCs overlapping TFBSs, ∼34%–35% are within enhancers.
Figure 3.

Identifying Differentially Methylated TFBSs
(A) Percentage of DMCs overlapping TFBSs.
(B and C) Heatmaps of -log10 of Fisher's exact p values for TFs with significant hypermethylation (B) or hypomethylation (C).
(D) Distribution of DMCs that overlap TFBSs at promoters, introns, and intergenic regions. See also Table S4.
Lastly, we asked which TFs are enriched at DMCs to gain insight on the potential disruption of regulatory networks. The overlap between DMCs and TFBSs was utilized to calculate statistical significance in the overlap with differential methylation (Figures 3B and 3C). We identified a list of 15,500–77,490 TFBSs that overlap DMCs for culture- and age-induced methylation changes (Figures 3B and 3C; Table S4). These included TFBSs for SIRT6, SMC3, SMARCB1, CHD1, FOSL1, SMARCC2, E2F6, and others that were exclusively hypermethylated in aged donors during culturing (p4_vs_p8_aged); TFBSs for SMARCC1, STAT5, ZNF274, NFE2, JUNB, and others were hypermethylated uniquely during biological aging (p4_young_vs_aged); TFBSs for ZNF143, HSF1, MEF2C, and others were hypermethylated during biological aging and reinforced in aged samples during culture (Figure 3B; Table S4). Among the hypomethylated sites, TFBSs for NR3C1, RCOR1, SP1, ARID3A, and others were hypomethylated in aged donors during culture, and sites belonging to REST and ZBTB33 were hypomethylated during biological aging (Figure 3C; Table S4). Even though we were not able to identify hypermethylated TFBSs specific to young donors, TFBSs for STAT3 and MAFF were hypomethylated specifically during cell culture.
Many of the TFBSs differentially methylated in various comparisons play a role in chromatin structure: SMARCs, SIN3A, EP300, SIRT6, ZBTB33, REST, and SUZ12; or 3D genome architecture: CTCF, RAD21, and SMC3, members of the cohesin complex. These factors suggest that additional means of epigenetic misregulation are at play in the impairment of BM-MSC function during culture and biological aging. Other TFs control key capabilities of MSCs that make them of therapeutic interest. STAT2, which is hypermethylated during biological aging, and also during cell culture in aged donors, is required for the suppression of T cells (Yi et al., 2012). The putatively disrupted binding of STAT2 is likely illustrative of how DNA methylation contributes to the diminishing functionality of BM-MSCs. Hypomethylation at REST and ZBTB33 sites during culturing of aged donor cells may eventually result in aberrant expression of epigenetically repressed genes. ZBTB33 is known to be a DNA methylation-dependent transcriptional repressor that recruits the CoREST chromatin repressive complex (Prokhortchouk et al., 2001). Overall, the enrichment of DMCs at distal TFBSs relative to promoter binding sites (Figure 3D) indicates that previous studies that were focused on promoter or CGI methylation analysis largely underestimated the contribution of distal regulatory elements, and that a whole-genome analysis is needed for a complete understanding of age-associated DNA methylation changes and its impact on gene expression.
Culture-Induced Changes Irrespective of Age
To determine the influence of culture on BM-MSCs, we grouped samples from young and aged donors into early and late passages. We observed that culture-induced methylation changes, irrespective of age, are relatively minimal across any genomic location; however, 14,482 culture-induced DMCs are shared across age groups accounting for half of the 28,013 culture-induced changes among young donors, and one-fifth of the 79,796 DMCs observed in aged donors (Table S5). This indicates that a majority of methylation changes are specific to either young donors or aged donors, with a subset specific to long-term culture irrespective of adult donor age. Collectively, these results provide the most comprehensive assessment of culture-induced DNA methylation changes. These additional sites may serve as biomarkers of epigenetic drift in both a universal and age-specific manner.
WGBSs in Young and Aged Donors
We employed WGBSs in four donors to facilitate the discovery of methylation changes at all potential regulatory elements. A genome-wide overview indicated that there are substantial differences between aged and young donor samples (Figure 4A). We identified 983,831 hypermethylated CpGs and 976,633 hypomethylated CpGs with age across the genome (Figure 4B). The distribution of hyper- and hypomethylated DMCs was similar across various genomic annotations (Figure 4C). We determined if DMCs directly overlapped regulatory elements by assessing ENCODE TFBSs for factors expressed in BM-MSCs. We found that 226,974 DMCs directly overlap TFBSs (p < 0.001). Given that this is a limited set of binding sites, we also included 1,968,675 ENCODE DHSs from human cell types as putative binding sites in BM-MSCs. We reasoned that (1) although these DHSs were not mapped in BM-MSCs, previous studies showed substantial overlap across cell types (Thurman et al., 2012); and (2) the loss of methylation at a known DHSs might create a binding opportunity that could alter gene expression. We found that 401,646 DMCs directly overlap DHSs (p < 0.001). To ensure that some TFBSs and DHSs from ENCODE data are likely active binding sites in BM-MSCs, we also overlapped these sites with BM-MSC H3K4me1 enhancer peaks. A recent study using 450,000 methylation arrays found that age-associated hypomethylation often occurred at H3K4me1-marked enhancers from 10 non-MSC cell types (Fernández et al., 2014). We utilized enhancer data generated previously from human BM-MSCs (Roadmap Epigenomics Consortium et al., 2015), representing the first assessment of DNA methylation dynamics at BM-MSC enhancers. WGBS data revealed that H3K4me1-marked BM-MSC enhancers harbor 230,619 DMCs. Of these, 67,779 were directly overlapping known binding sites (TFBSs from chromatin immunoprecipitation sequencing or DHSs). Figure 4D illustrates that DMCs at either TFBSs or DHSs are more enriched at enhancers than other regulatory elements (p < 0.001), further illustrating the point that distal regulatory elements are a critical aspect of age-associated changes in gene expression, and far more extensive than previously reported.
Figure 4.

Whole-Genome Methylation Profiles for Biological Aging
(A) Correlation plot showing the methylation differences among the aged and young donors. Correlation was assessed after merging data from two donors per group.
(B) Representative chromosomal ideograms of hyper- (red) and hypomethylation (blue) DMCs on chromosomes 5, 11, and 17.
(C) Distribution of differential methylation at various genomic annotations.
(D) Differential methylation was assessed at binding sites for TFs expressed in MSCs and at DHSs. Pie charts display the distribution of differential methylation at genomic elements that also overlap TFBSs and DHSs.
Identification of Age-Associated Differentially Methylated Regions
We identified clusters of DMCs called differentially methylated regions (DMRs). DMRs provide evidence of more sweeping changes within a region. In total, we identified 7,378 DMRs of which 3,809 DMRs are hypermethylated and 3,569 DMRs are hypomethylated (Figure 5A). CpG density at DMRs range from 3 to 132 and their widths span from 5 to 2,894 bp (Figure 5B). The majority of DMRs overlap introns and intergenic regions (Figure 5C). We observed that DMRs overlapping promoters, first exons, other exons, CGIs, DHSs, enhancers, and TFBSs are more likely to be hypermethylated except for CpG shelves, which are largely hypomethylated (Figure 5D). We found 78% and 57% of DMRs are significantly enriched (p < 0.0001) with DHSs and enhancers, respectively. Of all DMRs overlapping enhancers, 66% are hyper DMRs. The gain of methylation at these elements is likely to decrease expression of the target genes. While active enhancers generally exhibit hypomethylation, the further loss of DNA methylation with age may result in additional TF binding and increased expression of target genes. Finding fewer DMRs at enhancers compared with DMCs is likely due to enhancers containing very few CpGs (Hon et al., 2013). DMRs occurring outside of regulatory elements may be occurring due to the lack of any regulatory constraint that would otherwise prevent the spreading of the methylation pattern over time.
Figure 5.

DMR Analysis
(A) Heatmaps showing the difference in CpG methylation values at hyper and hypo DMRs in aged relative to young donors.
(B) Violin plots representing the width of DMRs.
(C) Distribution of hyper and hypo DMRs across genomic annotations.
(D) Violin plot showing the distribution of methylation status of DMRs across the genomic annotations.
(E) Browser shot of HOXA gene cluster illustrating percent methylation levels, H3K4me1-marked enhancers and peaks, DMRs at enhancer elements within gene clusters, and their putative interactions with target genes.
(F) Heatmap showing the differential gene expression values for HOXA, HOXB, HOXC, and FADS genes downregulated with age. See also Figure S3 and Table S6.
DMRs occurring at enhancers are often near genes that exhibit an expected corresponding change in gene expression. We have included putative enhancer DMR-gene interactions to further guide which DMR is directly regulating gene expression. These interaction data were obtained from Sheffield et al. (2013), which are based on the correlation of DHS signal intensity with gene expression across numerous cell types. For example, we found the HOXA and HOXB gene clusters to contain several hyper DMRs overlapping enhancers (Figures 5E and S3; Table S6). Our gene expression data revealed the altered expression of HOX genes correlating with observed methylation changes. We found lower expression of HOXA3, HOXA5, HOXA6, HOXB2-B5, HOXB7, and HOXC4 in aged donors compared with young donors (Figure 5F). HOX gene expression and its adaptation in cell and tissue transplantation may play a role concerning regenerative potential (Leucht et al., 2008). In addition, we showed previously that the fatty acid desaturases FADS1 and FADS2 were downregulated in aged donors, and are important contributors to BM-MSC lipidomic regulation (Kilpinen et al., 2013). This gene cluster also contains DMRs overlapping regional enhancers (Figure S3), indicative of how these genes are likely downregulated via epigenetic repression with age and results in an age-related decline in membrane integrity.
Association of Differential Methylation and Differential Gene Expression
We asked if hyper- or hypomethylation can be associated with differential gene expression previously reported in these samples (Kilpinen et al., 2013). Using the WGBS data for biological aging and ERRBS data for culture-induced comparisons, we identified corresponding changes in gene expression. Among the three comparisons, cells from aged donors (in both culture-induced changes and biological aging) demonstrated a higher number of genes with decreased gene expression levels, whereas cells from younger donors have more genes with increased expression levels. We noticed only a minimal number of differentially methylated promoters showed an inverse relationship with differentially expressed genes (DEGs), 9.41% and 2.87% in culture-induced changes from aged and young donors, respectively, and 5.41% with DMRs and 23.08% with DMCs in biological aging based on WGBS data. A similar trend was observed for an inverse relationship for first exons, 6.79% and 1.72% for culture-induced changes, and 3.4% and 6.9%, respectively, for ERRBS and WGBS age-associated changes. These associations are in line with previous observations where all gene expression was not always inversely correlated with differential methylation (Wagner et al., 2014). Altogether, differential methylation at promoters and first exons explains only a small fraction of culture- or age-induced gene expression changes (Figures 6A–6C). Most of these DEGs are BM-MSCs specific and unique to culture expansion and biological aging (Figure S4). We confirmed this with previously published gene expression data from BM-MSCs (Roson-Burgo et al., 2014) and a well-known stem cell gene list (Müller et al., 2008). Next, we determined if changes in methylation around CpG annotation elements are related to the changes in the nearest neighboring gene (NNG) expression. When increased methylation occurred at CGIs, shores, and shelves, genes associated with them have decreased expression. Overall, the association of methylation changes with gene expression was higher with CGI-related elements of the genome (4.6%–16.7% for CpG islands, 6.9%–10.6% for CpG shores, and 1.15%–4.7% for CpG shelves) than with promoters and first exons (Figures 6A–6C).
Figure 6.

Gene Expression Inverse Correlation with Methylation Data
(A) Number of differentially expressed genes with an inverse corresponding age-associated DNA methylation change at nearest neighboring elements. DMCs and DMRs from WGBS (p4_yng_vs_aged) are shown. Exons are only first exons.
(B) Number of differentially expressed genes with an inverse corresponding DNA methylation changes at nearest neighboring elements from ERRBS data for culture-induced DMCs. Exons are only first exons.
(C) Percentage of gene expression anti-correlated with the differentially methylated genomic elements.
(D) Circos plots providing a genome-wide (left) and chr19 (right) view of expression and epigenomic modifications. From inside to out: (1) orange and blue bars for up- and downregulated genes with age; (2) green stacked dots for DHSs (higher stack = more dense); (3) red stacked dots for H3K4me1 peaks; (4) stacked dots for TFBSs with each color being a different TF; (5) lighter purple bars with height as average CpG methylation percentage over 500 kb, and 10 kb windows for whole genome and chromosome 19, respectively, for aged donors; (6) darker purple bars showing same type of data as previous track for young donors; (7) DMRs (hyper in red; hypo in blue); (8) chromosome(s). See also Figure S4.
Lastly, we determined if DMCs at TFBSs modulate gene expression for each comparison. DMCs at TFBSs exhibit high variability in terms of methylation changes relative to discrete genomic elements. For example, there is only ∼1% of hypermethylated CpGs at intronic TFBSs and more than 31% of hypermethylated CpGs at intergenic TFBSs (Figure 3D). We observed similar overlapping patterns with hypomethylated CpGs at introns and intergenic regions (Figure 3D). Previous studies showed that TFBSs (DHSs and chromatin-marked enhancers) within introns of transcribed genes are largely unmethylated, suggesting an inverse correlation with expression (Blattler et al., 2014, Stergachis et al., 2013). We determined if an inverse correlation existed with differentially methylated TFBSs and NNGs. Among DEGs, 8.69% are associated in an inverse manner with DMRs and 53.7% with DMCs identified from WGBS for biological aging. For culture-induced changes, 12.64%–28.04% of genes could be associated with methylation dynamics at neighboring TFBSs (Figure 6).
Transcriptional Regulatory Networks in MSCs
Similar to the ERRBS analysis, we identified TFBSs significantly overlapping with either hyper- or hypomethylated CpGs from WGBS data. Although the majority of TFBSs exhibit both hypo- and hypermethylated CpGs, a few TFs are uniquely enriched for either of them (Figure 7A; Table S7). For instance, CTCF, SUZ12, EP300, MYC, MAX, SRF, and others are enriched for both conditions, while SP1, FOS, FOSL1, and RXRA are uniquely hypermethylated, and PBX3, MAFK, RUNX3, and YY1 are uniquely hypomethylated. These results provide insight on regulatory networks that are disrupted due to age-associated methylation changes.
Figure 7.

Identification of Enriched TFs, Networks, and Pathways
(A) Heatmaps of TFs significantly enriched with DMCs at their binding sites shown as -log10(adjusted p values) for hyper and hypo conditions.
(B and C) The in silico transcriptional regulatory network. (B) Hyper network: the TFs (represented in magenta color) are enriched with hypermethylated CpGs and genes are repressed DEGs (represented in green color). See Figure S5 for the hypo network. (C) The sub-network of significant MSC master regulators (hypermethylated) and their repressed DEGs. Solid lines denote direct target of TFs and dotted lines denote indirect targets.
(D) Gene ontology terms enriched for sub-network.
(E) Heatmap of overrepresented pathways. The numbers indicate the number of TFs and/or DEGs involved in the pathway.
(F) The significantly enriched WNT and JAK-STAT signaling pathways from the hyper and hypo networks, respectively. The TFs and/or DEGs involved in these pathways are highlighted in red. See also Figures S5 and S6, and Table S7.
To better understand the gene-regulatory effect of TFBSs significantly enriched for DMCs, we constructed in silico transcriptional networks of TFs and their putative interactions with DEGs. We identified DEGs with promoters overlapping hyper- and hypomethylated TFBSs, and we termed these DEGs as direct targets of TFs. Next, we found the NNG for all distal TFBSs and termed these DEGs as indirect targets. We included only down- and upregulated DEGs for hyper- and hypomethylated TFBSs as targets, respectively. In this manner, we constructed two networks: (1) TFs with hypermethylated CpGs and downregulated DEGs (hyper network); and (2) TFs with hypomethylated CpGs and upregulated DEGs (hypo network) (Figures 7B and S5).
The hyper network includes 287 nodes (89 TFs and 198 DEGs) and 1,307 interactions (262 direct and 1,045 indirect connections), while the hypo network includes 223 nodes (82 TFs and 141 DEGs) and 926 interactions (250 direct and 676 indirect connections). Both networks followed a power law degree distribution, a typical property of regulatory networks. We found that 80% (1,045/1,307 hyper network) and 73% (676/926 hypo network) of interactions were indirect regulation of methylated TFBSs. To further strengthen this observation, we computed these indirect (or distal) interactions for the top 100 DEGs (based on fold change) and found 68.4% (182/266) and 53.3% (104/195) were distal regulatory connections in the hyper and hypo networks, respectively. Thus, the DNA methylation changes observed at distal TFBSs are likely key contributors to altered gene expression.
A recent assessment of gene expression and network analysis of human BM-MSCs and placental MSCs identified a set of MSC master TFs (Roson-Burgo et al., 2014). We extracted a sub-network with these master TFs from the hyper network to find age-associated MSC regulators. This sub-network comprised MYC, MAX, SP1, EGR1, NFYA, and NFYB (Figure 7C), and exhibited 24,878 TFBSs putatively disrupted due to gain of DNA methylation, and 25,584 binding sites potentially gained through hypomethylation.
These master TFs play key roles in the regulation of many critical features of MSCs as cellular therapeutics. MYC is associated with cell proliferation, differentiation, and cell-cycle processes in MSCs (Bhandari et al., 2011). SP1 is known to modulate adipose lineage differentiation in human MSCs (Ruiz de Eguino et al., 2012). NFYA regulates the transcription of the HOX4 genes by activating numerous pathways related to maintenance and proliferation (Zhu et al., 2005). Gene ontology analysis on the MSC master regulators sub-network identified biological terms related to lipid and fatty acid metabolism (Figure 7D). Previously, we showed that phospholipid and fatty acid profiles change with age and culturing, and were key to the associated decline of human BM-MSC cell membrane and immunomodulatory function (Kilpinen et al., 2013). Age-associated DNA methylation changes at TFBSs for these factors provide new regulatory insights on the declining function of BM-MSCs with age.
Identification of Enriched Pathways
Several enriched pathways were identified in both hyper and hypo networks, including osteoclast differentiation, cell-cycle, tumor necrosis factor (TNF), and MAPK signaling pathways (Figure 7E). WNT and ErbB signaling pathways were specific to the hyper network, while JAK-STAT signaling pathway was specific to the hypo network (Figures 7E and 7F). We also identified affected pathways for culture-induced methylation changes from ERRBS data (Figure S6). Transcriptional misregulation in osteoclast differentiation and TNF signaling were enriched in young and aged donors. WNT, MAPK, transforming growth factor β and adipocytokine signaling pathways, and cell-cycle signaling were unique to culture-induced changes in aged donors. There is no single pathway explicitly enriched in culture-induced changes of young donors, which may be reflective of fewer systematic culture-induced changes in young donors.
The enriched pathways are involved in aging of various stem cells, which may extend to MSCs. The decline of WNT signaling due to aging is associated with decreased neural progenitor cell function (L’Episcopo et al., 2014), and with decline in intestinal stem cell regenerative capacity (Nalapareddy et al., 2017). The JAK-STAT signaling has a known role in aging of other tissues, such as a crucial role in impairment of muscle regeneration in satellite cells during aging (Price et al., 2014, Tierney et al., 2014). Collectively, the misregulation of these pathways and others shown in Figure 7E can be explained, in part, through DNA methylation dynamics, and by in large, through changes that occur at distal regulatory elements.
Discussion
Prior to clinical studies MSCs undergo in vitro expansion. During expansion, MSCs gradually lose proliferative capacity and secretive properties (Kilpinen et al., 2013, Wagner et al., 2010b), resulting in limited clinical successes (Kim and Cho, 2015). We attempted to narrow the gaps in our understanding of the epigenetic regulation of induced changes due to age and expansion in culture by broadening our view of the extent to which DNA methylation is involved. Global DNA methylation profiles in BM-MSCs from young and aged adult donors identified age-specific differences following cell expansion. Young donors followed a general trend of hypomethylation and overall demonstrated less variation. Pathway analysis revealed that aged donor cells in culture are specifically enriched for “hyper pathways,” based on hypermethylated TFBSs and associated downregulated genes that include mismatch repair and cell-cycle pathways. These pathways were not enriched in the young donors. Young donors lacked any age-specific pathway enrichment following expansion, meaning any enriched pathways were not unique to young donors. This may explain the refractory nature of younger donor BM-MSCs to replicative senescence in culture. Shifts in age-related and culture-induced methylation changes have important implications on the extent to which donor BM-MSCs should be expanded.
Our genome-wide assessment of methylation changes (WGBS) revealed that age-associated changes are 30 times more extensive than recent array-based studies in BM-MSCs, which identified just over 64,000 DMCs (Fernández et al., 2014). Although WGBS data were generated on limited donors, they provide a first glimpse of DNA methylation changes associated with age on a genome-wide scale. Such epigenomic alterations often influence gene expression and ultimately cellular properties. We found that DNA methylation was more dynamic at distal regulatory elements and accounted for a large increase in the inverse correlation for corresponding changes in gene expression. This included TFBSs for known MSC master regulators (Roson-Burgo et al., 2014). DNA methylation changes occurring at known TFBSs were most abundant at BM-MSC H3K4me1-marked enhancers, which has not been examined previously. Differential methylation was also frequent at TFBSs for factors involved in the regulation of chromatin structure and 3D genome architecture. One key chromatin modifier was SIRT6, a histone deacetylase with a known role in aging and lifespan (Kanfi et al., 2012). Differential methylation at TFBSs are likely to result in relocalization of these transcription factors and chromatin remodelers in either an occlusive or facilitative manner, and have an impact on chromatin and 3D structures, which are known to be involved in replicative senescence (Hänzelmann et al., 2015).
Induced DNA methylation drift from expansion in culture and aging is bimodal as it involves hyper- and hypomethylation events. Recent studies of DNA methylation changes with age found that DNA methylation profiles become more divergent with age (Boks et al., 2009, Heyn et al., 2012, McClay et al., 2014). BM-MSC differential methylation was three times more prevalent between aged donors than between young donors in our ERRBS data; however, age- and culture-induced changes are not entirely stochastic as demonstrated by the concordance between donors and identification of significantly different DMCs and DMRs across groups. Hyper- and hypomethylation events at regulatory elements are likely impacting gene expression and cellular function. When these events occur elsewhere in the genome, the impact is less clear, but may not be innocuous. For example, it is feasible that hypo DMRs may lead to increased mutational load through the inability to repair point mutations by the lack of a hemi-methylated strand during replication and repair, or through chromosomal instability, which has been associated with DNA demethylation (Rodriguez et al., 2006). On caveat of our study, and others like it, is that bisulfite conversion does not distinguish between 5mC and 5hmC (hydroxymethylation). A recent study found approximately 1,600 age-associated 5hmC changes in BM-MSCs (Toraño et al., 2016). The 5hmC state has not shown to be repressive, and it is likely not to impact TF binding.
A recent study showed that age-associated DNA methylation changes can be reset by reprogramming BM-MSCs followed by redifferentiation to the MSC state, and thereby rejuvenating the MSCs (Frobel et al., 2014). This study was conducted using array-based methods, but future genome-wide assessment of DNA methylation in rejuvenated MSCs should help identify DMCs at regulatory elements that are drivers of age-association BM-MSC decline relative to passenger methylation events. By generating regulatory network and pathway analyses based on more comprehensive epigenomic and TFBS datasets, we provide a better understanding of how the DNA methylome changes with age and alters gene expression and known functionality of human BM-MSCs.
Experimental Procedures
See Supplemental Experimental Procedures for additional details.
Isolation and Cell Culture of BM-MSCs
Human BM-MSCs from five aged (from 62 to 82 years of age, mean 74.6 years) and five young adult donors (from 20 to 24, mean 22.2 years) were isolated and cultured as described previously following institutional ethical guidelines (Kilpinen et al., 2013, Leskelä et al., 2003, Peura et al., 2009).
ERRBS and WGBS Library Preparation
For ERRBS, DNA (10 ng) was digested with MspI (Thermo Fisher Scientific, catalog no. FD0544) and subjected to bisulfite conversion and Illumina library preparation.
ERRBS and WGBS Data Analysis
Sequencing data were processed to remove adapter matching bases, and poor quality reads or reads with less than 20 bp. Processed reads were mapped to lambda genome and hg19 version of the human genome using Bismark/Bowtie. Bisulfite conversion was assessed using the coverage and methylation status of CpGs mapped on lambda genome. Further methylation calling of CpGs was performed with Bismark (Krueger and Andrews, 2011). Additional methylation analysis involving normalization, overlaps with DHSs, H3K4me1, and ENCODE TFBS data were performed using R/Bioconductor packages.
DMRs Identification
CpG methylation values were smoothed using the BSmooth algorithm (bsseq Bioconductor package) with default parameters and then DMRs were identified (Hansen et al., 2012). We defined a cutoff for the t-statistics (−2.6, +2.6) and further filtered DMRs containing at least three CpGs and showing a mean methylation difference between aged and young donors greater than ±0.25 (25%).
Significant TFBS Identification
TFBS data were downloaded from ENCODE. Peaks from control experiments were filtered. Data from multiple experiments were reduced to represent a single list of binding sites per TF. TFs not expressed in BM-MSCs were removed, retaining only BM-MSC-expressed TFs for further analyses. DMCs were overlapped with the TFBSs to identify the disrupted TFBS. We used the Fisher's exact test to identify the TFBSs significantly enriched with DMCs. The significant TFBSs are filtered with p values <0.05. The p values are adjusted for multiple hypothesis correction using Benjamini-Hochberg method prior to filtering.
Author Contributions
K.K.P. performed the methylome experiments, processed and analyzed the sequencing data, and conducted the integrative analysis. N.D.J. contributed to the integrative analysis and DMR analysis and performed the network and pathway analyses. C.A. and S.L.B. contributed to analysis. P.L., L.K., M.K., and S.L. provided the MSCs used in this project. L.K., S.L., and R.L. conceived and designed the MSC study selection. K.K.P., N.D.J., L.K., R.L., S.L., and R.D.H. contributed to data interpretation. K.K.P., N.D.J., L.K., R.L., S.L., and R.D.H. wrote and edited the manuscript.
Acknowledgments
This project was supported in part by funding from the Academy of Finland (259913), Biocenter Finland, the NIH, the Washington Life Sciences Discovery Fund (265508), and the SalWe Research Program for IMO (Tekes - the Finnish Funding Agency for Technology and Innovation grant 648/10). We acknowledge the Finnish Functional Genomics Center core facility for sequencing services.
Published: August 24, 2017
Footnotes
Supplemental Information includes Supplemental Experimental Procedures, six figures, and seven tables and can be found with this article online at http://dx.doi.org/10.1016/j.stemcr.2017.07.018.
Accession Numbers
The raw sequencing data reported in this paper are available from Sequence Read Archive (SRA) using the SRA accession number SRP111740.
Supplemental Information
References
- Akalin A., Garrett-Bakelman F.E., Kormaksson M., Busuttil J., Zhang L., Khrebtukova I., Milne T.A., Huang Y., Biswas D., Hess J.L. Base-pair resolution DNA methylation sequencing reveals profoundly divergent epigenetic landscapes in acute myeloid leukemia. PLoS Genet. 2012;8:e1002781. doi: 10.1371/journal.pgen.1002781. [DOI] [PMC free article] [PubMed] [Google Scholar]
- Bentivegna A., Miloso M., Riva G., Foudah D., Butta V., Dalprà L., Tredici G. DNA methylation changes during in vitro propagation of human mesenchymal stem cells: implications for their genomic stability? Stem Cells Int. 2013;2013:e192425. doi: 10.1155/2013/192425. [DOI] [PMC free article] [PubMed] [Google Scholar]
- Bhandari D.R., Seo K.-W., Jung J.-W., Kim H.-S., Yang S.-R., Kang K.-S. The regulatory role of c-MYC on HDAC2 and PcG expression in human multipotent stem cells. J. Cell. Mol. Med. 2011;15:1603–1614. doi: 10.1111/j.1582-4934.2010.01144.x. [DOI] [PMC free article] [PubMed] [Google Scholar]
- Blattler A., Farnham P.J. Crosstalk between site-specific transcription factors and DNA methylation states. J. Biol. Chem. 2013;288:34287–34294. doi: 10.1074/jbc.R113.512517. [DOI] [PMC free article] [PubMed] [Google Scholar]
- Blattler A., Yao L., Witt H., Guo Y., Nicolet C.M., Berman B.P., Farnham P.J. Global loss of DNA methylation uncovers intronic enhancers in genes showing expression changes. Genome Biol. 2014;15:469. doi: 10.1186/s13059-014-0469-0. [DOI] [PMC free article] [PubMed] [Google Scholar]
- Boks M.P., Derks E.M., Weisenberger D.J., Strengman E., Janson E., Sommer I.E., Kahn R.S., Ophoff R.A. The relationship of DNA methylation with age, gender and genotype in twins and healthy controls. PLoS One. 2009;4:e6767. doi: 10.1371/journal.pone.0006767. [DOI] [PMC free article] [PubMed] [Google Scholar]
- Bork S., Pfister S., Witt H., Horn P., Korn B., Ho A.D., Wagner W. DNA methylation pattern changes upon long-term culture and aging of human mesenchymal stromal cells. Aging Cell. 2010;9:54–63. doi: 10.1111/j.1474-9726.2009.00535.x. [DOI] [PMC free article] [PubMed] [Google Scholar]
- Brenet F., Moh M., Funk P., Feierstein E., Viale A.J., Socci N.D., Scandura J.M. DNA methylation of the first exon is tightly linked to transcriptional silencing. PLoS One. 2011;6:e14524. doi: 10.1371/journal.pone.0014524. [DOI] [PMC free article] [PubMed] [Google Scholar]
- Choi M.R., In Y.-H., Park J., Park T., Jung K.H., Chai J.C., Chung M.K., Lee Y.S., Chai Y.G. Genome-scale DNA methylation pattern profiling of human bone marrow mesenchymal stem cells in long-term culture. Exp. Mol. Med. 2012;44:503–512. doi: 10.3858/emm.2012.44.8.057. [DOI] [PMC free article] [PubMed] [Google Scholar]
- ENCODE Project Consortium. Bernstein B.E., Birney E., Dunham I., Green E.D., Gunter C., Snyder M. An integrated encyclopedia of DNA elements in the human genome. Nature. 2012;489:57–74. doi: 10.1038/nature11247. [DOI] [PMC free article] [PubMed] [Google Scholar]
- Fernández A.F., Bayón G.F., Urdinguio R.G., Toraño E.G., García M.G., Carella A., Petrus-Reurer S., Ferrero C., Martinez-Camblor P., Cubillo I. H3K4me1 marks DNA regions hypomethylated during aging in human stem and differentiated cells. Genome Res. 2014;25:27–40. doi: 10.1101/gr.169011.113. [DOI] [PMC free article] [PubMed] [Google Scholar]
- Frobel J., Hemeda H., Lenz M., Abagnale G., Joussen S., Denecke B., Sarić T., Zenke M., Wagner W. Epigenetic rejuvenation of mesenchymal stromal cells derived from induced pluripotent stem cells. Stem Cell Reports. 2014;3:414–422. doi: 10.1016/j.stemcr.2014.07.003. [DOI] [PMC free article] [PubMed] [Google Scholar]
- Hansen K., Langmead B., Irizarry R. BSmooth: from whole genome bisulfite sequencing reads to differentially methylated regions. Genome Biol. 2012;13:R83. doi: 10.1186/gb-2012-13-10-r83. [DOI] [PMC free article] [PubMed] [Google Scholar]
- Hänzelmann S., Beier F., Gusmao E.G., Koch C.M., Hummel S., Charapitsa I., Joussen S., Benes V., Brümmendorf T.H., Reid G. Replicative senescence is associated with nuclear reorganization and with DNA methylation at specific transcription factor binding sites. Clin. Epigenetics. 2015;7:19. doi: 10.1186/s13148-015-0057-5. [DOI] [PMC free article] [PubMed] [Google Scholar]
- Heyn H., Li N., Ferreira H.J., Moran S., Pisano D.G., Gomez A., Diez J., Sanchez-Mut J.V., Setien F., Carmona F.J. Distinct DNA methylomes of newborns and centenarians. Proc. Natl. Acad. Sci. USA. 2012;109:10522–10527. doi: 10.1073/pnas.1120658109. [DOI] [PMC free article] [PubMed] [Google Scholar]
- Hon G.C., Rajagopal N., Shen Y., McCleary D.F., Yue F., Dang M.D., Ren B. Epigenetic memory at embryonic enhancers identified in DNA methylation maps from adult mouse tissues. Nat. Genet. 2013;45:1198–1206. doi: 10.1038/ng.2746. [DOI] [PMC free article] [PubMed] [Google Scholar]
- Irizarry R.A., Ladd-Acosta C., Wen B., Wu Z., Montano C., Onyango P., Cui H., Gabo K., Rongione M., Webster M. The human colon cancer methylome shows similar hypo- and hypermethylation at conserved tissue-specific CpG island shores. Nat. Genet. 2009;41:178–186. doi: 10.1038/ng.298. [DOI] [PMC free article] [PubMed] [Google Scholar]
- Kanfi Y., Naiman S., Amir G., Peshti V., Zinman G., Nahum L., Bar-Joseph Z., Cohen H.Y. The sirtuin SIRT6 regulates lifespan in male mice. Nature. 2012;483:218–221. doi: 10.1038/nature10815. [DOI] [PubMed] [Google Scholar]
- Kilpinen L., Tigistu-Sahle F., Oja S., Greco D., Parmar A., Saavalainen P., Nikkilä J., Korhonen M., Lehenkari P., Käkelä R. Aging bone marrow mesenchymal stromal cells have altered membrane glycerophospholipid composition and functionality. J. Lipid Res. 2013;54:622–635. doi: 10.1194/jlr.M030650. [DOI] [PMC free article] [PubMed] [Google Scholar]
- Kim N., Cho S.-G. New strategies for overcoming limitations of mesenchymal stem cell-based immune modulation. Int. J. Stem Cells. 2015;8:54–68. doi: 10.15283/ijsc.2015.8.1.54. [DOI] [PMC free article] [PubMed] [Google Scholar]
- Koch C.M., Joussen S., Schellenberg A., Lin Q., Zenke M., Wagner W. Monitoring of cellular senescence by DNA-methylation at specific CpG sites. Aging Cell. 2012;11:366–369. doi: 10.1111/j.1474-9726.2011.00784.x. [DOI] [PubMed] [Google Scholar]
- Koch C.M., Reck K., Shao K., Lin Q., Joussen S., Ziegler P., Walenda G., Drescher W., Opalka B., May T. Pluripotent stem cells escape from senescence-associated DNA methylation changes. Genome Res. 2013;23:248–259. doi: 10.1101/gr.141945.112. [DOI] [PMC free article] [PubMed] [Google Scholar]
- Krueger F., Andrews S.R. Bismark: a flexible aligner and methylation caller for Bisulfite-Seq applications. Bioinformatics. 2011;27:1571–1572. doi: 10.1093/bioinformatics/btr167. [DOI] [PMC free article] [PubMed] [Google Scholar]
- L’Episcopo F., Tirolo C., Caniglia S., Testa N., Morale M.C., Serapide M.F., Pluchino S., Marchetti B. Targeting Wnt signaling at the neuroimmune interface for dopaminergic neuroprotection/repair in Parkinson’s disease. J. Mol. Cell Biol. 2014;6:13–26. doi: 10.1093/jmcb/mjt053. [DOI] [PMC free article] [PubMed] [Google Scholar]
- Leskelä H.-V., Risteli J., Niskanen S., Koivunen J., Ivaska K.K., Lehenkari P. Osteoblast recruitment from stem cells does not decrease by age at late adulthood. Biochem. Biophys. Res. Commun. 2003;311:1008–1013. doi: 10.1016/j.bbrc.2003.10.095. [DOI] [PubMed] [Google Scholar]
- Leucht P., Kim J.-B., Amasha R., James A.W., Girod S., Helms J.A. Embryonic origin and Hox status determine progenitor cell fate during adult bone regeneration. Development. 2008;135:2845–2854. doi: 10.1242/dev.023788. [DOI] [PubMed] [Google Scholar]
- Lister R., Pelizzola M., Dowen R.H., Hawkins R.D., Hon G., Tonti-Filippini J., Nery J.R., Lee L., Ye Z., Ngo Q.-M. Human DNA methylomes at base resolution show widespread epigenomic differences. Nature. 2009;462:315–322. doi: 10.1038/nature08514. [DOI] [PMC free article] [PubMed] [Google Scholar]
- McClay J.L., Aberg K.A., Clark S.L., Nerella S., Kumar G., Xie L.Y., Hudson A.D., Harada A., Hultman C.M., Magnusson P.K.E. A methylome-wide study of aging using massively parallel sequencing of the methyl-CpG-enriched genomic fraction from blood in over 700 subjects. Hum. Mol. Genet. 2014;23:1175–1185. doi: 10.1093/hmg/ddt511. [DOI] [PMC free article] [PubMed] [Google Scholar]
- Müller F.-J., Laurent L.C., Kostka D., Ulitsky I., Williams R., Lu C., Park I.-H., Rao M.S., Shamir R., Schwartz P.H. Regulatory networks define phenotypic classes of human stem cell lines. Nature. 2008;455:401–405. doi: 10.1038/nature07213. [DOI] [PMC free article] [PubMed] [Google Scholar]
- Nalapareddy K., Nattamai K.J., Kumar R.S., Karns R., Wikenheiser-Brokamp K.A., Sampson L.L., Mahe M.M., Sundaram N., Yacyshyn M.-B., Yacyshyn B. Canonical Wnt signaling ameliorates aging of intestinal stem cells. Cell Rep. 2017;18:2608–2621. doi: 10.1016/j.celrep.2017.02.056. [DOI] [PMC free article] [PubMed] [Google Scholar]
- Peura M., Bizik J., Salmenperä P., Noro A., Korhonen M., Pätilä T., Vento A., Vaheri A., Alitalo R., Vuola J. Bone marrow mesenchymal stem cells undergo nemosis and induce keratinocyte wound healing utilizing the HGF/c-Met/PI3K pathway. Wound Repair Regen. 2009;17:569–577. doi: 10.1111/j.1524-475X.2009.00507.x. [DOI] [PubMed] [Google Scholar]
- Phinney D.G., Prockop D.J. Concise review: mesenchymal stem/multipotent stromal cells: the state of transdifferentiation and modes of tissue repair—current views. Stem Cells. 2007;25:2896–2902. doi: 10.1634/stemcells.2007-0637. [DOI] [PubMed] [Google Scholar]
- Price F.D., von Maltzahn J., Bentzinger C.F., Dumont N.A., Yin H., Chang N.C., Wilson D.H., Frenette J., Rudnicki M.A. Inhibition of JAK-STAT signaling stimulates adult satellite cell function. Nat. Med. 2014;20:1174–1181. doi: 10.1038/nm.3655. [DOI] [PMC free article] [PubMed] [Google Scholar]
- Prokhortchouk A., Hendrich B., Jørgensen H., Ruzov A., Wilm M., Georgiev G., Bird A., Prokhortchouk E. The p120 catenin partner Kaiso is a DNA methylation-dependent transcriptional repressor. Genes Dev. 2001;15:1613–1618. doi: 10.1101/gad.198501. [DOI] [PMC free article] [PubMed] [Google Scholar]
- Roadmap Epigenomics Consortium. Kundaje A., Meuleman W., Ernst J., Bilenky M., Yen A., Heravi-Moussavi A., Kheradpour P., Zhang Z., Wang J. Integrative analysis of 111 reference human epigenomes. Nature. 2015;518:317–330. doi: 10.1038/nature14248. [DOI] [PMC free article] [PubMed] [Google Scholar]
- Rodriguez J., Frigola J., Vendrell E., Risques R.-A., Fraga M.F., Morales C., Moreno V., Esteller M., Capellà G., Ribas M. Chromosomal instability correlates with genome-wide DNA demethylation in human primary colorectal cancers. Cancer Res. 2006;66:8462–9468. doi: 10.1158/0008-5472.CAN-06-0293. [DOI] [PubMed] [Google Scholar]
- Roson-Burgo B., Sanchez-Guijo F., Del Cañizo C., De Las Rivas J. Transcriptomic portrait of human mesenchymal stromal/stem cells isolated from bone marrow and placenta. BMC Genomics. 2014;15:910. doi: 10.1186/1471-2164-15-910. [DOI] [PMC free article] [PubMed] [Google Scholar]
- Ruiz de Eguino G., Infante A., Schlangen K., Aransay A.M., Fullaondo A., Soriano M., García-Verdugo J.M., Martín A.G., Rodríguez C.I. Sp1 transcription factor interaction with accumulated prelamin a impairs adipose lineage differentiation in human mesenchymal stem cells: essential role of sp1 in the integrity of lipid vesicles. Stem Cells Transl. Med. 2012;1:309–321. doi: 10.5966/sctm.2011-0010. [DOI] [PMC free article] [PubMed] [Google Scholar]
- Sandoval J., Heyn H., Moran S., Serra-Musach J., Pujana M.A., Bibikova M., Esteller M. Validation of a DNA methylation microarray for 450,000 CpG sites in the human genome. Epigenetics. 2011;6:692–702. doi: 10.4161/epi.6.6.16196. [DOI] [PubMed] [Google Scholar]
- Schellenberg A., Lin Q., Schüler H., Koch C.M., Joussen S., Denecke B., Walenda G., Pallua N., Suschek C.V., Zenke M. Replicative senescence of mesenchymal stem cells causes DNA-methylation changes which correlate with repressive histone marks. Aging. 2011;3:873–888. doi: 10.18632/aging.100391. [DOI] [PMC free article] [PubMed] [Google Scholar]
- Sheffield N.C., Thurman R.E., Song L., Safi A., Stamatoyannopoulos J.A., Lenhard B., Crawford G.E., Furey T.S. Patterns of regulatory activity across diverse human cell types predict tissue identity, transcription factor binding, and long-range interactions. Genome Res. 2013;23:777–788. doi: 10.1101/gr.152140.112. [DOI] [PMC free article] [PubMed] [Google Scholar]
- Stadler M.B., Murr R., Burger L., Ivanek R., Lienert F., Schöler A., van Nimwegen E., Wirbelauer C., Oakeley E.J., Gaidatzis D. DNA-binding factors shape the mouse methylome at distal regulatory regions. Nature. 2011;480:490–495. doi: 10.1038/nature10716. [DOI] [PubMed] [Google Scholar]
- Stergachis A.B., Haugen E., Shafer A., Fu W., Vernot B., Reynolds A., Raubitschek A., Ziegler S., LeProust E.M., Akey J.M. Exonic transcription factor binding directs codon choice and affects protein evolution. Science. 2013;342:1367–1372. doi: 10.1126/science.1243490. [DOI] [PMC free article] [PubMed] [Google Scholar]
- Thurman R.E., Rynes E., Humbert R., Vierstra J., Maurano M.T., Haugen E., Sheffield N.C., Stergachis A.B., Wang H., Vernot B. The accessible chromatin landscape of the human genome. Nature. 2012;489:75–82. doi: 10.1038/nature11232. [DOI] [PMC free article] [PubMed] [Google Scholar]
- Tierney M.T., Aydogdu T., Sala D., Malecova B., Gatto S., Puri P.L., Latella L., Sacco A. STAT3 signaling controls satellite cell expansion and skeletal muscle repair. Nat. Med. 2014;20:1182–1186. doi: 10.1038/nm.3656. [DOI] [PMC free article] [PubMed] [Google Scholar]
- Toraño E.G., Bayón G.F., Del Real Á., Sierra M.I., García M.G., Carella A., Belmonte T., Urdinguio R.G., Cubillo I., García-Castro J. Age-associated hydroxymethylation in human bone-marrow mesenchymal stem cells. J. Transl. Med. 2016;14:207. doi: 10.1186/s12967-016-0966-x. [DOI] [PMC free article] [PubMed] [Google Scholar]
- Wagner J.R., Busche S., Ge B., Kwan T., Pastinen T., Blanchette M. The relationship between DNA methylation, genetic and expression inter-individual variation in untransformed human fibroblasts. Genome Biol. 2014;15:R37. doi: 10.1186/gb-2014-15-2-r37. [DOI] [PMC free article] [PubMed] [Google Scholar]
- Wagner W., Ho A.D., Zenke M. Different facets of aging in human mesenchymal stem cells. Tissue Eng. Part B Rev. 2010;16:445–453. doi: 10.1089/ten.TEB.2009.0825. [DOI] [PubMed] [Google Scholar]
- Wagner W., Bork S., Lepperdinger G., Joussen S., Ma N., Strunk D., Koch C. How to track cellular aging of mesenchymal stromal cells? Aging. 2010;2:224–230. doi: 10.18632/aging.100136. [DOI] [PMC free article] [PubMed] [Google Scholar]
- Yi T., Lee D.-S., Jeon M.-S., Kwon S.W., Song S.U. Gene expression profile reveals that STAT2 is involved in the immunosuppressive function of human bone marrow-derived mesenchymal stem cells. Gene. 2012;497:131–139. doi: 10.1016/j.gene.2012.01.073. [DOI] [PubMed] [Google Scholar]
- Zhu J., Zhang Y., Joe G.J., Pompetti R., Emerson S.G. NF-Ya activates multiple hematopoietic stem cell (HSC) regulatory genes and promotes HSC self-renewal. Proc. Natl. Acad. Sci. USA. 2005;102:11728–11733. doi: 10.1073/pnas.0503405102. [DOI] [PMC free article] [PubMed] [Google Scholar]
Associated Data
This section collects any data citations, data availability statements, or supplementary materials included in this article.