

Abstract
BACKGROUND
Subcutaneous adipose tissue (SAT) and visceral adipose tissue (VAT) are associated with adverse cardiometabolic risk profiles.
OBJECTIVES
This study explored the degree to which changes in abdominal fat quantity and quality are associated with changes in cardiovascular disease (CVD) risk factors.
METHODS
Study participants (n = 1,106; 44.1% women; mean baseline age 45.1 years) were drawn from the Framingham Heart Study Third Generation cohort who participated in the computed tomography (CT) substudy Exams 1 and 2. Participants were followed for 6.1 years on average. Abdominal adipose tissue volume in cm3 and attenuation in Hounsfield units (HU) were determined by CT-acquired abdominal scans.
RESULTS
The mean fat volume change was an increase of 602 cm3 for SAT and an increase of 703 cm3 for VAT; the mean fat attenuation change was a decrease of 5.5HU for SAT and an increase of 0.07 HU for VAT. An increase in fat volume and decrease in fat attenuation were associated with adverse changes in CVD risk factors. An additional 500 cm3 increase in fat volume was associated with incident hypertension (odds ratio [OR]: 1.21 for SAT; OR: 1.30 for VAT), hypertriglyceridemia (OR: 1.15 for SAT; OR: 1.56 for VAT), and metabolic syndrome (OR: 1.43 for SAT; OR: 1.82 for VAT; all p < 0.05). Similar trends were observed for each additional 5 HU decrease in abdominal adipose tissue attenuation. Most associations remained significant even after further accounting for body mass index change, waist circumference change, or respective abdominal adipose tissue volumes.
CONCLUSIONS
Increasing accumulation of fat quantity and decreasing fat attenuation are associated with worsening of CVD risk factors beyond the associations with generalized adiposity, central adiposity, or respective adipose tissue volumes.
Keywords: cardiovascular disease, computed tomography, epidemiology, fat attenuation, subcutaneous adipose tissue, visceral adipose tissue
Cardiovascular disease (CVD), one of the leading causes of morbidity and mortality in the United States (1), substantially increases the economic burden among individuals, families, and the health care system (2). Abdominal subcutaneous adipose tissue (SAT) and visceral adipose tissue (VAT) are 2 major fat compartments that are closely associated with a cluster of cardiometabolic abnormalities (3). Computed tomography (CT) enables the indirect assessment of both adipose tissue quantity in cubic centimeters and quality in Hounsfield units (HU) via CT threshold attenuation (4). Numerous studies have shown that greater accumulation of abdominal SAT and VAT is associated with a higher prevalence of diabetes (5), hypertension (6), and hypertriglyceridemia (7). In addition, we have shown that greater abdominal fat volume and lower (i.e., more negative) abdominal fat attenuation assessed by CT are associated with adverse levels of CVD risk factors (3,8) and longitudinally associated with higher incidence of CVD risk factors (9). However, limited studies have explored the longitudinal associations between quantitative and qualitative changes in abdominal adipose tissue with incidence and changes in CVD risk factors over time.
Therefore, the primary purpose of this study was to explore the longitudinal associations between changes in abdominal fat volume and attenuation with incidence and changes in a broad array of CVD risk factors during an average of 6.1 years of follow-up.
METHODS
The Framingham Heart Study is a long-term prospective study that has collected information on participants’ medical history, physical examinations, and laboratory tests since 1948. In addition, the Framingham Heart Study has monitored participants for the development of CVD to identify major CVD risk factors (10). Participants for this study were drawn from the Third Generation cohort who participated in the multidetector CT (MDCT) substudy Exam 1 from 2002 to 2005 (baseline) and Exam 2 from 2008 to 2011 (follow-up). The design and selection criteria of the Third Generation cohort of the Framingham Heart Study has been described previously (11). Among the sample of 1,994 Third Generation participants who attended the MDCT substudy Exam 1, we excluded participants in the following order: 1) who did not participate in the Third Generation Exam 2 (n = 229), 2) missing fat measures (weight, abdominal SAT, and VAT volume and attenuation) because participants did not attend the MDCT substudy Exam 2 (n = 609); 3) missing outcomes (n = 5); 4) missing covariates (n = 28); and 5) a history of CVD diagnosis on or before Exam 2 (n = 17), resulting in a total of 1,106 participants. Compared with participants excluded from the analysis (n = 888), participants included in the analysis (n = 1,106) had lower weight (80.5 kg vs. 82.1 kg; p = 0.04), body mass index (BMI) (27.2 kg/m2 vs. 27.8 kg/m2; p = 0.02), SAT volume (2,732 cm3 vs. 2,872 cm3; p = 0.03), and VAT volume (1,571 cm3 vs. 1,659 cm3, p = 0.04), and were less likely to be diabetic (2.8% vs. 5.4%; p = 0.004) and smokers (10.4% vs. 20.2%; p < 0.0001). The institutional review boards of the Boston University Medical Center and Massachusetts General Hospital approved the study. All participants provided written informed consent.
ABDOMINAL SAT AND VAT VOLUME AND ATTENUATION
The participants underwent abdominal scans via an 8-slice MDCT while lying in the supine position (LightSpeed Ultra, General Electric, Milwaukee, Wisconsin) (4). Starting from the upper edge of the S1 vertebrae, 5-mm thickness of 25 consecutive CT slices were acquired with a tube voltage of 120 kVp, and effective radiation exposure dosage of 2.7 mSv (4). A 3-dimensional Workstation tool was utilized to assess abdominal adipose tissue volume and attenuation (Aquarius 3D Workstation, TeraRecon Inc., San Mateo, California). The readers outlined the abdominal muscular wall to differentiate the abdominal SAT and VAT area and the average cubic centimeters and HU of SAT and VAT were recorded based on the radiographic pixel threshold between −195 and −45 HU with center attenuation of −120 HU. Detailed information regarding the MDCT scan protocol and the reproducibility of these 2 abdominal fat compartments were reported previously with inter-reader and intrareader reliability of 0.997 for SAT and 0.992 for VAT (4). Due to the CT imaging technique involved with the adipose tissue measurement, fat quality was referred to as fat attenuation and denoted in HU.
CVD RISK FACTORS
CVD risk factor profiles were assessed and analyzed on site in the laboratory at each examination by study physicians and clinic technicians. BMI was computed as weight in kilograms divided by the square of height in meters. Obesity was defined as BMI ≥30 kg/m2. Blood pressure including systolic blood pressure and diastolic blood pressure was assessed twice with participants seated after a 5-min rest. Hypertension was defined as systolic blood pressure ≥140 mm Hg, diastolic blood pressure ≥90 mm Hg, or the use of hypertensive medication. Blood samples were collected in the morning from participants who had fasted for ≥8 h prior to the blood draw. Fasting plasma glucose, total cholesterol, high-density lipoprotein (HDL) cholesterol, and triglycerides were assessed from the blood samples. Impaired fasting glucose was defined as fasting plasma glucose 100 to 125 mg/dl and not on insulin or hypoglycemic medication. Diabetes mellitus was defined as plasma fasting glucose ≥126 mg/dl or current use of insulin or oral hypoglycemic medication. Hypercholesterolemia was defined as total cholesterol ≥240 mg/dl or lipid-lowering treatment. Low HDL cholesterol was defined as HDL cholesterol <50 mg/dl for women and <40 mg/dl for men. Hypertriglyceridemia was defined as triglycerides ≥150 mg/dl or lipid treatment. Metabolic syndrome was determined according to the definition of Modified National Cholesterol Education Program Adult Treatment Panel III guidelines (12).
MEASUREMENT OF COVARIATES
All of the covariates were measured at the baseline examination cycle. Weight and height were assessed to the closest pound and 0.25 inch, respectively. Waist circumference was measured at the horizontal level of the umbilicus to the nearest 0.25 inch. Information regarding smoking status, alcohol use, postmenopausal status, and current use of hormone replacement therapy was documented during the physician-administered medical and physical history interview. Participants were classified as a current smoker if they smoked >1 cigarette in the year preceding the examination. Moderate to heavy drinking was defined as >7 drinks per week for women and >14 drinks for men. Participants completed the technician-administered questionnaire to estimate the physical activity index score that assessed the participants’ physical activity level (13).
STATISTICAL ANALYSIS
For the continuous CVD risk factors, age-adjusted Pearson correlation coefficients were examined to explore the correlations between changes in abdominal fat volume and attenuation with changes in CVD risk factors during follow-up. Multivariable-adjusted linear regression analyses were performed to predict changes in CVD risk factors from changes in abdominal fat volume and attenuation. Triglycerides were natural-logarithmically transformed to normalize its distribution. For the dichotomous CVD risk factors, multivariable-adjusted logistic regression models were constructed with changes in abdominal fat volume and attenuation as independent variables and incident CVD risk factors as dependent variables.
The odds ratios from the logistic regression models and β-coefficients from the linear regression models were based on a 500 cm3 increase in abdominal adipose tissue volume and a 5 HU decrease in abdominal adipose tissue attenuation for consistency with our previous adipose tissue studies (14,15).
The multivariable adjustments for the regression models included baseline abdominal adipose tissue, baseline CVD risk factors, age, sex, current smoking, alcohol intake, physical activity, postmenopausal status (women only), and hormone replacement therapy (women only). For the logistic regression analysis, model-specific adjustments for baseline levels of CVD risk factors were additionally applied. More specifically, additional adjustments were made for the following models: baseline systolic blood pressure and diastolic blood pressure for the hypertension model; baseline glucose fasting plasma for the impaired fasting glucose and diabetes mellitus models; baseline total cholesterol for the hypercholesterolemia model; baseline HDL cholesterol for the low HDL cholesterol model; and baseline triglycerides for the hypertriglyceridemia model. Participants who were taking antihypertensive medication at baseline were excluded from the systolic blood pressure and diastolic blood pressure models. If participants were in use of antihypertensive medication at the follow-up examination, 10 mm Hg were added to the follow-up systolic blood pressure and 5 mm Hg were added to the follow up diastolic blood pressure to reflect the effect of the antihypertensive medications to their blood pressure (9,16,17).
Generalized adiposity (BMI) change, abdominal adiposity (waist circumference) change, or respective fat volumes (SAT volume for SAT attenuation model and VAT volume for VAT attenuation model) was additionally included in the multivariable-adjusted model as a second-level adjustment. The tests for interactions with sex were conducted based on the multivariable-adjusted model.
Additionally, we stratified the participants into groups according to tertiles of abdominal adipose tissue volume and attenuation change and examined CVD risk factor incidence across the groups. A 2-tailed p value <0.05 was considered statistically significant. The primary purpose of this research was hypothesis testing (i.e., to explore the associations between changes in fat quantity and quality with changes in CVD risk factors), thus we conducted exploratory data analyses without adjustments for multiple comparisons. Statistical analyses were conducted via SAS software, version 9.2 (SAS Institute, Cary, North Carolina).
RESULTS
DESCRIPTIVE CHARACTERISTICS
Table 1 summarizes the baseline characteristics of the overall participants (44.1% women). During 6.1 years of follow-up, weight, BMI, and waist circumference increased by 2.4 kg, 1.1 kg/m2, and 3.7 cm, respectively. The participants gained an average of 602 cm3 of SAT volume and 703 cm3 of VAT volume. The average fat attenuation decreased by 5.5 HU for SAT and increased by 0.07 HU for VAT attenuation.
TABLE 1.
Baseline Characteristics of the Participants
| Overall Participants (n = 1,106) | ||
|---|---|---|
| Baseline | Follow-Up | |
| Age, yrs | 45.1 ± 6.2 | 51.3 ± 6.2 |
| Weight, kg | 80.5 ± 17.2 | 82.9 ± 18.1 |
| Body mass index, kg/m2 | 27.2 ± 5.0 | 28.3 ± 5.3 |
| Waist circumference, cm | 95.1 ± 14.0 | 98.8 ± 14.0 |
| SAT volume, cm3 | 2732 ± 1387 | 3334 ± 1632 |
| VAT volume, cm3 | 1571 ± 890 | 2274 ± 1403 |
| SAT attenuation, HU | −100.8 ± 5.2 | −106.3 ± 4.3 |
| VAT attenuation, HU | −93.9 ± 4.7 | −93.9 ± 7.0 |
| Systolic blood pressure, mm Hg | 119.3 ± 14.4 | 118.6 ± 13.2 |
| Diastolic blood pressure, mm Hg | 76.7 ± 9.0 | 75.3 ± 8.7 |
| Fasting plasma glucose, mg/dl | 97.0 ± 18.8 | 98.8 ± 20.4 |
| Total cholesterol, mg/dl | 194.6 ± 34.4 | 191.6 ± 34.8 |
| HDL cholesterol, mg/dl | 53.9 ± 17.0 | 59.4 ± 18.6 |
| Triglycerides, mg/dl | 97 (67–145) | 96.0 (71–138) |
| Obesity | 24.1 (266) | 31.5 (348) |
| Hypertension | 20.3 (225) | 26.7 (295) |
| Diabetes mellitus | 2.8 (31) | 6.0 (66) |
| Hypercholesterolemia | 18.6 (206) | 29.2 (323) |
| Low HDL cholesterol | 27.1 (300) | 16.3 (180) |
| Hypertriglyceridemia | 29.7 (329) | 36.2 (400) |
| Metabolic syndrome | 24.9 (275) | 28.8 (319) |
| Current smoking* | 10.4 (115) | 7.3 (81) |
| Moderate to heavy alcohol use† | 15.4 (170) | 15.6 (172) |
| Physical activity index | 37.4 ± 8.0 | 38.2 ± 9.0 |
Values are mean ± SD,%(n), or median (25th, 75th percentile) (due to the skewed distribution).
Defined as ≥1 cigarette/day within the previous year.
Defined as >7 drinks/week for women and >14 drinks/week for men.
HDL = high-density lipoprotein; HU = Hounsfield units; SAT = subcutaneous adipose tissue; VAT = visceral adipose tissue.
CORRELATIONS BETWEEN CHANGES IN ABDOMINAL FAT AND CHANGES IN CVD RISK FACTORS
Age- and sex-adjusted Pearson correlation coefficients are shown in Table 2. In general, increases in fat volume and decreases in fat attenuation were correlated with adverse changes in CVD risk factor profiles. The partial Pearson correlation coefficients ranged from −0.29 to 0.31, suggesting weak to moderate correlations between changes in abdominal fat volume and attenuation with changes in CVD risk factors.
TABLE 2.
Age- and Sex-Adjusted Pearson Correlation Coefficients Between Changes in Abdominal Fat Volume and Attenuation With Changes in Cardiovascular Disease Risk Factors
| Overall Participants | ||||||
|---|---|---|---|---|---|---|
| Δ in Systolic Blood Pressure | Δ in Diastolic Blood Pressure | Δ in Fasting Plasma Glucose | Δ in Total Cholesterol | Δ in HDL Cholesterol | Δ in Log Triglycerides | |
| Δ in SAT volume | 0.19‡ | 0.16‡ | 0.07* | 0.12‡ | −0.16‡ | 0.20‡ |
| Δ in VAT volume | 0.22‡ | 0.15‡ | 0.08† | −0.07* | −0.29‡ | 0.18‡ |
| Δ in SAT attenuation | −0.12‡ | −0.14‡ | −0.03 | −0.11‡ | 0.09† | −0.19‡ |
| Δ in VAT attenuation | −0.17‡ | −0.17‡ | −0.05 | 0.00 | 0.31‡ | −0.20‡ |
Significant at 0.05 level.
Significant at 0.01 level.
Significant at 0.001 level.
Abbreviations as in Table 1.
CHANGES IN ABDOMINAL FAT VOLUME AND ATTENUATION WITH INCIDENT CVD RISK FACTORS
Tables 3 and 4 present the associations between changes in abdominal fat volume and attenuation with incident CVD risk factors. For each additional 500 cm3 increase in SAT and VAT volume from baseline to follow-up, the odds of incident CVD risk factors generally increased, with the exception of SAT volume change with diabetes mellitus, hypercholesterolemia, and low HDL cholesterol; and VAT volume change with impaired fasting glucose and diabetes mellitus. The additional adjustment of change in BMI or waist circumference did not materially change the direction or the significance of these associations (Table 3).
TABLE 3.
Multivariable-Adjusted Logistic Regression Models for Changes in Abdominal Fat Volume With Incident Cardiovascular Disease Risk Factors
| Model | Overall Participants | ||||
|---|---|---|---|---|---|
|
| |||||
| Δ in SAT Volume | p Value | Δ in VAT Volume | p Value | ||
| Hypertension | Incident* | 115/881 (13.1) | |||
| MV† | 1.21 (1.03, 1.41) | 0.02 | 1.30 (1.10, 1.55) | 0.002 | |
| MV + BMI† | 1.21 (1.03, 1.41) | 0.02 | 1.30 (1.10, 1.55) | 0.003 | |
| MV + WC† | 1.21 (1.03, 1.41) | 0.02 | 1.32 (1.11, 1.57) | 0.002 | |
| Sex interaction‡ | – | 0.65 | – | 0.03 | |
|
| |||||
| Impaired fasting glucose | Incident* | 130/788 (16.5) | |||
| MV† | 1.25 (1.08,1.45) | 0.003 | 1.10 (0.94,1.29) | 0.23 | |
| MV + BMI† | 1.24 (1.06,1.44) | 0.006 | 1.08 (0.92,1.26) | 0.37 | |
| MV + WC† | 1.24 (1.07,1.45) | 0.004 | 1.09 (0.93,1.27) | 0.31 | |
| Sex interaction‡ | – | 0.08 | – | 0.001 | |
|
| |||||
| Diabetes mellitus | Incident* | 36/1,075 (3.3) | |||
| MV† | 1.00 (0.81, 1.24) | 0.99 | 1.13 (0.89, 1.43) | 0.31 | |
| MV + BMI† | 1.00 (0.81, 1.24) | 0.99 | 1.15 (0.91, 1.45) | 0.25 | |
| MV + WC† | 1.00 (0.80, 1.24) | 0.98 | 1.13 (0.90, 1.43) | 0.30 | |
| Sex interaction‡ | – | 0.18 | – | 0.75 | |
|
| |||||
| Hypercholesterolemia | Incident* | 150/900 (16.7) | |||
| MV† | 1.10 (0.96, 1.26) | 0.18 | 1.37 (1.18, 1.60) | <0.0001 | |
| MV + BMI† | 1.10 (0.96, 1.26) | 0.17 | 1.38 (1.18, 1.61) | <0.0001 | |
| MV + WC† | 1.10 (0.96, 1.26) | 0.18 | 1.40 (1.20, 1.63) | <0.0001 | |
| Sex interaction‡ | – | 0.16 | – | 0.12 | |
|
| |||||
| Low HDL cholesterol | Incident* | 31/806 (3.8) | |||
| MV† | 1.20 (0.93, 1.54) | 0.16 | 1.48 (1.12, 1.97) | 0.007 | |
| MV + BMI† | 1.22 (0.94, 1.57) | 0.13 | 1.46 (1.10, 1.95) | 0.01 | |
| MV + WC† | 1.20 (0.93, 1.54) | 0.16 | 1.44 (1.08, 1.92) | 0.01 | |
| Sex interaction‡ | – | 0.43 | – | 0.86 | |
|
| |||||
| Hypertriglyceridemia | Incident* | 141/777 (18.1) | |||
| MV† | 1.15 (1.01, 1.30) | 0.04 | 1.56 (1.33, 1.83) | <0.0001 | |
| MV + BMI† | 1.15 (1.01, 1.31) | 0.03 | 1.58 (1.34, 1.85) | <0.0001 | |
| MV + WC† | 1.14 (1.00, 1.30) | 0.047 | 1.59 (1.35, 1.87) | <0.0001 | |
| Sex interaction‡ | – | 0.09 | – | 0.57 | |
|
| |||||
| Metabolic syndrome | Incident* | 109/831 (13.1) | |||
| MV† | 1.43 (1.23, 1.68) | <0.0001 | 1.82 (1.51, 2.19) | <0.0001 | |
| MV + BMI† | 1.41 (1.20, 1.65) | <0.0001 | 1.76 (1.46, 2.11) | <0.0001 | |
| MV + WC† | 1.42 (1.21, 1.66) | <0.0001 | 1.77 (1.47, 2.13) | <0.0001 | |
| Sex interaction‡ | – | 0.48 | – | 0.02 | |
Values are n/n (%) or odds ratio (95% confidence interval). The results show the odds of cardiovascular disease risk factor for each additional 500 cm3 increase in the change in abdominal fat volume.
The number of new cases of a cardiovascular disease risk factor at follow-up divided by the number of persons at risk for the risk factor.
Multivariable (MV) model was adjusted for baseline fat volume, baseline cardiovascular disease risk factors, age, sex, current smoking, alcohol intake, physical activity, postmenopausal status (women only), and hormone replacement therapy (women only). MV + body mass index (BMI) model was additionally adjusted for BMI change. MV + waist circumference (WC) model was additionally adjusted for waist circumference change.
Sex interaction was examined based on the multivariable-adjusted model.
TABLE 4.
Multivariable-Adjusted Logistic Regression Models for Changes in Abdominal Fat Attenuation With Incident Cardiovascular Disease Risk Factors
| Model | Overall Participants | ||||
|---|---|---|---|---|---|
|
| |||||
| Δ in SAT Attenuation | p Value | Δ in VAT Attenuation | p Value | ||
| Hypertension | Incident* | 115/881 (13.1) | |||
| MV† | 2.92 (1.79, 4.79) | <0.0001 | 1.56 (1.17, 2.08) | 0.002 | |
| MV + BMI† | 2.73 (1.67, 4.49) | <0.0001 | 1.52 (1.13, 2.05) | 0.005 | |
| MV + WC† | 2.74 (1.67, 4.51) | <0.0001 | 1.58 (1.17, 2.14) | 0.003 | |
| MV + fat volume† | 2.89 (1.61, 5.19) | 0.0004 | 1.23 (0.80, 1.88) | 0.34 | |
| Sex interaction‡ | – | 0.72 | – | 0.75 | |
|
| |||||
| Impaired fasting glucose | Incident* | 130/788 (16.5) | |||
| MV† | 1.44 (0.97, 2.13) | 0.07 | 1.28 (1.00, 1.64) | 0.05 | |
| MV + BMI† | 1.30 (0.87, 1.93) | 0.20 | 1.15 (0.89, 1.49) | 0.27 | |
| MV + WC† | 1.31 (0.88, 1.94) | 0.18 | 1.19 (0.92, 1.54) | 0.18 | |
| MV + fat volume† | 0.91 (0.56, 1.48) | 0.71 | 1.31 (0.88, 1.95) | 0.19 | |
| Sex interaction‡ | – | 0.07 | – | 0.02 | |
|
| |||||
| Diabetes mellitus | Incident* | 36/1,075 (3.3) | |||
| MV† | 0.91 (0.53, 1.56) | 0.74 | 1.29 (0.82, 2.01) | 0.27 | |
| MV + BMI† | 0.97 (0.57, 1.66) | 0.91 | 1.28 (0.82, 1.99) | 0.28 | |
| MV + WC† | 0.91 (0.54, 1.56) | 0.74 | 1.25 (0.80, 1.95) | 0.33 | |
| MV + fat volume† | 0.83 (0.39, 1.75) | 0.62 | 1.21 (0.56, 2.60) | 0.63 | |
| Sex interaction‡ | – | 0.20 | – | 0.42 | |
|
| |||||
| Hypercholesterolemia | Incident* | 150/900 (16.7) | |||
| MV† | 1.73 (1.16, 2.59) | 0.007 | 1.69 (1.32, 2.15) | <0.0001 | |
| MV + BMI† | 1.71 (1.15, 2.55) | 0.009 | 1.71 (1.33, 2.21) | <0.0001 | |
| MV + WC† | 1.72 (1.15, 2.57) | 0.008 | 1.78 (1.37, 2.32) | <0.0001 | |
| MV + fat volume† | 1.82 (1.11, 2.98) | 0.02 | 1.29 (0.88, 1.90) | 0.19 | |
| Sex interaction‡ | – | 0.16 | – | 0.08 | |
|
| |||||
| Low HDL cholesterol | Incident* | 31/806 (3.8) | |||
| MV† | 2.73 (1.22, 6.12) | 0.01 | 2.15 (1.31, 3.52) | 0.002 | |
| MV + BMI† | 2.62 (1.18, 5.86) | 0.02 | 2.16 (1.28, 3.65) | 0.004 | |
| MV + WC† | 2.53 (1.14, 5.60) | 0.02 | 2.00 (1.19, 3.36) | 0.009 | |
| MV + fat volume† | 2.69 (1.03, 7.06) | 0.04 | 1.91 (0.89, 4.11) | 0.10 | |
| Sex interaction‡ | – | 0.11 | – | 0.99 | |
|
| |||||
| Hypertriglyceridemia | Incident* | 141/777 (18.1) | |||
| MV† | 1.84 (1.26, 2.68) | 0.002 | 1.93 (1.52, 2.45) | <0.0001 | |
| MV + BMI† | 1.82 (1.25, 2.65) | 0.002 | 1.99 (1.55, 2.56) | <0.0001 | |
| MV + WC† | 1.82 (1.25, 2.66) | 0.002 | 2.04 (1.58, 2.63) | <0.0001 | |
| MV + fat volume† | 1.87 (1.15, 3.06) | 0.012 | 1.32 (0.89, 1.96) | 0.17 | |
| Sex interaction‡ | – | 0.047 | – | 0.21 | |
|
| |||||
| Metabolic syndrome | Incident* | 109/831 (13.1) | |||
| MV† | 2.60 (1.64, 4.14) | <0.0001 | 3.58 (2.57, 4.97) | <0.0001 | |
| MV + BMI† | 2.24 (1.40, 3.59) | 0.0008 | 3.06 (2.18, 4.30) | <0.0001 | |
| MV + WC† | 2.15 (1.35, 3.42) | 0.001 | 3.05 (2.16, 4.29) | <0.0001 | |
| MV + fat volume† | 1.31 (0.75, 2.29) | 0.45 | 2.49 (1.52, 4.08) | 0.0003 | |
| Sex interaction‡ | – | 0.34 | – | 0.04 | |
Values are n/n (%) or odds ratio (95% confidence interval). The results show the odds of cardiovascular disease risk factor for each additional 5HU decrease in the change in abdominal fat attenuation.
The number of new cases of a cardiovascular disease risk factor at follow-up divided by the number of persons at risk for the risk factor.
MV model, adjusted for baseline fat attenuation, baseline cardiovascular disease risk factors, age, sex, current smoking, alcohol intake, physical activity, postmenopausal status (women only), and hormone replacement therapy (women only). MV + BMI model was additionally adjusted for BMI change. MV + WC model was additionally adjusted for waist circumference change. MV + Fat Volume model was additionally adjusted for respective fat volume (SAT volume for SAT attenuation and VAT volume for VAT attenuation).
Sex interaction was examined based on the multivariable-adjusted model.
Similarly, each additional 5 HU decrease in the change in SAT and VAT attenuation was associated with increased odds of incident CVD risk factor profiles (p < 0.05), except for impaired fasting glucose and diabetes mellitus (Table 4). Sex-specific regression models for changes in abdominal fat volume and attenuation with incident CVD risk factor profiles are provided in Online Tables 1 and 2.
We further tested for the sex interactions between changes in abdominal fat volume and attenuation with incident CVD risk factors based on the multivariable-adjusted model. Most of the sex interactions were not significant, except for VAT volume change with hypertension (p = 0.03), impaired fasting glucose (p = 0.001), and metabolic syndrome (p = 0.02); SAT attenuation change with hypertriglyceridemia (p = 0.047); and VAT attenuation change with impaired fasting glucose (p = 0.02) and metabolic syndrome (p = 0.04) (Tables 3 and 4). All other p values were ≥0.07.
CHANGES IN ABDOMINAL FAT VOLUME AND ATTENUATION WITH CHANGES IN CVD RISK FACTORS
The associations between changes in CVD risk factors with changes in fat volume and changes in fat attenuation are shown in Tables 5 and 6, respectively. The longitudinal changes in abdominal fat volume during the follow-up were associated with adverse changes in CVD risk factor profiles over time (all p ≤ 0.0005) (Table 5). Associations remained significant even after further adjustment for change in BMI or waist circumference (all p ≤ 0.0006) (Table 5).
TABLE 5.
Multivariable-Adjusted Linear Regression Models for Changes in Abdominal Fat Volume With Changes in Cardiovascular Disease Risk Factors
| Model | Overall Participants | ||||
|---|---|---|---|---|---|
|
| |||||
| Δ in SAT Volume | p Value | Δ in VAT Volume | p Value | ||
| Δ in Systolic blood pressure | Sample size | 988 | |||
| MV* | 1.49 (1.04, 1.94) | <0.0001 | 1.90 (1.38, 2.41) | <0.0001 | |
| MV + BMI* | 1.48 (1.03, 1.94) | <0.0001 | 1.90 (1.38, 2.42) | <0.0001 | |
| MV + WC* | 1.49 (1.03, 1.94) | <0.0001 | 1.91 (1.40, 2.43) | <0.0001 | |
| Sex interaction† | – | 0.01 | – | <0.0001 | |
|
| |||||
| Δ in Diastolic blood pressure | Sample size | 988 | |||
| MV* | 0.87 (0.56, 1.18) | <0.0001 | 1.34 (0.99, 1.70) | <0.0001 | |
| MV + BMI* | 0.87 (0.56, 1.18) | <0.0001 | 1.34 (0.99, 1.69) | <0.0001 | |
| MV + WC* | 0.87 (0.56, 1.18) | <0.0001 | 1.35 (0.99, 1.70) | <0.0001 | |
| Sex interaction† | – | 0.009 | – | 0.002 | |
|
| |||||
| Δ in Fasting plasma glucose | Sample size | 1,084 | |||
| MV* | 0.96 (0.42, 1.50) | 0.0005 | 1.14 (0.52, 1.75) | 0.0003 | |
| MV + BMI* | 0.96 (0.42, 1.50) | 0.0005 | 1.13 (0.52, 1.75) | 0.0003 | |
| MV + WC* | 0.96 (0.41, 1.50) | 0.0006 | 1.13 (0.51, 1.75) | 0.0003 | |
| Sex interaction† | – | 0.49 | – | 0.04 | |
|
| |||||
| Δ in Total cholesterol | Sample size | 998 | |||
| MV* | 2.30 (1.18, 3.42) | <0.0001 | 2.54 (1.23, 3.85) | 0.0002 | |
| MV + BMI* | 2.34 (1.23, 3.45) | <0.0001 | 2.63 (1.32, 3.94) | <0.0001 | |
| MV + WC* | 2.39 (1.27, 3.50) | <0.0001 | 2.63 (1.32, 3.95) | <0.0001 | |
| Sex interaction† | – | 0.62 | – | 0.06 | |
|
| |||||
| Δ in HDL cholesterol | Sample size | 998 | |||
| MV* | −1.15 (−1.57, −0.73) | <0.0001 | −2.26 (−2.75, −1.78) | <0.0001 | |
| MV + BMI* | −1.15 (−1.57, −0.73) | <0.0001 | −2.25 (−2.74, −1.76) | <0.0001 | |
| MV + WC* | −1.13 (−1.56, −0.71) | <0.0001 | −2.22 (−2.71, −1.74) | <0.0001 | |
| Sex interaction† | – | 0.13 | – | 0.02 | |
|
| |||||
| Δ in Log triglycerides | Sample size | 998 | |||
| MV* | 0.05 (0.04, 0.07) | <0.0001 | 0.10 (0.08, 0.11) | <0.0001 | |
| MV + BMI* | 0.05 (0.04, 0.07) | <0.0001 | 0.10 (0.08, 0.11) | <0.0001 | |
| MV + WC* | 0.05 (0.04, 0.07) | <0.0001 | 0.10 (0.08, 0.11) | <0.0001 | |
| Sex interaction† | – | 0.01 | – | 0.046 | |
Values are estimated β (95% confidence interval). The results show the association of changes in cardiovascular disease risk factor for each additional 500 cm3 increase in the change in abdominal fat volume.
MV model, adjusted for baseline fat volume, baseline cardiovascular disease risk factors, age, sex, current smoking, alcohol intake, physical activity, postmenopausal status (women only), and hormone replacement therapy (women only). MV + BMI model was additionally adjusted for BMI change. MV + WC model was additionally adjusted for waist circumference change.
Sex interaction was tested based on multivariable-adjusted model.
TABLE 6.
Multivariable-Adjusted Linear Regression Models for Changes in Abdominal Fat Attenuation With Changes in Cardiovascular Disease Risk Factors
| Model | Overall Participants | ||||
|---|---|---|---|---|---|
|
| |||||
| Δ in SAT Attenuation | p Value | Δ in VAT Attenuation | p Value | ||
| Δ in Systolic blood pressure | Sample size | 988 | |||
| MV* | 2.89 (1.86, 3.93) | <0.0001 | 2.55 (1.85, 3.24) | <0.0001 | |
| MV + BMI* | 2.81 (1.77, 3.84) | <0.0001 | 2.57 (1.84, 3.30) | <0.0001 | |
| MV + WC* | 2.80 (1.77, 3.84) | <0.0001 | 2.62 (1.88, 3.36) | <0.0001 | |
| MV + fat volume* | 2.82 (1.78, 3.85) | <0.0001 | 2.60 (1.84, 3.36) | <0.0001 | |
| Sex interaction† | – | 0.23 | – | 0.01 | |
|
| |||||
| Δ in Diastolic blood pressure | Sample size | 988 | |||
| MV* | 2.24 (1.54, 2.94) | <0.0001 | 2.01 (1.53, 2.48) | <0.0001 | |
| MV + BMI* | 2.20 (1.50, 2.90) | <0.0001 | 2.01 (1.51, 2.51) | <0.0001 | |
| MV + WC* | 2.21 (1.50, 2.91) | <0.0001 | 2.05 (1.55, 2.56) | <0.0001 | |
| MV + fat volume* | 2.21 (1.50, 2.91) | <0.0001 | 2.06 (1.54, 2.58) | <0.0001 | |
| Sex interaction† | – | 0.26 | – | 0.07 | |
|
| |||||
| Δ in Fasting plasma glucose | Sample size | 1,084 | |||
| MV* | 1.29 (0.03, 2.55) | 0.04 | 1.57 (0.71, 2.43) | 0.0004 | |
| MV + BMI* | 1.23 (−0.02, 2.49) | 0.06 | 1.55 (0.65, 2.44) | 0.0007 | |
| MV + WC* | 1.20 (−0.06, 2.45) | 0.06 | 1.53 (0.62, 2.44) | 0.001 | |
| MV + fat volume* | 1.19 (−0.07, 2.45) | 0.06 | 1.61 (0.68, 2.54) | 0.0007 | |
| Sex interaction† | – | 0.11 | – | 0.13 | |
|
| |||||
| Δ in Total cholesterol | Sample size | 988 | |||
| MV* | 5.01 (2.40, 7.62) | 0.0002 | 2.87 (1.06, 4.68) | 0.002 | |
| MV + BMI* | 5.20 (2.63, 7.78) | <0.0001 | 4.40 (2.53, 6.27) | <0.0001 | |
| MV + WC* | 5.35 (2.76, 7.93) | <0.0001 | 4.47 (2.57, 6.37) | <0.0001 | |
| MV + fat volume* | 5.31 (2.72, 7.90) | <0.0001 | 4.97 (3.04, 6.90) | <0.0001 | |
| Sex interaction† | – | 0.58 | – | 0.18 | |
|
| |||||
| Δ in HDL cholesterol | Sample size | 988 | |||
| MV* | −3.25 (−4.21, −2.29) | <0.0001 | −3.64 (−4.29, −2.99) | <0.0001 | |
| MV + BMI* | −3.23 (−4.20, −2.27) | <0.0001 | −3.70 (−4.38, −3.02) | <0.0001 | |
| MV + WC* | −3.21 (−4.17, −2.25) | <0.0001 | −3.66 (−4.35, −2.96) | <0.0001 | |
| MV + fat volume* | −3.23 (−4.19, −2.27) | <0.0001 | −3.93 (−4.64, −3.23) | <0.0001 | |
| Sex interaction† | – | 0.0005 | – | 0.64 | |
|
| |||||
| Δ in Log triglycerides | Sample size | 988 | |||
| MV* | 0.11 (0.07, 0.15) | <0.0001 | 0.11 (0.09, 0.14) | <0.0001 | |
| MV + BMI* | 0.11 (0.07, 0.15) | <0.0001 | 0.13 (0.10, 0.15) | <0.0001 | |
| MV + WC* | 0.11 (0.07, 0.15) | <0.0001 | 0.13 (0.10, 0.16) | <0.0001 | |
| MV + fat volume* | 0.11 (0.07, 0.15) | <0.0001 | 0.14 (0.11, 0.16) | <0.0001 | |
| Sex interaction† | – | 0.03 | – | 0.15 | |
Values are estimated β (95% confidence interval). The results show the association of changes in cardiovascular disease risk factor for each additional 5 HU decrease in the change in abdominal fat attenuation.
MV model, adjusted for baseline fat attenuation, baseline cardiovascular disease risk factors, age, sex, current smoking, alcohol intake, physical activity, postmenopausal status (women only), and hormone replacement therapy (women only). MV + BMI model was additionally adjusted for BMI change. MV + WC model was additionally adjusted for waist circumference change. MV + fat volume model was additionally adjusted for respective fat volume (SAT volume for SAT attenuation and VAT volume for VAT attenuation).
Sex interaction was examined based on the multivariable-adjusted model.
Similar patterns were observed between changes in abdominal fat attenuation with changes in CVD risk factor profiles (all p < 0.05) (Table 6). These associations persisted even after additional adjustment for BMI change, waist circumference change, or respective fat volume (all p ≤ 0.001); except for changes in SAT volume and fasting plasma glucose (all p = 0.06). Sex-specific regression models for changes in abdominal fat and changes in CVD risk factor profiles are provided in Online Tables 3 and 4.
Tests for sex interactions between changes in abdominal fat volume with changes in CVD risk factor profiles were significant for most of the CVD risk outcomes (Table 5). In general, these associations were stronger in women, as compared to men (Online Table 3). Conversely, the majority of the sex interactions between changes in abdominal fat attenuation with changes in CVD risk factors were not significant (Table 6).
SECONDARY ANALYSES
We further explored the associations between incident CVD risk factors with SAT and VAT volumes and attenuation change over time by examining the proportion of participants with incident CVD risk factors across tertiles of fat volume and attenuation. The incidence rate of CVD risk factors were stratified by tertiles of changes in SAT and VAT volume (Central Illustration) and attenuation (Figure 1) during follow-up. In general, higher tertiles of abdominal fat volume (i.e., increase in the change in fat volume) and attenuation (i.e., decrease in the change in fat attenuation) change were associated with a relatively higher incidence of CVD risk factors, as compared to the lower tertile groups.
CENTRAL ILLUSTRATION. Abdominal Fat and Cardiometabolic Risk Factors.
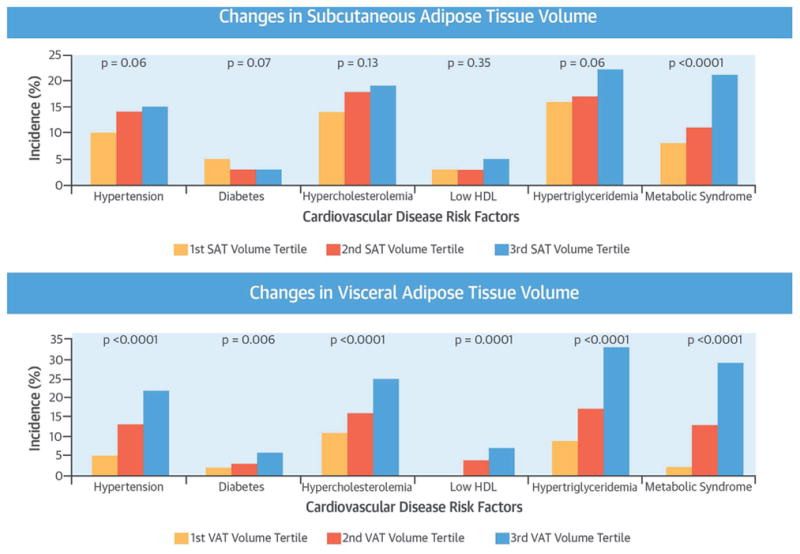
Lee, J.J. et al. J Am Coll Cardiol. 2016;68(14):1509–21.
Incidence of cardiovascular disease risk factors according to the tertiles of changes in (Top) subcutaneous adipose tissue (SAT) and (Bottom) visceral adipose tissue (VAT) volumes in overall participants. Tertile 3 corresponds to a larger increase in the change in adipose tissue volumes, as compared with tertile 1. The linear trend for each cardiovascular disease risk factor model is shown as a single p value. HDL = high-density lipoprotein cholesterol. SAT = subcutaneous adipose tissue; VAT = visceral adipose tissue.
FIGURE 1. Incidence of Cardiovascular Disease Risk Factors According to the Tertiles of Changes in SAT and VAT Attenuation in Overall Participants.

Tertile 3 corresponds to more decrease (i.e., more negative) in the change in adipose tissue attenuation, as compared to tertile 1. The linear trend for each cardiovascular disease risk factor model is shown as a single p value. HDL = high-density lipoprotein cholesterol; HU = Hounsfield units; SAT = subcutaneous adipose tissue; VAT = visceral adipose tissue.
DISCUSSION
In this large community-based observational study, we examined longitudinal associations between changes in abdominal fat volume and attenuation with incidence and changes in CVD risk factor profiles during a 6-year interval. Our principal findings are 3-fold. First, an increase in the change in abdominal SAT and VAT volume are associated with an increased incidence of CVD risk factors and more adverse changes in CVD risk factors over time. Second, a decrease in the change in SAT and VAT attenuation was associated with an increased incidence of CVD risk factors, as well as more adverse changes in CVD risk factors. Finally, the majority of these associations remained significant even after further accounting for BMI change, waist circumference change, or respective abdominal adipose tissue volumes. Taken together, these findings suggest that adverse changes in fat quantity and attenuation are associated with changes in CVD risk factors above and beyond the contribution of generalized adiposity, central adiposity, or absolute levels of respective fat volume.
CONTEXT OF THE CURRENT LITERATURE
Our research builds on previous investigations that have reported consistent findings with our study results regarding abdominal fat volume and attenuation with CVD risk factor profiles (8,9,18–23). For example, individuals with greater increase in abdominal VAT volume showed substantial increase in incident metabolic risk factors, including hyperglycemia, high triglycerides, and low HDL cholesterol (18). Two prospective studies reported that increase in the change in abdominal VAT volume was associated with incident diabetes even after adjusting for weight change (19); and with incident hypertension after further adjusting for abdominal SAT volume change (20). Implementing radiographic imaging techniques to assess adipose tissue attenuation as a proxy of fat quality is a relatively newer measure (8,15,24,25). We have previously demonstrated the cross-sectional associations between lower attenuation of abdominal fat with adverse CVD risk factors (8), as well as longitudinal associations between baseline levels of abdominal fat quantity and quality with incidence and changes in CVD risk factors (9).
In addition to our primary finding, we identified an interesting signal in our study results, in which several CVD risk factors, including hypercholesterolemia and low HDL cholesterol, were associated only with VAT volume change, but not with SAT volume change. These findings correspond to the previous findings that higher VAT is detrimental, whereas higher SAT is protective of the cardiometabolic risk factors profile (26,27). Two large cohort studies documented that SAT and VAT are both associated with CVD risk factors. Yet, VAT was more closely associated with CVD risk factors, as opposed to SAT in both African-American (28) and white participants (3). Of interest, we have previously underscored the protective role of SAT by reporting lower levels of triglycerides with increasing SAT volume among participants with the highest VAT volume tertile (26). Collectively, our findings add to the growing body of literature by reporting the intriguing patterns between VAT, but not SAT, with CVD risk factors that are associated with lipid metabolism. This study may further support the prominent role of VAT that is intrinsically different than SAT in the manifestation of cardiometabolic disease. However, it should be noted that impaired fasting glucose was only associated with SAT volume change, but not with VAT volume change, which adds complexity to the pathogenic properties of abdominal adiposity tissue.
In conjunction with this investigation, we have recently published a study that examined associations between changes in body weight and changes in abdominal fat volume and attenuation during 6.1 years of follow-up (29). That study documented that increases in body weight were associated with decreases in both abdominal SAT and VAT attenuation, even after further adjusting for fat volume change. In the current study, we demonstrated that decreases in fat attenuation were associated with changes in CVD risk factors. Collectively, a decrease in fat attenuation may reflect adverse changes in fat quality, supported by the association with the increases in weight, as well as adverse changes in CVD risk factors. It should be recognized that fat attenuation is a dynamic aspect of the fat deposition. In particular, we have previously shown that the mean VAT attenuation increased in weight stable and weight loss groups; whereas VAT attenuation decreased in weight gain group only (29). In contrast, regardless of the type of weight change group, SAT attenuation decreased over time (29). In this present study, SAT attenuation was more likely to decrease than VAT attenuation, as shown by the decrease in mean SAT attenuation and increase in mean VAT attenuation during the follow-up. These data suggest that there is potential variability in the dynamic of fat attenuation between different types of abdominal adipose tissue. Further research is needed to explore the dynamic of CT fat attenuation as a measure of fat quality.
Overall, we extend the existing literature in several different ways. First, we expanded the study sample to encompass large numbers of women and men in a community-based setting. Second, our study incorporated a broader profile of CVD risk factors as clinical outcomes at baseline and follow-up for a more precise assessment. Third, a novel fat measurement assessed by CT attenuation was used to examine the long-term associations of the qualitative changes in abdominal adipose tissue with cardiometabolic risk.
POTENTIAL PHYSIOLOGICAL MECHANISMS
There are several potential mechanisms that may explain our findings regarding the quantitative and qualitative changes in abdominal adipose tissue with changes in CVD risk factors. First, the worsening fat quality along with the simultaneous increase in fat mass may manifest the development of cardiometabolic disease. Fat quantity and attenuation are closely linked, as the most distinctive changes in the state of positive energy balance are an expansion of the ectopic fat storage reservoir (i.e., adipocyte hyperplasia) along with the enlargement of the size of the individual adipose tissue cell (i.e., adipocyte hypertrophy) (30). Simultaneously, the adipose tissue remodeling process accompanies dysfunctional modification in the fat properties, such as abnormal excretion of anti- and proinflammatory adipokines (31,32), alteration in free fatty acid metabolism (33), poor vascularity (34), and cellular hypoxia (35). In the context of adipose tissue cellularity, a more negative attenuation of adipose tissue may correspond to higher lipid content (36), decreased lipolytic activity (37,38), poor vascularity (34), cellular hypoxia (35), and a larger adipocyte size (36). Thus, more negative attenuation of CT fat observed in this study may reflect worsening fat quality, which may concur with adipocyte hyperplasia and hypertrophy, and eventually leads to a higher risk of developing cardiometabolic disease (39).
Next, weight loss studies may provide insights into our results. These weight loss intervention studies have demonstrated that reduction in abdominal fat volume was associated with improvement in CVD risk factors (40–43), as well as improvement in fat quality, such as reduced adipocyte size (44,45). A reduction in subcutaneous fat cell diameter achieved after bariatric surgery showed stronger associations with improved insulin sensitivity, as compared to the decrease in fat mass (46). Taken together, these reversible associations of adipose tissue and CVD risk may support that both quantity and quality of the adipose tissue constitutes a major contributor for the development or prevention of CVD risk factor profiles.
IMPLICATIONS
The current study highlights the importance of quantitative and qualitative changes in adipose tissue over time for the changes in a broad array of traditional CVD risk profiles, with increased CVD risk observed with an increase in fat volume and decrease in fat attenuation.
Our study makes significant advances to the current literature by extending the understanding of the association between abdominal adiposity and metabolic risk factors. We have demonstrated that concomitant changes in both abdominal fat volume and attenuation are associated with concurrent incidence and changes in traditional CVD risk factors. Further studies are warranted to elucidate the histologic mechanisms that lie underneath the associations between concomitant changes of abdominal fat volume and attenuation with incident CVD risk factor profiles.
STUDY STRENGTHS AND LIMITATIONS
There are several strengths of this study. First, this study incorporated highly reproducible measures of abdominal adipose tissue volume and attenuation assessed by MDCT to subsequently explore incidence and changes in CVD risk profiles. Next, a comprehensive list of CVD risk factors was incorporated in this study. Finally, the baseline and follow-up measurements of CT-derived abdominal fat and CVD risk factors in between a mean interval of 6 years apart enable the assessment of longitudinal associations over time. Some limitations warrant mention. First, our design was observational, which limits causal inference of our findings. Second, abdominal CT fat attenuation was utilized as a proxy of fat quality. Thus, the significance of fat attenuation requires further research to understand its biological mechanism. Third, the study sample was comprised primarily of white individuals, thus generalization to other individuals with different racial or ethnic backgrounds cannot be made. Next, we did not perform interscan reproducibility, thus the values of the CT fat change during follow-up may have been affected by the interscan variability. Although a majority of our study results were statistically significant, the magnitude of the associations assessed via age- and sex-adjusted Pearson correlations indicate that the associations between the changes in fat and changes in CVD risk factors were relatively weak to modest. We observed differences in the characteristics of participants who were included and excluded from the study. This may have introduced an inherent bias in our study design.
CONCLUSIONS
In a large community- and population-based cohort, greater accumulation of abdominal fat volume and more negative changes in fat attention during follow-up were associated with increased incidence and adverse changes in CVD risk factors above and beyond generalized adiposity, central adiposity, and respective fat volumes. Our findings highlight the importance of quantitative and qualitative aspects of adipose tissue for a better understanding of CVD risk.
Supplementary Material
PERSPECTIVES.
COMPETENCY IN MEDICAL KNOWLEDGE
Increasing abdominal fat volume and decreasing fat attenuation (a measure of fat quality), as determined by MDCT scans, are associated with worsening CVD risk factors beyond associations with generalized or central adiposity.
TRANSLATIONAL OUTLOOK
Further studies are warranted to clarify the mechanisms that underlie these associations.
Acknowledgments
This work was supported by the National Heart, Lung and Blood Institute’s Framingham Heart Study (contract N01-HC-25195).
ABBREVIATIONS AND ACRONYMS
- BMI
body mass index
- CT
computed tomography
- CVD
cardiovascular disease
- HDL
high-density lipoprotein
- HU
Hounsfield units
- MDCT
multidetector computed tomography
- SAT
subcutaneous adipose tissue
- VAT
visceral adipose tissue
APPENDIX
For supplemental tables, please see the online version of this article.
Footnotes
The views expressed in this manuscript are those of the authors and do not necessarily represent the views of the National Heart, Lung, and Blood Institute; National Institutes of Health; or the U.S. Department of Health and Human Services.
All other authors have reported that they have no relationships relevant to the contents of this paper to disclose.
References
- 1.Mozaffarian D, Benjamin EJ, Go AS, et al. Heart disease and stroke statistics-2015 update: a report from the American Heart Association. Circulation. 2015;131:e29–322. doi: 10.1161/CIR.0000000000000152. [DOI] [PubMed] [Google Scholar]
- 2.Mathers CD, Loncar D. Projections of global mortality and burden of disease from 2002 to 2030. PLoS Med. 2006;3:e442. doi: 10.1371/journal.pmed.0030442. [DOI] [PMC free article] [PubMed] [Google Scholar]
- 3.Fox CS, Massaro JM, Hoffmann U, et al. Abdominal visceral and subcutaneous adipose tissue compartments: association with metabolic risk factors in the Framingham Heart Study. Circulation. 2007;116:39–48. doi: 10.1161/CIRCULATIONAHA.106.675355. [DOI] [PubMed] [Google Scholar]
- 4.Maurovich-Horvat P, Massaro J, Fox CS, et al. Comparison of anthropometric, area- and volume-based assessment of abdominal subcutaneous and visceral adipose tissue volumes using multidetector computed tomography. Int J Obes (Lond) 2007;31:500–6. doi: 10.1038/sj.ijo.0803454. [DOI] [PubMed] [Google Scholar]
- 5.Smith JD, Borel AL, Nazare JA, et al. Visceral adipose tissue indicates the severity of cardiometabolic risk in patients with and without type 2 diabetes: results from the INSPIRE ME IAA study. J Clin Endocrinol Metab. 2012;97:1517–25. doi: 10.1210/jc.2011-2550. [DOI] [PubMed] [Google Scholar]
- 6.Kurukulasuriya LR, Stas S, Lastra G, et al. Hypertension in obesity. Med Clin North Am. 2011;95:903–17. doi: 10.1016/j.mcna.2011.06.004. [DOI] [PubMed] [Google Scholar]
- 7.Ibrahim MM. Subcutaneous and visceral adipose tissue: structural and functional differences. Obes Rev. 2010;11:11–8. doi: 10.1111/j.1467-789X.2009.00623.x. [DOI] [PubMed] [Google Scholar]
- 8.Rosenquist KJ, Pedley A, Massaro JM, et al. Visceral and subcutaneous fat quality and cardiometabolic risk. J Am Coll Cardiol Img. 2013;6:762–71. doi: 10.1016/j.jcmg.2012.11.021. [DOI] [PMC free article] [PubMed] [Google Scholar]
- 9.Abraham TM, Pedley A, Massaro JM, et al. Association between visceral and subcutaneous adipose depots and incident cardiovascular disease risk factors. Circulation. 2015;132:1639–47. doi: 10.1161/CIRCULATIONAHA.114.015000. [DOI] [PMC free article] [PubMed] [Google Scholar]
- 10.Dawber TR, Kannel WB, Lyell LP. An approach to longitudinal studies in a community: the Framingham Study. Ann N Y Acad Sci. 1963;107:539–56. doi: 10.1111/j.1749-6632.1963.tb13299.x. [DOI] [PubMed] [Google Scholar]
- 11.Splansky GL, Corey D, Yang Q, et al. The Third Generation Cohort of the National Heart, Lung, and Blood Institute’s Framingham Heart Study: design, recruitment, and initial examination. Am J Epidemiol. 2007;165:1328–35. doi: 10.1093/aje/kwm021. [DOI] [PubMed] [Google Scholar]
- 12.Expert Panel on Detection, Evaluation, and Treatment of High Blood Cholesterol in Adults. Executive Summary of The Third Report of The National Cholesterol Education Program (NCEP) Expert Panel on Detection, Evaluation, And Treatment of High Blood Cholesterol In Adults (Adult Treatment Panel III) JAMA. 2001;285:2486–97. doi: 10.1001/jama.285.19.2486. [DOI] [PubMed] [Google Scholar]
- 13.Kannel WB, Sorlie P. Some health benefits of physical activity. The Framingham Study. Arch Intern Med. 1979;139:857–61. [PubMed] [Google Scholar]
- 14.Lee JJ, Britton KA, Pedley A, et al. Adipose tissue depots and their cross-sectional associations with circulating biomarkers of metabolic regulation. J Am Heart Assoc. 2016;5:e002936. doi: 10.1161/JAHA.115.002936. [DOI] [PMC free article] [PubMed] [Google Scholar]
- 15.Lee JJ, Pedley A, Hoffmann U, et al. Cross-sectional associations of computed tomography (CT)-derived adipose tissue density and adipokines: the Framingham Heart Study. J Am Heart Assoc. 2016;5:e002545. doi: 10.1161/JAHA.115.002545. [DOI] [PMC free article] [PubMed] [Google Scholar]
- 16.Levy D, Ehret GB, Rice K, et al. Genome-wide association study of blood pressure and hypertension. Nat Genet. 2009;41:677–87. doi: 10.1038/ng.384. [DOI] [PMC free article] [PubMed] [Google Scholar]
- 17.Cui JS, Hopper JL, Harrap SB. Antihypertensive treatments obscure familial contributions to blood pressure variation. Hypertension. 2003;41:207–10. doi: 10.1161/01.hyp.0000044938.94050.e3. [DOI] [PubMed] [Google Scholar]
- 18.Matsushita Y, Nakagawa T, Yamamoto S, et al. Effect of longitudinal changes in visceral fat area on incidence of metabolic risk factors: the Hitachi health study. Obesity (Silver Spring) 2013;21:2126–9. doi: 10.1002/oby.20347. [DOI] [PubMed] [Google Scholar]
- 19.Wander PL, Boyko EJ, Leonetti DL, et al. Change in visceral adiposity independently predicts a greater risk of developing type 2 diabetes over 10 years in Japanese Americans. Diabetes Care. 2013;36:289–93. doi: 10.2337/dc12-0198. [DOI] [PMC free article] [PubMed] [Google Scholar]
- 20.Sullivan CA, Kahn SE, Fujimoto WY, et al. Change in intra-abdominal fat predicts the risk of hypertension in Japanese Americans. Hypertension. 2015;66:134–40. doi: 10.1161/HYPERTENSIONAHA.114.04990. [DOI] [PMC free article] [PubMed] [Google Scholar]
- 21.Matsushita Y, Nakagawa T, Yamamoto S, et al. Effect of longitudinal changes in visceral fat area and other anthropometric indices to the changes in metabolic risk factors in Japanese men: the Hitachi Health Study. Diabetes Care. 2012;35:1139–43. doi: 10.2337/dc11-1320. [DOI] [PMC free article] [PubMed] [Google Scholar]
- 22.Rheaume C, Arsenault BJ, Dumas MP, et al. Contributions of cardiorespiratory fitness and visceral adiposity to six-year changes in cardiometabolic risk markers in apparently healthy men and women. J Clin Endocrinol Metab. 2011;96:1462–8. doi: 10.1210/jc.2010-2432. [DOI] [PubMed] [Google Scholar]
- 23.Shah RV, Murthy VL, Abbasi SA, et al. Visceral adiposity and the risk of metabolic syndrome across body mass index: the MESA Study. J Am Coll Cardiol Img. 2014;7:1221–35. doi: 10.1016/j.jcmg.2014.07.017. [DOI] [PMC free article] [PubMed] [Google Scholar]
- 24.Rosenquist KJ, Massaro JM, Pedley A, et al. Fat quality and incident cardiovascular disease, all-cause mortality, and cancer mortality. J Clin Endocrinol Metab. 2015;100:227–34. doi: 10.1210/jc.2013-4296. [DOI] [PMC free article] [PubMed] [Google Scholar]
- 25.Yeoh AJ, Pedley A, Rosenquist KJ, Hoffmann U, Fox CS. The association between subcutaneous Fat density and the propensity to store fat viscerally. J Clin Endocrinol Metab. 2015;100:E1056–64. doi: 10.1210/jc.2014-4032. [DOI] [PMC free article] [PubMed] [Google Scholar]
- 26.Porter SA, Massaro JM, Hoffmann U, et al. Abdominal subcutaneous adipose tissue: a protective fat depot? Diabetes Care. 2009;32:1068–75. doi: 10.2337/dc08-2280. [DOI] [PMC free article] [PubMed] [Google Scholar]
- 27.McLaughlin T, Lamendola C, Liu A, Abbasi F. Preferential fat deposition in subcutaneous versus visceral depots is associated with insulin sensitivity. J Clin Endocrinol Metab. 2011;96:E1756–60. doi: 10.1210/jc.2011-0615. [DOI] [PMC free article] [PubMed] [Google Scholar]
- 28.Liu J, Fox CS, Hickson DA, et al. Impact of abdominal visceral and subcutaneous adipose tissue on cardiometabolic risk factors: the Jackson Heart Study. J Clin Endocrinol Metab. 2010;95:5419–26. doi: 10.1210/jc.2010-1378. [DOI] [PMC free article] [PubMed] [Google Scholar]
- 29.Therkelsen KE, Pedley A, Rosenquist KJ, et al. Adipose tissue attenuation as a marker of adipose tissue quality: Associations with six-year changes in body weight. Obesity. 2015;24:499–505. doi: 10.1002/oby.21337. [DOI] [PMC free article] [PubMed] [Google Scholar]
- 30.Sun K, Kusminski CM, Scherer PE. Adipose tissue remodeling and obesity. J Clin Invest. 2011;121:2094–101. doi: 10.1172/JCI45887. [DOI] [PMC free article] [PubMed] [Google Scholar]
- 31.Ouchi N, Parker JL, Lugus JJ, Walsh K. Adipokines in inflammation and metabolic disease. Nat Rev Immunol. 2011;11:85–97. doi: 10.1038/nri2921. [DOI] [PMC free article] [PubMed] [Google Scholar]
- 32.Makki K, Froguel P, Wolowczuk I. Adipose tissue in obesity-related inflammation and insulin resistance: cells, cytokines, and chemokines. ISRN inflamm. 2013;2013:139239. doi: 10.1155/2013/139239. [DOI] [PMC free article] [PubMed] [Google Scholar]
- 33.Despres JP, Lemieux I. Abdominal obesity and metabolic syndrome. Nature. 2006;444:881–7. doi: 10.1038/nature05488. [DOI] [PubMed] [Google Scholar]
- 34.Furlan A, Fakhran S, Federle MP. Spontaneous abdominal hemorrhage: causes, CT findings, and clinical implications. AJR Am J Roentgenol. 2009;193:1077–87. doi: 10.2214/AJR.08.2231. [DOI] [PubMed] [Google Scholar]
- 35.Trayhurn P. Hypoxia and adipose tissue function and dysfunction in obesity. Physiol Rev. 2013;93:1–21. doi: 10.1152/physrev.00017.2012. [DOI] [PubMed] [Google Scholar]
- 36.Murphy RA, Register TC, Shively CA, et al. Adipose tissue density, a novel biomarker predicting mortality risk in older adults. J Gerontol A Biol Sci Med Sci. 2014;69:109–17. doi: 10.1093/gerona/glt070. [DOI] [PMC free article] [PubMed] [Google Scholar]
- 37.Baba S, Jacene HA, Engles JM, et al. CT Hounsfield units of brown adipose tissue increase with activation: preclinical and clinical studies. J Nucl Med. 2010;51:246–50. doi: 10.2967/jnumed.109.068775. [DOI] [PubMed] [Google Scholar]
- 38.Hu HH, Chung SA, Nayak KS, et al. Differential computed tomographic attenuation of metabolically active and inactive adipose tissues: preliminary findings. J Comput Assist. 2011;35:65–71. doi: 10.1097/RCT.0b013e3181fc2150. [DOI] [PMC free article] [PubMed] [Google Scholar]
- 39.Despres JP, Lemieux I, Bergeron J, et al. Abdominal obesity and the metabolic syndrome: contribution to global cardiometabolic risk. Arterioscler Thromb Vasc Biol. 2008;28:1039–49. doi: 10.1161/ATVBAHA.107.159228. [DOI] [PubMed] [Google Scholar]
- 40.Fujioka S, Matsuzawa Y, Tokunaga K, et al. Improvement of glucose and lipid metabolism associated with selective reduction of intra-abdominal visceral fat in premenopausal women with visceral fat obesity. Int J Obes. 1991;15:853–9. [PubMed] [Google Scholar]
- 41.Leenen R, van der Kooy K, Droop A, et al. Visceral fat loss measured by magnetic resonance imaging in relation to changes in serum lipid levels of obese men and women. Arterioscler Thromb. 1993;13:487–94. doi: 10.1161/01.atv.13.4.487. [DOI] [PubMed] [Google Scholar]
- 42.Kanai H, Tokunaga K, Fujioka S, et al. Decrease in intra-abdominal visceral fat may reduce blood pressure in obese hypertensive women. Hypertension. 1996;27:125–9. doi: 10.1161/01.hyp.27.1.125. [DOI] [PubMed] [Google Scholar]
- 43.Okauchi Y, Nishizawa H, Funahashi T, et al. Reduction of visceral fat is associated with decrease in the number of metabolic risk factors in Japanese men. Diabetes Care. 2007;30:2392–4. doi: 10.2337/dc07-0218. [DOI] [PubMed] [Google Scholar]
- 44.Albu JB, Heilbronn LK, Kelley DE, et al. Metabolic changes following a 1-year diet and exercise intervention in patients with type 2 diabetes. Diabetes. 2010;59:627–33. doi: 10.2337/db09-1239. [DOI] [PMC free article] [PubMed] [Google Scholar]
- 45.Schaefer EJ, Woo R, Kibata M, et al. Mobilization of triglyceride but not cholesterol or tocopherol from human adipocytes during weight reduction. Am J Clin Nutr. 1983;37:749–54. doi: 10.1093/ajcn/37.5.749. [DOI] [PubMed] [Google Scholar]
- 46.Andersson DP, Eriksson Hogling D, Thorell A, et al. Changes in subcutaneous fat cell volume and insulin sensitivity after weight loss. Diabetes Care. 2014;37:1831–6. doi: 10.2337/dc13-2395. [DOI] [PubMed] [Google Scholar]
Associated Data
This section collects any data citations, data availability statements, or supplementary materials included in this article.