

Abstract
Genetic polymorphisms in cytochrome P450 (CYP) genes can result in altered metabolic activity toward a plethora of clinically important medications. Thus, single nucleotide variants and copy number variations in CYP genes are major determinants of drug pharmacokinetics and toxicity and constitute pharmacogenetic biomarkers for drug dosing, efficacy, and safety. Strikingly, the distribution of CYP alleles differs considerably between populations with important implications for personalized drug therapy and healthcare programs. To provide a global distribution map of CYP alleles with clinical importance, we integrated whole‐genome and exome sequencing data from 56,945 unrelated individuals of five major human populations. By combining this dataset with population‐specific linkage information, we derive the frequencies of 176 CYP haplotypes, providing an extensive resource for major genetic determinants of drug metabolism. Furthermore, we aggregated this dataset into spectra of predicted functional variability in the respective populations and discuss the implications for population‐adjusted pharmacological treatment strategies.
1.
Study Highlights.
1.
WHAT IS THE CURRENT KNOWLEDGE ON THE TOPIC?
☑ The human CYP supergene family harbors a multitude of single nucleotide variants (SNVs) and copy number variations. The frequencies of these pharmacogenetically important polymorphisms have mostly been studied in relatively small populations.
WHAT QUESTION DID THIS STUDY ADDRESS?
☑ This study utilized next‐generation sequencing data from 56,945 unrelated individuals from five major populations to derive representative haplotype frequencies. In total, we report the frequencies of 176 alleles distributed over the 12 CYP genes with highest relevance for human drug metabolism and aggregate this dataset into worldwide patterns of predicted functional variability.
WHAT THIS STUDY ADDS TO OUR KNOWLEDGE
☑ Our analyses quantify the large extent of genetic variability between major populations on an unprecedented scale and reveal unexpectedly large interethnic differences. This genetic variability is expected to result in major functional differences, especially for the metabolism of CYP2C19, CYP2D6, and CYP3A substrates.
HOW THIS MIGHT CHANGE CLINICAL PHARMACOLOGY OR TRANSLATIONAL SCIENCE?
☑ This study reveals clinically interethnic differences in human drug metabolism that provide important information for the guidance of personalized drug therapy and the design of clinical trials.
2.
Drug response is highly variable between individuals, resulting in 40–70% of patients exhibiting a lack of efficacy of pharmacological treatment or adverse drug reactions.1, 2 Importantly, it is estimated that 15–30% of this variability is caused by genetic polymorphisms.2 Cytochrome P450 (CYP) enzymes and their roles in drug metabolism have been extensively studied and constitute major determinants of drug response, as they are responsible for 80% of phase 1 drug metabolism and 65–70% of drug clearance.3, 4 Furthermore, metabolism by polymorphic phase 1 enzymes, primarily CYPs, has been implicated in an increased risk of drugs to cause adverse drug reactions.5
The human CYP supergene family consists of 57 genes, however, 12 of the encoded enzymes are responsible for more than 75% of all phase 1 drug oxidation reactions.4 Importantly, these CYP genes are highly polymorphic and harbor a large repertoire of single nucleotide variants (SNVs) and copy number variations. This diversity is primarily based on low evolutionary constraints due to the lack of essential endogenous functions of the encoded gene products and genetic drift. Yet, although the vast majority of such polymorphisms are rare with minor allele frequencies (MAFs) <1%,6 pharmacogenetic testing in the clinics is currently restricted to validated and experimentally characterized variants for the derivation of qualified predictions about phenotypic consequences of the observed genetic variation patterns.7
Each variant is identified by its genomic coordinate in comparison to a curated reference sequence and is named according to the Human Genome Variation Society nomenclature, which represents the current standard in clinical diagnostics.8 Furthermore, each SNV, microdeletion, or insertion of <50 bp that has been observed in multiple genomes is assigned a unique rs number by database‐single‐nucleotide polymorphism, which identifies the respective variant. On the basis of this variant information, a unified and standardized CYP allele nomenclature system was established that integrates variant combinations into more accessible and human readable haplotypes designated by “star alleles.” This system is made available to the research community through a peer‐reviewed, regularly updated website9 (http://www.cypalleles.ki.se).
In the last decades, a plethora of studies analyzed the links between genetic variants in CYP genes and drug responses. Although these studies have provided important information about the frequencies of clinically important CYP allele variants and their interethnic differences,10, 11 their significance is limited due to their relatively small sample sizes and their focus on small, nonstandardized panels of specific variants of interest. Recently, the increasing dissemination of next‐generation sequencing technologies and the implementation of population‐scale sequencing projects presents a paradigm shift that allows to derive a comprehensive and consolidated overview of the genetic diversity and interethnic variability of CYP alleles across worldwide populations.
By integrating exome sequencing data from 56,945 unrelated individuals provided by the Exome Aggregation Consortium with whole genome and linkage information from the 1000 Genomes Project, we derive representative frequencies12, 13 of 176 alleles distributed over the 12 CYP genes with highest relevance for human drug metabolism in five major populations (Europeans, Africans, South Asians, East Asians, and admixed Americans). The resulting data, to our knowledge, is the most comprehensive overview of CYP allele distributions published to date and provides important information for the guidance of population‐specific genotyping strategies.
3. RESULTS
In this study, we analyzed the prevalence of 176 alleles distributed over the 12 CYP genes that jointly account for >75% of human phase 1 drug metabolism.4 In CYP2A6, we analyzed a total of 23 variants, of which 10 are rare in every population analyzed (Figure 1 a, Table 1). CYP2A6*17 (MAF = 11.2%), CYP2A6*23 (MAF = 1.5%), CYP2A6*25 (MAF = 1.4%), and CYP2A6*28 (MAF = 2%) are only identified in Africans, whereas East Asians are the only population to harbor CYP2A6*7 (MAF = 12.9%) and CYP2A6*19 (MAF = 1.2%). CYP2A6*9 is the most abundant allele in both Asian populations and admixed Americans accounting for 33.3%, 42%, and 49.2% of all variant alleles, respectively, whereas CYP2A6*35 is the most abundant variant in Europeans (42.1% of all variants). Frequencies of the deletion allele CYP2A6*4 could not be derived from exome sequencing data and, therefore, we used previously published data to approximate CYP2A6*4 frequencies in the respective populations.14, 15
Figure 1.
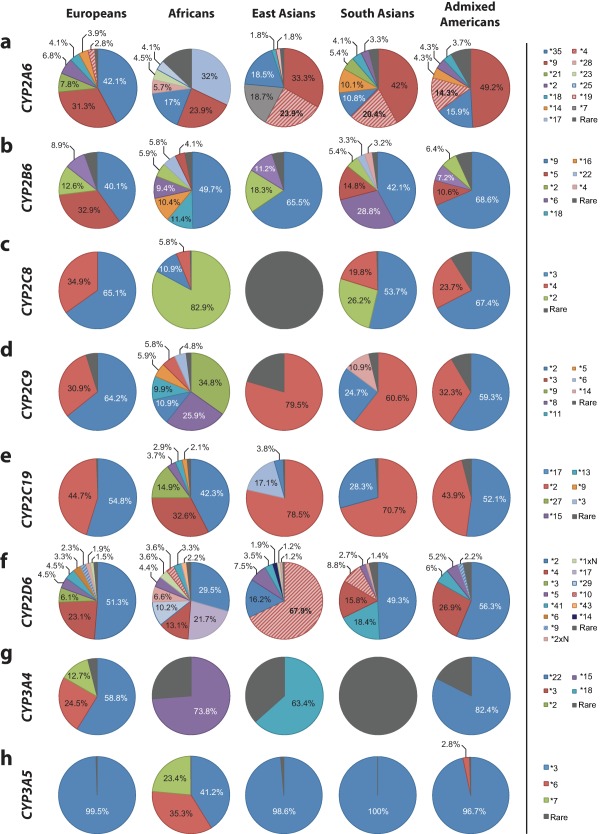
Distribution of the relative contributions of major cytochrome P450 (CYP) alleles in European, African, Asian, and American populations. Pie charts showing the relative contribution of common variants in CYP2A6 (a), CYP2B6 (b), CYP2C8 (c), CYP2C9 (d), CYP2C19 (e), CYP2D6 (f), CYP3A4 (g), and CYP3A5 (h) in five major populations. Only variants with a minor allele frequency in the respective population above 1% are shown, whereas all other variants analyzed in this study are summarized as “rare” (grey).
Table 1.
Important variant and allele frequencies of the human CYP2A6 gene
| Allele | Defining variants | Variant type | Allele frequencies in indicated populations, % | Functional consequence | ||||
|---|---|---|---|---|---|---|---|---|
| EUR | AFR | EAS | SAS | AMR | ||||
| *1 | None | 64.6 | 65.1 | 30.8 | 65.6 | 71.9 | Normal | |
| *2 | rs1801272 | Missense (L160H) | 2.3 | 0.5 | 0 | 1.1 | 1.2 | Inactive |
| *4 | CYP2A6 deleted | 1 | 1.5 | 17 | 7 | 4 | Inactive | |
| *5 | rs5031017 | Missense (G479V) | 0 | <0.1 | 0.1 | <0.1 | < 0.1 | Inactive |
| *6 | rs4986891 | Missense (R128Q) | 0 | 0 | <0.1 | 0 | 0 | Decreaseda |
| *7 | rs5031016 | Missense (I471T) | <0.1 | <0.1 | 12.9 | 0.3 | 0.3 | Decreaseda |
| *8 | rs28399468 | Missense (R485L) | 0.3 | 0.3 | 0.3 | 0.3 | 0.3 | Normal |
| *9 | rs28399433 | TATA box | 11.1 | 8.3 | 23.0 | 14.4 | 13.8 | Decreased |
| *10 | rs5031016, rs28399468 | Missense (I471T, R485L) | <0.1 | <0.1 | 0.3 | 0.3 | 0.3 | Decreasedb |
| *14 | rs28399435 | Missense (S29N) | 1.4 | 0.8 | <0.1 | 3.5 | 1.2 | |
| *16 | rs56256500 | Missense (R203S) | 0 | <0.1 | 0 | <0.1 | <0.1 | |
| *17 | rs28399454 | Missense (V365M) | 0 | 11.2 | 0 | 0 | 0.6 | Decreased |
| *18 | rs1809810 | Missense (Y392F) | 1.5 | 0.6 | 1.2 | 1.4 | 1.1 | Decreaseda |
| *19 | rs5031016, rs1809810 | Missense (I471T, Y392F) | <0.1 | <0.1 | 1.2 | 0.3 | 0.3 | |
| *21 | rs6413474 | Missense (K476R) | 2.8 | 0.2 | <0.1 | 1.9 | 0.3 | Decreasedb |
| *22 | rs60605885, rs60563539 | Missense (D158E, L160I) | 0 | 0 | 0 | 0 | <0.1 | |
| *23 | rs56256500 | Missense (R203C) | 0 | 1.5 | 0 | <0.1 | <0.1 | Decreased |
| *24 | rs143731390, rs72549435 | Missense (N438Y, V110L) | 0 | 0.9 | <0.1 | <0.1 | <0.1 | |
| *25 | rs28399440 | Missense (F118L) | 0 | 1.4 | 0 | 0 | 0 | |
| *26 | rs59552350 | Missense (S131A) | 0 | 0.4 | 0 | 0 | 0 | Decreased |
| *28 | rs28399463, rs8192730 | Missense (N418D, E419D) | 0 | 2 | 0.1 | <0.1 | 0.2 | |
| *35 | rs143731390 | Missense (N438Y) | 14.9 | 5.9 | 12.8 | 3.7 | 4.5 | Decreased |
| *39 | rs143690364 | Missense (V68M) | 0 | <0.1 | 0 | <0.1 | 0 | Decreasedb |
| *41 | rs140471703 | Missense (R265Q) | 0 | 0.2 | <0.1 | 0 | <0.1 | Inactive |
AFR, Africans; AMR, admixed Americans; CYP, cytochrome P450; EAS, East Asians; EUR, Europeans; SAS, South Asians.
For references describing the functional characterization of the indicated alleles, see http://www.cypalleles.ki.se.
Indicates alleles whose functionality assessment is based solely on in vitro data.
Indicates alleles whose functionality assessment is based solely on in vivo data.
We assessed 25 CYP2B6 alleles of which 8 are common in at least one population analyzed (Figure 1 b, Table 2). CYP2B6*18 (MAF = 7.1%) and CYP2B6*16 (MAF = 6.5%) are restricted to Africans and CYP2B6*4 is only common in South Asian populations (MAF = 1.8%). CYP2B6*9 is the most abundant allele in all populations analyzed accounting for 40.1–68.6% of all variants in the major populations. CYP2B6*5 is highly abundant in Europeans (MAF = 12.8%), less prevalent in Africans (MAF = 2.6%), South Asians (MAF = 8.2%), and admixed Americans (MAF = 4.5%), and virtually absent in East Asians. Notably, the variant rs2279343, which defines CYP2B6*4 and is part of CYP2B6*6, was not called in the 1000 Genome Project and, therefore, no linkages with this variant could be computed. Thus, to derive information about the CYP2B6*4 and *6 haplotype frequencies, we estimated the co‐occurrence of the two variants based on previous studies (90% of rs2279343 in combination with rs3745274 as CYP2B6*6 and 10% without rs3745274 as CYP2B6*4).16
Table 2.
Important variant and allele frequencies of the human CYP2B6 gene
| Allele | Defining variants | Variant type | Allele frequencies in indicated populations, % | Functional consequence | ||||
|---|---|---|---|---|---|---|---|---|
| EUR | AFR | EAS | SAS | AMR | ||||
| *1 | None | 61.1 | 37.9 | 75.5 | 45 | 57.8 | Normal | |
| *2 | rs8192709 | Missense (R22C) | 4.9 | 3.7 | 4.5 | 3.0 | 2.9 | |
| *3 | rs45482602 | Missense (S259R) | <0.1 | <0.1 | 0 | 0.3 | 0.1 | |
| *4 | rs2279343 | Missense (K262R) | 0.4 | 0.6 | 0.3 | 1.8 | 0.3 | Increasedb |
| *5 | rs3211371 | Missense (R487C) | 12.8 | 2.6 | 0.1 | 8.2 | 4.5 | |
| *6 | rs2279343, rs3745274 | Missense (K262R, Q172H) | 3.4 | 5.8 | 2.7 | 15.8 | 3 | Decreased |
| *7 | rs2279343, rs3745274, rs3211371 | Missense (K262R, Q172H, R487C) | 0 | 0 | 0 | 0 | 0 | |
| *8 | rs12721655 | Missense (K139E) | <0.1 | <0.1 | 0 | <0.1 | <0.1 | Decreaseda |
| *9 | rs3745274 | Missense (Q172H) | 15.6 | 30.9 | 16 | 23.2 | 29 | |
| *10 | rs8192709, rs34883432 | Missense (R22C, Q21L) | <0.1 | <0.1 | 0 | 0.1 | 0.3 | |
| *11 | rs35303484 | Missense (M46V) | <0.1 | 0.1 | 0 | 0.2 | 0.1 | Decreaseda |
| *12 | rs36060847 | Missense (G99E) | 0 | <0.1 | 0 | 0 | <0.1 | Decreaseda |
| *13 | rs2279343, rs3745274, rs12721655 | Missense (K262R, Q172H, K139E) | <0.1 | <0.1 | 0 | <0.1 | <0.1 | |
| *14 | rs35773040 | Missense (R140Q) | 0.5 | <0.1 | <0.1 | 0.3 | <0.1 | Decreaseda |
| *15 | rs35979566 | Missense (I391N) | 0.2 | 0.2 | 0 | <0.1 | 0.2 | Decreaseda |
| *16 | rs2279343 & rs28399499 | Missense (I328T) | 0 | 6.5 | 0 | <0.1 | 0.3 | Decreased |
| *17 | rs33973337, rs33980385, rs33926104 | Missense (T26S, D28G, R29T) | 0 | <0.1 | 0 | 0 | 0 | |
| *18 | rs28399499 | Missense (I328T) | 0 | 7.1 | 0 | <0.1 | 0.3 | Decreaseda |
| *19 | rs34826503 | Missense (R336C) | 0 | 0.3 | <0.1 | 0 | <0.1 | Decreaseda |
| *20 | rs36056539 | Missense (T168I) | 0 | 0.1 | 0 | 0 | <0.1 | Decreaseda |
| *21 | rs35010098 | Missense (P428T) | 0 | <0.1 | 0 | 0 | 0 | Decreaseda |
| *22 | rs34223104 | Regulatory | 0.9 | 3.6 | 0.2 | 1.8 | 0.7 | Increaseda |
| *23 | rs3211369 | Missense (M459V) | 0 | 0 | <0.1 | <0.1 | 0 | |
| *26 | rs2279343, rs3745274, rs3826711 | Missense (K262R, Q172H, P167A) | 0 | 0 | 0.5 | 0 | 0 | Decreasedb |
| *27 | rs36079186 | Missense (M198T) | 0 | 0.2 | 0 | 0.1 | <0.1 | Decreaseda |
| *28 | rs34097093 | Stop‐gain (R378X) | 0 | <0.1 | 0 | 0 | <0.1 | Inactive |
AFR, Africans; AMR, admixed Americans; CYP, cytochrome P450; EAS, East Asians; EUR, Europeans; SAS, South Asians.
For references describing the functional characterization of the indicated alleles, see http://www.cypalleles.ki.se.
Indicates alleles whose functionality assessment is based solely on in vitro data.
Indicates alleles whose functionality assessment is based solely on in vivo data.
Only three of nine CYP2C8 alleles are common in at least one of the super populations assessed (Figure 1 c, Table 3). In Europeans and admixed American populations, only CYP2C8*3 (MAF = 11.2% and 6.7% in Europeans and Americans, respectively) and CYP2C8*4 (MAF = 6% and 2.3% in Europeans and Americans, respectively) are common. In contrast, CYP2C8*2 constitutes the most prevalent allele in Africans (MAF = 15.9%, corresponding to 82.9% of all variant CYP2C8 alleles in Africans) but is not detected in Europeans and East Asians. Surprisingly, CYP2C8 is largely invariant in populations in East Asia and no variant with an allele frequency >1% was detected. This is in pronounced contrast to South Asian populations, in which the *2 (MAF = 1.9%), *3 (MAF = 4%), and *4 (MAF = 1.5%) alleles are common.
Table 3.
Important variant and allele frequencies of important pharmacogenes in the human CYP2C family
| Allele | Defining variants | Variant type | Allele frequencies in indicated populations, % | Functional consequence | ||||
|---|---|---|---|---|---|---|---|---|
| EUR | AFR | EAS | SAS | AMR | ||||
| CYP2C8 | ||||||||
| *1 | None | 82.8 | 80.8 | 98.7 | 92.6 | 90.1 | Normal | |
| *2 | rs11572103 | Missense (I269F) | 0 | 15.9 | 0 | 1.9 | 0.9 | Decreaseda |
| *3 | rs10509681, rs11572080 | Missense (K399R, R139K) | 11.2 | 2.1 | <0.1 | 4 | 6.7 | Decreaseda |
| *4 | rs1058930 | Missense (I264M) | 6.0 | 1.1 | 0 | 1.5 | 2.3 | Decreaseda |
| *5 | rs72558196 | Frameshift | 0 | 0 | 0.2 | 0 | 0 | Inactive |
| *6 | rs142886225 | Missense (G171S) | 0 | 0 | 0.5 | 0 | 0 | Normal |
| *7 | rs72558195 | Stop‐gain (R186X) | 0 | <0.1 | <0.1 | <0.1 | 0 | Inactive |
| *11 | rs78637571 | Stop‐gain (E274X) | 0 | 0 | 0.4 | 0 | <0.1 | Inactive |
| *12 | rs3832694 | Inframe deletion (461delV) | 0 | 0 | <0.1 | 0 | 0 | |
| *14 | rs188934928 | Missense (A238P) | 0 | 0 | 0.1 | <0.1 | 0 | Decreaseda |
| CYP2C9 | ||||||||
| *1 | None | 81.8 | 78.4 | 95.7 | 81.3 | 88.9 | Normal | |
| *2 | rs1799853 | Missense (R144C) | 11.7 | 2.4 | <0.1 | 4.6 | 6.6 | Decreaseda |
| *3 | rs1057910 | Missense (I359L) | 5.6 | 1.3 | 3.4 | 11.3 | 3.6 | Decreased |
| *4 | rs56165452 | Missense (I359T) | 0 | <0.1 | 0 | 0 | 0 | |
| *5 | rs28371686 | Missense (D360E) | 0 | 1.3 | 0 | 0 | <0.1 | Decreased |
| *6 | rs9332131 | Frameshift | 0 | 1 | 0 | 0 | <0.1 | Inactive |
| *7 | rs67807361 | Missense (L19I) | 0 | 0 | 0 | 0.3 | 0 | |
| *8 | rs7900194 | Missense (R150H) | 0 | 5.6 | <0.1 | <0.1 | 0.2 | Decreased |
| *9 | rs2256871 | Missense (H251R) | 0 | 7.5 | <0.1 | <0.1 | 0.2 | |
| *11 | rs28371685 | Missense (R335W) | 0.5 | 2.1 | <0.1 | 0.2 | 0.2 | Decreased |
| *12 | rs9332239 | Missense (P489S) | 0.2 | <0.1 | 0 | <0.1 | 0.1 | |
| *13 | rs72558187 | Missense (L90P) | 0 | 0 | 0.2 | 0 | 0 | Decreased |
| *14 | rs72558189 | Missense (R125H) | 0 | <0.1 | <0.1 | 2.0 | <0.1 | |
| *15 | rs72558190 | Stop‐gain (S162X) | 0 | 0 | <0.1 | 0 | 0 | |
| *16 | rs72558192 | Missense (T299A) | 0 | 0 | 0.3 | 0 | 0 | |
| *29 | rs182132442 | Missense (P279T) | 0.1 | 0 | 0.2 | <0.1 | <0.1 | |
| *30 | rs781583846 | Missense (A477T) | <0.1 | <0.1 | <0.1 | <0.1 | <0.1 | |
| *31 | rs57505750 | Missense (I327T) | 0 | 0.2 | 0 | 0 | 0 | |
| *33 | rs200183364 | Missense (R132Q) | 0 | <0.1 | 0 | <0.1 | 0 | |
| *36 | rs114071557 | Start lost | 0 | 0.2 | <0.1 | <0.1 | <0.1 | |
| *42 | rs12414460 | Missense (R124Q) | <0.1 | <0.1 | <0.1 | 0 | <0.1 | |
| *44 | rs200965026 | Missense (T130M) | 0 | 0 | <0.1 | 0 | <0.1 | |
| *45 | rs199523631 | Missense (R132W) | <0.1 | <0.1 | 0 | < 0.1 | <0.1 | |
| CYP2C19 | ||||||||
| *1 | None | 59.2 | 44.5 | 60.5 | 51.9 | 77 | Normal | |
| *2 | rs4244285 | Splicing defect | 18.3 | 18.1 | 31.0 | 34.0 | 10.1 | Inactive |
| *3 | rs4986893 | Stop‐gain (W212X) | <0.1 | <0.1 | 6.7 | 0.4 | <0.1 | Inactive |
| *4 | rs28399504 | Start lost | 0 | <0.1 | <0.1 | <0.1 | 0.2 | Inactive |
| *5 | rs56337013 | Missense (R433W) | 0 | 0 | 0 | <0.1 | 0 | Inactive |
| *6 | rs72552267 | Missense (R132Q) | 0 | 0 | <0.1 | 0 | <0.1 | Inactive |
| *7 | rs72558186 | Splicing defect | 0 | 0 | 0 | <0.1 | 0 | Inactiveb |
| *8 | rs41291556 | Missense (W120R) | <0.1 | <0.1 | 0 | <0.1 | <0.1 | Inactive |
| *9 | rs17884712 | Missense (R144H) | 0 | 1.2 | 0 | <0.1 | <0.1 | |
| *10 | rs6413438 | Missense (P227L) | 0 | 0.4 | <0.1 | 0 | <0.1 | Decreaseda |
| *12 | rs55640102 | Stop‐lost (X491C) | 0 | <0.1 | 0 | 0 | 0 | Decreaseda |
| *13 | rs17879685 | Missense (R410C) | 0 | 1.6 | 0 | <0.1 | 0.1 | |
| *15 | rs17882687 | Missense (I19L) | 0 | 2.0 | 0 | <0.1 | <0.1 | |
| *16 | rs192154563 | Missense (R442C) | 0 | <0.1 | 0 | <0.1 | 0 | |
| *17 | rs12248560 | Regulatory | 22.4 | 23.5 | 1.5 | 13.6 | 12.0 | Increased |
| *22 | rs140278421 | Missense (R186P) | 0 | 0.1 | 0 | 0 | <0.1 | |
| *23 | rs118203756 | Missense (G91R) | 0 | 0 | <0.1 | 0 | 0 | |
| *24 | rs118203757 | Missense (R335Q) | 0 | <0.1 | 0 | <0.1 | <0.1 | |
| *25 | rs118203759 | Missense (F448L) | 0 | 0 | 0 | 0 | 0 | |
| *27 | rs7902257 | Regulatory | 0.1 | 8.3 | 0.1 | 0 | 0.3 | Decreaseda |
AFR, Africans; AMR, admixed Americans; CYP, cytochrome P450; EAS, East Asians; EUR, Europeans; SAS, South Asians.
For references describing the functional characterization of the indicated alleles, see http://www.cypalleles.ki.se.
Indicates alleles whose functionality assessment is based solely on in vitro data.
Indicates alleles whose functionality assessment is based solely on in vivo data.
Genetic variability of CYP2C9 is dominated by the *2 allele in Europeans (MAF = 11.7%) and admixed Americans (MAF = 6.6%), whereas the major alleles in Asian populations and Africans are *3 (MAF = 3.4% in East Asians and 11.3% in South Asians) and *9 (MAF = 7.5%), respectively (Figure 1 d, Table 3). The spectrum of CYP2C9 variants is highly population‐specific with CYP2C9*5, *6, *8, *9, and *11 being restricted to African populations and CYP2C9*14 being almost uniquely identified in South Asians.
Overall, we analyzed 19 variants in CYP2C19, of which CYP2C19*17, and CYP2C19*2 are the major variants (Figure 1 e, Table 3). In Europeans, Africans, and admixed Americans, the *17 promoter variant, which results in increased CYP2C19 transcription most probably due to the modulation of GATA4 binding,17, 18 is most abundant, accounting for 42–55% of all variant alleles, whereas the *2 loss‐of‐function variant that causes aberrant splicing is most prevalent in Asian populations (78.5% and 70.7% of all variant alleles in East and South Asians, respectively). Further CYP2C19 alleles are highly specific to individual populations. The stop‐gain variant CYP2C19*3 is abundant exclusively in East Asians (MAF = 6.7%), whereas CYP2C19*9 (MAF = 1.2%), *13 (MAF = 1.6%), *15 (MAF = 2%), and *27 (MAF = 8.3%) are restricted to Africans.
The CYP2D6 gene locus is complex and highly polymorphic, harboring a multitude of common genetic variants with clinical importance (Figure 1 f, Table 4). The CYP2D6*2 allele is most abundant in European, African, South Asian, and admixed American populations and the most prevalent haplotype worldwide. The variant defining CYP2D6*4 (rs3892097), which causes a splicing defect and inactivation of the CYP2D6 gene product, is present in all analyzed populations with MAFs between 11.6% and 15.7%, except in East Asians in which the frequency of the allele was <1%. CYP2D6*10 is almost exclusively found in African, South Asian, and, most notably, East Asian populations in which *10 constitutes the most common CYP2D6 allele (MAF = 58.7%). CYP2D6*3 (MAF = 4.1%) and CYP2D6*6 (MAF = 2.2%) are only found in individuals of European ancestry. CYP2D6*17 (MAF = 19.7%), CYP2D6*29 (MAF = 9.2%), and CYP2D6*43 (MAF = 2%) are distinctive haplotypes for Africans and CYP2D6*14 was only found in East Asian populations (MAF = 1.6%). As quantification of certain genetic rearrangements can be difficult to assess with short‐read sequencing based methodologies, we included frequency information for the duplicated alleles CYP2D6*1xN and CYP2D6*2xN as well as for the deletion CYP2D6*5 from the published literature. Duplications of CYP2D6 occur with frequencies of 1–2% in whites and Asians but are more common in certain African populations, in which their frequency can be up to 29%, as previously reported.19, 20 For deletions of CYP2D6, we assumed frequencies between 1% and 7% for the analyzed populations based on previous extensive meta‐analyses.20
Table 4.
Important variant and allele frequencies of the human CYP2D6 gene
| Allele | Defining variants | Variant type | Allele frequencies in indicated populations, % | Functional consequence | ||||
|---|---|---|---|---|---|---|---|---|
| EUR | AFR | EAS | SAS | AMR | ||||
| *1 | None | 33.1 | 9.3 | 13.6 | 25.8 | 40.2 | Normal | |
| *1xN | Amplification of *1 | 1 | 3.3 | 1 | 0.5 | 0.5 | Increased | |
| *2 | rs16947, rs1135840 | Missense (R296C, S486T) | 34.3 | 26.7 | 14 | 36.2 | 32.7 | Normal |
| *2xN | Amplification of *2 | 1.3 | 6 | 1 | 1 | 0.5 | Increased | |
| *3 | rs35742686 | Frameshift | 4.1 | 0.3 | 0 | 0.1 | 0.3 | Inactive |
| *4 | rs3892097 | Splicing defect | 15.5 | 11.9 | 0.4 | 11.6 | 15.7 | Inactive |
| *5 | CYP2D6 deleted | 3 | 4 | 6.5 | 2 | 3 | Inactive | |
| *6 | rs5030655 | Frameshift | 2.2 | 0.3 | 0 | 0.1 | 0.4 | Inactive |
| *7 | rs5030867 | Missense (H324P) | 0 | <0.1 | 0 | 0.8 | <0.1 | Inactiveb |
| *8 | rs5030865 | Stop‐gain (G169X) | 0 | <0.1 | 0 | <0.1 | 0 | Inactive |
| *9 | rs5030656 | Inframe deletion (K281del) | 1.6 | 0.4 | 0 | 0.2 | 1.3 | Decreased |
| *10 | rs1065852, rs1135840 | Missense (P34S, S486T) | 0.2 | 3.2 | 58.7 | 6.5 | 0 | Decreased |
| *11 | rs201377835 | Splicing defect | 0 | <0.1 | 0 | 0 | 0 | Inactiveb |
| *12 | rs5030862 | Missense (G42R) | 0 | <0.1 | 0 | 0 | 0 | Inactive |
| *14 | rs5030865 | Missense (G169R) | 0 | 0 | 1.6 | <0.1 | 0 | Inactive |
| *17 | rs16947, rs28371706 | Missense (R296C, T107I) | <0.1 | 19.7 | 0 | 0.1 | 0.7 | Decreased |
| *29 | rs16947, rs1135840, rs61736512, rs59421388 | Missense (R296C, S486T, V136I, V338M) | 0 | 9.2 | <0.1 | <0.1 | 0.4 | Decreased |
| *33 | rs28371717 | Missense (A237S) | 0.7 | 0.2 | 0 | 0.7 | 0.1 | Normal |
| *41 | rs28371725 | Splicing defect | 3.0 | 3.0 | 3.0 | 13.5 | 3.5 | Decreased |
| *42 | rs72549346 | Frameshift | 0 | 0.2 | 0 | 0 | <0.1 | Inactive |
| *43 | rs28371696 | Missense (R26H) | <0.1 | 2.0 | <0.1 | 0.8 | 0.2 | |
| *53 | rs1135822, rs1135823 | Missense (F120I, A122S) | 0 | <0.1 | <0.1 | <0.1 | 0.5 | Increaseda |
| *62 | rs730882171 | Missense (R441C) | <0.1 | <0.1 | <0.1 | <0.1 | <0.1 | Inactive |
AFR, Africans; AMR, admixed Americans; CYP, cytochrome P450; EAS, East Asians; EUR, Europeans; SAS, South Asians.
For references describing the functional characterization of the indicated alleles, see http://www.cypalleles.ki.se.
Indicates alleles whose functionality assessment is based solely on in vitro data.
Indicates alleles whose functionality assessment is based solely on in vivo data.
CYP3A4, which metabolizes around one‐third of all medications4 as well as endogenous steroid hormones, harbors only few common genetic variants (Figure 1 g, Table 5). Of the 19 CYP3A4 variants we assessed, only 5 were common in at least one of the major populations. In Europeans and admixed Americans, CYP3A4*22 is the major allele (MAF = 5% and 2.6%, respectively) with *3 and *2 contributing to the genetic variability in the former. In contrast, CYP3A4*15 (MAF = 2.5%) and CYP3A4*18 (MAF = 1.9%) constitute the only common CYP3A4 alleles in Africans and East Asians, respectively. In South Asian populations, no common CYP3A4 variant with MAFs >1% are present.
Table 5.
Important variant and allele frequencies of important pharmacogenes in the human CYP3A family
| Allele | Defining variants | Variant type | Allele frequencies in indicated populations (in %) | Functional consequence | ||||
|---|---|---|---|---|---|---|---|---|
| EUR | AFR | EAS | SAS | AMR | ||||
| CYP3A4 | ||||||||
| *1 | None | 91.5 | 96.6 | 97 | 99.1 | 96.9 | Normal | |
| *2 | rs55785340 | Missense (S222P) | 1.1 | 0 | 0 | 0 | 0 | |
| *3 | rs4986910 | Missense (M445T) | 2.1 | 0.1 | 0 | 0 | 0.2 | |
| *4 | rs55951658 | Missense (I118V) | 0 | 0 | 0.6 | <0.1 | <0.1 | |
| *5 | rs55901263 | Missense (P218R) | 0 | 0 | <0.1 | 0 | 0 | |
| *6 | rs4646438 | Frameshift | 0 | 0 | 0.2 | <0.1 | <0.1 | |
| *7 | rs56324128 | Missense (G56D) | 0.1 | 0 | 0 | 0 | 0 | |
| *8 | rs72552799 | Missense (R130Q) | 0.1 | 0 | 0 | <0.1 | <0.1 | Decreaseda |
| *9 | rs72552798 | Missense (V170I) | 0 | 0 | 0 | 0 | <0.1 | |
| *10 | rs4986908 | Missense (D174H) | <0.1 | 0.2 | <0.1 | 0.1 | <0.1 | |
| *11 | rs67784355 | Missense (T363M) | 0 | <0.1 | <0.1 | <0.1 | 0 | Decreaseda |
| *12 | rs12721629 | Missense (L373F) | 0 | 0.3 | 0 | <0.1 | <0.1 | |
| *13 | rs4986909 | Missense (P416L) | 0 | 0 | 0 | 0 | <0.1 | Decreaseda |
| *15 | rs4986907 | Missense (R162Q) | 0 | 2.5 | 0 | <0.1 | 0.2 | |
| *16 | rs12721627 | Missense (T185S) | 0 | 0 | 0.1 | 0 | 0 | Decreaseda |
| *18 | rs28371759 | Missense (L293P) | 0 | 0.2 | 1.9 | 0 | <0.1 | Decreased |
| *19 | rs4986913 | Missense (P467S) | 0 | 0 | 0 | <0.1 | 0 | |
| *20 | rs67666821 | Frameshift | 0 | <0.1 | 0 | 0 | <0.1 | Inactive |
| *22 | rs35599367 | Intronic | 5.0 | <0.1 | 0 | 0.6 | 2.6 | Decreasedb |
| *26 | rs138105638 | Stop‐gain (R268X) | 0 | <0.1 | 0 | <0.1 | <0.1 | Inactive |
| CYP3A5 | ||||||||
| *1 | None | 5.3 | 56.3 | 27.7 | 33.2 | 17.5 | Normal | |
| *2 | rs28365083 | Missense (T398N) | 0.1 | <0.1 | 0 | 0 | <0.1 | |
| *3 | rs776746 | Splicing defect | 94.3 | 18.0 | 71.3 | 66.8 | 79.7 | Inactive |
| *4 | rs56411402 | Missense (Q200R) | 0 | 0 | 0.3 | 0 | 0 | |
| *5 | rs55965422 | Splicing defect | 0 | 0 | 0.7 | <0.1 | 0 | |
| *6 | rs10264272 | Splicing defect | 0.3 | 15.4 | 0 | 0 | 2.3 | Inactive |
| *7 | rs41303343 | Frameshift | 0 | 10.3 | <0.1 | <0.1 | 0.4 | |
| *8 | rs55817950 | Missense (R28C) | 0 | 0 | <0.1 | 0 | 0 | Decreaseda |
AFR, Africans; AMR, admixed Americans; CYP, cytochrome P450; EAS, East Asians; EUR, Europeans; SAS, South Asians.
For references describing the functional characterization of the indicated alleles, see http://www.cypalleles.ki.se.
Indicates alleles whose functionality assessment is based solely on in vitro data.
Indicates alleles whose functionality assessment is based solely on in vivo data.
The CYP3A5 locus is highly variable across all human populations, yet harbors only few common genetic variants (Figure 1 h, Table 5). CYP3A5*3, an SNV causing alternative splicing and protein truncation, results in the almost complete abrogation of CYP3A5 activity.21 This allele is highly abundant in South Asians, East Asians, admixed Americans, and Europeans and constitutes the major allele with frequencies of 66.8%, 71.3%, 79.7%, and 94.3%, respectively. In contrast, the variant spectrum of CYP3A5 in Africans is distinctly different. Whereas the frequency of CYP3A5*3 is much lower (MAF = 18%), Africans also harbor the CYP3A5*6 (MAF = 15.4%) and *7 (MAF = 10.3%) alleles with high frequencies.
Besides those CYP genes with the highest pharmacogenetic importance, we also analyzed the allelic variant profiles of CYP1A1, CYP1A2, CYP2E1, and CYP4F2, genes with a lower extent of functionally important polymorphisms. The frequencies of the respective alleles for these genes can be found in Supplementary Tables S1–S4.
Among the pharmacogenetically most important CYPs, CYP2D6 is the most variable with cumulative allele frequencies between 59.8% in admixed Americans and 90.7% in Africans (Figure 2 a). In contrast, CYP3A4 is the most conserved gene with <10% of alleles harboring identified variant haplotypes. Notably, the largest differences in variability between populations are observed for CYP3A5 (cumulative allele frequencies 44–95%), CYP2A6 (28–69%), and CYP2B6 (24–62%).
Figure 2.
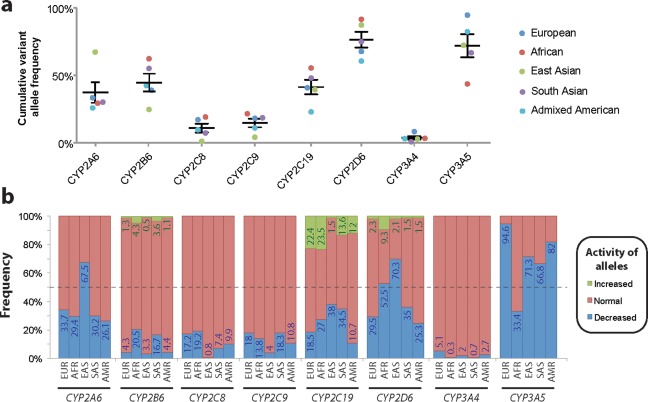
The genetic variability and their functional consequences differ drastically between major cytochrome P450 (CYP) genes and across populations. (a) Cumulative frequencies of all major variant alleles in Europeans (EUR; blue), Africans (AFR; red), East Asians (EAS; green), South Asians (SAS; purple), and admixed Americans (AMR; turquoise) are shown for each major CYP gene. Overall, CYP2D6 constitutes the most variable gene, whereas CYP3A4 is most conserved. (b) The expected functional consequences of allelic distributions across world populations are shown. Frequencies of haplotypes with decreased (blue), increased (green), and normal (red) functionality, as defined in Tables 1, 2, 3, 4, 5, were aggregated for each gene and population, revealing the spectrum of functional variability in major world populations.
Importantly, aggregation of allelic frequency data by their functional consequences revealed major differences in predicted functionality patterns across the populations. Functionally impaired CYP2A6 alleles are primarily found in East Asian populations where 67.5% of alleles are defective, whereas the frequencies of such alleles pivot around 30% in the other populations analyzed (Figure 2 b). Although the CYP2B6 locus is highly variable, the fraction of alleles that result in functional consequences is considerably smaller. In Africans and South Asians, around 20.5% and 16.7% of CYP2B6 alleles are expected to result in decreased activity, respectively. Between 7% and 20% of CYP2C8 and CYP2C9 alleles exhibit decreased functionality across major world populations, with the exception of East Asians for which <1% and 4% of functional CYP2C8 and CYP2C9 variants are observed, respectively. Of the genes analyzed, CYP2C19 harbors the highest frequency of increased activity alleles (CYP2C19*17), ranging from 1.5% in East Asians to 22.4% and 23.5% in Europeans and Africans, respectively.
CYP2D6 constitutes the most complex CYP locus known to harbor a large number of distinctly different common haplotypes with important clinical implications. In this study, we found that between 25.3% and 70.3% of analyzed alleles contained variant combinations with no or reduced functional activity. Furthermore, the CYP2D6 gene is commonly duplicated in 1.5–9.3% of alleles, causing increased metabolic activity toward the respective substrates. The enzymes encoded by the two major genes in the CYP3A family, CYP3A4 and CYP3A5, exhibit similar metabolic capabilities22 but drastically different variation profiles. Although CYP3A4 harbored only few common functional variants, the high prevalence of CYP3A5*3 causing alternative splicing resulted in the major fraction of alleles showing severely reduced functional activity (Figure 2 b).
4. DISCUSSION
To date, a multitude of studies have analyzed the frequencies of CYP alleles in populations around the world. Yet, most studies analyzed only the prevalence of a selected subset of SNVs in a particular gene and only in one or few subpopulations of relatively small sample size. To overcome these limitations, a variety of studies consolidated frequency information from multiple studies to allow a broader overview of the true frequencies between populations. Fricke–Galindo et al.23 performed a meta‐analysis integrating variant frequency data of seven CYP2C19 alleles from 138 studies. Furthermore, a recent extensive meta‐analysis of 173 reports revealed the spectrum of allele frequencies and predicted functional consequences across major populations for CYP2D6.20 However, meta‐analyses are limited to a small number of haplotypes for which several reports are available and integration of multiple studies can be problematic due to differences in underlying genotyping strategies and differentially designed assay panels.24 For instance, in a study by Griese et al.,25 which was included in the highlighted CYP2D6 meta‐analysis, the prevalence of 16 CYP2D6 haplotypes were analyzed in a Ghanaian population by allele‐specific polymerase chain reaction, including the normactive CYP2D6*2 haplotype, which is defined by two variants (rs16947 and rs1135840).25 Yet, in combination with two additional SNVs (rs61736512 and rs59421388), which were not assessed in the respective study, these two variants constitute CYP2D6*29, a haplotype that exhibits reduced activity. Thus, the *2 haplotype, as designated by Griese et al.,25 likely encompasses the less active *29 allele, confounding the reported haplotype and activity frequencies.
To overcome these limitations, in this study, we analyzed uniform next‐generation sequencing data ensuring that variant information is fully consistent and compatible. Our analyses reveal the drastic extent of genetic variability between major populations, which entail phenotypic consequences on the level of differential metabolic activity profiles and incentivizes population‐adjusted pharmacogenetic genotyping strategies. Notably though, there are additional layers of genetic variability between specific subpopulations within the aggregated superpopulations that we analyzed, as has been shown, for instance, for CYP2D6 gene duplications and the distribution of the CYP2C19*17 allele within Europe, which occur with a strong south‐north and west‐east gradient, respectively.20, 23 Overall, Africans constitute the most heterogeneous superpopulation, as exemplified by large differences in CYP2D6*5, CYP2D6*29, and CYP3A5*3 frequencies that vary among 3–17%, 2–20%, and 4–95% between subpopulations, respectively.26, 27 Therefore, higher resolution maps across the subpopulations will add clinically useful information and we expect that such datasets will be available in the near future when the many current whole genome analyses projects have been published.
CYP2A6 is the main enzyme involved in nicotine metabolism and is also involved in the bioactivation of procarcinogens from tobacco smoke. Previous studies showed that CYP2A6 deficiency resulted in reduced nicotine dependence28 as well as a markedly reduced lung cancer risk (odds ratio = 0.23).29 Given the high prevalence of functionally deficient CYP2A6 alleles in East Asian populations (67.5%; Figure 2 b), these data corroborate that the genetic contribution to nicotine addiction as well as the risk to develop pulmonary lesions is reduced in these populations.
CYP2B6 and CYP2A6 are the key enzymes responsible for metabolism of the antiretroviral efavirenz, and deficiency of these enzymes can result in increased systemic exposure.30, 31, 32 Importantly, significant associations between reduced CYP2B6 activity and neurological symptoms were described for pediatric as well as adult patients, indicating that CYP2B6 genotyping might reveal biomarkers for increased risk of efavirenz toxicity particularly in African populations in which CYP2B6 deficient alleles are most frequent.33, 34 Notably, no clear effect on CYP2B6 functionality has been demonstrated for CYP2B6*5 and CYP2B6*9, the most abundant CYP2B6 variant alleles in Europeans and admixed Americans. Interestingly, CYP2B6*5 apparently results in significantly reduced expression levels of CYP2B6 in vitro, however, without altering efavirenz metabolism suggesting increased specific activity of the gene product, which compensates for the reduced expression levels.35 In agreement with these in vitro findings, no effect of CYP2B6*5 on efavirenz pharmacokinetics was observed in vivo.36 Thus, interrogating the functional effects of these alleles using a variety of CYP2B6 substrates will be an important task for future studies to allow for a more accurate translation of CYP2B6 genetic variability into functional activity profiles.
CYP2C8 is involved in the metabolism of a multitude of chemically diverse medications, including nonsteroidal anti‐inflammatory drugs, thiazolidinediones, and chemotherapeutic agents. Importantly, CYP2C8 alleles causing impaired activity have been implicated in reduced clearance and increased exposure to paclitaxel, which correlates with higher incidences of paclitaxel‐induced neuropathies.37, 38 In light of the distribution of CYP2C8 deficient alleles, CYP2C8 genotyping might be a viable option in Africans and Europeans in which 19.2% and 17.2% of CYP2C8 alleles are expected to exhibit reduced functionality, respectively. In contrast, genotyping in East Asians cannot be recommended due to the low frequencies of deficient CYP2C8 variants (<1%).
Extremely slow clearance of phenytoin and increased risk of neurotoxicity has been observed in patients homozygous for CYP2C9‐deficient alleles.39 Furthermore, CYP2C9 deficiency is linked to bleeding complications upon treatment with warfarin and other anticoagulants. Together with age, body‐surface area, and polymorphisms in VKORC1, CYP2C9 variants explain 50% of the interindividual variability in dose requirements40 and a recent prospective trial showed that dosing guided by CYP2C9 and VKORC1 genotypes can increase the time in the therapeutic range and decrease the number of adverse events with atrial fibrillation or venous thromboembolism.41 These findings suggest that due to the distribution of CYP2C9 deficiencies in major populations, Europeans, Africans, and South Asians might be at increased risks of phenytoin toxicity as well as complications due to warfarin treatment.
The arguably most extensively studied CYP gene is CYP2D6, which metabolizes around 25% of all drugs in clinical use. Genetic polymorphisms that result in increased CYP2D6 metabolic capacities, primarily observed in Africans, have been linked to decreased treatment response observed for the treatment with tricyclic antidepressants,42 increased incidences of respiratory depression after tramadol treatment,43 opioid intoxication after codeine treatment with concomitant CYP3A4 inhibition, and transient reduction in renal functionality.44 In contrast, patients with reduced functionality CYP2D6 alleles, which are found with highest frequencies in East Asian (70.3%) and African populations (52.5%), bear an increased risk to develop hepatotoxicity upon treatment with the antianginal agent perhexiline,45 metoclopramide‐induced acute dystonic reactions,46 and adverse drug reactions caused by the antipsychotic risperidone.47
The functional CYP3A5*1 variant has recently been implicated in decreased safety of sunitinib treatment in patients with metastatic renal cell carcinoma.48 The splice variant rs776746 that results in CYP3A5 deficiency (CYP3A5*3) was found at very high frequencies in European populations (94.3%), whereas the combined prevalence of the inactive *3 and *6 alleles in Africans was only 33.4%. These results suggest that Africans might be at increased risks of sunitinib toxicity, incentivizing the clinical investigation of outcomes of treatment with lower sunitinib doses in these populations.
The CYP star allele nomenclature system provides a standardized nomenclature system, which facilitates scientific exchange and promotes the understanding of pharmacogenetic variability by nonpharmacogeneticists, such as clinicians. In this nomenclature system, genetic variants within the CYP genes that exert functional effects or cause unique amino acid substitutions are designated with a star (*) number. Yet, for some complex loci, interpretations of the star allele nomenclature can be impeded by intricate haplotype structures and the inclusion of different nonfunctional variants in the allelic definitions, frequently resulting in the use of different genotyping strategies for the analyses of CYP allelic variants. However, it is of importance to interrogate a sufficiently large number of single‐nucleotide polymorphisms in order to correctly assign a specific star allele. For instance, CYP2D6*2 cannot be called solely based on the presence of the defining variants rs16947 and rs1135840. Rather, other variants that are commonly detected in linkage with this variant combination, such as rs3892097 (CYP2D6*4) and rs5030865 (CYP2D6*14), also need to be excluded. Furthermore, due to the large number of extensive next‐generation sequencing projects, many novel rare variants are detected, which are important modulators of patients' response to pharmacological treatment but cannot be subsumed under existing star alleles.49 Thus, although the star allele nomenclature has considerable advantages for simple descriptions of the variant CYP alleles, it cannot be used to define the true global variability of all different CYP alleles.
In summary, our analyses reveal the large extent of genetic variability between major populations and can serve as a powerful resource for the worldwide distribution of CYP allele frequencies. Furthermore, these findings underscore the need to consider population‐specific genetic backgrounds when conducting pharmacogenetic analyses and clinical trials.
5. METHODS
5.1. Allele frequency data
Frequency information of exonic variants was obtained from Exome Aggregation Consortium, which integrated 14 large‐scale sequencing efforts encompassing in total sequences of 56,945 unrelated individuals from five major populations, encompassing 33,370 Europeans, 5,203 Africans and African Americans, 4,327 East Asians, 8,256 South Asians, and 5,789 admixed Americans.13 Frequencies of variants outside of coding regions were extracted from 1,851 genomes provided by the 1000 Genomes Project.12 For alleles that were defined by a set of variants, as specified in Tables 1, 2, 3, 4, 5 and Supplementary Tables S1–S4, we calculated linkage of the respective SNVs using the LDhap feature of the software package LDLink (https://analysistools.nci.nih.gov/LDlink)50 based on population‐specific linkage information provided by the 1000 Genome Project. Frequencies of gene deletions (CYP2A6*4 and CYP2D6*5) or amplifications (CYP2D6*1xN and CYP2D6*2xN) were obtained from the literature, as indicated due to technical limitations regarding the reliable quantification of their frequencies from synthesized short‐read sequencing projects. Cumulative allele frequencies (Fcum,i,p) for each gene i were calculated for each population p by summing up the individual haplotype frequencies of all major alleles included in Tables 1, 2, 3, 4, 5. Average *1 allele frequencies were determined as:
5.2. Allele nomenclature and definitions
CYP star (*) alleles were defined according to the Human CYP Allele Nomenclature Database (http://www.cypalleles.ki.se) and we refer to this source for references describing the functional characterization of the respective alleles. In this study, we pooled suballeles and only considered the variants that effectuate the functional effects of the allele, as indicated in Tables 1, 2, 3, 4, 5 and Supplementary Tables S1–S4. Throughout this paper, we defined common alleles as having MAF >1%, whereas variants or alleles with an allelic frequency <1% were defined as rare.
6. SOURCE OF FUNDING
This study was supported by the European Union's Horizon 2020 research and innovation program U‐PGx under grant agreement no. 668353 and by the Swedish Research Council (grant agreement numbers: 2015‐02760, 2016‐01153, and 2016‐01154).
7. AUTHOR CONTRIBUTIONS
V.M.L., Y.Z., and M.I.‐S. wrote the manuscript. V.M.L. designed the research. V.M.L. and Y.Z. performed the research. V.M.L., Y.Z., and M.I.‐S. analyzed the data.
8. CONFLICT OF INTEREST
V.M.L. and M.I.‐S. are co‐founders and owners of HepaPredict AB.
Supporting information
Supplementary Table S1 Important variant and allele frequencies of the human CYP1A1 gene. AFR, Africans; AMR, admixed Americans; CYP, cytochrome P450; EAS, East Asians; EUR, Europeans; SAS, South Asians. For references describing the functional characterization of the indicated alleles, see http://www.cypalleles.ki.se.
Supplementary Table S2 Important variant and allele frequencies of the human CYP1A2 gene. AFR, Africans; AMR, admixed Americans; CYP, cytochrome P450; EAS, East Asians; EUR, Europeans; SAS, South Asians. For references describing the functional characterization of the indicated alleles, see http://www.cypalleles.ki.se. # Indicates alleles whose functionality assessment is based solely on in vitro data.
Supplementary Table S3 Important variant and allele frequencies of the human CYP2E1 gene. AFR, Africans; AMR, admixed Americans; CYP, cytochrome P450; EAS, East Asians; EUR, Europeans; SAS, South Asians. For references describing the functional characterization of the indicated alleles, see http://www.cypalleles.ki.se. # Indicates alleles whose functionality assessment is based solely on in vitro data.
Supplementary Table S4 Important variant and allele frequencies of the human CYP4F2 gene. AFR, Africans; AMR, admixed Americans; CYP, cytochrome P450; EAS, East Asians; EUR, Europeans; SAS, South Asians. For references describing the functional characterization of the indicated alleles, see http://www.cypalleles.ki.se.
References
- 1. Lauschke, V.M. & Ingelman–Sundberg, M. The importance of patient‐specific factors for hepatic drug response and toxicity. Int. J. Mol. Sci. 17, E1714 (2016). [DOI] [PMC free article] [PubMed] [Google Scholar]
- 2. Eichelbaum, M. , Ingelman–Sundberg, M. & Evans, W.E. Pharmacogenomics and individualized drug therapy. Annu. Rev. Med. 57, 119–137 (2006). [DOI] [PubMed] [Google Scholar]
- 3. Bertz, R.J. & Granneman, G.R. Use of in vitro and in vivo data to estimate the likelihood of metabolic pharmacokinetic interactions. Clin. Pharmacokinet. 32, 210–258 (1997). [DOI] [PubMed] [Google Scholar]
- 4. Evans, W.E. & Relling, M.V. Pharmacogenomics: translating functional genomics into rational therapeutics. Science 286, 487–491 (1999). [DOI] [PubMed] [Google Scholar]
- 5. Phillips, K.A. , Veenstra, D.L. , Oren, E. , Lee, J.K. & Sadee, W. Potential role of pharmacogenomics in reducing adverse drug reactions: a systematic review. JAMA 286, 2270–2279 (2001). [DOI] [PubMed] [Google Scholar]
- 6. Fujikura, K. , Ingelman–Sundberg, M. & Lauschke, V.M. Genetic variation in the human cytochrome P450 supergene family. Pharmacogenet. Genomics 25, 584–594 (2015). [DOI] [PubMed] [Google Scholar]
- 7. Lauschke, V.M. & Ingelman–Sundberg, M. Requirements for comprehensive pharmacogenetic genotyping platforms. Pharmacogenomics 17, 917–924 (2016). [DOI] [PubMed] [Google Scholar]
- 8. Richards, S. et al Standards and guidelines for the interpretation of sequence variants: a joint consensus recommendation of the American College of Medical Genetics and Genomics and the Association for Molecular Pathology. Genet. Med. 17, 405–424 (2015). [DOI] [PMC free article] [PubMed] [Google Scholar]
- 9. Sim, S.C. & Ingelman–Sundberg, M. The human cytochrome P450 (CYP) allele nomenclature website: a peer‐reviewed database of CYP variants and their associated effects. Hum. Genomics 4, 278–281 (2010). [DOI] [PMC free article] [PubMed] [Google Scholar]
- 10. McGraw, J. & Waller, D. Cytochrome P450 variations in different ethnic populations. Expert Opin. Drug Metab. Toxicol. 8, 371–382 (2012). [DOI] [PubMed] [Google Scholar]
- 11. Zanger, U.M. & Schwab, M. Cytochrome P450 enzymes in drug metabolism: regulation of gene expression, enzyme activities, and impact of genetic variation. Pharmacol. Ther. 138, 103–141 (2013). [DOI] [PubMed] [Google Scholar]
- 12. 1000 Genomes Project Consortium et al. A global reference for human genetic variation. Nature 526, 68–74 (2015). [DOI] [PMC free article] [PubMed] [Google Scholar]
- 13. Lek, M. et al Analysis of protein‐coding genetic variation in 60,706 humans. Nature 536, 285–291 (2016). [DOI] [PMC free article] [PubMed] [Google Scholar]
- 14. Krishnakumar, D. et al Genetic polymorphisms of drug‐metabolizing phase I enzymes CYP2E1, CYP2A6 and CYP3A5 in South Indian population. Fundam. Clin. Pharmacol. 26, 295–306 (2012). [DOI] [PubMed] [Google Scholar]
- 15. Roco, A. et al Frequencies of 23 functionally significant variant alleles related with metabolism of antineoplastic drugs in the Chilean population: comparison with Caucasian and Asian populations. Front. Genet. 3, 229 (2012). [DOI] [PMC free article] [PubMed] [Google Scholar]
- 16. Zanger, U.M. , Klein, K. , Saussele, T. , Blievernicht, J. , Hofmann, M.H. & Schwab, M. Polymorphic CYP2B6: molecular mechanisms and emerging clinical significance. Pharmacogenomics 8, 743–759 (2007). [DOI] [PubMed] [Google Scholar]
- 17. Sim, S.C. et al A common novel CYP2C19 gene variant causes ultrarapid drug metabolism relevant for the drug response to proton pump inhibitors and antidepressants. Clin. Pharmacol. Ther. 79, 103–113 (2006). [DOI] [PubMed] [Google Scholar]
- 18. Mwinyi, J. et al The transcription factor GATA‐4 regulates cytochrome P4502C19 gene expression. Life Sci. 86, 699–706 (2010). [DOI] [PubMed] [Google Scholar]
- 19. Aklillu, E. , Persson, I. , Bertilsson, L. , Johansson, I. , Rodrigues, F. & Ingelman–Sundberg, M. Frequent distribution of ultrarapid metabolizers of debrisoquine in an Ethiopian population carrying duplicated and multiduplicated functional CYP2D6 alleles. J. Pharmacol. Exp. Ther. 278, 441–446 (1996). [PubMed] [Google Scholar]
- 20. Gaedigk, A. , Sangkuhl, K. , Whirl–Carrillo, M. , Klein, T. & Leeder, J.S. Prediction of CYP2D6 phenotype from genotype across world populations. Genet. Med. 19, 69–76 (2017). [DOI] [PMC free article] [PubMed] [Google Scholar]
- 21. Kuehl, P. et al Sequence diversity in CYP3A promoters and characterization of the genetic basis of polymorphic CYP3A5 expression. Nat. Genet. 27, 383–391 (2001). [DOI] [PubMed] [Google Scholar]
- 22. Williams, J.A. et al Comparative metabolic capabilities of CYP3A4, CYP3A5, and CYP3A7. Drug Metab. Dispos. 30, 883–891 (2002). [DOI] [PubMed] [Google Scholar]
- 23. Fricke–Galindo, I. et al Interethnic variation of CYP2C19 alleles, “predicted” phenotypes and “measured” metabolic phenotypes across world populations. Pharmacogenomics J. 16, 113–123 (2016). [DOI] [PubMed] [Google Scholar]
- 24. Kalman, L.V. et al Pharmacogenetic allele nomenclature: international workgroup recommendations for test result reporting. Clin. Pharmacol. Ther. 99, 172–185 (2016). [DOI] [PMC free article] [PubMed] [Google Scholar]
- 25. Griese, E.U. , Asante–Poku, S. , Ofori–Adjei, D. , Mikus, G. & Eichelbaum, M. Analysis of the CYP2D6 gene mutations and their consequences for enzyme function in a West African population. Pharmacogenetics 9, 715–723 (1999). [PubMed] [Google Scholar]
- 26. Dandara, C. , Swart, M. , Mpeta, B. , Wonkam, A. & Masimirembwa, C. Cytochrome P450 pharmacogenetics in African populations: implications for public health. Expert Opin. Drug Metab. Toxicol. 10, 769–785 (2014). [DOI] [PubMed] [Google Scholar]
- 27. Bains, R.K. et al Molecular diversity and population structure at the cytochrome P450 3A5 gene in Africa. BMC Genet. 14, 34 (2013). [DOI] [PMC free article] [PubMed] [Google Scholar]
- 28. Tyndale, R.F. & Sellers, E.M. Variable CYP2A6‐mediated nicotine metabolism alters smoking behavior and risk. Drug Metab. Dispos. 29(4 Pt 2), 548–552 (2001). [PubMed] [Google Scholar]
- 29. Ariyoshi, N. et al Genetic polymorphism of CYP2A6 gene and tobacco‐induced lung cancer risk in male smokers. Cancer Epidemiol. Biomarkers Prev. 11, 890–894 (2002). [PubMed] [Google Scholar]
- 30. Ward, B.A. , Gorski, J.C. , Jones, D.R. , Hall, S.D. , Flockhart, D.A. & Desta, Z. The cytochrome P450 2B6 (CYP2B6) is the main catalyst of efavirenz primary and secondary metabolism: implication for HIV/AIDS therapy and utility of efavirenz as a substrate marker of CYP2B6 catalytic activity. J. Pharmacol. Exp. Ther. 306, 287–300 (2003). [DOI] [PubMed] [Google Scholar]
- 31. Ogburn, E.T. , Jones, D.R. , Masters, A.R. , Xu, C. , Guo, Y. & Desta, Z. Efavirenz primary and secondary metabolism in vitro and in vivo: identification of novel metabolic pathways and cytochrome P450 2A6 as the principal catalyst of efavirenz 7‐hydroxylation. Drug Metab. Dispos. 38, 1218–1229 (2010). [DOI] [PMC free article] [PubMed] [Google Scholar]
- 32. Sarfo, F.S. et al Pharmacogenetic associations with plasma efavirenz concentrations and clinical correlates in a retrospective cohort of Ghanaian HIV‐infected patients. J. Antimicrob. Chemother. 69, 491–499 (2014). [DOI] [PubMed] [Google Scholar]
- 33. Rotger, M. et al Influence of CYP2B6 polymorphism on plasma and intracellular concentrations and toxicity of efavirenz and nevirapine in HIV‐infected patients. Pharmacogenet. Genomics 15, 1–5 (2005). [DOI] [PubMed] [Google Scholar]
- 34. Pinillos, F. et al Case report: severe central nervous system manifestations associated with aberrant efavirenz metabolism in children: the role of CYP2B6 genetic variation. BMC Infect. Dis. 16, 56 (2016). [DOI] [PMC free article] [PubMed] [Google Scholar]
- 35. Desta, Z. et al Impact of CYP2B6 polymorphism on hepatic efavirenz metabolism in vitro. Pharmacogenomics 8, 547–558 (2007). [DOI] [PubMed] [Google Scholar]
- 36. Burger, D. et al Interpatient variability in the pharmacokinetics of the HIV non‐nucleoside reverse transcriptase inhibitor efavirenz: the effect of gender, race, and CYP2B6 polymorphism. Br. J. Clin. Pharmacol. 61, 148–154 (2006). [DOI] [PMC free article] [PubMed] [Google Scholar]
- 37. Gréen, H. et al Pharmacogenetic studies of paclitaxel in the treatment of ovarian cancer. Basic Clin. Pharmacol. Toxicol. 104, 130–137 (2009). [DOI] [PubMed] [Google Scholar]
- 38. Hertz, D.L. et al CYP2C8*3 increases risk of neuropathy in breast cancer patients treated with paclitaxel. Ann. Oncol. 24, 1472–1478 (2013). [DOI] [PMC free article] [PubMed] [Google Scholar]
- 39. Franco, V. & Perucca, E. CYP2C9 polymorphisms and phenytoin metabolism: implications for adverse effects. Expert Opin. Drug Metab. Toxicol. 11, 1269–1279 (2015). [DOI] [PubMed] [Google Scholar]
- 40. Johnson, J.A. et al Clinical Pharmacogenetics Implementation Consortium guidelines for CYP2C9 and VKORC1 genotypes and warfarin dosing. Clin. Pharmacol. Ther. 90, 625–629 (2011). [DOI] [PMC free article] [PubMed] [Google Scholar]
- 41. Pirmohamed, M. et al A randomized trial of genotype‐guided dosing of warfarin. N. Engl. J. Med. 369, 2294–2303 (2013). [DOI] [PubMed] [Google Scholar]
- 42. Kawanishi, C. , Lundgren, S. , Agren, H. & Bertilsson, L. Increased incidence of CYP2D6 gene duplication in patients with persistent mood disorders: ultrarapid metabolism of antidepressants as a cause of nonresponse. A pilot study. Eur. J. Clin. Pharmacol. 59, 803–807 (2004). [DOI] [PubMed] [Google Scholar]
- 43. Stamer, U.M. , Stüber, F. , Muders, T. & Musshoff, F. Respiratory depression with tramadol in a patient with renal impairment and CYP2D6 gene duplication. Anesth. Analg. 107, 926–929 (2008). [DOI] [PubMed] [Google Scholar]
- 44. Gasche, Y. et al Codeine intoxication associated with ultrarapid CYP2D6 metabolism. N. Engl. J. Med. 351, 2827–2831 (2004). [DOI] [PubMed] [Google Scholar]
- 45. Barclay, M.L. et al Correlation of CYP2D6 genotype with perhexiline phenotypic metabolizer status. Pharmacogenetics 13, 627–632 (2003). [DOI] [PubMed] [Google Scholar]
- 46. van der Padt, A. , van Schaik, R.H. & Sonneveld, P. Acute dystonic reaction to metoclopramide in patients carrying homozygous cytochrome P450 2D6 genetic polymorphisms. Neth. J. Med. 64, 160–162 (2006). [PubMed] [Google Scholar]
- 47. de Leon, J. , Susce, M.T. , Pan, R.M. , Fairchild, M. , Koch, W.H. & Wedlund, P.J. The CYP2D6 poor metabolizer phenotype may be associated with risperidone adverse drug reactions and discontinuation. J. Clin. Psychiatry 66, 15–27 (2005). [DOI] [PubMed] [Google Scholar]
- 48. Garcia–Donas, J. et al Single nucleotide polymorphism associations with response and toxic effects in patients with advanced renal‐cell carcinoma treated with first‐line sunitinib: a multicentre, observational, prospective study. Lancet Oncol. 12, 1143–1150 (2011). [DOI] [PubMed] [Google Scholar]
- 49. Lauschke, V.M. & Ingelman–Sundberg, M. Precision medicine and rare genetic variants. Trends Pharmacol. Sci. 37, 85–86 (2016). [DOI] [PubMed] [Google Scholar]
- 50. Machiela, M.J. & Chanock, S.J. LDlink: a web‐based application for exploring population‐specific haplotype structure and linking correlated alleles of possible functional variants. Bioinformatics 31, 3555–3557 (2015). [DOI] [PMC free article] [PubMed] [Google Scholar]
Associated Data
This section collects any data citations, data availability statements, or supplementary materials included in this article.
Supplementary Materials
Supplementary Table S1 Important variant and allele frequencies of the human CYP1A1 gene. AFR, Africans; AMR, admixed Americans; CYP, cytochrome P450; EAS, East Asians; EUR, Europeans; SAS, South Asians. For references describing the functional characterization of the indicated alleles, see http://www.cypalleles.ki.se.
Supplementary Table S2 Important variant and allele frequencies of the human CYP1A2 gene. AFR, Africans; AMR, admixed Americans; CYP, cytochrome P450; EAS, East Asians; EUR, Europeans; SAS, South Asians. For references describing the functional characterization of the indicated alleles, see http://www.cypalleles.ki.se. # Indicates alleles whose functionality assessment is based solely on in vitro data.
Supplementary Table S3 Important variant and allele frequencies of the human CYP2E1 gene. AFR, Africans; AMR, admixed Americans; CYP, cytochrome P450; EAS, East Asians; EUR, Europeans; SAS, South Asians. For references describing the functional characterization of the indicated alleles, see http://www.cypalleles.ki.se. # Indicates alleles whose functionality assessment is based solely on in vitro data.
Supplementary Table S4 Important variant and allele frequencies of the human CYP4F2 gene. AFR, Africans; AMR, admixed Americans; CYP, cytochrome P450; EAS, East Asians; EUR, Europeans; SAS, South Asians. For references describing the functional characterization of the indicated alleles, see http://www.cypalleles.ki.se.