

Abstract
Ultimately, cell biology seeks to define molecular mechanisms underlying cellular functions. However, heterogeneity within cell populations must be considered for optimal assay design and data interpretation. Although single‐cell analyses are desirable for addressing this issue, practical considerations, including assay sensitivity, limit their broad application. Therefore, omics studies on small numbers of cells in defined subpopulations represent a viable alternative for elucidating cell functions at the molecular level. MS‐based proteomics allows in‐depth proteome exploration, although analyses of small numbers of cells have not been pursued due to loss during the multistep procedure involved. Thus, optimization of the proteomics workflow to facilitate the analysis of rare cells would be useful. Here, we report a microproteomics workflow for limited numbers of immune cells using non‐damaging, microfluidic chip‐based cell sorting and MS‐based proteomics. Samples of 1000 or 100 THP‐1 cells were sorted, and after enzymatic digestion, peptide mixtures were subjected to nano‐LC‐MS analysis. We achieved reasonable proteome coverage from as few as 100‐sorted cells, and the data obtained from 1000‐sorted cells were as comprehensive as those obtained using 1 μg of whole cell lysate. With further refinement, our approach could be useful for studying cell subpopulations or limited samples, such as clinical specimens.
Keywords: Cell sorting, Mass spectrometry, Microproteomics, Monocytes, Sample preparation
Abbreviations
- CTC
circulating tumor cells
- PSM
peptide spectrum matches
The importance of cellular heterogeneity among stem cells and immune cells 1, 2, 3 is well understood. Cellular heterogeneity was originally recognized as a fundamental property of cellular systems 4 and is now widely associated with the function of such systems 5. Monocytes play pivotal roles in tissue homeostasis and innate immunity and are a well‐established source of various types of macrophages. Accumulating clinical data suggest a link between monocyte heterogeneity and cardiovascular disease 6, although the detailed mechanism remains unknown. In this context, an omics approach can provide objective insights into the diverse function of cells 2. Multiple cell surface markers can be used to subdivide cells into subsets; thus, the abundance of cells may not be constant. Comprehensive single‐cell omics approaches 7 are evolving, which is desirable for addressing the functions of small amounts of cells, although proteomics remain limited by practical concerns. Comprehensive proteomic analyses of limited numbers of cells (microproteomics) have primarily involved MS‐based approaches 8, followed by non‐MS based approaches 9, 10. MS‐based proteomics, which usually requires 105 to millions of cells, has dramatically improved proteome coverage, allowing the profiling of over 13 000 proteins from human cell lines 11. To substantially scale down material requirements toward microproteomics, optimization of sample collection 12, sample preparation 13, 14, 15, MS analysis involving chromatography 16 and data analysis 17, 18 will be required. Currently, subpopulations are defined via cell‐surface phenotyping using flow cytometry. The combination of flow cytometry and MS‐based proteomics has been applied for assessing samples of 500–30 000 cells 16, 19, and further scaled down, in‐depth approaches are needed. The most recent multicolored sorting system simultaneously defines multiple subsets of cells from heterogeneous samples; however, it can result in cell bursting because of physical stresses. Sample preparation and desalting for MS‐based proteomics involves multiple procedures; thus, loss and contamination are likely to occur during these processes, especially with small‐scale samples. A major factor in sample loss is adsorption: cells, proteins and peptides adhere to plastics and solid supports, resulting in low recovery and emphasizing the need for processes to minimize loss. Here, we report a microproteomics workflow for THP‐1, a human monocytic cell line. Because the cell number is undefined in microproteomics, we used the number of circulating tumor cells (CTCs) in a clinical specimen as a model, which ranges from 100 to 1000 cells 20. To ensure cell recovery, we employed microfluidic chip‐based cell sorting for avoiding cell damage. Using simple cell populations, we optimized a sample processing method focused on minimizing sample loss. The resulting proteome profiling of 1000‐sorted THP‐1 cells was as comprehensive as the profile obtained using 1 μg of whole cell lysate in our system.
The experimental design is shown in Scheme 1. A PE‐conjugated mouse anti‐human HLA‐DR antibody was used to label THP‐1 for accurate cell counting. DAPI was employed to exclude dead cells, and 1000 or 100 immunostained THP‐1 cells were sorted in sheath liquid. Cell sorting was performed using the On‐chip sort system (On‐chip Biotechnologies, Tokyo, Japan), which has previously been described in detail 21. Briefly, the sheath flow was horizontally directed into micro channels that were controlled by air pressure; the flow pressure was less than 0.3 psi, and the flow speed was less than 1 m/s (schematic diagram in Scheme 1). These mild conditions enabled damage‐free cell sorting. Phenol red‐ and serum‐free filtered RPMI‐1640 medium was used as the sheath liquid to maintain cell viability. Each 1000 or 100 cells were collected from an isolation reservoir in a 1% BSA‐coated or hydrophilic‐coated microtube (Sumitomo Bakelite, Co. Ltd., Tokyo, Japan). The sorted cells were then suspended in medium, containing high levels of inorganic salts and processed via single‐pot sample preparation to minimize sample loss. As such, the medium could be removed via centrifugation; however, cells might also be removed because of a low cell density. To prevent cell loss caused by centrifugation, further processing, such as enzymatic digestion, should be conducted in the medium, which results in unfavorable conditions. Thus, we investigated the effect of centrifugation and the medium with the aim of maximizing proteome coverage under limiting conditions. We prepared five groups to investigate cell adhesion to the microtube and cell loss due to centrifugation to remove the sheath liquid: 1000 cells in a 1% BSA‐coated microtube, lysed directly with medium (with medium Group 1); 1000 cells in a 1% BSA‐coated microtube, from which the medium was removed, followed by lysis in the same microtube (without medium Group 2); 1000 cells in a hydrophilic‐coated tube, from which the medium was removed, followed by lysis in the same microtube (without medium Group 3); 100 cells in a 1% BSA‐coated microtube, lysed directly with medium (with medium Group 4); and 100 cells in a BSA‐coated microtube, from which the medium was removed, followed by lysis in the same microtube (without medium Group 5). Proteins were extracted using a partially modified phase transfer surfactant method 22. The protein solution with or without sheath liquid was digested with Lys‐C for 3 h, followed by trypsin digestion. Following desalting with an SPE C‐tip, each sample was subjected to shotgun proteomics analysis for protein profiling. All experiments were run in triplicate. All samples were analyzed with an EASY‐nLC 1000 (Proxeon, Thermo) coupled to an Orbitrap Velos Elite (Thermo) equipped with an Acclaim® PepMap 100 C18 Nano‐trap column (100 μm id × 2 cm, 3 μm, Thermo) and an EASY‐Spray PepMap C18 column (75 μm id × 25 cm, 2 μm, Thermo). The peptides were separated using a 3‐h linear gradient of solvent A (0.1% formic acid) and solvent B (ACN and 0.1% formic acid) at 300 nL/min. All of the MS/MS spectra were analyzed through sequence alignment using Proteome Discoverer 1.4 with two search engines, SEQUEST HT (Thermo) and Mascot (version 2.4.1, Matrix Science), against the Swiss‐Prot human database (May 2014). Because of the small amount of the samples, the peptide spectrum matches (PSM) number was small and was insufficient to perform a decoy search and for false discovery rate validation 23 (Supporting Information Table 1). Thus, we preferred to validate the results using the Fixed Value PSM Validator without false discovery rate, moreover, we simply applied a high peptide confidence filter to narrow down the results using strict conditions. Detailed methods and conditions are provided in the Supporting Information.
Scheme 1.
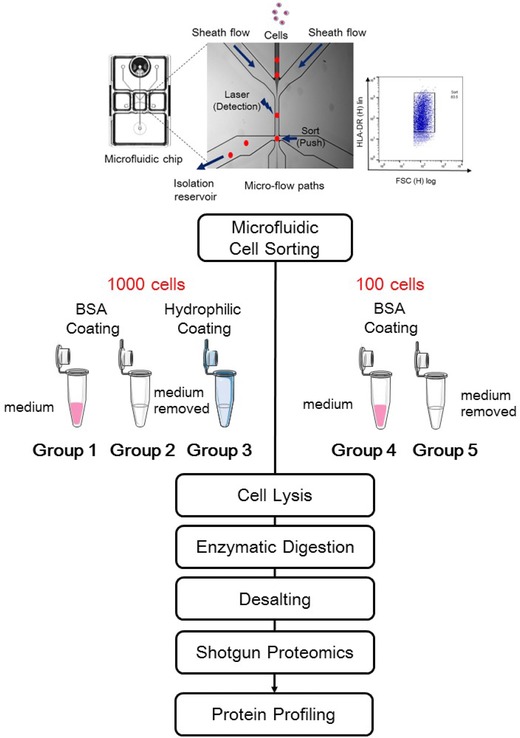
Overview of the workflow in this study. First, 100 or 1000 sorted THP‐1 cells were collected in a BSA‐coated tube or a hydrophilic‐coated tube, and following each sample processing procedure, protein profiling was performed. Five Groups were prepared: Group 1: 1000 cells in a BSA‐coated tube digested with medium; Group 2: 1000 cells in a BSA‐coated tube with the medium removed; Group 3: 1000 cells in a hydrophilic‐coated tube with the medium removed; Group 4: 100 cells in a BSA‐coated tube digested with medium; Group 5: 100 cells in a BSA‐coated tube with the medium removed. Schematic diagram of cell sorting in the microfluidic‐based cell sorter and 1000‐sorted cells gated by HLA‐DR+. The original diagram was kindly provided by On‐chip Biotechnologies Co., Ltd.
The current workflow allowed the identification of 346 to 911 proteins and 275 to 549 proteins from 1000 or 100‐sorted cells, respectively (Supporting Information Table 2, Venn diagram in Fig. 1A and B). The results exceeded expectations. We previously used a conventional cell sorter to sort 1000 MCF‐7 cells, which resulted in unsatisfactory coverage (fewer than 100 proteins from 1000‐sorted cells, data presented at the 19th IMSC, Kyoto), which we assume was due to the use of a conventional cell sorter. A conventional cell sorter employs high‐pressure flow control (> 45 psi) and relatively high‐speed flow collisions (ex. 10 m/s); these factors generate strong electric fields and high shear stress in cells, potentially resulting in cell damage. Moreover, orthogonal sorting may be disadvantageous for cell bursting. According to Mollet et al., conventional cell sorting damages 15 to 55% of THP‐1 cells and sorting conditions greatly affected THP‐1 cell recovery, which ranged 59 to 81% 24. A microfluidic chip‐based cell sorter is advantageous in these regards, leading to reasonable coverage. Following cell sorting, microscopy confirmed that the cell shape was normal; thus, the chip‐based cytometer successfully sorted 1000 or 100 cells without damage.
Figure 1.
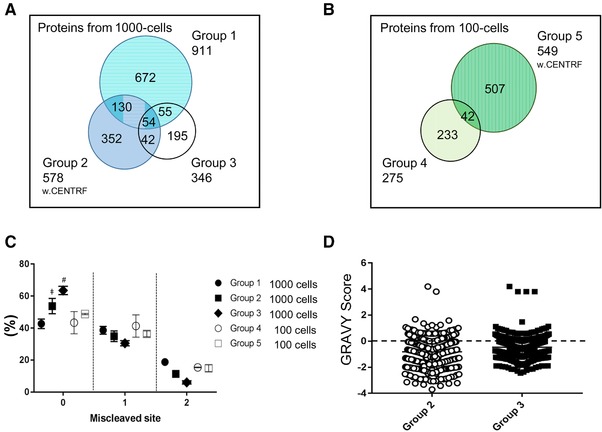
Microproteome profiling and characteristics (A) Proteins identified from 1000‐sorted cells: Group 1: BSA‐coated tube digested with medium; Group 2: BSA‐coated tube with the medium removed; Group 3: hydrophilic‐coated tube with the medium removed (B) Proteins from 100‐sorted cells: Group 4: BSA‐coated tube digested with medium; Group 5: BSA‐coated tube with the medium removed. w. CENTRF: with centrifugation (C) Miscleaved peptide sites under each condition. Some error bars are invisible because of low variability. Unpaired T‐test: ǂ, Group 1 vs. Group 2, p< 0.05, #, Group 1 vs. Group 3, p< 0.01 (D) Distribution of the peptide GRAVY score from 1000‐sorted THP‐1 cells in BSA‐coated or hydrophilic‐coated tubes. (N = 3).
We further investigated the effect of centrifugation on microproteomics, comparing protein; the protein profiles from Groups 1 and 2 or Groups 4 and 5. We found that the impact of centrifugation differed between 1000‐cell and 100‐cell samples. For 1000 cells, the proteome coverage was reduced by centrifugation (Fig. 1A, Groups 1 and 2), and it appeared that the cells were removed together with the medium. On the other hand, proteome coverage was increased by centrifugation in the groups with 100‐sorted cells (Groups 4 and 5, Fig. 1B), suggesting that sample processing in the presence of medium might be strongly influenced in samples with the extremely limited size of 100 cells. This finding also indicated that multiple factors affect the proteome coverage obtained for small‐scale samples. Subsequently, we evaluated the effect of the sheath liquid (i.e. the medium). Since Trypsin and Lys‐C can be used in the presence of relatively high levels of salt, we attempted to proceed with further sample preparation in the presence of medium and assessed the number of miscleaved peptide sites. High levels of salt can lead to incompletely cleaved peptides. As shown in Fig. 1C, the samples processed with medium (Groups 1 and 4) showed more miscleaved sites than Groups 2, 3 and 5, which were processed without medium. Compared with Groups 2 and 3 without medium, the percentage of completely cleaved peptides in Group 1 was significantly lower, at 42%, showing an influence of the medium on enzymatic digestion. While the number of miscleaved sites was increased, the unfavorable conditions were apparently acceptable for protein profiling. Samples of 100 cells showed more frequent miscleavage than samples of 1000 cells. As described above, centrifugation provided better results in the samples of 100‐sorted cells; thus, the sample processing procedure for a sample of 100 cells requires removal of the medium to increase coverage. Complete cleavage of protein samples is considered critical for increasing sensitivity; however, missed cleavages may be not always be disadvantageous. In the case of extremely limited samples, such as samples of 100 cells, further optimization of the workflow might be required. Nevertheless, the number of identified proteins was equivalent to the results obtained for the bulk cell lysate (Fig. 2A), verifying the advantage of single‐pot sample preparation.
Figure 2.
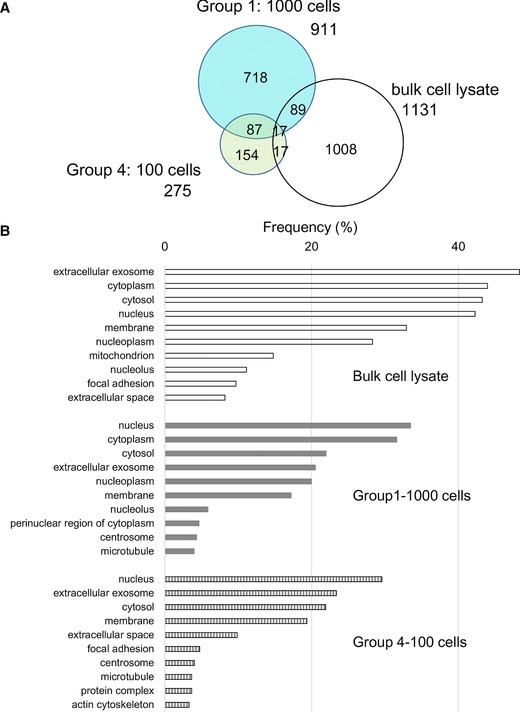
Proteome profiling in micro‐ and conventional proteomics (A) Venn diagrams comparing the proteins or peptides identified from 1000‐sorted cells, 100‐sorted cells or bulk cell lysate. (Groups 1, 4 and bulk cell lysate) (B) GO analysis of cellular components for the proteins identified from bulk cell lysate (open), 1000‐sorted cells (Group 1, gray) and 100‐sorted cells (Group 4, striped). The results are shown as the frequency (%) of the top ten GO terms in each group.
Sample loss due to surface adsorption is a critical factor in microproteomics. Protein–surface interactions are driven by multiple factors, including hydrophobic and hydrophilic interactions. Various low‐protein‐adsorption tubes are commercially available. In this study, we assessed a hydrophilic‐coated tube and its BSA‐coated counterpart, which is non‐toxic to cells. The coating efficiency was directly compared in the BSA‐coated (Group 2) and hydrophilic‐coated (Group 3) tubes using 1000‐cell samples without medium. As shown in Fig. 1A, the BSA coating (Group 2) improved proteome coverage compared with that of the hydrophilic coating (Group 3). The coating efficiency was further evaluated based on the peptide GRAVY score 25, which characterizes peptide hydrophobicity, in Groups 2 and 3 (Fig. 1D). We found that the peptides obtained using the hydrophilic‐coated tubes appeared to be more hydrophobic, whereas peptides with a broader range of properties were identified using the BSA‐coated tubes. Peptide characteristics vary, and peptides are commonly amphipathic in nature. The effects of surface coatings are not yet fully understood due to this complicated mechanism. In this study, we assessed the properties of the peptides associated with each type of coating. BSA coating is simple and is commonly used for ELISA and other applications 26, and this type of coating was shown to be successful for reducing sample loss in our study and others 27. No contamination from antibody‐derived peptides (i.e. murine IgM‐ or IgG‐derived peptides) was detected.
The results of protein profiling via microproteomics or our conventional proteomics workflow using 1 μg equivalent of bulk cell lysate were compared (N = 3). As previously reported 12, 13, 19, we found that proteome coverage was not proportional to cell numbers (Supporting Information Table 2). Protein clustering, particularly in relation to cellular localization, is of interest. The profiling of 1000 or 100 sorted THP‐1 cells or bulk cell lysate was further analyzed through GO analysis of cellular components, for the top ten components in each sample (Fig. 2B). The frequency of GO terms for each component was similar between 1000‐ and 100‐cell samples. The bulk cell lysate showed congenial profiling with sorted cells, but a high frequency of almost all GO terms, particularly for exosome and cytoplasmic proteins. Further investigation suggested that these differences were due to the tube coatings. Using the current workflow, the number of identified proteins in each group was similar in terms of cellular localization, regardless of the number of cells. This finding suggested that our simple sample preparation processes could cover the proteome for almost all cellular components, including membranes. The protein abundance associated with each sample size is of interest, and quantitative analysis will be performed in future investigations.
The current workflow enabled the identification of a similar numbers of proteins from 1000 sorted cells and 1 μg equivalent of bulk cell lysates; however, further improvement is required. Variance frequently occurs during the analysis of samples at trace levels (Supporting Information Fig. 1), which we assume might represent the total variance from each processing step (i.e. injection, adsorption to the whole LC system, sample loss during sample preparation and the number of missed cleavages). In general, we use at least one million cells in the lysis step, and a 1 μg equivalent aliquot is employed for LC‐MS analysis, which results in greater than 60% of overlap across replicates. For 1000 or 100 cells, the amount of protein obtained is less than 1 ng, and almost all of the sample is injected for LC‐MS at once, representing technically difficult conditions. Switching from SUS tubing and parts to other materials in an LC system may prevent adsorption, although this is technically challenging. Next, we compared the results of protein profiling for 1000 or 100 HLA‐DR+‐sorted cells and unsorted bulk cell lysates (Fig. 2A). We expected that the protein profiles would be similar across the three groups because HLA‐DR is a pan‐surface antigen of monocytes. However, the variation was greater than we expected. We explored the cause of this variation focusing on physicochemical properties, and it appeared that both analytical and biological factors may have contributed to the observed variation. Several physicochemical characteristics were found to show a group‐specific tendency, apparently reflecting the conditions of sample preparation. Such variance is the most challenging issue in microproteomics. Even when millions of cells are used, some variance will occur due to carry‐over and lot‐to‐lot differences in tips, columns and cell lines. In our microproteomics analyses, it should be considered that we compared sorted cells and unsorted cells. Sorted cells sometimes clog a c‐tip, while bulk cell lysates and culture media do so less frequently. Sample clogging in tips may cause sample loss and is therefore likely to cause variance across triplicates, groups, and/or bulk cell lysates. Such differences may be due to lot‐to‐lot variation in c‐tips and/or the effect of PE‐Ab conjugates, but it is difficult to determine the cause. In addition, the laser used in cell sorting may stimulate cytokine release and/or protein production, potentially representing one of the reasons that variation occurred. To address the variance issue, we investigated the characteristics of the common proteins across the three groups; these proteins were both nucleus and cytoplasmic proteins and were relatively abundant. Further information, such as the specific characteristics of the proteins, could not be obtained. Sample loss during protein digestion and purification in microproteomics is a particularly critical issue, and alternative desalting tools may be effective for preventing sample loss.
In this work, we used commercially available tools and instruments, and it will be necessary to develop a specific system to overcome these issues. However, our workflow for quantitatively classifying cellular subpopulations and obtaining insight regarding cellular populations can be directly linked with proteome profiling, which is the advantage of our approach.
Microproteomics shows potential for clinical omics research in cases where sample amounts are limited 17, 28, 29. Recently, antibody‐conjugated magnetic beads were used to define single subpopulation in whole blood 13. Cell sorting using magnetic beads can be performed more gently and faster than FACS. However, this approach can be applied to only one cell surface marker. Most cell subpopulations are defined by multiple surface markers, such as CD14++CD16+ and CD14++CD16− 6. Our approach enables multicolored‐cell sorting and can define these subsets, allowing us to count the ratio of each subset, which is not possible using current magnetic bead‐sorting methods. This type of multiplex analysis is essential for highly heterogeneous samples and clinical specimens. As shown previously 13, microproteomics requires multiple factors to be refined, including cell lysis, the prevention of cell adhesion and chromatography. These authors applied micro‐extraction (SPE) and a PLOT system, which uses an extremely slow flow rate, along with a highly effective spray system. The combination of these approaches successfully led to more in‐depth proteomics results. With further refinement of our current system, especially regarding the prevention of sample loss, we can expect more robust and deeper proteomics profiles to be obtained in samples of a limited size.
In this study, we applied undamaged microfluidic chip‐based cell sorting combined with MS‐based proteomics and established a simple sample preparation method to minimize sample loss. This is the first report of microproteomics profiling using a limited number of THP‐1 cells, which are relatively small in size (10 μm) 30. To elucidate the function of monocyte subsets, the characterization of distinct functions in each subset is crucial. One of the most significant functions of monocytes is cytokine production, which can be determined through multicolor flow cytometry or ELISA; thus, sorted subpopulations can be easily applied for such analyses. The production of different cytokines and the expression of different genes have been observed between subsets 6. Therefore, integration with microproteomics, cytokine assays or other omics techniques, including transcriptomics or genomics, will further clarify the function of monocyte subpopulations and disease states.
The authors declare no conflict of interest.
Supporting information
Supplemental Figure 1. Venn diagrams showing the overlap of the proteins identified in each experiment.
Supplemental Table 1. PSMs from 100 or 1,000 THP‐1 cells in each group (N=3)
Supplemental Table 2. Numbers of peptides and proteins identified from 100 or 1,000 sorted THP‐1 cells in each group (N=3, merged).
Supporting document
Acknowledgments
This work was supported by a Grant‐in‐Aid for Challenging Exploratory Research (15K15061) from JSPS (KK). We thank Mr. Kosuke Osawa and Dr. Masayuki Ishige from On‐chip Biotechnologies Co., Ltd. for helpful discussions and assistance with cell sorting. We are also grateful to Dr. Kennosuke Hoshina for his critical review of the manuscript. The Biomedical Research Unit of Tohoku University Hospital provided laboratory equipment support.The associated proteomics data are available via JPOST or ProteomeXchange (JPST000161, PXD005096)
Kasuga K., Katoh Y., Nagase K., Igarashi K., Proteomics 2017, 17, 1600420 https://doi.org/10.1002/pmic.201600420
Colour Online: See the article online to view Sch. 1 and Figs. 1, 2 in colour.
References
- 1. Rulands, S. , Simons, B. D. , Tracing cellular dynamics in tissue development, maintenance and disease. Curr. Opin. Cell. Biol. 2016, 43, 38–45. [DOI] [PubMed] [Google Scholar]
- 2. Gordon, S. , Taylor, P. R. , Monocyte and macrophage heterogeneity. Nat. Rev. Immunol. 2005, 5, 953–964. [DOI] [PubMed] [Google Scholar]
- 3. Gaublomme, J. T. , Yosef, N. , Lee, Y. , Gertner, R. S. et al., Single‐cell genomics unveils critical regulators of Th17 cell pathogenicity. Cell 2015, 163, 1400–1412. [DOI] [PMC free article] [PubMed] [Google Scholar]
- 4. Elsasser, W. M. , Outline of a theory of cellular heterogeneity. Proc. Natl. Acad. Sci. U S A 1984, 81, 5126–5129. [DOI] [PMC free article] [PubMed] [Google Scholar]
- 5. Altschuler, S. J. , Wu, L. F. , Cellular heterogeneity: do differences make a difference? Cell 2010, 141, 559–563. [DOI] [PMC free article] [PubMed] [Google Scholar]
- 6. Weber, C. , Shantsila, E. , Hristov, M. , Caligiuri, G. et al., Role and analysis of monocyte subsets in cardiovascular disease. Joint consensus document of the European Society of Cardiology (ESC) Working Groups “Atherosclerosis & Vascular Biology” and “Thrombosis.” Thromb. Haemost. 2016, 116, 626–637. [DOI] [PubMed] [Google Scholar]
- 7. Ramsköld, D. , Luo, S. , Wang, Y. C. , Li, R. et al., Full‐length mRNA‐Seq from single‐cell levels of RNA and individual circulating tumor cells. Nat. Biotechnol. 2012, 30, 777–782. [DOI] [PMC free article] [PubMed] [Google Scholar]
- 8. Sun, L. , Bertke, M. M. , Champion, M. M. , Zhu, G. et al., Quantitative proteomics of Xenopus laevis embryos: expression kinetics of nearly 4000 proteins during early development. Sci. Rep. 2014, 4, 4365. [DOI] [PMC free article] [PubMed] [Google Scholar]
- 9. Spitzer, M. H. , Nolan, G. P. , Mass cytometry: single cells, many features. Cell 2016, 165, 780–791. [DOI] [PMC free article] [PubMed] [Google Scholar]
- 10. Darmanis, S. , Gallant, C. J. , Marinescu, V. D. , Niklasson, M. et al., Simultaneous multiplexed measurement of RNA and proteins in single cells. Cell. Rep. 2016, 14, 380–389. [DOI] [PMC free article] [PubMed] [Google Scholar]
- 11. Branca, R. M. , Orre, L. M. , Johansson, H. J. , Granholm, V. et al., HiRIEF LC‐MS enables deep proteome coverage and unbiased proteogenomics. Nat. Methods 2014, 11, 59–62. [DOI] [PubMed] [Google Scholar]
- 12. Virant‐Klun, I. , Leicht, S., Hughes , C., Krijgsveld , J., Identification of maturation‐specific proteins by single‐cell proteomics of human oocytes. Mol. Cell. Proteomics 2016, 15, 2616–2627. [DOI] [PMC free article] [PubMed] [Google Scholar]
- 13. Li, S. , Plouffe, B. D. , Belov, A. M. , Ray, S. et al., An integrated platform for isolation, processing, and mass spectrometry‐based proteomic profiling of rare cells in whole blood. Mol. Cell. Proteomics 2015, 14, 1672–1683. [DOI] [PMC free article] [PubMed] [Google Scholar]
- 14. Wang, H. , Qian, W. J. , Mottaz, H. M. , Clauss, T. R. et al., Development and evaluation of a micro‐ and nanoscale proteomic sample preparation method. J. Proteome Res. 2005, 4, 2397–2403. [DOI] [PMC free article] [PubMed] [Google Scholar]
- 15. Hughes, C. S. , Foehr, S. , Garfield, D. A. , Furlong, E. E. et al., Ultrasensitive proteome analysis using paramagnetic bead technology. Mol. Syst. Biol. 2014, 10, 757. [DOI] [PMC free article] [PubMed] [Google Scholar]
- 16. Di Palma, S. , Stange, D. , van de Wetering, M. , Clevers, H. et al., Highly sensitive proteome analysis of FACS‐sorted adult colon stem cells. J. Proteome Res. 2011, 10, 3814–3819. [DOI] [PubMed] [Google Scholar]
- 17. Umar, A. , Luider, T. M. , Foekens, J. A. , Pasa‐Tolić, L. , NanoLC‐FT‐ICR MS improves proteome coverage attainable for approximately 3000 laser‐microdissected breast carcinoma cells. Proteomics 2007, 7, 323–329. [DOI] [PubMed] [Google Scholar]
- 18. Bensaddek, D. , Narayan, V. , Nicolas, A. , Murillo, A. B. et al., Micro‐proteomics with iterative data analysis: proteome analysis in C. elegans at the single worm level. Proteomics 2016, 16, 381–392. [DOI] [PMC free article] [PubMed] [Google Scholar]
- 19. Wang, N. , Xu, M. , Wang, P. , Li, L. , Development of mass spectrometry‐based shotgun method for proteome analysis of 500 to 5000 cancer cells. Anal. Chem. 2010, 82, 2262–2271. [DOI] [PubMed] [Google Scholar]
- 20. Allard, W. J. , Matera, J. , Miller, M. C. , Repollet, M. et al., Tumor cells circulate in the peripheral blood of all major carcinomas but not in healthy subjects or patients with nonmalignant diseases. Clin. Cancer Res. 2004, 10, 6897–6904. [DOI] [PubMed] [Google Scholar]
- 21. Takao, M. , Takeda, K. , Enumeration, characterization, and collection of intact circulating tumor cells by cross contamination‐free flow cytometry. Cytom. A 2011, 79, 107–117. [DOI] [PubMed] [Google Scholar]
- 22. Masuda, T. , Sugiyama, N. , Tomita, M. , Ishihama, Y. , Microscale phosphoproteome analysis of 10,000 cells from human cancer cell lines. Anal. Chem. 2011, 83, 7698–7703. [DOI] [PubMed] [Google Scholar]
- 23. Elias, J. E. , Gygi, S. P. , Target‐decoy search strategy for increased confidence in large‐scale protein identifications by mass spectrometry. Nat. Methods 2007, 4, 207–214. [DOI] [PubMed] [Google Scholar]
- 24. Mollet, M. , Godoy‐Silva, R. , Berudugo, C. , Chalmers, J. J. , Computer simulations of the energy dissipation rate of fluorescence‐activated cell sorter: implications to cells. Biotech. Bioeng. 2008, 100, 260–272. [DOI] [PubMed] [Google Scholar]
- 25. Kyte, J. , Doolittle, R. F. , A simple method for displaying the hydropathic character of a protein. J. Mol. Biol. 1982, 157, 105–132. [DOI] [PubMed] [Google Scholar]
- 26. Bratcher, P. E. , Gaggar, A., Factors influencing the measurement of plasma/serum surfactant protein D levels by ELISA. PLoS One 2014, 9, e111466. [DOI] [PMC free article] [PubMed] [Google Scholar]
- 27. Goebel‐Stengel, M. , Stengel, A. , Taché, Y. , Reeve, J. R. , The importance of using the optimal plasticware and glassware in studies involving peptides. Anal. Biochem. 2011, 414, 38–46. [DOI] [PMC free article] [PubMed] [Google Scholar]
- 28. Kasuga, K. , Comprehensive analysis of MHC ligands in clinical material by immunoaffinity‐mass spectrometry. Methods Mol. Biol. 2013, 1023, 203–218. [DOI] [PubMed] [Google Scholar]
- 29. Dai, L. , Li, C. , Shedden, K. A. , Lee, C. J. et al., Quantitative proteomic profiling studies of pancreatic cancer stem cells. J. Proteome Res. 2010, 9, 3394–3402. [DOI] [PMC free article] [PubMed] [Google Scholar]
- 30. Bridges, C.R. , Curtis, A. , Sanders, D. , EBO — Experimental Biology Online Annual 1996/97, Springer; Berlin Heidelberg, 1998. [Google Scholar]
Associated Data
This section collects any data citations, data availability statements, or supplementary materials included in this article.
Supplementary Materials
Supplemental Figure 1. Venn diagrams showing the overlap of the proteins identified in each experiment.
Supplemental Table 1. PSMs from 100 or 1,000 THP‐1 cells in each group (N=3)
Supplemental Table 2. Numbers of peptides and proteins identified from 100 or 1,000 sorted THP‐1 cells in each group (N=3, merged).
Supporting document