Abstract
C2 domains are independently folded modules that often target their host proteins to anionic membranes in a Ca2+-dependent manner. In these cases, membrane association is triggered by Ca2+ binding to the negatively charged loop region of the C2 domain. Here, we used a non-native metal ion, Cd2+, in lieu of Ca2+ to gain insight into the contributions made by long-range Coulombic interactions and direct metal ion-lipid bridging to membrane binding. Using X-ray crystallography, NMR, FRET, and vesicle co-sedimentation assays, we demonstrate that, although Cd2+ binds to the loop region of C2A/B domains of Synaptotagmin 1 with high affinity, long-range Coulombic interactions are too weak to support membrane binding of individual domains. We attribute this behavior to two factors: the stoichiometry of Cd2+ binding to the loop regions of the C2A and C2B domains and the impaired ability of Cd2+ to directly coordinate the lipids. In contrast, EPR experiments revealed that Cd2+ does support membrane binding of the C2 domains in full-length Synaptotagmin 1, where the high local lipid concentrations that result from membrane tethering can partially compensate for lack of full complement of divalent metal ions and specific lipid coordination in Cd2+-complexed C2A/B domains. Our data suggest that long-range Coulombic interactions alone can drive the initial association of C2A/B with anionic membranes, and that Ca2+ further augments membrane binding by the formation of metal ion-lipid coordination bonds and additional Ca2+ ion binding to the C2 domain loop regions.
Keywords: Synaptotagmin 1, C2 domain, C2AB fragment, Ca2+ signaling, protein-membrane interactions, Cd2+ as Ca2+ surrogate, electrostatic interactions
Ca2+-dependent phospholipid-binding C2 domains1, 2 are integral structural elements of the proteins involved in signal transduction and membrane trafficking.3–6 The regulation of numerous cellular activities such as neurotransmitter release, cellular growth, and transcription depends on the interaction of these effector proteins with membranes via C2 domains.7, 8 Therefore, understanding the mechanism of how C2 domains interact with lipid membranes is a crucial step towards elucidating their molecular role in cellular signal transduction. In this work, we used the C2A and C2B domains of Synaptotagmin 1 (Syt1), a major Ca2+ sensor of evoked neurotransmission,9 to gain insight into the determinants of C2-membrane interactions.
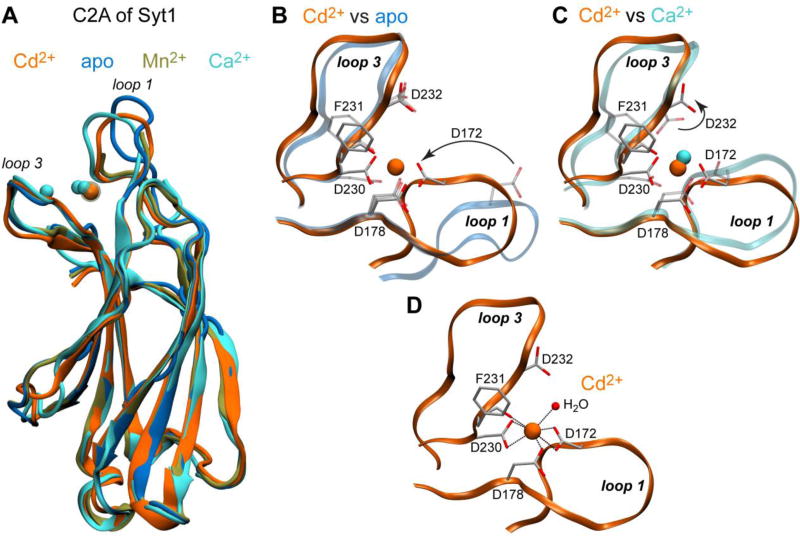
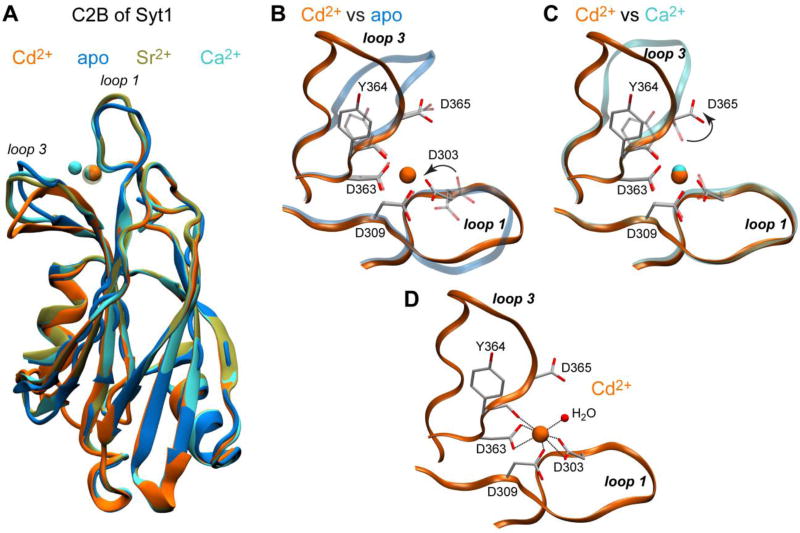
The core of C2A/B domains has a characteristic β-sandwich fold that consists of 8 antiparallel β-strands, connected by loop regions (Figs. 1A and 2A).10, 11 The Ca2+-sensing function of Syt1 resides on the aspartate-rich loops at the tips of C2A/B domains that can bind up to 3 (C2A) and 2 (C2B) Ca2+ ions.12, 13 Ca2+ binding triggers the peripheral interaction of the C2 domains with membranes containing anionic phospholipids, such as phosphatidylserine (PtdSer),14–17 but has a negligible effect on the average conformation of the protein backbone.11, 18–20 Rather, interactions with metal ions attenuate the dynamics of the loop regions that have considerable flexibility in the apo forms of C2 domains.21, 22
Figure 1.
Structural analysis of Cd2+-complexed C2A. (A) Backbone superposition of four C2A structures: Cd2+-complexed (this work, 5T0R, orange), apo (4WEE, blue), Ca2+-complexed (1BYN/NMR,18 cyan), and Mn2+-complexed (3F05, tan). (B, C) Pairwise comparison of loop regions of Cd2+-complexed C2A with those of the apo and Ca2+-complexed C2A (shown with transparent representation) highlights the differences between the conformation of loops and coordinating residues. In the ultra-high resolution structure of apo C2A, D178 and D232 are modeled as two conformations. In (C), only one Ca2+ ion and protein ligands of Cd2+ are shown for clarity. (D) Coordination geometry of the Cd2+ site. Cd2+ has 7 oxygens ligands in its first coordination sphere, 6 contributed by C2A and 1 by a water molecule.
Figure 2.
Structural analysis of Cd2+-complexed C2B. (A) Backbone superposition of four C2B structures: Cd2+-complexed (this work, 5T0S, orange), apo penta-mutant (5CCJ,46 blue), Ca2+-complexed (1TJX,47 cyan), and Sr2+-complexed (1TJM,47 tan). (B, C) Pairwise comparison of loop regions of Cd2+-complexed C2B with those of the apo and Ca2+-complexed C2B highlights the differences between the conformation of loops and coordinating residues. The structural elements of apo and Ca2+-complexed C2B are shown with transparent representation. Only one Ca2+ ion and protein ligands of Cd2+ are shown for clarity in (C). (D) Coordination geometry of the Cd2+ site. Cd2+ has 7 oxygens ligands in its first coordination sphere, 6 contributed by C2B and 1 by a water molecule.
Calcium has been proposed to promote C2-membrane association by two different mechanisms. First, Ca2+ binding makes the C2 domain more electropositive, by neutralizing the negatively charged loop region.18, 23 Second, Ca2+ acts to bridge the C2 domain to membranes by directly coordinating negatively charged lipid head groups.24–26 In the former Ca2+ acts as a general “electrostatic switch” to promote long-range Coulombic interactions with negatively charged membranes. In the latter Ca2+ plays a specific role that involves the rearrangement of its coordination sphere. In addition to electrostatics, hydrophobic interactions mediated by residues surrounding the loop regions contribute to the C2-membrane interaction.27, 28
Although the dominant role of electrostatics in the C2-membrane interactions is well established, the contributions made by these general and specific roles of Ca2+ remain unclear. For instance, mutations that disrupt Ca2+ binding to the C2A domain of Syt1 implicate the Ca2+-induced change in the electrostatic surface potential as a major factor.29 Alternatively, the finding that charge-reversal mutations mimicking Ca2+ binding cannot support membrane interaction of the C2 domain in PKCβII points towards the importance of direct metal-lipid bridging.30 In this context, Ca2+ surrogates in the form of non-native divalent metal ions can be used as valuable tools to gain insight into the contribution of long-range Coulombic interactions and metal ion-lipid bridging to membrane binding.
We previously demonstrated that toxic heavy metal ions, Cd2+ and Pb2+, bind to the C2 domain of PKCα with higher affinity than Ca2+.31, 32 Both metal ions bind to the loop region of the C2 domain with the same stoichiometry as Ca2+. However, the functional consequences are strikingly different: Pb2+ supports the C2-membrane interactions, whereas Cd2+ does not. We attributed this behavior to the differences in Lewis acidity and coordination preferences of Cd2+ and Pb2+/Ca2+.31 We speculated that the preference for low coordination numbers33 and soft ligands34 impairs the ability of Cd2+ to directly coordinate the oxygens of lipid head-groups. The implication of these findings is that the long-range Coulombic interactions alone are not sufficient to drive membrane association of the PKC C2 domain.
In the present work, we examined the two C2 domains of Syt1 to determine whether the behavior of the PKC C2 domain could be generalized to other Ca2+-dependent C2 domains. The C2A and C2B domains share 38% sequence identity and occur in tandem in the cytosolic part of Syt1 where they are separated by an 8-residue linker. We demonstrate that Cd2+ serves as a good structural surrogate for Ca2+ in the individual C2A and C2B domains, but can support their membrane association only in the context of full-length Syt1. Our results illustrate the significance of both, long-range Coulombic interactions and high effective local lipid concentrations in the native protein environment, for the membrane association of C2 domains.
EXPERIMENTAL PROCEDURES
Materials
1-palmitoyl-2-oleoyl-sn-glycero-3-phosphocholine (POPC), 1-palmitoyl-2-oleoyl-sn-glycero-3-phospho-L-serine (POPS), 1-palmitoyl-2-oleoyl-sn-glycero-3-phospho-(1'-rac-glycerol) (POPG), dimethyldioctadecylammonium (DDAB), and 1,2-dioleoyl-sn-glycero-3-phosphoethanolamine-N-(5-dimethylamino-1-naphthalenesulfonyl) (dansyl-PE) were obtained from Avanti Polar Lipids Inc. (Alabaster, AL). Residual divalent metal ions were removed from all buffers with the ion-chelating resin, Chelex 100 (Sigma-Aldrich). The stock solutions of metal ions were prepared using the following salts: Tb(III) chloride hexahydrate (Acros Organics), Cd(II) nitrate tetrahydrate (Sigma-Aldrich), and standardized 1 M solution of Ca (II) chloride (Fluka Analytical). Sigmacote® and IgG from human serum (both from Sigma-Aldrich) were used to coat quartz cuvettes for Tb3+ luminescence and protein-to-membrane Förster resonance energy transfer (FRET) experiments, respectively. The cDNA of murine Syt1 was purchased from Open Biosystems (GE Life Sciences).
Protein expression and purification
The following Syt1 domains: C2A (residues 137–265), C2B (residues 271–421), and C2AB (residues 137–421) were cloned into a pET-SUMO vector (Novagen, Madison, WI). To improve the SUMO protease cleavage efficiency of the C2A-containing constructs, a serine residue was added at the N-terminus using the QuikChange mutagenesis kit (Stratagene, La Jolla, CA). The sole cysteine residue of C2B at position 277 was replaced with a serine to eliminate the need for reducing agents that are known to form complexes with metal ions. The C277S variant of C2B was used for all experiments with the exception of crystallographic studies. For the EPR and vesicle sedimentation experiments, the cytosolic Syt1 constructs included: C2A (residues 96–265), C2B (residues 249–421) and C2AB (residues 136–421), which were modified, expressed and purified as described previously.35 The full-length Syt1 from R. norvegicus (1–421) was previously cloned into a pET-28a vector with an N-terminal 6xHis tag.36 Native cysteines (C73A, C74A, C76A, C78A, C82S, and C277S) were mutated using the QuickChange site-directed mutagenesis kit, and single cysteine point mutations were introduced into the cysteine-free construct using the same method at positions M173C or V304C. DNA sequences for all mutations were verified by DNA sequencing (Genewiz, South Plainfield, NJ). Expression and purification of all protein is described in the SI (section S1).
Crystallization, structure determination and refinement
The crystallization samples contained: (i) 17 mg/mL C2A and 7 mM Cd(II) nitrate in a 20 mM MES buffer at pH 6.0; and (ii) 21 mg/mL C2B, 5 mM Cd(II) nitrate, and 0.8 mM TCEP in a 10 mM HEPES buffer at pH 7.0. Automated screening for crystallization was carried out using the sitting drop vapour-diffusion method with an Art Robbins Instruments Phoenix system in the X-ray Crystallography Core Laboratory at UTHSCSA. Crystals for Cd2+-bound C2A were obtained from Qiagen PEGs II Suite condition #80 (0.1 M tri-sodium citrate, 16% polyethylene glycol 6000) at 4 °C. Crystals for Cd2+-bound C2B were obtained from Rigaku Precipitant Synergy condition #116 (13.4% polyethylene glycol 400, 10.05% polyethylene glycol 1000, 0.15 M potassium phosphate dibasic/sodium phosphate monobasic pH 6.5) at 22 °C.
Data collection and refinement statistics are given in Table S1. Difference Fourier map analysis of both structures showed that the modeled Cd2+ are indeed heavy atoms when compared to the anomalous signal observed for sulfur atoms in the proteins. Anomalous difference Fourier peaks were observed at 23.3 and 21.4 r.m.s.d. for C2A-Cd2+ and C2B-Cd2+, respectively. The coordinates of the Cd2+ complexes were deposited in the Protein Data Bank under accession codes 5T0R (C2A) and 5T0S (C2B).
Tb3+ luminescence experiments
Purified recombinant C2A and C2B were buffer-exchanged into a decalcified solution of 10 mM Bis-tris at pH 7.0 and 100 mM KCl, using PD-10 desalting columns. The luminescence measurements were carried out on a PC1 photon counting spectrofluorometer (ISS, Champaign, IL) at 25 °C with an excitation wavelength of 280 nm, and 1 (2) nm slit widths on the excitation (emission) channels. A 370 nm cut-on filter was used on the emission channel to attenuate the Trp emission and water Raman peak. The Tb3+ luminescence spectrum consists of several peaks, with the highest-intensity peak having a maximum at 545 nm (Fig. S1). Tb3+ binding experiments were carried out by adding the aliquots of Tb3+ stock solution (buffer) to the sample (reference) cuvettes containing 2 ml of 15 µM C2A or C2B domains. The sample dilution at the end of the experiments never exceeded 10%. The intensity of Tb3+ luminescence was monitored at the maxima of its most intense emission peak, 545 nm, with averaging over 60 measurements. The post-acquisition processing included the correction of all intensities for dilution and subtraction of the sample and reference signals. The standard deviation of three independent replicates was used as an estimate of experimental error. To obtain the apparent binding affinity of Tb3+ to the C2B domain, the data were fitted with the following equation:
| (1) |
where I is the intensity of Tb3+ luminescence at 545 nm; Imax is the intensity reached upon full C2B saturation; and P0 and L0 are the total C2B and Tb3+ concentrations, respectively. For the metal ion displacement experiments, Tb3+-bound proteins were prepared by adding 240 µM Tb3+ to 15 µM C2A and 65 µM Tb3+ to 15 µM C2B. The Tb3+ luminescence intensity at 545 nm was monitored as a function of increasing [M2+], where M=Ca, Cd.
Nuclear Magnetic Resonance (NMR) spectroscopy
All binding experiments were conducted at 25 °C on a Bruker AVANCE III NMR instrument, operating at 1H Larmor frequency of 500 MHz and equipped with a room temperature probe. The binding of M2+ (M=Ca,Cd) to [U-15N] enriched C2A and C2B was monitored using 1H-15N HSQC or SOFAST-HMQC37 spectra. The protein concentration was 100 µM in a buffer solution containing 20 mM MES at pH 6.0, 150 mM KCl, 0.02% NaN3, and 8% D2O. The spectra were acquired at Ca2+ concentrations ranging from 25 µM to 40 mM, and Cd2+ concentrations ranging from 25 µM to 20 mM (C2A) and 40 mM (C2B). The spectra were processed using NMRPipe38 and analyzed using Sparky.39 The cross-peaks assignments were obtained from BMRB entries #4039 (apo C2A), #4041 (Ca2+-bound C2A), and #5194 (Ca2+-bound C2B). In addition, 3D HNCACB and CBCACONH spectra40 acquired on a VNMRS NMR instrument operating at 1H Larmor frequency of 600 MHz were used to verify the assignments of apo C2A. The spectra at intermediate Ca2+ and Cd2+ concentrations were assigned by monitoring the trajectory of the cross-peaks in the NMR spectra at different concentrations of M2+. The chemical shift perturbation (CSP) due to M2+ binding, Δ, was calculated using the following equation:
| (2) |
where ΔδH and ΔδN are residue-specific 1H and 15N chemical shift differences between the apo and metal ion-bound states of the proteins. Cd2+ binding curves were constructed by plotting Δ as a function of total Cd2+ concentration. The binding curves were globally fitted with a single-site binding model described by Eq. (1) (vide supra), except that combined chemical shift differences were used instead of fluorescence intensities.
Protein-to-membrane FRET experiments
Membrane interactions of C2A, C2B and C2AB in the presence of Ca2+ and Cd2+ were monitored by FRET between the native tryptophan residues and vesicle-embedded dansyl-PE fluorophores, as previously described.19, 41 The lipid composition of the 100 nm large unilamellar vesicles (LUVs) was POPC:POPS:dansyl-PE=73:20:7. The buffer solution comprising 10 mM Bis-tris at pH 7.0 and 100 mM KCl was supplemented with 1 mM TCEP in the case of C2AB to maintain the reducing environment.
The C2A experiments were carried out in the metal-ion titration mode, where the aliquots of metal ion stock solutions were added to 0.5 µM C2A pre-incubated with 150 µM total lipids. The C2B and C2AB experiments were carried out in the LUV titration mode, where the aliquots of the LUV stock solution were added stepwise to 0.5 µM proteins pre-incubated with 0.5 mM Ca2+ or Cd2+. Because C2B has a propensity to cluster LUVs, which in turn significantly increases the intensity of light scattering, the total lipid concentration was kept below 70 µM.
The change in dansyl fluorescence was monitored at 495 nm using single-wavelength intensity scans with averaging over 60 measurements. Protein-to-membrane FRET efficiency, ΔF, was calculated by subtracting the signals from sample and reference cuvettes, with the reference cuvette containing all components except protein. The experimental error in ΔF was estimated as the standard deviation in the average dansyl fluorescence of three replicate samples. The data were plotted as ΔF versus total metal ion or protein-accessible POPS concentrations. The C2A data, for which the plateau region ΔFmax could be obtained experimentally, were fitted with the following equation:
| (3) |
where [M2+] is the concentration of metal ion and n is the Hill coefficient.
Vesicle co-sedimentation and dynamic light scattering (DLS) experiments
Vesicle co-sedimentation assays were conducted independently by two laboratories (T.I.I. and D.S.C.), as described in the SI (section S3). DLS experiments were carried out at 25 °C using a Malvern Zetasizer™ Nano S instrument equipped with a 633 nm He-Ne laser source. The samples contained a mixture of 0.5 µM C2B, 100 nm-diameter LUVs (100 µM total lipids, POPC:POPS=80:20), and 1–2 mM of M2+ (M=Ca, Cd) in a 10 mM Bis-tris pH at 7.0 and 100 mM KCl. Prior to measurements, the samples were incubated for 30 min at 25 °C or 12 hours at 4 °C.
Electron Paramagnetic Resonance (EPR) measurements
For EPR measurements, LUVs were formed from POPC:POPS=80:20 in a Ca2+ free buffer (20 mM HEPES, 150 mM KCl, pH 7.4) and either 1 mM Ca2+ or Cd2+ was added as needed. EPR spectra were recorded using a Bruker X-Band EMX spectrometer (Bruker Biospin, Billerica, MA) equipped with an ER 4123D dielectric resonator. All EPR spectra were recorded using a 100 G magnetic field sweep, 1 G modulation, and 2.0-milliwatt incident microwave power at a temperature of 298 K. The measurements were performed on 10-µl samples in glass capillary tubes (0.60 mm inner diameter × 0.84 mm outer diameter round capillary; VitroCom, Mountain Lakes, NJ). The protein concentrations used were approximately 75 µM. The phasing, normalization, and subtraction of EPR spectra were performed using LabVIEW software provided by Dr. Christian Altenbach (UCLA, Los Angeles, CA). Progressive power saturation of the EPR spectrum was used to determine nitroxide membrane depth and was performed as previously described.35, 42 In this case, samples were placed into TPX-2 capillaries, and the values of ΔP½ obtained in air and in the presence of Ni(II)EDDA were used to calculate a depth parameter, Φ.16 The spin label depth was then estimated using the empirical expression:
| (4) |
where x is the distance of the spin label from the phospholipid phosphate plane in the bilayer.43
RESULTS
Structural analysis of Cd2+-complexed C2A and C2B domains
The C2A and C2B domains of Syt1 bind Ca2+ ions at loop regions located at the tip of the domains.11, 13 The coordinating atoms are all-oxygen, with the majority of ligands provided by the sidechains of aspartic acids in both mono- and bidentate coordination modes. Our first objective was to identify Cd2+ binding sites on C2A and C2B domains, determine their coordination geometry, and evaluate the conformation of the loop regions. We were able to crystallize both domains in the Cd2+-complexed states and obtain their high-resolution structures using X-ray crystallography. The crystallization was carried out with protein samples pre-incubated with concentrated solutions of Cd(II) nitrate. In both structures, there was a single Cd2+ ion bound to Syt1 domains.
The backbone superposition of the Cd2+-complexed C2A with other available C2A structures produced r.m.s.d. values ranging from 0.9 to 1.2 Å (Fig. 1A and Table S2). The largest deviation in backbone conformation was observed for loop 1, which is tilted away from the metal ion-binding site in the ultra-high resolution structure of the apo C2A. The reason for these conformational differences is evident from the expansion of the loop region (Fig. 1B): Asp172 is rotated “out” of the metal-ion binding site in the apo form, while in the Cd2+-bound form Asp172 is “in”, forming a coordination bond between its sidechain oxygen and Cd2+.
With respect to the metal ion position, Cd2+ binds to what was previously identified as the Ca1 site in the first NMR structure of C2A that contains 3 Ca2+ ions (Fig. 1A);18 only one Ca2+ populating Ca1 site is shown for clarity in Fig. 1C. The major difference is the conformation of the Asp232 sidechain that coordinates the first (and second) Ca2+ ions but not Cd2+. In the Cd2+-bound structure, the Asp232 sidechain is rotated “out”, with its place taken by a water molecule (Fig. 1D). Altogether, Cd2+ has seven oxygen ligands in its first coordination sphere. Asp230 and Asp172 sidechains show bidentate coordination, contributing 2 ligands each. The other three are the backbone oxygen of Phe231, one of the Asp178 sidechain oxygens, and the water molecule (Table S3).
Inspection of the Cd2+-complexed C2B structure revealed that Cd2+ binding alters the conformation of loop 3. This is evident from the backbone superposition of C2B structures (Fig. 2A) and the expansion of loop regions (Figs. 2B and C). Similar to C2A, Cd2+ binds to the Ca1 site of C2B and has a coordination number of 7 (Fig. 2D). Asp303 and Asp363 serve as bidentate ligands, contributing 4 oxygens total to the coordination sphere. Asp309 and Tyr364 contribute one sidechain and one carbonyl oxygen, respectively. The 7th ligand is the water molecule, which takes the place of the Asp365 sidechain in the Ca2+-complexed C2B (Table S5).
In summary, under crystallization conditions we observed a single hepta-coordinated Cd2+ ion bound to the Ca1 site of the C2A and C2B domains. Cd2+ binding slightly alters the loop conformation of the domains in the crystalline state.
C2A and C2B bind Cd2+ with higher affinity than Ca2+
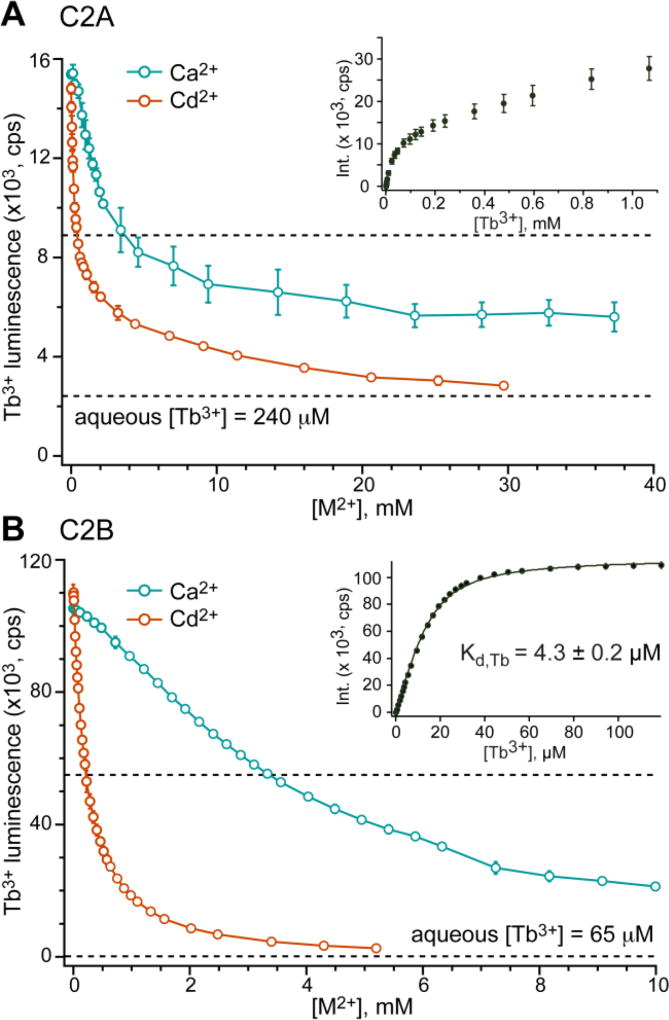
FRET between native Trp residues and protein-bound Tb3+ is a sensitive probe of metal ion binding sites in proteins.44, 45 We used the displacement of Tb3+ by Ca2+ and Cd2+ to evaluate the relative affinities of these metal ions for the C2A and C2B domains. The C2A-Tb3+ binding curve (inset of Fig. 3A) shows a linear increase in Tb3+ luminescence at high total Tb3+ concentrations. This non-saturatable behavior occurs because FRET efficiency in Tb3+-complexed C2A domain is low and comparable to the luminescence of unbound aqueous Tb3+ whose concentration builds up once the protein is saturated. Since the stoichiometry of Tb3+ binding to C2A is not known a priori, it is difficult to obtain a reliable apparent Kd,Tb from these data. We therefore used this curve to guide our choice of Tb3+ concentration needed for displacement experiments.
Figure 3.
C2A and C2B domains of Syt1 bind Cd2+ with higher affinity than Ca2+. (A) Displacement of bound Tb3+ from C2A by Ca2+ and Cd2+. C2A and Tb3+ concentrations are 15 and 240 µM, respectively. Inset: C2A–Tb3+ binding curve that has non-saturatable behavior due to comparable contributions of FRET and luminescence of free Tb3+ to the observed signal. (B) Displacement of bound Tb3+ from C2B by Ca2+ and Cd2+. C2B and Tb3+ concentrations are 15 and 65 µM, respectively. Inset: C2B–Tb3+ binding curve that shows saturatable behavior and produces Kd,Tb of 4.3±0.2 µM when fitted with a single-site binding model.
Displacement of Tb3+ from C2A by divalent metal ions manifests itself as a steady decrease of Tb3+ luminescence (Fig. 3A and S1). At high concentrations of Cd2+, the luminescence reaches the level of aqueous Tb3+, indicating full displacement. Ca2+ can displace some, but not all Tb3+ from C2A. This is evident from the plateau-like region at high calcium concentrations; the intensity of this region exceeds that of aqueous Tb3+. Overall, it takes ~8 times more Ca2+ than Cd2+ to decrease the luminescence of Tb3+-saturated C2A by 50%, indicating that Cd2+ has higher affinity to C2A than Ca2+.
In the C2B domain, the FRET efficiency significantly exceeded the luminescence of aqueous Tb3+. This resulted in a binding curve with apparent saturatable behavior that could be fit well with a single-site binding model (inset of Fig. 3B). We obtained a Tb3+ dissociation constant of 4.3±0.2 µM and used it to conduct a Scatchard-type analysis48 of the Tb3+/Cd2+ displacement data. The analysis assumes a 1:1 metal ion replacement without additional binding events, and is therefore inapplicable to Ca2+ because it has 2 binding sites on C2B. The Scatchard-type analysis produced the dissociation constant of the C2B-Cd2+ complex, 16.3±0.2 µM, which is considerably lower than the corresponding Ca2+ values of 300–600 µM.11 In summary, Tb3+ displacement experiments demonstrate that C2A and C2B domains bind Cd2+ with higher affinity than Ca2+.
Solution NMR experiments report on the stoichiometry and affinity of Cd2+ binding
To evaluate the residue-specific response of C2A/B to Cd2+ binding, we collected 1H-15N HSQC NMR spectra of [U-15N] domains in the presence of varying metal ion concentrations. Binding of divalent metal ions to C2 domains alters the electronic environment of the 1H and 15N nuclei in the loop regions, resulting in chemical shift changes. When binding kinetics falls in the fast exchange regime on the NMR chemical shift timescale, the dependence of the chemical shift on total ligand concentration can be used to construct binding curves and obtain the dissociation constants.
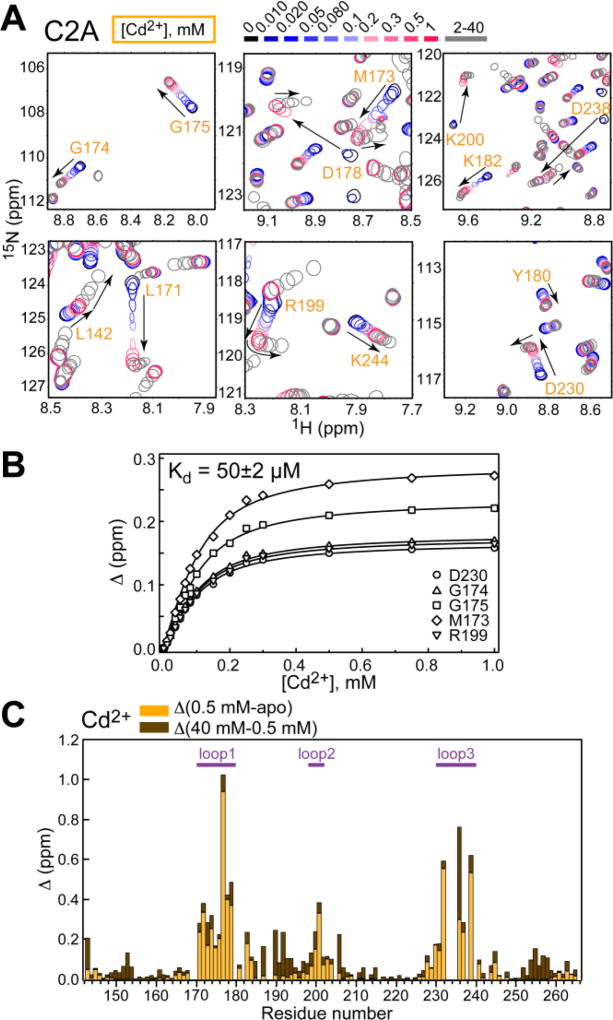
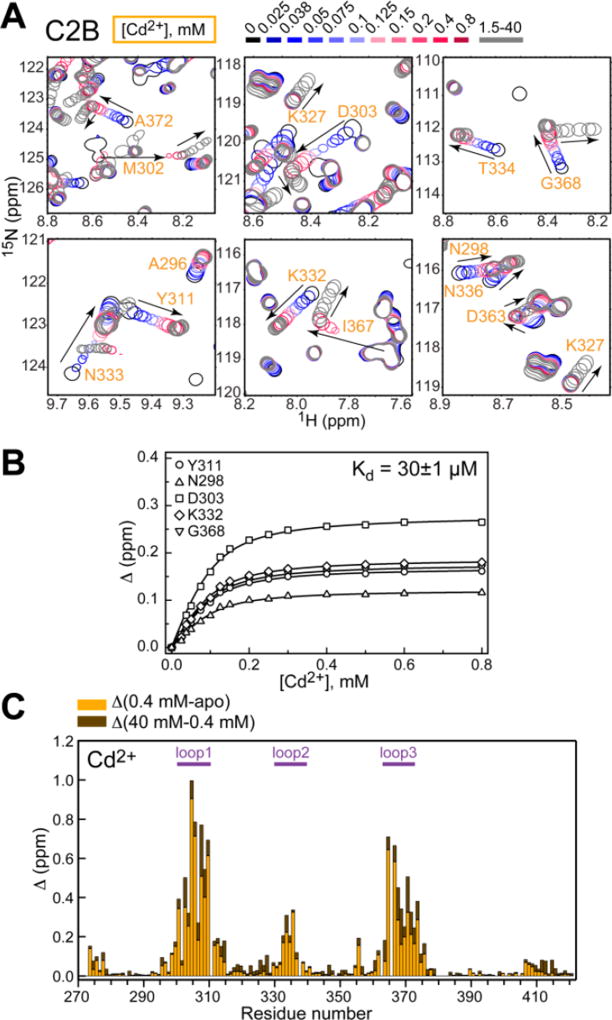
We found that Cd2+ binding kinetics is either fast or intermediate-to-fast for the majority of metal-ion responsive residues in C2B and C2A. This is illustrated by the expansions of the 15N-1H HSQC spectra of the C2A (Fig. 4A) and C2B (Fig. 5A), where several cross-peaks follow a smooth trajectory in response to increasing Cd2+ concentration. For both domains, one can clearly discern the presence of two types of Cd2+ binding events: one that occurs in the “low” Cd2+ concentration regime (≤ 1 mM, color-coded as a blue-red gradient); and the other one that occurs in the “high” concentration regime (1–40 mM, color-coded gray). For both binding studies, we used 100 µM C2A/B.
Figure 4.
Cd2+ populates two types of sites on C2A with drastically different affinities. (A) Expansions of 15N-1H HSQC C2A spectra for the Cd2+ concentration range of 0–40 mM. C2A residues of the loop region respond to either one (e.g., G175, Y180, K200) or both (e.g., L142, D178, R199) binding events. Peak displacement due to the first and second binding events is shown as a blue-red gradient and monochromatic gray, respectively. (B) Representative NMR-detected binding curves constructed for the high-affinity Cd2+ sites(s). Solid lines represent the global fit of 14 residues for the high-affinity site with a Kd of 50±2µM. (C) Chemical shift perturbation plot for the low- and high-concentration regimes of Cd2+.
Figure 5.
Cd2+ populates two sites on C2B with drastically different affinities. (A) Expansions of 15N-1H HSQC C2B spectra for the Cd2+ concentration range of 0–40 mM. C2B residues of the loop region respond to either one (e.g., Y311, K327, T334) or both (e.g., M302, I367, G368) binding events. Peak displacement due to the first and second binding events is shown as a blue-red gradient and monochromatic gray, respectively. (B) Representative NMR-detected binding curves constructed for the high-affinity Cd2+ sites(s). Solid lines represent the global fit of 30 residues for the high-affinity site with a Kd of 30±1µM. (C) Chemical shift perturbation plot for the low- and high-concentration regimes of Cd2+.
C2A has three Ca2+ binding sites with affinities of 54–75 µM, 530 µM, and ~20 mM at pH 7.4/100 mM NaCl.13, 49 Under our experimental conditions (pH 6.0/150 mM KCl), the dissociation constants of Ca2+ increased ~4–5 fold due to competition with protons, to 230±11 µM and 1.59±0.05 mM for the first and second sites, respectively (section S5). Cd2+ binding curves constructed for the C2A domain in the low-concentration regime could be fitted well with a single-site binding model, producing the Kd of 50±2 µM (Fig. 4B). This represents a ~5-fold increase in affinity to site 1 compared to Ca2+. At >1 mM Cd2+, we observed chemical shift changes for a number of residues indicating the presence of low-affinity Cd2+ interactions with C2A (Fig. 4A). This is illustrated in the N-H chemical shift perturbation plot that separates out low and high Cd2+ concentration regimes (Fig. 4C). The low-affinity binding data cannot be fitted reliably due to the absence of a plateau region. Therefore, we can only provide an estimate of >10 mM for the Kd. This represents a >6-fold decrease in affinity of Cd2+ to site 2 compared to Ca2+.
C2B has two Ca2+ sites whose affinities were estimated to be 300–400 and 500–600 µM at pH 6.3/150 mM NaCl,11 and 600–700 and 700–800 µM at pH 6.0/150 mM KCl (section S5). In our Cd2+ binding experiments, we were able to discern two distinct binding events (Fig. 5A). The first event occurred in the micromolar-low millimolar range of Cd2+. The binding curves showed clear saturatable behavior and could be globally fitted with a single-site binding model that produced a dissociation constant of 30±1 µM (Fig. 5B), in good agreement with the Kd value obtained from Tb3+ displacement experiments. This exceeds >20-fold the affinity of Ca2+ to C2B. The second binding event occurred at high mM concentrations of Cd2+. Several loop residues, including Met302, Ile367, and Gly368 (see Fig. 5A), showed titratable behavior at high mM Cd2+ with an estimated Kd of ~50 mM. This represents a >60-fold decrease in affinity of Cd2+ to site 2 compared to Ca2+. Qualitatively, this behavior produced the same chemical shift perturbation pattern as in C2A, with both high- and low-affinity events affecting mostly the loop region (Fig. 5C).
In summary, two Cd2+ ions per domain bind to the loop regions of C2AB in solution, with two of those sites (one in C2A, the other one in C2B) being higher-affinity, and the other two sites being lower-affinity than Ca2+. We then asked if Cd2+ could act as a functional surrogate of Ca2+ and mediate the interactions of Syt1 domains with anionic membranes.
Isolated Cd2+-complexed C2A does not associate with PtdSer-containing membranes
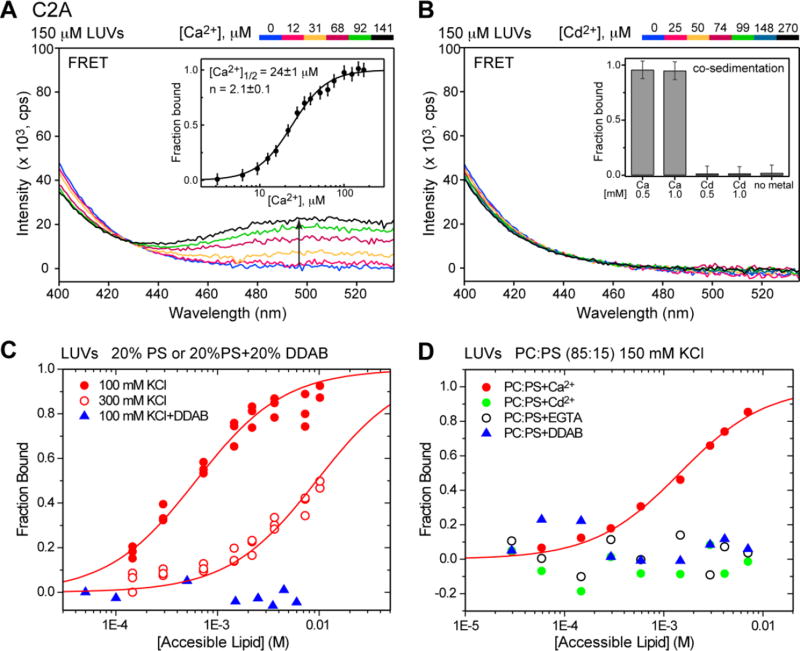
C2A-membrane interactions were probed using FRET between native Trp residues and the dansyl-labeled lipid incorporated into LUVs containing 15–20% (molar) PtdSer as an anionic lipid component. Ca2+-driven association of C2A with membranes resulted in the increase of dansyl emission at 495 nm due to protein-membrane FRET (Fig. 6A). Fitting the FRET binding curve with Hill equation produced [Ca2+]1/2 = 24±1 µM (inset of Fig. 6A). The n value, which reports on the cooperativity50 of the C2A Ca2+-binding sites in the presence of lipids, is 2.1 ± 0.1. In contrast, we observed no increase in dansyl fluorescence upon adding Cd2+ to the C2A in the presence of LUVs (Fig. 6B). This is further corroborated by the results of co-sedimentation experiments: while in the presence of saturating Ca2+ C2A is fully membrane-bound, there is no measurable membrane association at 0.5 and 1 mM Cd2+ (inset of Fig. 6B).
Figure 6.
Cd2+-complexed C2A domain does not associate with PtdSer-containing LUVs. (A) Ca2+-dependent fluorescence emission spectra showing an increase in the intensity of the dansyl band due to protein-membrane FRET. Inset: Ca2+-dependent C2A lipid-binding curve constructed using FRET intensity at 495 nm. (B) Cd2+-dependent fluorescence emission spectra demonstrating that no increase in dansyl emission intensity in the C2A–LUV system is observed upon addition of Cd2+. Inset: the results of vesicle sedimentation experiments that were conducted at 5 µM C2A and 1.5 mM total lipids. (C, D) C2A–lipid binding curves obtained using vesicle co-sedimentation experiments. The increase in ionic strength and neutralization of the negative charge by DDAB significantly weakens the interaction between Ca2+-complexed C2A and membranes (C). No binding of Cd2+-complexed C2A to PtdSer-containing vesicles is observed (D). In both (C) and (D), Ca2+ and Cd2+ are added to a concentration of 1 mM.
The significance of electrostatics in C2A-membrane interactions is illustrated by the results of lipid-dependent co-sedimentation experiments. Increasing the salt concentration from 100 to 300 mM lowers the reciprocal molar membrane partition coefficient of the Ca2+-complexed C2A domain (see Table S6) by 15 fold or 1.6 kcal/mole, and neutralizing the PtdSer negative charge by including equimolar positively charged DDAB into the LUVs completely abolishes any detectable binding (Fig. 6C). As a result, one might expect that Cd2+ binding would make C2A more electropositive and promote interactions with PtdSer-containing membranes. However, even 10 mM total lipid is not sufficient to drive the formation of the C2A-Cd2+-LUV complex (Fig. 6D).
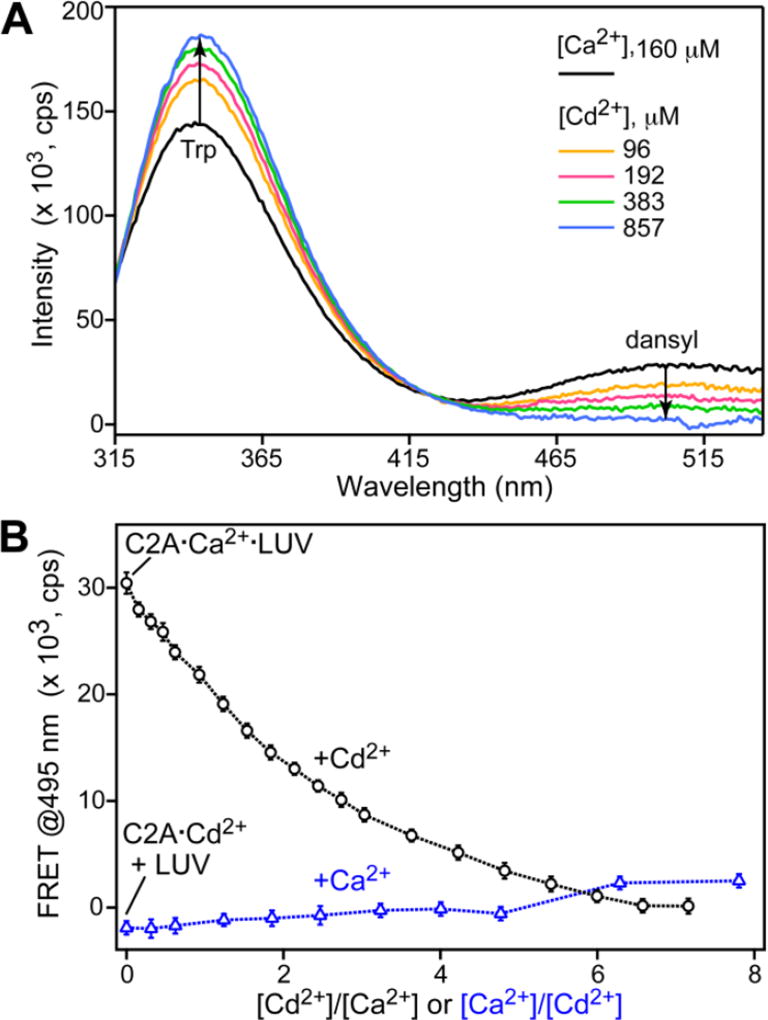
We then tested whether or not Cd2+ is able to compete Ca2+ off C2A in the presence of LUVs. We prepared a ternary C2A-Ca2+-LUV complex by combining LUVs, C2A, and saturating Ca2+. Upon addition of Cd2+ to this sample, FRET progressively decreased, reaching zero at Cd2+ to Ca2+ concentration ratio of 5 (Fig. 7A and black trace of Fig. 7B). We conclude that Cd2+ displaces Ca2+ through high-affinity interactions with a small population of Ca2+-complexed C2A that is not membrane-bound and thereby shifts the equilibrium towards a Cd2+-complexed form that is unable to interact with membranes. The reverse is not true: Ca2+ cannot readily displace Cd2+ from site 1 of C2A even at 8-fold molar excess. This is manifested in a negligible increase of FRET upon Ca2+ titration into the C2A-Cd2+ complex in the presence of LUVs (blue trace of Fig. 7B). These data are consistent with two possible scenarios: (i) the binding of Cd2+ to site 1 reduces the affinity of Ca2+ to sites 2/3 and thereby prevents the formation of mixed Cd2+/Ca2+ C2A species that could potentially associate with membranes; or (ii) the mixed Cd2+/Ca2+ species are formed in solution but their affinity to membranes is low because Cd2+(1) cannot effectively coordinate the lipids.
Figure 7.
Cd2+ competes Ca2+ off C2A, resulting in protein dissociation from the membrane. (A) Fluorescence emission spectra of C2A (0.5 µM) in the presence of LUVs (150 µM) and saturating [Ca2+] (160 µM) collected at increasing [Cd2+]. The intensity of the dansyl band decreases, with the concomitant increase of the intensity of the Trp emission band, indicating C2A displacement from the membrane. (B) FRET-monitored competition experiments between Ca2+ and Cd2+ in the presence of LUVs. The intensity of dansyl emission band plotted as a function of Cd2+/Ca2+ (black trace; [Ca2+]=160 µM) and Ca2+/Cd2+ concentration ratios (blue trace; [Cd2+]=160 µM). While Cd2+ displaces Ca2+ from the protein and results in membrane dissociation, Ca2+ cannot displace Cd2+ from C2A and support membrane association.
Isolated Cd2+-complexed C2B neither appreciably associates with PtdSer-containing membranes nor bridges LUVs
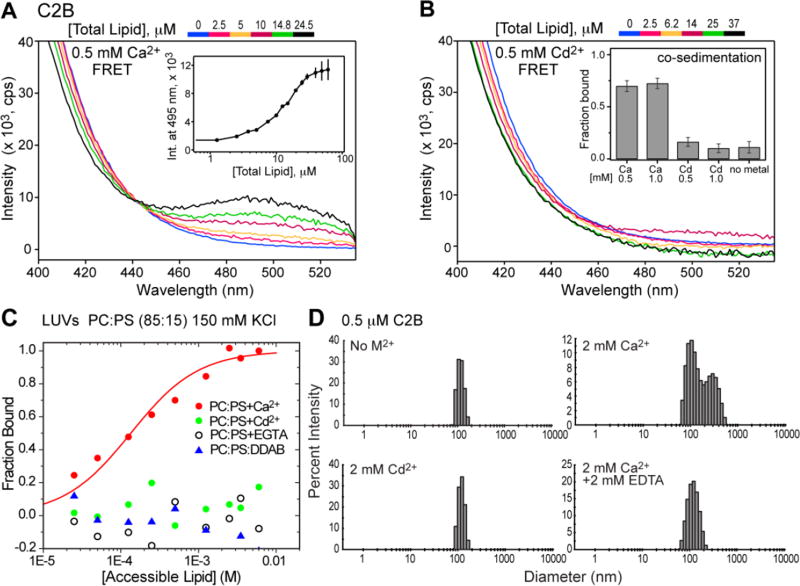
The next step was to determine if Cd2+ has a similar effect on the membrane-binding function of C2B. FRET and co-sedimentation experiments carried out in the lipid-titration mode revealed the same pattern as seen for C2A: while Ca2+ promotes C2B–membrane interactions (Fig. 8A, C), weak membrane binding is observed for the Cd2+-complexed C2B (Fig. 8B, C). Similar to C2A, neutralizing the negative membrane charge with the DDAB membrane component abolished C2B binding to the membrane, indicating the dominant role of electrostatic interactions.
Figure 8.
Cd2+-complexed C2B domain does not appreciably associate with PtdSer-containing LUVs. (A) PtdSer-dependent fluorescence emission spectra showing an increase in the intensity of the dansyl band due to FRET between Ca2+-complexed C2B and LUVs. Inset: PtdSer-dependent C2B lipid binding curve constructed using FRET intensity at 495 nm. (B) PtdSer-dependent fluorescence emission spectra demonstrating that no significant increase in dansyl emission intensity in the Cd2+-C2B system is observed upon addition of LUVs. Inset: the results of vesicle sedimentation experiments conducted at 5 µM C2B and 1.5 mM total lipids. (C) C2B–lipid binding curves obtained using vesicle sedimentation experiments. The neutralization of the negative charge by DDAB abolishes the interactions between Ca2+-complexed C2B and membranes. Ca2+ and Cd2+ are present at concentrations of 1 mM. (D) Dynamic light scattering data show that while Ca2+-complexed C2B can reversibly cluster 100 nm LUVs, the Cd2+-complexed C2B cannot, due its inability to interact with the membranes through the loop regions.
Ca2+-complexed C2B has a well-known propensity to bridge LUVs in a manner that can be reversed by EDTA treatment.51, 52 This behavior manifested itself in our FRET experiments through the increase in scattering intensity at high concentrations of lipids. Basic residues located at the bottom of the C2B domain (defined relative to the position of the loop regions) have been shown to play an important role in vesicle bridging.51 Most likely, C2B interacts with two membranes simultaneously through the Ca2+ -binding loops at the top of the domain and the basic region at the bottom. Dynamic light scattering experiments showed that in contrast to Ca2+, Cd2+-complexed C2B did not alter the size distribution of LUVs (Fig. 8D). We conclude that the interaction between the loop region of Cd2+-complexed C2B and LUVs is too weak to result in appreciable membrane binding, which in turn hinders the ability of C2B to bridge the vesicles.
In summary, our FRET and sedimentation data clearly illustrate that despite high-affinity interaction of Syt1 C2A/B domains with Cd2+ in solution, neither protein-metal ion complex is able to appreciably interact with PtdSer-containing membranes.
C2AB fragment and full-length Syt1 associate with membranes in the presence of Cd2+
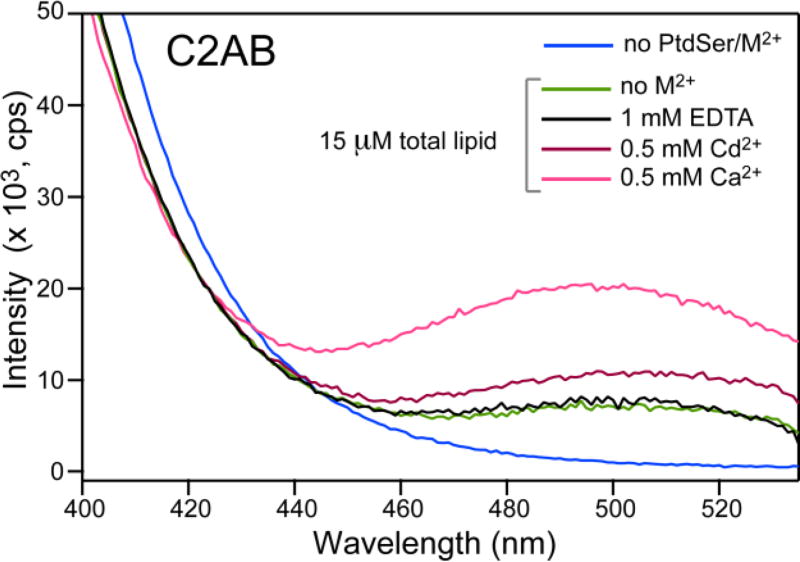
In full-length Syt1, an 8-residue linker connects C2A and C2B. We used the two-domain fragment, C2AB, to determine how Cd2+ binding to both domains affects its membrane-binding properties. We found that under conditions of our FRET experiments, C2AB associated with anionic membranes even in the absence of divalent metal ions (Fig. 9). The membrane association was not due to residual Ca2+, because FRET efficiency did not change upon the addition of EDTA to the sample. Addition of Cd2+ resulted in moderate increase in FRET efficiency, indicating that although the interaction of Cd2+-complexed individual domains with membranes is very weak, the avidity effect due to having two domains on the same polypeptide chain is significant.
Figure 9.
Metal-ion free and Cd2+-complexed C2AB associates with PtdSer-containing LUVs. Fluorescence emission spectra showing the C2AB-to-membrane FRET efficiency under different metal-ion conditions. The C2AB and total lipid concentrations are 0.5 µM and 15 µM, respectively. C2AB associates with PtdSer-containing membranes in a metal-ion independent manner. This interaction is slightly enhanced by Cd2+ based on the increase in FRET efficiency. Ca2+ data are shown for comparison.
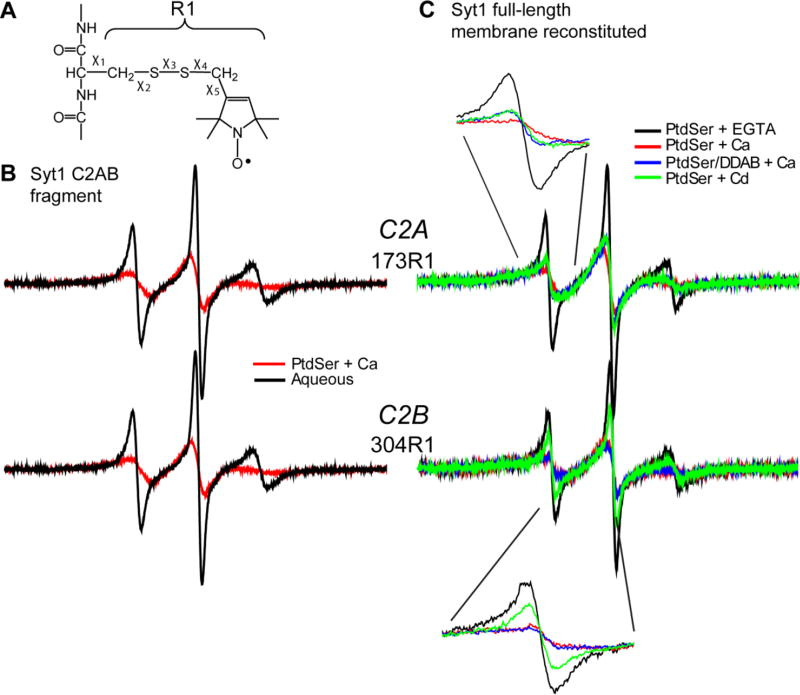
To determine the conditions that support membrane insertion of the C2 domains in the full-length protein, the spin labeled side chain R1 (Fig. 10A) was attached to one site in C2A (173R1) and a second site in C2B (304R1) that are known to penetrate negatively charged membranes in the presence of Ca2+ in the soluble C2AB fragment. For the isolated C2AB domain, these sites exhibit dramatic changes in EPR lineshape that are the result of membrane insertion (Fig. 10B). This broadening of the EPR spectrum is due to slower motion of the R1 label that is likely due to interactions between R1 and the protein that take place in a membrane hydrocarbon environment.53, 54
Figure 10.
EPR spectra reveal membrane contact and insertion of C2A and C2B. (A) The spin labeled side chain R1 is attached to cysteines using a sulfhydryl specific MTS label. (B) EPR spectra for the Syt1 C2AB fragment with R1 at position 173 in C2A or position 304 in C2B in solution (black traces) or in the presence of Ca2+ and PtdSer containing vesicles (red traces), (PC:PS=85:15). (C) EPR spectra from R1 at sites 173 and 304 in full-length Syt1 reconstituted into PtdSer in the absence of Ca2+ (black trace), in the presence of 1 mM Ca2+ (red trace), in the presence of 1 mM Cd2+ (green trace) (PC:PS=85:15) or in the presence of 1 mM Ca2+ when reconstituted into charge neutralized membranes of PtdSer and DDAB (blue trace) (PC:PS:DDAB=70:15:15). Shown in the insets are expansions of the low-field resonance.
For the full-length protein reconstituted into bilayers containing PtdSer, the EPR spectra in the Ca2+-free state resemble those for the aqueous C2AB fragment (Fig. 10C). These EPR lineshapes are characteristic of those seen for the R1 side chain in loop regions of proteins. In the presence of Ca2+, the EPR lineshapes dramatically broaden, indicating that both C2A and C2B have inserted into the membrane (red traces). The spectra for full-length protein in the presence of Ca2+ and PtdSer are virtually identical to those seen at the same positions for the C2AB fragment. No evidence for insertion of C2A and C2B is observed in the absence of Ca2+ or in the absence of PtdSer. However, membrane insertion does occur in the presence of Ca2+ to charge neutralized membranes formed from PtdSer and DDAB (blue traces Fig. 10C), and line-shape changes indicating insertion of the domains is seen in the presence of Cd2+ to PtdSer containing bilayers (green traces, Fig. 10C).
For the C2A site, both the charge neutralized and Cd2+ bound lineshapes are similar (inset Fig. 10C), but slightly more mobile than the Ca2+/PtdSer case, suggesting that these conditions produce a slightly shallower membrane penetration than does Ca2+. For the C2B site, the spectra obtained for Ca2+-dependent insertion into PtdSer or charged neutralized membranes is identical (red and blue traces, respectively), but the spectrum obtained for the Cd2+/PtdSer state is more mobile, suggesting that first loop in C2B does not insert as deeply when bound to Cd2+.
To confirm that these domains insert into the bilayer, and to determine whether the lineshape differences reflect differences in membrane depth, we used progressive power saturation of the EPR spectra and a collision-gradient approach (see Methods) to determine the membrane depth of 173R1 and 304R1. Shown in Table 1 are depth parameters and membrane depths under several conditions. In the presence of Ca2+ and PtdSer, the spin label at 173 on C2A is positioned at an average position of approximately 9 Å into the bilayer below the level of the lipid phosphates and the label at 304 on C2B is positioned at about 3.5 Å. For the Cd2+-bound and charge-neutralized states, 173R1 assumes a shallower position, and it is displaced by as much as 10 Å towards the aqueous phase for the charge-neutralized membrane. For 304R1, a similar position is seen for the Ca2+-dependent insertion into the PtdSer and charge-neutralized membranes, but a more peripheral membrane association is seen for the Cd2+/PtdSer case, where the label is displaced 6 to 7 Å towards the aqueous phase. As seen by a comparing Fig. 10 and Table 1, motional averaging of the R1 side chain and the EPR spectra qualitatively follows the membrane depth of the label.
Table 1.
Depth parameters for full-length membrane reconstituted Syt1.
| protein variant |
lipid conditions | metal added |
depth parameter (Φ) |
Position from lipid phosphate (Å)a |
|---|---|---|---|---|
| FL SYT 173R1 | PCb | Ca2+ | −1.9 ± 0.05 | aqueous |
| PC:PS(15%) | Ca2+ | 1.03 ± 0.05 | 9.29 | |
| Cd2+ | −0.6 ± 0.1 | 3.38 | ||
| PC:PS:DDAB(15%) | Ca2+ | −1.4 ± 0.2 | −1.32 | |
| FL SYT 304R1 | PCb | Ca2+ | −2.0 ± 0.05 | aqueous |
| PC:PS(15%) | Ca2+ | −0.54 ± 0.05 | 3.53 | |
| Cd2+ | −1.7 ± 0.1 | −3.32 | ||
| PC:PS:DDAB(15%) | Ca2+ | −0.9 ± 0.2 | 1.85 |
Negative depths are positioned on the aqueous side of the membrane phosphate plane; positive values are positioned towards the hydrocarbon interior. Depths were estimated using the calibration curve reported in Frazier et al.16 Both Ca2+ and Cd2+ are added to 1 mM.
These depth parameters place the spin label on the C2A or C2B binding loops in the aqueous phase 5 Angstroms or further from the lipid phosphates. Full length Syt1 is present at approximately 75 µM concentration with a total lipid concentration of 15 mM to yield a protein:lipid ratio of approximately 200.
DISCUSSION
In this work, we explored the role of electrostatics in metal ion-mediated interactions of C2A/B domains of Syt1 with phosphatidylserine-containing membranes using a non-native metal ion, Cd2+. The C2A and C2B crystal structures contain a single Cd2+ ion bound to the first calcium site of the C2A/B domains (Figs. 1 and 2). Cd2+ has a near-identical coordination sphere to that of Ca2+, and causes only moderate perturbation of the loop regions. Our solution NMR data support the 1:1 binding stoichiometry: for both domains, we observed only one high affinity Cd2+ site (Figs. 4–5) that would be populated under the conditions of our membrane-binding experiments. This is different from Ca2+ that is expected to populate 2/3 and 2 sites in the C2A and C2B domains, respectively. The incomplete neutralization of the negatively charged loops of C2A/B by Cd2+ is one possible reason why we detected no appreciable interactions between Cd2+-complexed isolated domains and the anionic membranes in protein-membrane FRET and vesicle co-sedimentation experiments (Figs. 6 and 8). Another reason could be the inability of protein-bound Cd2+ to coordinate lipid head-groups. We previously demonstrated that the C2 domain of PKCα, whose loop region binds a full complement of Cd2+ ions, does not associate with PtdSer-containing membranes.31 We speculated that the preference for low coordination numbers33 and soft ligands34 prevents Cd2+ from effectively coordinating the oxygen atoms of lipid headgroups. When the C2A/B domains are present in tandem in the C2AB fragment, the combined binding free energy is sufficient to result in weak but measurable membrane association (Fig. 9). This is in general agreement with the previous finding that Sr2+, which is known to bind C2B with 1:1 stoichiometry47 (the C2A interactions were not investigated), can promote the interactions between the cytoplasmic domain of Syt1 and phosphatidylserine-containing vesicles.55
In contrast to the isolated soluble domains, in full-length Syt1, Cd2+ does mediate insertion of the Syt1 C2 domains into PtdSer membranes, and Ca2+ does mediate insertion into charge-neutralized membranes (Fig. 10). As shown above (Figs. 6 and 8) these conditions do not support binding for the isolated C2 domains. The simplest explanation for these apparently contradictory results is that both generalized electrostatics (a long-range Coulombic interaction) and metal ion coordination are important in promoting syt1 C2 domain membrane attachment.
In the full-length protein, the C2 domains of Syt1 are tethered to the membrane through a long juxta-membrane linker, and much of this linker is associated with the interface, which may limit how far the C2 domains extend from the membrane.36 As a result, the C2 domains will experience a high local lipid concentration in the native protein. For example, if the C2 domains are tethered within 4 Å of the membrane interface, the effective lipid concentration presented to the domains will be near 1 M. By comparison, the highest lipid concentrations that can be reached in co-sedimentation experiments are almost two orders of magnitude lower. As a result, weak interactions (for example, interactions that would yield a membrane partition coefficient of 20 M−1) would not be sufficient to observe membrane binding for the isolated domain, but would be sufficient for the domains to bind membranes in the context of the full-length protein. The substitution of Cd2+ for Ca2+ or the neutralization of the membrane surface potential should diminish the contributions made by lipid-metal ion coordination24, 31 or long-range Coulombic interactions,13, 23 respectively, to the binding of these domains. Neither of these interactions alone produces a strong interaction; however, since the free energy contributions are additive and partition coefficients multiply, both interactions together become significant. The slightly shallower penetration of the domains with Cd2+ or with charge-neutralized membranes seen in the full-length protein is consistent with a significantly reduced binding energy. In addition, for C2B, Cd2+ and PtdSer only allow for a peripheral association of this domain. This might be the result of a reduced electrostatic polarization of the C2B domain and reduced Coulombic attraction due to the fact that only one Cd2+ ion binds with high affinity to this domain (Fig. 1).
In conclusion, our results demonstrate that even if the loop region of C2A/B domains does not contain a full complement of divalent metal ions, long-range Coulombic interactions alone – enhanced by high effective local concentration of the domains – can drive the association of the cytoplasmic domain of Syt1 with anionic membranes. In view of this finding, the Syt1-membrane interaction may initially be driven only by Ca2+ populating site 1 of C2A/B domains. The formation of Ca2+-lipid coordination bonds and binding of additional Ca2+ ions to the loop region may occur after the formation of the shallow “encounter” complex, as was proposed for the C2 domain from protein kinase C.56
Supplementary Material
Acknowledgments
The NSF CAREER award CHE-1151435 supported the majority of the work in T.I.I’s laboratory. A.K.S. and S.K. were supported by the NIH grant R01 GM108998 to T.I.I. and Welch Foundation grant A-1784 to T.I.I, respectively, at the initial stages of the project. Work by S.B.N. was supported by NIH grant PO1 GM072694 to D.S.C. The UTHSCSA X-Ray Crystallography Core Laboratory is supported in part by the Office of the Vice President for Research and by the Cancer Therapy & Research Center NIH/NCI grant P30 CA054174. P.J.H. was funded by Welch Foundation grant AQ-1399.
ABBREVIATIONS
- Syt1
Synaptotagmin 1
- FRET
Förster resonance energy transfer
- NMR
Nuclear Magnetic Resonance
- EPR
Electron Paramagnetic Resonance
Footnotes
ASSOCIATED CONTENT
Supporting Information. One pdf file containing description of experimental procedures, X-ray diffraction data and structure analysis tables, Tb3+ fluorescence spectra, NMR-detected Ca2+-binding data, and surface electrostatic maps of C2A and C2B.
Author Contributions
The manuscript was written through contributions of all authors. All authors have given approval to the final version of the manuscript.
References
- 1.Nalefski EA, Falke JJ. The C2 domain calcium-binding motif: structural and functional diversity. Protein Sci. 1996;5:2375–2390. doi: 10.1002/pro.5560051201. [DOI] [PMC free article] [PubMed] [Google Scholar]
- 2.Corbalan-Garcia S, Gomez-Fernandez JC. Signaling through C2 domains: more than one lipid target. Biochim. Biophys. Acta. 2014;1838:1536–1547. doi: 10.1016/j.bbamem.2014.01.008. [DOI] [PubMed] [Google Scholar]
- 3.Cho W, Stahelin RV. Membrane binding and subcellular targeting of C2 domains. Biochim. Biophys. Acta. 2006;1761:838–849. doi: 10.1016/j.bbalip.2006.06.014. [DOI] [PubMed] [Google Scholar]
- 4.Nishizuka Y. The molecular heterogeneity of protein kinase C and its implications for cellular regulation. Nature. 1988;334:661–665. doi: 10.1038/334661a0. [DOI] [PubMed] [Google Scholar]
- 5.Newton AC. Regulation of protein kinase C. Curr. Opin. Cell Biol. 1997;9:161–167. doi: 10.1016/s0955-0674(97)80058-0. [DOI] [PubMed] [Google Scholar]
- 6.Perin MS, Fried VA, Mignery GA, Jahn R, Sudhof TC. Phospholipid binding by a synaptic vesicle protein homologous to the regulatory region of protein kinase C. Nature. 1990;345:260–263. doi: 10.1038/345260a0. [DOI] [PubMed] [Google Scholar]
- 7.Newton AC. Protein kinase C: structure, function, and regulation. J. Biol. Chem. 1995;270:28495–28498. doi: 10.1074/jbc.270.48.28495. [DOI] [PubMed] [Google Scholar]
- 8.Geppert M, Goda Y, Hammer RE, Li C, Rosahl TW, Stevens CF, Sudhof TC. Synaptotagmin I: a major Ca2+ sensor for transmitter release at a central synapse. Cell. 1994;79:717–727. doi: 10.1016/0092-8674(94)90556-8. [DOI] [PubMed] [Google Scholar]
- 9.Brose N, Petrenko AG, Sudhof TC, Jahn R. Synaptotagmin: a calcium sensor on the synaptic vesicle surface. Science. 1992;256:1021–1025. doi: 10.1126/science.1589771. [DOI] [PubMed] [Google Scholar]
- 10.Sutton RB, Davletov BA, Berghuis AM, Sudhof TC, Sprang SR. Structure of the first C2 domain of synaptotagmin I: a novel Ca2+/phospholipid-binding fold. Cell. 1995;80:929–938. doi: 10.1016/0092-8674(95)90296-1. [DOI] [PubMed] [Google Scholar]
- 11.Fernandez I, Arac D, Ubach J, Gerber SH, Shin O, Gao Y, Anderson RG, Sudhof TC, Rizo J. Three-dimensional structure of the synaptotagmin 1 C2B–domain: synaptotagmin 1 as a phospholipid binding machine. Neuron. 2001;32:1057–1069. doi: 10.1016/s0896-6273(01)00548-7. [DOI] [PubMed] [Google Scholar]
- 12.Shao X, Davletov BA, Sutton RB, Sudhof TC, Rizo J. Bipartite Ca2+-binding motif in C2 domains of synaptotagmin and protein kinase C. Science. 1996;273:248–251. doi: 10.1126/science.273.5272.248. [DOI] [PubMed] [Google Scholar]
- 13.Ubach J, Zhang X, Shao X, Sudhof TC, Rizo J. Ca2+ binding to synaptotagmin: how many Ca2+ ions bind to the tip of a C2-domain? EMBO J. 1998;17:3921–3930. doi: 10.1093/emboj/17.14.3921. [DOI] [PMC free article] [PubMed] [Google Scholar]
- 14.Chapman ER, Jahn R. Calcium-dependent interaction of the cytoplasmic region of synaptotagmin with membranes. Autonomous function of a single C2-homologous domain. J. Biol. Chem. 1994;269:5735–5741. [PubMed] [Google Scholar]
- 15.Chapman ER, Davis AF. Direct interaction of a Ca2+-binding loop of synaptotagmin with lipid bilayers. J. Biol. Chem. 1998;273:13995–14001. doi: 10.1074/jbc.273.22.13995. [DOI] [PubMed] [Google Scholar]
- 16.Frazier AA, Roller CR, Havelka JJ, Hinderliter A, Cafiso DS. Membrane-bound orientation and position of the synaptotagmin I C2A domain by site-directed spin labeling. Biochemistry. 2003;42:96–105. doi: 10.1021/bi0268145. [DOI] [PubMed] [Google Scholar]
- 17.Rufener E, Frazier AA, Wieser CM, Hinderliter A, Cafiso DS. Membrane-bound orientation and position of the synaptotagmin C2B domain determined by site-directed spin labeling. Biochemistry. 2005;44:18–28. doi: 10.1021/bi048370d. [DOI] [PubMed] [Google Scholar]
- 18.Shao X, Fernandez I, Sudhof TC, Rizo J. Solution structures of the Ca2+-free and Ca2+-bound C2A domain of synaptotagmin I: does Ca2+ induce a conformational change? Biochemistry. 1998;37:16106–16115. doi: 10.1021/bi981789h. [DOI] [PubMed] [Google Scholar]
- 19.Morales KA, Lasagna M, Gribenko AV, Yoon Y, Reinhart GD, Lee JC, Cho W, Li P, Igumenova TI. Pb2+ as Modulator of Protein-Membrane Interactions. J. Am. Chem. Soc. 2011;133:10599–10611. doi: 10.1021/ja2032772. [DOI] [PMC free article] [PubMed] [Google Scholar]
- 20.Essen L-O, Perisic O, Katan M, Wu Y, Roberts MF, Williams RL. Structural Mapping of the Catalytic Mechanism for a Mammalian Phosphoinositide-Specific Phospholipase C†. Biochemistry. 1997;36:1704–1718. doi: 10.1021/bi962512p. [DOI] [PubMed] [Google Scholar]
- 21.Hsu Y-H, Burke JE, Stephens DL, Deems RA, Li S, Asmus KM, Woods VL, Dennis EA. Calcium binding rigidifies the C2 domain and the intradomain interaction of GIVA phospholipase A2 as revealed by hydrogen/deuterium exchange mass spectrometry. J. Biol. Chem. 2008;283:9820–9827. doi: 10.1074/jbc.M708143200. [DOI] [PMC free article] [PubMed] [Google Scholar]
- 22.Morales KA, Yang Y, Cole TR, Igumenova TI. Dynamic Response of the C2 Domain of Protein Kinase Cα to Ca 2+ Binding. Biophys. J. 2016;111:1655–1667. doi: 10.1016/j.bpj.2016.09.008. [DOI] [PMC free article] [PubMed] [Google Scholar]
- 23.Murray D, Honig B. Electrostatic control of the membrane targeting of C2 domains. Mol. Cell. 2002;9:145–154. doi: 10.1016/s1097-2765(01)00426-9. [DOI] [PubMed] [Google Scholar]
- 24.Zhang X, Rizo J, Sudhof TC. Mechanism of phospholipid binding by the C2A–domain of synaptotagmin I. Biochemistry. 1998;37:12395–12403. doi: 10.1021/bi9807512. [DOI] [PubMed] [Google Scholar]
- 25.Verdaguer N, Corbalan-Garcia S, Ochoa WF, Fita I, Gomez-Fernandez JC. Ca(2+) bridges the C2 membrane-binding domain of protein kinase Calpha directly to phosphatidylserine. EMBO J. 1999;18:6329–6338. doi: 10.1093/emboj/18.22.6329. [DOI] [PMC free article] [PubMed] [Google Scholar]
- 26.Honigmann A, van den Bogaart G, Iraheta E, Risselada HJ, Milovanovic D, Mueller V, Mullar S, Diederichsen U, Fasshauer D, Grubmuller H, Hell SW, Eggeling C, Kuhnel K, Jahn R. Phosphatidylinositol 4,5-bisphosphate clusters act as molecular beacons for vesicle recruitment. Nat. Struct. Mol. Biol. 2013;20:679–686. doi: 10.1038/nsmb.2570. [DOI] [PMC free article] [PubMed] [Google Scholar]
- 27.Scott AM, Antal CE, Newton AC. Electrostatic and hydrophobic interactions differentially tune membrane binding kinetics of the C2 domain of protein kinase Cα. J. Biol. Chem. 2013;288:16905–16915. doi: 10.1074/jbc.M113.467456. [DOI] [PMC free article] [PubMed] [Google Scholar]
- 28.Gerber SH, Rizo J, Sudhof TC. Role of electrostatic and hydrophobic interactions in Ca(2+)-dependent phospholipid binding by the C(2)A-domain from synaptotagmin I. Diabetes. 2002;51(Suppl 1):S12–18. doi: 10.2337/diabetes.51.2007.s12. [DOI] [PubMed] [Google Scholar]
- 29.Striegel AR, Biela LM, Evans CS, Wang Z, Delehoy JB, Sutton RB, Chapman ER, Reist NE. Calcium binding by synaptotagmin's C2A domain is an essential element of the electrostatic switch that triggers synchronous synaptic transmission. J. Neurosci. 2012;32:1253–1260. doi: 10.1523/JNEUROSCI.4652-11.2012. [DOI] [PMC free article] [PubMed] [Google Scholar]
- 30.Edwards AS, Newton AC. Regulation of Protein Kinase C βII by Its C2 Domain. Biochemistry. 1997;36:15615–15623. doi: 10.1021/bi9718752. [DOI] [PubMed] [Google Scholar]
- 31.Morales KA, Yang Y, Long Z, Li P, Taylor AB, Hart PJ, Igumenova TI. Cd2+ as a Ca2+ surrogate in protein-membrane interactions: isostructural but not isofunctional. J. Am. Chem. Soc. 2013;135:12980–12983. doi: 10.1021/ja406958k. [DOI] [PMC free article] [PubMed] [Google Scholar]
- 32.Morales KA, Lasagna M, Gribenko AV, Yoon Y, Reinhart GD, Lee JC, Cho W, Li P, Igumenova TI. Pb2+ as modulator of protein-membrane interactions. J. Am. Chem. Soc. 2011;133:10599–10611. doi: 10.1021/ja2032772. [DOI] [PMC free article] [PubMed] [Google Scholar]
- 33.Rulíšek L, Vondrášek J. Coordination geometries of selected transition metal ions (Co2+, Ni2+, Cu2+, Zn2+, Cd2+, and Hg2+) in metalloproteins. J. Inorg. Biochem. 1998;71:115–127. doi: 10.1016/s0162-0134(98)10042-9. [DOI] [PubMed] [Google Scholar]
- 34.Chakraborty S, Kravitz JY, Thulstrup PW, Hemmingsen L, DeGrado WF, Pecoraro VL. Design of a three-helix bundle capable of binding heavy metals in a triscysteine environment. Angew. Chem. Int. Ed. Engl. 2011;50:2049–2053. doi: 10.1002/anie.201006413. [DOI] [PMC free article] [PubMed] [Google Scholar]
- 35.Kuo W, Herrick DZ, Cafiso DS. Phosphatidylinositol 4,5-bisphosphate alters synaptotagmin 1 membrane docking and drives opposing bilayers closer together. Biochemistry. 2011;50:2633–2641. doi: 10.1021/bi200049c. [DOI] [PMC free article] [PubMed] [Google Scholar]
- 36.Lu B, Kiessling V, Tamm LK, Cafiso DS. The juxtamembrane linker of full-length synaptotagmin 1 controls oligomerization and calcium-dependent membrane binding. J. Biol. Chem. 2014;289:22161–22171. doi: 10.1074/jbc.M114.569327. [DOI] [PMC free article] [PubMed] [Google Scholar]
- 37.Schanda P, Brutscher B. Very fast two-dimensional NMR spectroscopy for real-time investigation of dynamic events in proteins on the time scale of seconds. J. Am. Chem. Soc. 2005;127:8014–8015. doi: 10.1021/ja051306e. [DOI] [PubMed] [Google Scholar]
- 38.Delaglio F, Grzesiek S, Vuister GW, Zhu G, Pfeifer J, Bax A. NMRPipe: a multidimensional spectral processing system based on UNIX pipes. J. Biomol. NMR. 1995;6:277–293. doi: 10.1007/BF00197809. [DOI] [PubMed] [Google Scholar]
- 39.Lee W, Tonelli M, Markley JL. NMRFAM-SPARKY: enhanced software for biomolecular NMR spectroscopy. Bioinformatics. 2015;31:1325–1327. doi: 10.1093/bioinformatics/btu830. [DOI] [PMC free article] [PubMed] [Google Scholar]
- 40.Muhandiram DR, Kay LE. Gradient-Enhanced Triple-Resonance Three-Dimensional NMR Experiments with Improved Sensitivity. Journal of Magnetic Resonance, Series B. 1994;103:203–216. [Google Scholar]
- 41.Morales KA, Igumenova TI. Synergistic Effect of Pb2+ and Phosphatidylinositol 4, 5-Bisphosphate on C2 Domain-Membrane Interactions. Biochemistry. 2012;51:3349–3360. doi: 10.1021/bi201850h. [DOI] [PMC free article] [PubMed] [Google Scholar]
- 42.Victor K, Cafiso DS. Structure and position of the N-terminal membrane-binding domain of pp60src at the membrane interface. Biochemistry. 1998;37:3402–3410. doi: 10.1021/bi9721501. [DOI] [PubMed] [Google Scholar]
- 43.Herrick DZ, Sterbling S, Rasch KA, Hinderliter A, Cafiso DS. Position of synaptotagmin I at the membrane interface: cooperative interactions of tandem C2 domains. Biochemistry. 2006;45:9668–9674. doi: 10.1021/bi060874j. [DOI] [PubMed] [Google Scholar]
- 44.Dehorrocks W, Collier WE. Lanthanide Ion Luminescence Probes - Measurement of Distance between Intrinsic Protein Fluorophores and Bound Metal-Ions - Quantitation of Energy-Transfer between Tryptophan and Terbium(Iii) or Europium(Iii) in the Calcium-Binding Protein Parvalbumin. J. Am. Chem. Soc. 1981;103:2856–2862. [Google Scholar]
- 45.Walters JD, Johnson JD. Terbium as a luminescent probe of metal-binding sites in protein kinase C. J. Biol. Chem. 1990;265:4223–4226. [PubMed] [Google Scholar]
- 46.Zhou Q, Lai Y, Bacaj T, Zhao M, Lyubimov AY, Uervirojnangkoorn M, Zeldin OB, Brewster AS, Sauter NK, Cohen AE, Soltis SM, Alonso-Mori R, Chollet M, Lemke HT, Pfuetzner RA, Choi UB, Weis WI, Diao J, Sudhof TC, Brunger AT. Architecture of the synaptotagmin-SNARE machinery for neuronal exocytosis. Nature. 2015;525:62–67. doi: 10.1038/nature14975. [DOI] [PMC free article] [PubMed] [Google Scholar]
- 47.Cheng Y, Sequeira SM, Malinina L, Tereshko V, Sollner TH, Patel DJ. Crystallographic identification of Ca2+ and Sr2+ coordination sites in synaptotagmin I C2B domain. Protein Sci. 2004;13:2665–2672. doi: 10.1110/ps.04832604. [DOI] [PMC free article] [PubMed] [Google Scholar]
- 48.Yang P, Ma GB, Yang BS. Terbium (III) as fluorescence probe in the study of the interaction of rare earth and transition metal ions with concanavalin A. Acta Chimica Sinica English Edition. 1989;7:443–449. [Google Scholar]
- 49.Fernandez-Chacon R, Konigstorfer A, Gerber SH, Garcia J, Matos MF, Stevens CF, Brose N, Rizo J, Rosenmund C, Sudhof TC. Synaptotagmin I functions as a calcium regulator of release probability. Nature. 2001;410:41–49. doi: 10.1038/35065004. [DOI] [PubMed] [Google Scholar]
- 50.Weiss JN. The Hill equation revisited: uses and misuses. The FASEB Journal. 1997;11:835–841. [PubMed] [Google Scholar]
- 51.Arac D, Chen X, Khant HA, Ubach J, Ludtke SJ, Kikkawa M, Johnson AE, Chiu W, Sudhof TC, Rizo J. Close membrane-membrane proximity induced by Ca(2+)-dependent multivalent binding of synaptotagmin-1 to phospholipids. Nat. Struct. Mol. Biol. 2006;13:209–217. doi: 10.1038/nsmb1056. [DOI] [PubMed] [Google Scholar]
- 52.Seven AB, Brewer KD, Shi L, Jiang QX, Rizo J. Prevalent mechanism of membrane bridging by synaptotagmin-1. Proc. Natl. Acad. Sci. U. S. A. 2013;110:E3243–3252. doi: 10.1073/pnas.1310327110. [DOI] [PMC free article] [PubMed] [Google Scholar]
- 53.Kroncke BM, Horanyi PS, Columbus L. Structural origins of nitroxide side chain dynamics on membrane protein alpha-helical sites. Biochemistry. 2010;49:10045–10060. doi: 10.1021/bi101148w. [DOI] [PMC free article] [PubMed] [Google Scholar]
- 54.Freed DM, Khan AK, Horanyi PS, Cafiso DS. Molecular origin of electron paramagnetic resonance line shapes on beta-barrel membrane proteins: the local solvation environment modulates spin-label configuration. Biochemistry. 2011;50:8792–8803. doi: 10.1021/bi200971x. [DOI] [PMC free article] [PubMed] [Google Scholar]
- 55.Bhalla A, Tucker WC, Chapman ER. Synaptotagmin isoforms couple distinct ranges of Ca2+, Ba2+, and Sr2+ concentration to SNARE-mediated membrane fusion. Mol. Biol. Cell. 2005;16:4755–4764. doi: 10.1091/mbc.E05-04-0277. [DOI] [PMC free article] [PubMed] [Google Scholar]
- 56.Corbin JA, Evans JH, Landgraf KE, Falke JJ. Mechanism of specific membrane targeting by C2 domains: localized pools of target lipids enhance Ca2+ affinity. Biochemistry. 2007;46:4322. doi: 10.1021/bi062140c. [DOI] [PMC free article] [PubMed] [Google Scholar]
Associated Data
This section collects any data citations, data availability statements, or supplementary materials included in this article.


