Abstract
Neutrophil extracellular traps (NETs) are extracellular chromatin fibers adorned with antimicrobial proteins, such as myeloperoxidase (MPO), which are extruded from activated neutrophils. NETosis is the metamorphosis of neutrophils with NET formation that follows decondensation of DNA and rupture of the plasma membrane. Although NETs play important roles in innate immunity, excessive formation of NETs can be harmful to the hosts. Until now, various methods for evaluation of NETs have been reported. Although each has a virtue, the gold standard has not been established. Here we demonstrate a simple, objective, and quantitative method to detect NETs using flow cytometry. This method uses a plasma membrane‐impermeable DNA‐binding dye, SYTOX Green. SYTOX Green‐positive cells were detected in human peripheral polymorphonuclear cells exposed to a NET inducer, phorbol 12‐myristate 13‐acetate (PMA). The number of SYTOX Green‐positive cells was increased depending on the exposure duration and concentrations of PMA. Furthermore, co‐localization of MPO and plasma membrane‐appendant DNA of SYTOX Green‐positive cells was demonstrated. Moreover, a NET inhibitor, diphenylene iodonium, could significantly reduce the number of SYTOX Green‐positive cells induced by PMA. The collective evidence suggests that SYTOX Green‐positive cells include neutrophils that formed NETs. The established method could detect neutrophils that underwent NETosis but not early apoptosis with equivalence in quantification to another well‐used image analysis, which is based on fluorescent staining. Additionally, NETs that were formed in vivo were also detectable by this method. It is conceivable that the established method will bring us better understanding of the relation between NETosis and human diseases. © 2017 The Authors. Cytometry Part A published by Wiley Periodicals, Inc. on behalf of ISAC.
Keywords: neutrophil, neutrophil extracellular trap, SYTOX Green, NETosis
Introduction
Neutrophil extracellular traps (NETs) were firstly reported in 2004 as a novel biophylactic mechanism 1. Neutrophils, on exposure to phorbol 12‐myristate 13‐acetate (PMA), extruded chromatin fibers that were decorated with antimicrobial proteins, including myeloperoxidase (MPO) and neutrophil elastase (NE). The extracellular chromatin fibers studded with antimicrobial proteins are called NETs. NETs can capture microorganisms with the extracellular DNA and kill them with a high concentration of antimicrobial proteins.
NETosis is the metamorphosis of neutrophils with NET formation that follows de‐condensation of DNA and rupture of the plasma membrane. For the de‐condensation of DNA, histones with which DNA coils need to be citrullinated enzymatically 2. Neutrophils that are stimulated by PMA undergo NET formation and subsequent cell death. The death of PMA‐treated neutrophils followed by NET formation is different from typical necrosis or apoptosis 3.
Although NET formation is an essential event in innate immunity, it has adverse aspects to the hosts. The release of intracellular components, such as DNA, histones, MPO, and NE, possibly induces vascular endothelial cell injury 4, 5 and thrombosis 6, 7. If excessive and/or persistent NETs are generated in vivo, autoantibodies to the NET components can be produced. Actually, it has been demonstrated that impaired regulation of NETs is related to the pathogenesis of autoimmune diseases, including systemic lupus erythematosus (SLE) 8 and anti‐neutrophil cytoplasmic antibody (ANCA)‐associated vasculitis (AAV) 9, 10, 11. NETs are also thought to be involved in the pathogenesis of rheumatoid arthritis 12, anti‐phospholipid syndrome 13, and gout 14. For further understanding of the relation of NETosis with human diseases, we need a simple, objective, and quantitative method to evaluate NETs.
Currently, diverse methods have been used for evaluation of NETs 15. The most popular method is microscopic observation 10, 16, 17. Although this is a reliable method, which is based on the confirmation of co‐localization of extracellular DNA and neutrophil‐derived proteins, including MPO and NE, it has faults in objectivity and quantification. Image analysis of microphotographs is applicable for quantitative evaluation but subjective views on the results have to be avoided.
Soluble NET remnants in fluid samples, such as serum and cell culture supernatants, have also been monitored for the quantity of NETs. Cell‐free DNA can be detected objectively and quantitatively using Picogreen 18, but the result will be affected by contaminated DNA derived from necrosis, especially in vivo. The complexes of DNA and neutrophil‐derived proteins, including MPO and NE, can be detected by enzyme‐linked immunosorbent assay (ELISA) 9, 10. Although this is an objective, quantitative, and specific method, ELISA kit is not commercially available. In addition, soluble NET remnants sometimes do not reflect the NET formation in vivo accurately because degradation of NETs by serum DNase I is disordered in some patients with SLE 8 and AAV 11.
There are reports also on flow cytometric detection of NETs. Gavillet et al. identified neutrophils that underwent NETosis by detection of MPO and citrullinated histones using flow cytometry 19. Zhao et al. conducted multispectral imaging flow cytometry and focused on the change of nuclear area and fluorescence intensity caused by NETosis 20. Although these are objective and quantitative methods, their protocols appear to be complex. In this study, we attempted to establish a simpler, objective, and quantitative method for detection of neutrophils that formed NETs using a plasma membrane‐impermeable DNA‐binding dye, SYTOX Green, in flow cytometry.
Results demonstrated that the number of SYTOX Green‐positive cells was increased depending on the exposure duration and concentrations of PMA. To determine that the SYTOX Green‐positive cells include neutrophils that formed NETs, we present the following findings: 1 Co‐localization of MPO and plasma membrane‐appendant DNA of the SYTOX Green‐positive cells, 2 Inhibition by a NET inhibitor, diphenylene iodonium (DPI), and 3 No staining of SYTOX Green on neutrophils with etoposide‐induced early apoptosis. In addition, we further demonstrate the correlation of the flow cytometry‐based method with the established approach of image analysis of NETs and the applicability of the method for detection of NETs formed in vivo using a rat model of peritonitis.
Materials and Methods
Isolation of Human Polymorphonuclear Leukocytes
Human polymorphonuclear leukocytes (PMNs) were isolated from 10–20 ml of peripheral blood of healthy volunteers by density centrifugation using Polymorphprep (Axis‐Shield, Dundee, Scotland) according to the manufacturer's instruction. The process of hemolysis was skipped to avoid non‐specific activation of neutrophils. Because neutrophils are the most abundant cells in PMNs, PMNs were used as a source of neutrophils in the following studies. This study was approved for practice by our institutional ethical committee, the Ethical Committee of the Faculty of Health Sciences, Hokkaido University (Permission No. 15–90).
NET Induction In Vitro
The PMNs were resuspended in RPMI 1640 medium containing 5% fetal bovine serum (FBS) (1 × 10⁶/ml). After preincubation for 30 min at 37°C, the cells were exposed to 0–100 nM PMA (Sigma‐Aldrich, St. Louis, MO) for 0–4 h at 37°C.
Flow Cytometric Detection of SYTOX Green‐Positive Cells
The PMA‐treated PMNs were made to react with a plasma membrane‐impermeable DNA‐binding dye, SYTOX Green (Life Technologies, Carlsbad, CA) according to the manufacturer's instruction. After filtering out the debris with a mesh, the percolated cells were analyzed using Attune flow cytometer (Applied Biosystems, Foster City, CA). Because SYTOX Green expresses fluorescence only after binding to DNA, the step to remove unbound dye can be omitted. Granulocytes mainly composed of neutrophils were selected by the properties of forward and side scatters in flow cytometry. This study focused on SYTOX Green‐positive neutrophils.
Fluorescent Image Analysis of NETs
The PMNs were resuspended in RPMI 1640 medium containing 5% FBS and then seeded in wells of 4‐well chamber slides (1 × 10⁵/ml). After preincubation for 30 min at 37°C, the cells were exposed to 0–100 nM PMA for 4 h at 37°C. Thereafter, the medium was removed, and the remaining cells were washed with PBS. The cells were then fixed with 4% paraformaldehyde for 15 min at room temperature. After washing with PBS, the cells were incubated in PBS containing 3% bovine serum albumin (BSA) for 30 min at room temperature to block non‐specific binding of antibodies. Then, the cells were allowed to react with 5 µg/ml of anti‐human MPO antibody (Bio‐Rad, Hercules, CA) or the isotype control mouse IgG2b (BioLegend, San Diego, CA) for 60 min at room temperature. After washing with PBS, the cells were allowed to react with 5 µg/ml of Alexa Fluor 488‐conjugated goat anti‐mouse IgG (H + L) antibody (Thermo Fisher Scientific, Waltham, MA) for 60 min at room temperature. After removal of unbound antibodies as needed, the slides were mounted with 4′,6‐diamidino‐2‐phenylindole (DAPI)‐containing solution (Sigma‐Aldrich). NET formation was observed under a fluorescent microscope. Similar experiments were repeated twice.
Double‐Staining of MPO and SYTOX Green in Flow Cytometry
The PMA‐treated PMNs were washed with PBS and then incubated in PBS containing 3% BSA for 30 min at room temperature to block non‐specific binding of antibodies (1 × 10⁶/100 µl). Five µg/ml of anti‐human MPO antibody (Bio‐Rad) or the isotype control mouse IgG2b (BioLegend) was added into the solution, and the samples were incubated for 30 min at room temperature. The cells were washed with PBS and resuspended in PBS containing 3% BSA (1 × 10⁶/100 µl). Then, 4 µg/ml of PE‐labeled anti‐mouse IgG antibody (BioLegend) was added into the solution, and the samples were incubated for 30 min at room temperature. After washing with PBS, flow cytometric detection of SYTOX Green‐positive cells was carried out as aforementioned. Similar experiments were repeated 3 times.
Effect of NADPH Oxidase Inhibitor
Prior to PMA treatment, PMNs (1 × 10⁶/ml) were exposed to 0, 10, or 20 µM NADPH oxidase inhibitor, DPI (Sigma‐Aldrich) for 30 min at 37°C. The cells were then exposed to 0 or 100 nM PMA for 4 h at 37°C. Flow cytometric detection of SYTOX Green‐positive cells was carried out as aforementioned. Similar experiments were repeated 3 times.
Comparison with Apoptosis
Apoptosis was induced using etoposide (BioVision, Milpitas, CA) as previously described 21. PMNs preincubated in RPMI 1640 medium containing 5% FBS (1 × 10⁶/ml) for 30 min at 37°C were then exposed to 100 nM PMA or 100 µM etoposide for 1–4 h at 37°C. The cells were made to react with Alexa Fluor 488‐conjugated annexin V and propidium iodide (PI) (Dead Cell Apoptosis Kit, Molecular Probes, Eugene, OR) according to the manufacturer's instruction then followed by flow cytometry. Alternatively, the PMA‐treated PMNs and etoposide‐treated PMNs were subjected to flow cytometry for detection of SYTOX Green‐positive cells. Similar experiments were repeated 4 times.
Detection of SYTOX Green‐Positive Cells Formed In Vivo
Wistar rats (6–8 weeks old, female) were given intraperitoneal (i.p.) injection of 3% thioglycollate (Becton Dickinson, Franklin Lakes, NJ) to induce peritonitis (n = 6). After 72 h, infiltrated cells were collected by washing out the abdominal cavity with EDTA‐PBS and then resuspended in EDTA‐PBS (1 × 10⁶/ml) (n = 3). Alternatively, PBS was used instead of EDTA‐PBS (n = 3). Flow cytometric detection of SYTOX Green‐positive cells was carried out as aforementioned. Experiments using rats were performed in accordance with the Guidelines for the Care and Use of Laboratory Animals in Hokkaido University (Permission No. 15–0034).
Statistics
The Student's t test was applied for comparison of the mean values between the two groups. The P values of <0.05 was regarded as statistically significant.
Results
Flow Cytometric Detection of SYTOX Green‐Positive Cells in PMA‐Treated PMNs
The PMNs isolated from the peripheral blood of healthy volunteers (n = 4) were exposed to 0 or 100 nM PMA for 4 h at 37°C. The cells were stained with a plasma membrane‐impermeable DNA‐binding dye, SYTOX Green, and then subjected to flow cytometry. Data of 5 × 10⁴ cells were acquired for analyses, and the representative profiles of one of 4 donors examined are shown in Figure 1A. To exclude mononuclear leukocytes and red blood cells that contaminate the PMN samples from analyses, region 1 (R1), which mainly contained neutrophils, was determined by using the samples without PMA treatment (left panel). The same R1 was applied to evaluate the PMA‐treated samples (middle panel). Although the distribution of the PMA‐treated samples in R1 was broader than that of the samples without PMA treatment, the cell counts were roughly equivalent (approximately 1 × 10⁴ cells) regardless of PMA treatment. Thus, these findings suggest that PMA treatment induces a diverse degree of morphological alteration of neutrophils.
Figure 1.
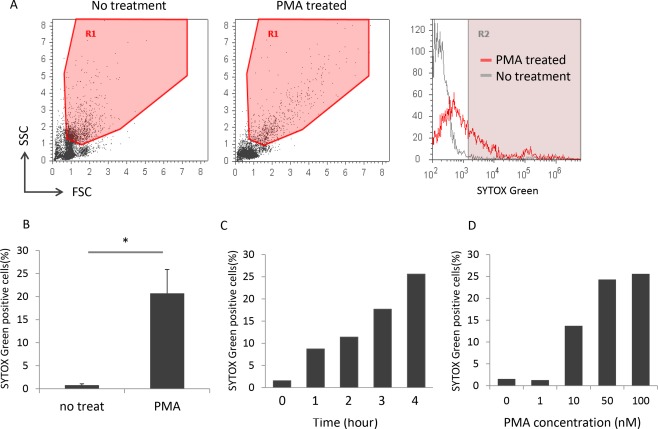
Flow cytometric detection of SYTOX Green‐positive cells in PMA‐treated PMNs. (A) The representative flow cytometry profiles of one of the 4 donors are shown. The left and middle panels show the dot plots of PMNs without and with PMA treatment (100 nM for 4 h), respectively. The right panel shows the SYTOX Green histograms of cells in R1. (B) Comparison of the number of SYTOX Green‐positive cells between PMNs without and with PMA treatment (100 nM for 4 h). Data are shown as mean ± standard deviation (SD) of the percentage of positive cells on SYTOX Green staining. *P < 0.05, n = 4. (C) PMA exposure duration‐dependent increase in the number of SYTOX Green‐positive cells. Bars represent the percentage of positive cells on SYTOX Green staining. Similar time‐dependency was reproduced in experiments repeated 4 times. The representative result is shown. (D) PMA concentration‐dependent increase in the number of SYTOX Green‐positive cells. Bars represent the percentage of positive cells on SYTOX Green staining. Similar dose‐dependency was reproduced in experiments repeated 2 times. The representative result is shown.
The SYTOX Green histograms of cells in R1 are shown in the right panel. The percentage of positive cells on SYTOX Green staining, which was calculated as ([cells in R2/cells in R1] × 100), was markedly increased in the PMA‐treated samples compared with the samples without PMA treatment (Fig. 1B). Furthermore, the number of SYTOX Green‐positive cells represented as the percentage of positive cells on SYTOX Green staining was increased depending on the exposure duration and concentrations of PMA (Figs. 1C and 1D).
Co‐Localization of Plasma Membrane‐Appendant DNA and MPO
NETs are composed of chromatin fibers that are extruded from neutrophils and decorated with antimicrobial proteins, such as MPO. To confirm that SYTOX Green‐positive cells really include neutrophils that formed NETs, double‐staining with SYTOX Green and anti‐MPO antibody was conducted on PMA‐treated PMNs. The immunofluorescent staining demonstrated the co‐localization of chromatin fibers extruded from PMA‐treated neutrophils and MPO (Fig. 2A). Moreover, flow cytometry revealed that the majority (76.1%) of SYTOX Green‐positive cells were MPO‐positive in the PMA‐treated PMNs (Fig. 2B).
Figure 2.
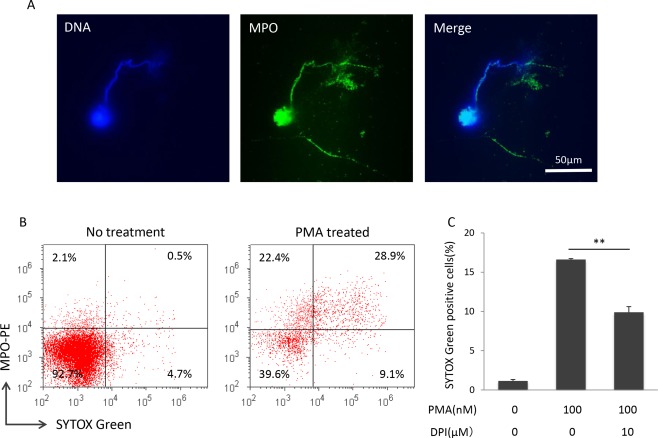
Evidence of SYTOX Green‐positive cells as neutrophils that formed NETs. (A) Co‐localization of MPO and plasma membrane‐appendant DNA of PMA‐treated neutrophils (100 nM for 4 h). Blue, DNA; Green, MPO. Bar: 50 µm. Similar findings were reproduced in experiments repeated twice. The representative result is shown. (B) Double staining of MPO and SYTOX Green. PMNs without and with PMA treatment (100 nM for 4 h) were subjected to flow cytometry. Similar findings were reproduced in experiments repeated 3 times. The representative result is shown. (C) ROS‐dependent increase in SYTOX Green‐positive cells induced by PMA. Prior to PMA treatment, PMNs (1 × 10⁶/ml) were exposed to 0 or 10 µM NADPH oxidase inhibitor, DPI, for 30 min. The cells were then exposed to 0 or 100 nM PMA for 4 h. Flow cytometric detection of SYTOX Green‐positive cells was carried out. Data are shown as mean ± SD of the percentage of positive cells on SYTOX Green staining. **P < 0.01, n = 3.
Effect of NADPH Oxidase Inhibitor
NADPH oxidase is a membrane‐bound enzyme complex and plays a critical role in the reactive oxygen species (ROS) generation 22. It has been shown that PMA‐induced NETosis is a ROS‐dependent process and is inhibited by the NADPH oxidase inhibitor, DPI 3. After DPI treatment (10 µM, 30 min), SYTOX Green‐positive cells were significantly reduced in comparison with the samples without DPI treatment (Fig. 2C). Since the inhibition was partial, we further examined the effect of a higher dose of DPI treatment (20 µM, 30 min) on the NET induction. As a result, there was no significant difference in the effects of 10 and 20 µM DPI treatments (data not shown). Collective findings indicate that SYTOX Green‐positive cells include neutrophils that formed NETs.
Specificity of Detection of SYTOX Green‐Positive Cells to NETosis
NETosis is thought to be distinct from apoptosis or necrosis 3. To determine that SYTOX Green does not recognize apoptotic cells, apoptosis was induced on neutrophils by etoposide. At first, we compared the phenotypes of PMA‐treated neutrophils and etoposide‐treated neutrophils using annexin V and PI. Concerning the PMA‐treated neutrophils, both annexin V‐positive cells and PI‐positive cells were increased chronologically (Fig. 3). On the contrary, annexin V‐positive cells but not PI‐positive cells were increased gradually in the etoposide‐treated neutrophils. These findings demonstrated that etoposide treatment used in this study induced early apoptosis on neutrophils.
Figure 3.
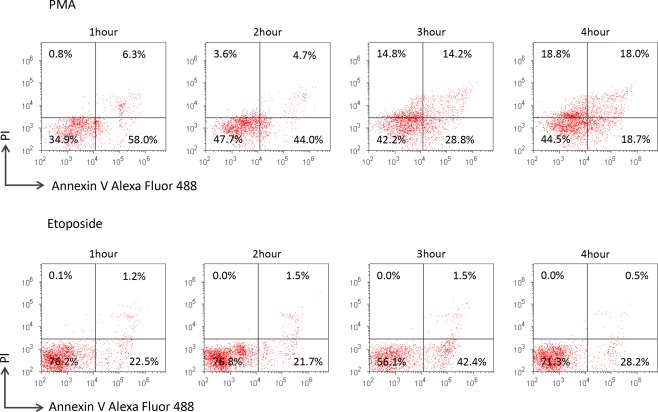
Difference in phenotype between PMA‐treated neutrophils and etoposide‐treated neutrophils. PMNs were exposed to 100 nM PMA or 100 µM etoposide for 1–4 h. The cells were made to react with Alexa Fluor 488‐conjugated annexin V and PI in the Dead Cell Apoptosis Kit according to the manufacturer's instruction and were subsequently subjected to flow cytometry. Similar results were reproduced in experiments repeated 3 times. The representative result is shown.
Next, the PMA‐treated PMNs and etoposide‐treated PMNs were subjected to flow cytometry using SYTOX Green. As a result, the number of SYTOX Green‐positive cells in the PMA‐treated PMNs was increased depending on the exposure duration to the reagent, whereas such phenomenon was not observed on the etoposide‐treated PMNs (Fig. 4). The collective findings clearly indicate that SYTOX Green does not recognize early apoptotic neutrophils.
Figure 4.
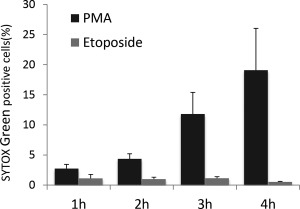
Specificity of detection of SYTOX Green‐positive cells to NETosis. Both PMA‐treated PMNs and etoposide‐treated PMNs were subjected to flow cytometry for detection of SYTOX Green‐positive cells. Data are shown as mean ± SD of the percentage of positive cells on SYTOX Green staining (n = 4).
Equivalence in Quantification to Image Analysis of Fluorescent Staining
The most popular method to quantify NETs is the image analysis, which is based on fluorescent staining using DAPI 10, 16, 17. To determine the equivalence in quantification of the flow cytometric detection of neutrophils that formed NETs using SYTOX Green to the image analysis, we compared the two methods. The percentage of SYTOX Green‐positive cells exhibited a positive correlation with the NET area as determined by image analysis (Fig. 5, R 2 = 0.7314). Thereby, this result indicates that the flow cytometric detection of NETs using SYTOX Green is reliable in quantification as well as the image analysis of fluorescent staining using DAPI.
Figure 5.
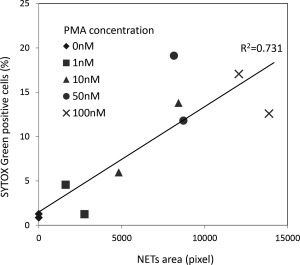
Equivalence in quantification of NET detection method using SYTOX Green to fluorescent staining. PMNs were seeded in wells of 4‐well chamber slides (1 × 10⁵/ml). After preincubation for 30 min, the cells were exposed to 0–100 nM PMA for 4 h. After fixation, the slides were mounted with DAPI‐containing solution. NET area was determined by using 5 random fields of view (×40) using Image J software and standardized by the cell number. Alternatively, the PMA‐treated PMNs (1 × 10⁵/ml) were subjected to flow cytometry for detection of SYTOX Green‐positive cells. Correlation between the results of the two methods was analyzed.
Detection of NETs Formed In Vivo
Wistar rats were given i.p. injection of 3% thioglycollate to induce peritonitis. After 72 h, infiltrated cells were collected by washing out the abdominal cavity. For this purpose, we used EDTA‐PBS as a solvent to wash the abdominal cavity and resuspend the collected cells. EDTA was expected to prevent digestion of NETs by DNase I derived from macrophages that could have infiltrated into the abdominal cavity accompanied by neutrophils. Thus, PBS was used as control solvent. We repeated the experiments 3 times (total rat number used, 6). The representative result is shown in Figure 6. SYTOX Green‐positive cells were detected in the samples collected using EDTA‐PBS but not PBS. Similar results were reproduced in other two pairs of experiments. These findings demonstrated that NETs formed in vivo were detectable in the flow cytometry.
Figure 6.
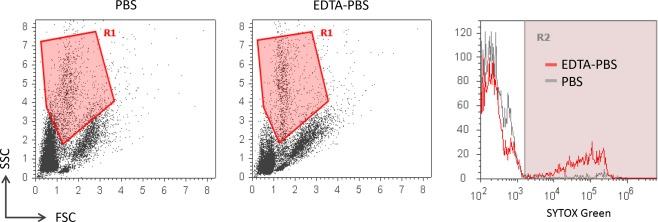
Detection of NETs formed in vivo. Peritonitis was induced in Wistar rats (6–8 weeks old, female) by i.p. injection of 3% thioglycollate (n = 6). After 72 h, infiltrated cells were collected by washing out the abdominal cavity with PBS or EDTA‐PBS and then resuspended in each buffer (1 × 10⁶/ml) (n = 3 in each group). Flow cytometric detection of SYTOX Green‐positive cells was carried out. The left and middle panels show the representative dot plots of the cells extracted from the inflamed abdominal cavity using PBS and EDTA‐PBS as buffers, respectively. The right panel shows the representative SYTOX Green histograms of cells in R1 that covers neutrophils. Similar results were reproduced in other 2 sets of experiments.
Discussion
Many studies have revealed the physiological and pathological roles of NETs since the discovery in 2004 1. Although several methods have been used for evaluation of NETs and each of them has a virtue, the gold standard has not been established yet 15. In this study, we attempted to establish a simple, objective, and quantitative method for detection of NETs by flow cytometry.
For this purpose, we used a plasma membrane‐impermeable DNA‐binding dye, SYTOX Green. Results demonstrated that the SYTOX Green‐positive cells were detected in PMA‐treated PMNs, and that the number was increased depending on the exposure duration and concentrations of PMA. Furthermore, co‐localization of MPO and plasma membrane‐appendant DNA of the PMA‐treated neutrophils was demonstrated in the fluorescent staining. In addition, flow cytometry demonstrated that the majority of SYTOX Green‐positive cells were MPO‐positive in the PMA‐treated PMNs. These findings suggest that the SYTOX Green‐positive cells include neutrophils that formed NETs. Simultaneously, we should note that SYTOX Green‐positivity could overestimate the amount of NETs because of the presence of a small population of SYTOX Green‐positive MPO‐negative cells. Since it has been demonstrated that eosinophils can release their chromatin fibers akin to neutrophils 23, the SYTOX Green‐positive MPO‐negative population could be composed of eosinophils with extracellular chromatin fibers. Henceforth, cells which are doubly positive for SYTOX Green and MPO should be regarded as neutrophils that formed NETs. Conversely, about 20% of the PMA‐treated PMNs exhibited cell surface expression of MPO but not plasma membrane‐appendant DNA. We consider that the MPO‐positive SYTOX Green‐negative population is composed of neutrophils that are activated but have not completed NET formation.
It has been shown that the accomplished NETs are digested by serum DNase I in due course 8 and consequently present as DNA fragments studded with antimicrobial proteins in the serum 9. Accordingly, the possibility that the plasma membrane‐appendant DNA as a byproduct from digestion by DNase I should be considered. However, such cells with a complete rupture of the plasma membrane do not appear to conserve morphology that can be recognized as neutrophils by flow cytometry. Therefore, it is conceivable that the cells with plasma membrane‐appendant DNA in flow cytometry are neutrophils just starting to form NETs.
Interestingly, DPI, the NADPH oxidase inhibitor, namely a NET inhibitor 3, can partially but significantly reduce the number of SYTOX Green‐positive cells induced by PMA. This important finding suggests that the SYTOX Green‐positive cells surely include, but not all of them, neutrophils that formed NETs. It is possible that cells with an unspecified damage to the plasma membrane can be positive for SYTOX Green.
Therefore, we next determined if apoptotic neutrophils would be positive for SYTOX Green. Results demonstrated that the established method could detect neutrophils that underwent NETosis but not early apoptosis at all. Further studies are needed to determine if the method can distinguish NETosis from late apoptosis and necrosis. Particularly, it may not be easy to distinguish NETosis from necrosis by flow cytometry because Desai et al. claimed that NETosis is a type of necroptosis, which means a programmed necrosis 24. However, the differences in signal transduction pathways and activated enzymes among the types of cell death can be clues to distinguish them from each other.
The established method to detect neutrophils that formed NETs using SYTOX Green has been shown to be equivalent in quantification to the well‐used image analysis, which is based on fluorescent staining. It is a very simple method that has objective and quantitative performance compared with the image analysis based on fluorescent staining. Furthermore, cells that potentially formed NETs in vivo can be measured with a cytometer and SYTOX green fluorophore. The quantification of NET amounts in biological samples using the established method can contribute to the understanding of the relation between NETosis and diverse human diseases.
Author Contributions
S.M., S.S., and J.M. carried out the experiments. S.M., Y.N., Y.K., F.H., H.S., D.N., U.T., T.A., and A.I. analyzed the data. S.M., U.T., and A.I. designed the research and wrote the manuscript.
Supporting information
Additional supporting information may be found in the online version of this article.
Supporting Figure 1
Supporting Figure 2B
Supporting Figure 2C
Supporting Figure 3 and 4
Supporting Figure 5
Supporting Figure 6
Supporting Figure 1
Supporting Figure 2B
Supporting Figure 2C
Supporting Figure 3 and 4
Supporting Figure 5
Supporting Figure 6
Literature Cited
- 1. Brinkmann V, Reichard U, Goosmann C, Fauler B, Uhlemann Y, Weiss DS, Weinrauch Y, Zychlinsky A. Neutrophil extracellular traps kill bacteria. Science 2004;303:1532–1535. doi:10.1126/science.1092385 [DOI] [PubMed] [Google Scholar]
- 2. Li P, Li M, Lindberg MR, Kennett MJ, Xiong N, Wang Y. PAD4 is essential for antibacterial innate immunity mediated by neutrophil extracellular traps. J Exp Med 2010;207:1853–1862. doi:10.1084/jem.20100239 [DOI] [PMC free article] [PubMed] [Google Scholar]
- 3. Fuchs TA, Abed U, Goosmann C, Hurwitz R, Schulze I, Wahn V, Weinrauch Y, Brinkmann V, Zychlinsky A. Novel cell death program leads to neutrophil extracellular traps. J Cell Biol 2007;176:231–241. doi:10.1083/jcb.200606027 [DOI] [PMC free article] [PubMed] [Google Scholar]
- 4. Xu J, Zhang X, Pelayo R, Monestier M, Ammollo CT. Extracellular histones are major mediators of death in sepsis. Nat Med 2010;15:1318–1321. doi:10.1038/nm.2053. [DOI] [PMC free article] [PubMed] [Google Scholar]
- 5. Villanueva E, Yalavarthi S, Berthier CC, Hodgin JB, Khandpur R, Lin AM, Rubin CJ, Zhao W, Olsen SH, Klinker M, et al. Netting neutrophils induce endothelial damage, infiltrate tissues and expose immunostimulatory molecules in systemic lupus erythematosus. J Immunol 2011;187:538–552. doi:10.4049/jimmunol.1100450. [DOI] [PMC free article] [PubMed] [Google Scholar]
- 6. Fuchs TA, Brill A, Duerschmied D, Schatzberg D, Monestier M, Myers DD, Wrobleski SK, Wakefield TW, Hartwig JH, Wagner DD. Extracellular DNA traps promote thrombosis. Proc Natl Acad Sci USA 2010;107:15880–15885. doi:10.1073/pnas.1005743107 [DOI] [PMC free article] [PubMed] [Google Scholar]
- 7. Fuchs T. a, Brill A, Wagner DD. NET impact on deep vein thrombosis. Arter Thromb Vasc Biol 2012;32:1777–1783. doi:10.1161/ATVBAHA.111.242859. [DOI] [PMC free article] [PubMed] [Google Scholar]
- 8. Hakkim A, Fürnrohr BG, Amann K, Laube B, Abed UA, Brinkmann V, Herrmann M, Voll RE, Zychlinsky A. Impairment of neutrophil extracellular trap degradation is associated with lupus nephritis. Proc Natl Acad Sci USA 2010;107:9813–9818. doi:10.1073/pnas.0909927107 [DOI] [PMC free article] [PubMed] [Google Scholar]
- 9. Kessenbrock K, Krumbholz M, Schönermarck U, Back W, Gross WL, Werb Z, Gröne H‐J, Brinkmann V, Jenne DE. Netting neutrophils in autoimmune small‐vessel vasculitis. Nat Med 2009;15:623–625. doi:10.1038/nm.1959 [DOI] [PMC free article] [PubMed] [Google Scholar]
- 10. Nakazawa D, Tomaru U, Suzuki A, Masuda S, Hasegawa R, Kobayashi T, Nishio S, Kasahara M, Ishizu A. Abnormal conformation and impaired degradation of propylthiouracil‐induced neutrophil extracellular traps: Implications of disordered neutrophil extracellular traps in a rat model of myeloperoxidase antineutrophil cytoplasmic antibody‐associated vasculiti. Arthritis Rheum 2012;64:3779–3787. doi:10.1002/art.34619 [DOI] [PubMed] [Google Scholar]
- 11. Nakazawa D, Shida H, Tomaru U, Yoshida M, Nishio S, Atsumi T, Ishizu A. Enhanced formation and disordered regulation of NETs in myeloperoxidase‐ANCA‐associated microscopic polyangiitis. J Am Soc Nephrol 2014;25:990–997. doi:10.1681/ASN.2013060606 [DOI] [PMC free article] [PubMed] [Google Scholar]
- 12. Khandpur R, Carmona‐rivera C, Vivekanandan‐giri A, Yalavarthi S, Knight JS, Friday S, Li S, Patel RM, Subramanian V, Thompson P, et al. NETs are a source of citrullinated autoantigens and stimulate inflammatory responses in rheumatoid arthritis. Sci Transl Med 2013;5:178pa40. doi:10.1126/scitranslmed.3005580 [DOI] [PMC free article] [PubMed] [Google Scholar]
- 13. Leffler J, Stojanovich L, Shoenfeld Y, Bogdanovic G, Hesselstrand R, Blom A. Degradation of neutrophil extracellular traps is decreased in patients with antiphospholipid syndrome. Clin Exp Rheumatol 2014;32:66–70. [PubMed] [Google Scholar]
- 14. Mitroulis I, Kambas K, Chrysanthopoulou A, Skendros P, Apostolidou E, Kourtzelis I, Drosos GI, Boumpas DT, Ritis K. Neutrophil extracellular trap formation is associated with IL‐1β and autophagy‐related signaling in gout. PLoS One 2011;6:e29318. doi:10.1371/journal.pone.0029318 [DOI] [PMC free article] [PubMed] [Google Scholar]
- 15. Masuda S, Nakazawa D, Shida H, Miyoshi A, Kusunoki Y, Tomaru U, Ishizu A. NETosis markers: Quest for specific, objective, and quantitative markers. Clin Chim Acta 2016;459:89–93. doi:10.1016/j.cca.2016.05.029 [DOI] [PubMed] [Google Scholar]
- 16. Nakazawa D, Shida H, Kusunoki Y, Miyoshi A, Nishio S, Tomaru U, Atsumi T, Ishizu A. The responses of macrophages in interaction with neutrophils that undergo NETosis. J Autoimmun 2016;67:19–28. doi:10.1016/j.jaut.2015.08.018 [DOI] [PubMed] [Google Scholar]
- 17. Shida H, Nakazawa D, Tateyama Y, Miyoshi A, Kusunoki Y. The presence of anti‐lactoferrin antibodies in a subgroup of eosinophilic granulomatosis with polyangiitis patients and their possible contribution to enhancement of neutrophil extracellular trap formation. Front Immunol 2016;7:636. doi:10.3389/fimmu.2016.0063 [DOI] [PMC free article] [PubMed] [Google Scholar]
- 18. Zhang S, Lu X, Shu X, Tian X, Yang H, Yang W, Zhang Y, Wang G. Elevated plasma cfDNA may be associated with active lupus nephritis and partially attributed to abnormal regulation of neutrophil extracellular traps (NETs) in patients with systemic lupus erythematosus. Intern Med 2014;53:2763–2771. doi:10.2169/internalmedicine.53.2570 [DOI] [PubMed] [Google Scholar]
- 19. Gavillet M, Martinod K, Renella R, Harris C, Shapiro NI, Wagner DD, Williams DA. Flow cytometric assay for direct quantification of Neutrophil Extracellular Traps in blood samples. Am J Hematol 2015;90:1155–1158. doi:10.1002/ajh.24185. [DOI] [PMC free article] [PubMed] [Google Scholar]
- 20. Zhao W, Fogg DK, Kaplan MJ. A novel image‐based quantitative method for the characterization of NETosis. J Immunol Methods 2015;423:104–110. doi:10.1016/j.jim.2015.04.027 [DOI] [PMC free article] [PubMed] [Google Scholar]
- 21. Onishi Y, Azuma Y, Sato Y, Mizuno Y, Tadakuma T, Kizaki H. Topoisomerase inhibitors induce apoptosis in thymocytes. Biochim Biophys Acta 1993;1175:147–154. [DOI] [PubMed] [Google Scholar]
- 22. Morel F, Doussiere J, Vignais PV. The superoxide‐generating oxidase of phagocytic cells. Eur J Biochem 1991;201:523–546. [DOI] [PubMed] [Google Scholar]
- 23. Ueki S, Tokunaga T, Fujieda S, Honda K, Hirokawa M, Spencer LA, Weller PF. Eosinophil ETosis and DNA Traps: A new look at eosinophilic inflammation. Curr Allergy Asthma Rep 2016;16:54. doi: 10.1007/s11882-016-0634-5 [DOI] [PMC free article] [PubMed] [Google Scholar]
- 24. Desai J, Mulay SR, Nakazawa D, Anders HJ. Matters of life and death. How neutrophils die or survive along NET release and is “NETosis” = necroptosis? Cell Mol Life Sci 2016;73:2211–2219. doi:10.1007/s00018-016-2195-0 [DOI] [PMC free article] [PubMed] [Google Scholar]
Associated Data
This section collects any data citations, data availability statements, or supplementary materials included in this article.
Supplementary Materials
Additional supporting information may be found in the online version of this article.
Supporting Figure 1
Supporting Figure 2B
Supporting Figure 2C
Supporting Figure 3 and 4
Supporting Figure 5
Supporting Figure 6
Supporting Figure 1
Supporting Figure 2B
Supporting Figure 2C
Supporting Figure 3 and 4
Supporting Figure 5
Supporting Figure 6


