

Abstract
Smith–Lemli–Opitz syndrome (SLOS) is an autosomal recessive congenital malformation syndrome caused by mutations in the 7-dehydrocholesterol reductase gene. This inborn error of cholesterol synthesis leads to elevated concentrations of 7-dehydrocholesterol (7-DHC). 7-DHC also serves as the precursor for vitamin D synthesis. Limited data is available on vitamin D levels in individuals with SLOS. Due to elevated concentrations of 7-DHC, we hypothesized that vitamin D status would be abnormal and possibly reach toxic levels in patients with SLOS. Through a retrospective analysis of medical records between 1998–2006, we assessed markers of vitamin D and calcium metabolism from 53 pediatric SLOS patients and 867 pediatric patients who were admitted to the NIH Clinical Center (NIHCC) during the same time period. SLOS patients had significantly higher levels of 25(OH)D (48.06 ±19.53 ng/mL, p<0.01) across all seasons in comparison to the NIHCC pediatric patients (30.51 ±16.14 ng/mL). Controlling for season and age of blood draw, 25(OH)D levels were, on average, 15.96 ng/mL (95% CI 13.95–17.90) higher in SLOS patients. Although, mean calcium values for both patient cohorts never exceeded the normal clinical reference range (8.6–10.2 mg/dL), the levels were higher in the SLOS cohort (9.49 ± 0.56 mg/dL, p< 0.01) compared to the NIHCC patients (9.25 ± 0.68 mg/dL). Overall, in comparison to the control cohort, individuals with SLOS have significantly higher concentrations of 25(OH)D that may be explained by elevated concentrations of serum 7-DHC. Despite the elevated vitamin D levels, there was no laboratory or clinical evidence of vitamin D toxicity.
Keywords: Smith-Lemli-Opitz syndrome, 7-dehydrocholesterol, vitamin D, metabolic disorder
INTRODUCTION
Smith–Lemli–Opitz syndrome (SLOS) is an autosomal recessive malformation syndrome caused by mutations in the gene encoding the enzyme 7-dehydrocholesterol reductase (DHCR7) [Wassif et al., 1998; Fitzky et al., 1998; Waterham et al., 1998]. This enzyme is responsible for the reduction of 7-dehydrocholesterol (7-DHC) to cholesterol in the last step of the Kandutsch-Russel pathway of cholesterol biosynthesis. Individuals with SLOS present with abnormally elevated concentrations of 7-DHC, low to normal cholesterol levels and variable malformations [Irons et al., 1993]. In addition to its role as a diagnostic metabolite for SLOS [Kelley and Hennekam, 2000; Porter 2008], 7-DHC is physiologically important as the precursor for the cutaneous synthesis of the prohormone, vitamin D [Holick et al., 1980].
Vitamin D status is considered extremely important for calcium homeostasis and health promotion [Holick, 1996], decreasing the risk of many chronic illnesses including cancers [Grant, 2002; Garland et al., 2006; Deeb et al., 2007] and autoimmune diseases [Hypponen et al., 2001; Munger et al., 2006]. Vitamin D is primarily obtained from exposure of cutaneous 7-DHC to ultraviolet B (UVB) irradiation in sunlight and then undergoes further hydroxylation in the liver and kidney to 25-hydroxyvitamin D [25(OH)D] and 1,25-dihydroxyvitamin D [1,25(OH)2 D], respectively. Sunlight exposure is critical, accounting for up to 90% of the vitamin D supply, while the number of foods naturally containing vitamin D are limited and rarely consumed by children and adolescents [Holick 2012]. Many patients with SLOS demonstrate skin photosensitivity and tend to avoid direct exposure to sunlight by wearing protective clothing and sunscreen. In fact, following the first detailed description of photosensitivity in 1998 [Charman et al., 1998], the photosensitivity to ultraviolet A radiation has been observed in many more patient cohorts [Anstey, 2001] including the patients being followed at NIH as part of our natural history study (unpublished observation).
The active form of vitamin D, 1,25(OH)2 D, maintains blood calcium in the normal range by enhancing the efficiency of intestinal and renal calcium absorption [Holick, 1996]. However, the best indicator of vitamin D status is serum 25-hydroxyvitamin D [25(OH)D], as it is the major circulating form of vitamin D and reflects both the amount produced in the skin following sun exposure and the amount obtained from foods [Holick, 2007]. The current recommended threshold values for vitamin D deficiency and toxicity vary. The 2011 clinical practice guidelines from the United States-based Endocrine Society suggest to consider deficiency when 25(OH)D levels fall below 20 ng/mL (50 nmol/L), insufficiency if the 25(OH)D levels are between 21–29 ng/mL (50–75 nmol/L), sufficiency for 25(OH)D concentrations greater than 30 ng/mL (75 nmol/L), and intoxication at levels more than 150 ng/mL. [Holick et al., 2011]. In the same year, the Institute of Medicine released recommendations in the Dietary Reference Intakes for Calcium and Vitamin D and reported levels above 20 ng/mL as sufficient and that 25(OH)D levels should not exceed 50 ng/mL due to the increased risk of all-cause mortality, cardiovascular disease, fractures and falls associated with 25(OH)D levels above 30–60 ng/mL [Ross et al., 2011]. The 25(OH)D concentrations at which toxicity is evident has been difficult to determine and based almost solely on individual case reports and small case series [Dudenkov et al., 2015].
Hypovitaminosis D is very common in the United States, with 70% of children and adolescents deficient or insufficient [Kumar et al., 2009]. Hypervitaminosis D, on the other hand, has gained recent attention because of the increasing awareness of vitamin D deficiency and the increased use of vitamin D supplementation. The incidence of hypervitaminosis D in pediatric patients and the associated toxicity, as determined by the presence of hypercalcemia, hyperphosphatemia, suppressed parathyroid hormone, and associated symptoms [Vieth 2007], has not been directly studied using 25(OH)D concentrations. Because childhood and adolescence is a period of rapid bone growth, during which vitamin D status should be maintained within an optimal range, elucidating the vitamin D status in this patient population is very important.
Currently, there is limited data on vitamin D levels in individuals with SLOS. Rossi et al. [2005] found normal vitamin D levels in a study of five SLOS patients. Due to the small size of this study we decided to evaluate vitamin D status and the possibility of vitamin D toxicity in a larger SLOS pediatric patient cohort enrolled in a longitudinal natural history study at the National Institutes of Health (NIH), and to compare the vitamin D levels across all seasons to pediatric patients who were evaluated at the NIH Clinical Center (NIHCC) during the same time period (1998–2006).
MATERIALS AND METHODS
Study population and design
A retrospective review was conducted which included medical records of pediatric SLOS patients enrolled in an ongoing natural history study (ClinicalTrials.gov NCT00001721) and pediatric patients being followed at the NIHCC under other research protocols. Results of laboratory analysis were obtained through the NIH Biomedical Translational Research Information System (BTRIS_2015_945, BTRIS_2015_946, BTRIS_2015_947). Blood draw values were obtained for all SLOS patients and NIHCC pediatric patients at 0–18 years of age, between January 1st, 1998 and December 31st, 2006. Lab values for individuals over the age of 18 at the time of blood draw were excluded. In all, the SLOS cohort consisted of 53 pediatric patients with complete data sets consisting of 7-DHC, 25(OH)D, 1,25(OH)2 D, parathyroid hormone, phosphorous, and total calcium values. The NIHCC pediatric cohort included 867 patients for whom complete data sets (excluding 7-DHC levels) were available.
Laboratory values
All biochemical analysis was done at the Mayo Medical Laboratories (Rochester, MN) or the National Institutes of Health Clinical Center Laboratory (Bethesda, MD). Serum 25(OH)D measurements were obtained from the Mayo Medical Laboratories between January 1st 1998-December 11, 2001, and the NIH Clinical Center Laboratory, December 12th, 2001-December 31st, 2006. The 1,25(OH)2 D measurements were obtained from the Mayo Medical Laboratories for all blood draws. Parathyroid hormone measurements were obtained from the Mayo Medical Laboratories between January 1st 1998 and September 14th, 1999, and the NIH Clinical Center Laboratory between September 15th, 1999-December 31st, 2006. Total calcium and phosphorous measurements were all obtained at the NIH Clinical Center Laboratory. Serum 7-DHC, 8-DHC and cholesterol values were obtained from the Biochemical Genetics Laboratory at the Kennedy Krieger Institute (Baltimore, MD). Although assays changed during the study period for the lab metabolites, it was determined that no adjustments or conversion factors were required to compare values over time and across assays. The date of the laboratory values during which laboratory samples were obtained were categorized by season: Winter (December 20th–March 19th), Spring (March 20th–June 19th), Summer (June 20th–Sept 21st), and Fall (Sept 22nd–Dec 19th). Vitamin D status was determined according the Endocrine Society’s Clinical Practice Guidelines (Holick et al., 2011) and Institute of Medicine’s Dietary Reference Intakes for Calcium and Vitamin D [Ross et al., 2011]. Vitamin D deficiency, insufficiency, sufficiency and excess were defined as serum 25(OH)D concentrations of < 20.00 ng/mL, 20.01–29.99 ng/mL, 30–49.99 ng/mL, and >50 ng/mL, respectively.
Statistical analysis
All statistical analyses were performed using the SPSS Statistical Software v23 (SPSS Inc, Chicago, IL, USA) and GraphPad Prism software (version 6.0) (GraphPad Software, La Jolla, CA). A p-value of 0.05 was considered to be statistically significant. Descriptive statistics were expressed as mean ± SD. Spearman’s correlation tests were used to determine the correlation between 7(DHC), 25(OH)D, and biomarker variables averaged over blood draws for SLOS patients. A linear mixed model with fixed effects for patient population, season and age of blood draw, and a random intercept was used to compare 25(OH)D levels (vitamin D status) across seasons of blood draw and between the SLOS patient population and the NIHCC pediatric patient population.
RESULTS
Demographic data are presented in Table I. A total of 53 SLOS and 867 NIHCC pediatric patients were included in the study between 1998 and 2006. The total number of blood draws was 267 and 2287 for these two groups, respectively. There was an equal distribution of males and females (p=0.64), but the SLOS subjects were, on average, younger than the control group (p<0.01). Consistent with a northern European predominance of DHCR7 mutations [Porter 2008], there was a higher proportion of white subjects (p<0.01) in the SLOS cohort.
Table I.
Demographics
| Parameter | SLOS Patients (53) | NIH Clinical Center Pediatric Patients (867) |
|---|---|---|
|
| ||
| Sex (%) | ||
| Male | 26 (49.05%) | 397 (45.79%) |
| Female | 27 (50.95%) | 470 (54.21%) |
|
| ||
| Race (%) | ||
| White | 51 (96.22%) | 661 (76.24%) |
| Non-white | 2 (3.73%) | 206 (23.76%) |
|
| ||
| Average Age at Blood Draw (y) |
||
| Mean ± SD | 7.6 ± 6.4 | 11.1 ± 4.6 |
The mean serum 25(OH)D concentration for the SLOS pediatric cohort (48.06 ± 19.53 ng/ml) was significantly increased (p=XX) compared to the mean concentration of 25(OH)D (30.51 ± 16.14 ng/ml) for the NIHCC pediatric patient population (Table II). In addition, there was a marked seasonal effect for 25(OH)D levels in both the SLOS and NIHCC patient populations. As one would anticipate since sun exposure influences serum 25(OH)D level, we observed the highest mean concentrations during the summer and fall seasons for both groups (Table II). Controlling for season and age of blood draw, 25(OH)D levels were, on average, 15.96 ng/mL (95% CI 13.95–17.90) higher in patients with SLOS compared to pediatric patients who visited the NIH during the same time period.
Table II.
Vitamin D Status: Overall and by Season (1998–2006) for SLOS and NIH Clinical Center (NIHCC) Patients
| Measurements (mean ± SD) | Overall | Winter | Spring | Summer | Fall |
|---|---|---|---|---|---|
| SLOS Patients 25(OH) D ng/mL (n=53) | 48.06 ± 19.53 | 42.72 ± 15.75 | 43.70 ± 17.71 | 52.70 ± 22.06 | 50.76 ± 19.42 |
| NIHCC Patients (ages 0–18) 25(OH) D ng/mL (n=867) | 30.51 ± 16.142 | 28.01 ± 15.27 | 27.69 ± 14.71 | 33.20 ± 16.51 | 32.41 ± 17.09 |
(nmol/L=2.5*ng/mL)
The relationships between mean 7-DHC and 25(OH)D (Figure 1a), total calcium (Figure 1b), and parathyroid hormone (Figure 1c) across subjects were assessed in the SLOS cohort. As can be seen in Figures 1a and 1b, there is moderate positive relationship between mean serum 25(OH)D and 7-DHC across all subjects (p=0.002; r= 0.42) and a negative relationship between 7(DHC) and total calcium levels (p= 0.004; r= −0.387), respectively. In Figure 1c, no significant relationship is seen between 7(DHC) and parathyroid hormone (p=0.085; r= −0.239). There were no significant differences in the serum levels of 1,25(OH)2 D, total calcium, phosphorous or parathyroid hormone in SLOS patients overall and by season (Table III). Regardless of season and 25(OH)D levels, all of the above lab markers of calcium homeostasis were within normal clinical reference ranges.
Figure 1.
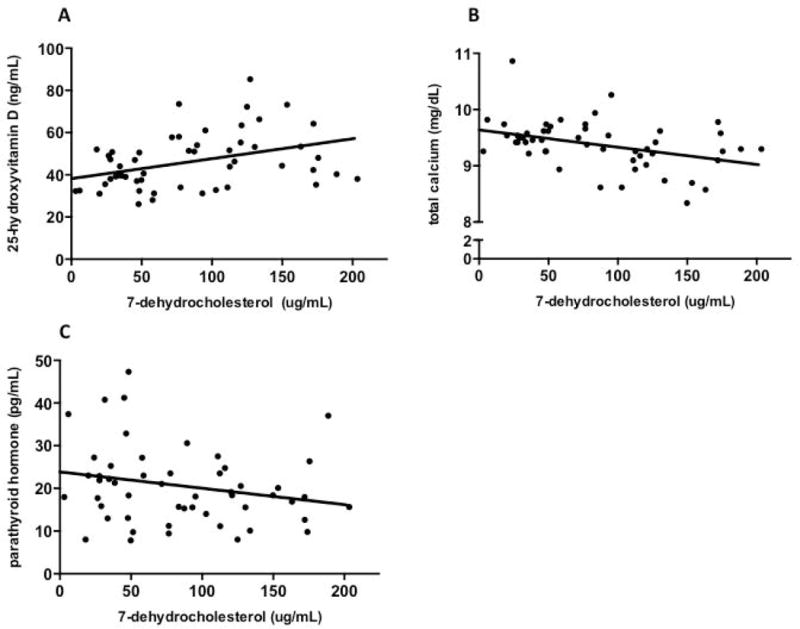
Individual mean serum 7-dehydrocholesterol values according to a) 25-hydroxyvitamin D (r= 0.42, p<0.01, y= 0.09X + 38.2), b) total calcium (r= −0.39, p<0.01, y= −0.003X + 9.6) and c) parathyroid hormone levels (r= −0.23, p=0.08, y= −0.04X + 23.9) in SLOS patients. Each circle represents mean values across all blood draws per individual for the specific biochemical marker.
Table III.
Vitamin D Status and Biochemistry: Overall and by Season (1998–2006) for 53 SLOS Patients
| Measurements (mean ± SD) | Overall | Winter | Spring | Summer | Fall |
|---|---|---|---|---|---|
| Serum 1,25-dihydroxyvitamin D (pg/mL) | 51.46 ± 18.62 (p= 0.411) | 48.46 ± 20.45 | 54.1 ± 21.40 | 52.35 ± 16.61 | 50.64 ± 16.48 |
| Serum calcium (mg/dL) | 9.36 ± 0.536 (p= 0.470) | 9.36 ± 0.44 | 9.4 ± 0.572 | 9.32 ± 0.512 | 9.4 ± 0.0.604 |
| Serum phosphorous (mg/dL) | 5.20 ± 0.731 (p= 0.530) | 5.15 ± 0.714 | 5.24 ± 0.651 | 5.26 ± 0.704 | 5.15 ± 0.840 |
| Serum parathryoid hormone (pg/mL) | 21.20 ± 19.812 (p=0.190) | 25.51 ± 33.43 | 21.28 ± 15.56 | 20.36 ± 15.44 | 18.66 ± 11.80 |
Normal reference ranges: total calcium 8.6–10.2 mg/dL; parathyroid hormone 15–65 pg/mL; phosphorous 2.5–4.5 mg/dL; 1,25 dihydroxyvitamin D 18–64 pg/mL
Comparison of mean 25(OH)D, 1,25(OH)2 D, total calcium and parathyroid hormone values are shown between the SLOS cohort and NIHCC patients (Figure 2). As mentioned previously, mean serum 25(OH)D concentration for the SLOS pediatric cohort was higher (48.06 ± 19.53 ng/mL, p<0.01) in comparison to the mean concentration of 25(OH)D (30.51 ± 16.14 ng/mL) for the NIHCC pediatric patient population (Figure 2a). Mean total calcium levels (Figure 2b) were higher in the SLOS cohort (9.49 ± 0.56 mg/dL, p<0.01) compared to the NIHCC patients (9.25 ± 0.68 mg/dL), while parathyroid hormones levels for the NIHCC patients (Figure 2c) were increased relative to SLOS patients. There was no significant difference in 1,25(OH)2 D levels between the two groups (Figure 2d). The percentage of 25(OH)D values were significantly different between the SLOS and NIHCC patients (chi-squared analysis, p<0.01), with the SLOS patient cohort had a larger proportion of 25(OH)D values (34.83%) with 25(OH)D levels >50 ng/mL compared to only 10.22% of lab values for the NIHCC pediatric patients. The majority of 25(OH)D levels (52.06%) in the SLOS patients were between 30–49 ng/mL while the control pediatric patients showed much lower 25(OH)D levels with the majority being below 30 ng/mL (54.15%) (Figure 3).
Figure 2.
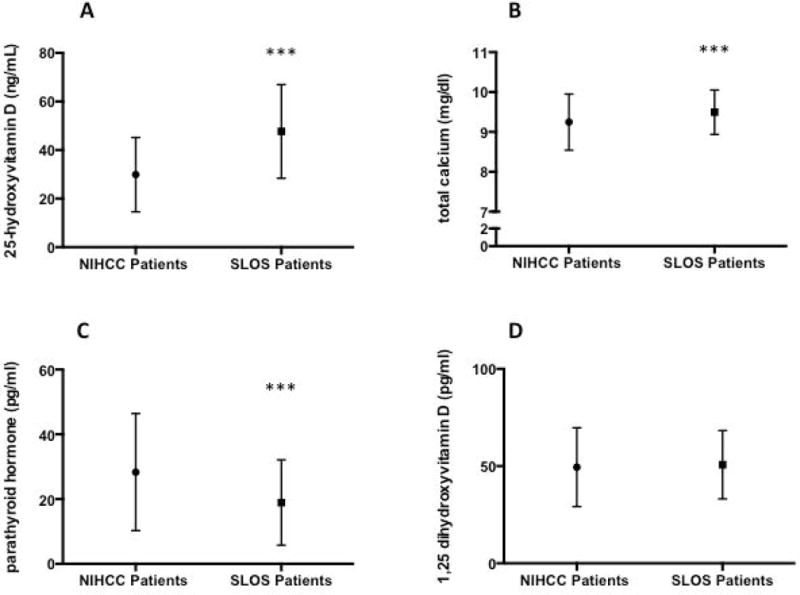
Plasma levels of a) 25-dihydroxyvitamin D, b) total serum calcium, c) parathyroid hormone and d) 1,25-hydroxyvitamin D for NIH Clinical Center and SLOS pediatric patient cohorts expressed as mean ± SD. ***p<0.01
Figure 3.
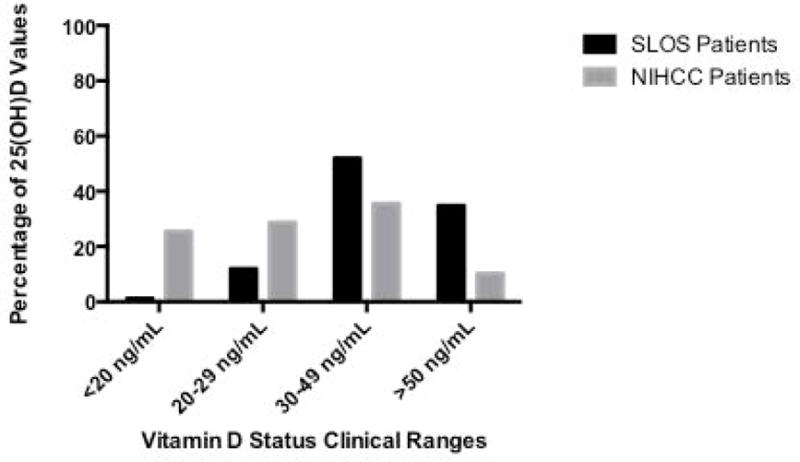
Percentage of 25-hydroxyvitamin D lab values <20 ng/mL, 20–29 ng/mL, 30–49 ng/mL, and >50 ng/mL in SLOS and NIHCC patient cohorts (Chi-square 46.9, 3 df). ***p<0.01
DISCUSSION
This study evaluated the 25(OH)D levels in an SLOS cohort enrolled in a natural history study at the National Institutes of Health, and compared vitamin D values to those obtained from patients visiting the NIH during the same time period. Vitamin D can be acquired through the diet, however over 90% of an individuals vitamin D levels are obtained following synthesis in the skin from 7-DHC by UVB irradiation [Holick 2012]. The vitamin D produced from 7-DHC depends on the intensity of ultraviolet irradiation which varies with season of year and latitude [Reusch et al., 2009]. Factors such as sunscreen use, ethnicity and age affect vitamin D status as well [Holick 2007]. Despite limited sunlight exposure and photosensitivity reported in many patients with SLOS [Charman et al., 1998; Anstey, 2001; Eapen 2007], our SLOS cohort had elevated serum 25(OH)D levels compared to values obtained from pediatric patients evaluated at the National Institutes of Health’s Clinical Center.
Our study used a cut-off 25(OH)D level of >50 ng/mL as the safe upper limit on the basis of guidelines recommended by the Institute of Medicine’s Dietary Reference Intakes for Calcium and Vitamin D [Ross et al., 2011]. In all, 34.83% of blood draws from the SLOS cohort reported vitamin D levels above 50 ng/mL. NIHCC pediatric patients showed 10.22% of blood draw values above the safe upper limit, with 54.14% having hypovitaminosis D (<30 ng/mL). Our control group of pediatric patients visiting the NIHCC was chosen to eliminate measurement differences in sample handling and laboratory analysis. Although these patients may have had many different ailments, vitamin D levels in our control group are consistent with those population values previously reported for healthy children and adolescents [Bellone et al., 2014; Vierucci et al., 2014; Williams et al., 2014].
Although no SLOS participants were actively supplemented with vitamin D, some subjects received a normal multivitamin or were on a formula that contained vitamin D. This is likely also true for the control group. Abnormally elevated 7-DHC levels may however, explain the higher levels of 25(OH)D we see across all seasons in the SLOS cohort. Our data show that season of blood draw was a significant predictor of vitamin D status across all patient groups, with winter and spring being the lowest seasons and summer and fall being the highest seasons of 25(OH)D levels. There was no interaction between the patient groups and season of blood draw, but seasonal variations in 25(OH)D were consistent in both SLOS and NIHCC patient groups.
Because some cholesterol precursors are biologically active, abnormally low or high concentrations of specific sterols may have functional consequences. Previous reports have demonstrated that increased concentrations of 7-DHC in rat models induced significant increases in serum 25(OH)D [Bonjour et al., 1987]. Therefore, it was not unreasonable to hypothesize elevated concentrations of 25(OH)D levels in our SLOS patient cohort, as a consequence of abnormally high concentrations of 7-DHC. Since 7-DHC and serum vitamin D levels were found to be elevated in patients with SLOS, we decided to investigate whether or not markers of calcium homeostasis and bone growth may have been altered as a consequence. Despite elevated 25(OH)D levels, there was no evidence of acute vitamin D toxicity as evidenced by hypercalcemia, hyperphosphatemia, or decreased parathyroid hormone levels (Table III) [Vieth 2007]. We did find statistically significant differences in total serum calcium and parathyroid hormone levels. However, both these parameters, even though different, remained within normal reference ranges and therefore are unlikely to have clinical consequences. No seasonal variations in serum parathyroid hormone, 1,25(OH)2 D, total calcium, or phosphorous levels were seen in the SLOS cohort.
It has been speculated that the persistence of mutations in the DHCR7 gene, may have provided an evolutionary advantage to heterozygous carriers [Porter 2008; Kelley and Hennekam, 2000; Ahn et al., 2010, Wang et al., 2010, Prabhu et al., 2016], because high levels of 7-DHC and 25(OH)D could have provided protection against diseases related to bone health in areas of limited sunlight exposure. This is also consistent with the findings from several GWAS studies that certain nucleotide variants at DHCR7 are associated with circulating 25(OH)D levels suggesting that this enzyme could play a larger role in the normal regulation of vitamin D status than previously recognized [Ahn et al., 2010, Wang et al., 2010, Prabhu et al., 2016]. Although genetic factors are thought to play a role in the variability seen in vitamin D status between individuals, there is yet no clear correlation between specific SLOS mutations and their effects on vitamin D metabolism in individuals who are heterozygotes for mutations in the DHCR7 gene [Prabhu et al., 2016]. Such information, however, may provide evidence for increased vitamin D levels in these carriers as a possible protective mechanism against diseases affecting bone health.
Our data show that, in comparison to children and adolescents who visited the NIH between 1998–2006, individuals with SLOS have significantly higher concentrations of 25(OH)D that may be explained by the abnormally high concentrations of serum and tissue 7-DHC. This result is not consistent with the prior report of normal vitamin D levels in five SLOS patients [Rossi et al. 2005]. Based on our observed effect size, the prior case series was underpowered to detect the difference. Despite the elevated vitamin D levels, there were no reports of vitamin D intoxication in this patient cohort and no evidence of biochemical toxicity. Further studies may provide a better picture as to the regulatory mechanisms that play a vital role in vitamin D metabolism in this patient cohort.
Acknowledgments
We express our sincerest appreciation to the patients and their families, and to the staff of the NIH Clinical Center for the excellent care of the patients. The authors would also like to thank Kahlid Rai and Andrea Beri with their assistance with BTRIS data collection.
Footnotes
The authors of this manuscript have no conflicts of interest to declare.
References
- Ahn J, Yu K, Stolzenberg-Solomon R, Simon KC, McCullough ML, Gallicchio L, Jacobs EJ, Ascherio A, Helzlsouer K, Jacobs KB, Li Q, Weinstein SJ, Purdue M, Virtamo J, Horst R, Wheeler W, Chanock S, Hunter DJ, Hayes RB, Kraft P, Albanes D. Genome-wide association study of circulating vitamin D levels. Human molecular genetics. 2010;19:2739–2745. doi: 10.1093/hmg/ddq155. [DOI] [PMC free article] [PubMed] [Google Scholar]
- Anstey A. Photomedicine: lessons from the Smith-Lemli-Opitz syndrome. Journal of photochemistry and photobiology B, Biology. 2001;62:123–127. doi: 10.1016/s1011-1344(01)00171-3. [DOI] [PubMed] [Google Scholar]
- Bellone S, Esposito S, Giglione E, Genoni G, Fiorito C, Petri A, Bona G, Prodam F. Vitamin D levels in a paediatric population of normal weight and obese subjects. Journal of endocrinological investigation. 2014;37:805–809. doi: 10.1007/s40618-014-0108-3. [DOI] [PubMed] [Google Scholar]
- Bonjour JP, Trechsel U, Granzer E, Klopffer G, Muller K, Scholler D. The increase in skin 7-dehydrocholesterol induced by an hypocholesterolemic agent is associated with elevated 25-hydroxyvitamin D3 plasma level. Pflugers Archiv: European journal of physiology. 1987;410:165–168. doi: 10.1007/BF00581910. [DOI] [PubMed] [Google Scholar]
- Charman CR, Ryan A, Tyrrell RM, Pearse AD, Arlett CF, Kurwa HA, Shortland G, Anstey A. Photosensitivity associated with the Smith-Lemli-Opitz syndrome. The British journal of dermatology. 1998;138:885–888. doi: 10.1046/j.1365-2133.1998.02231.x. [DOI] [PubMed] [Google Scholar]
- Chapuy MC, Preziosi P, Maamer M, Arnaud S, Galan P, Hercberg S, Meunier PJ. Prevalence of vitamin D insufficiency in an adult normal population. Osteoporosis international: a journal established as result of cooperation between the European Foundation for Osteoporosis and the National Osteoporosis Foundation of the USA. 1997;7:439–443. doi: 10.1007/s001980050030. [DOI] [PubMed] [Google Scholar]
- Chung M, Balk EM, Brendel M, Ip S, Lau J, Lee J, Lichtenstein A, Patel K, Raman G, Tatsioni A, et al. Vitamin D and calcium: a systematic review of health outcomes. Evidence report/technology assessment. 2009:1–420. [PMC free article] [PubMed] [Google Scholar]
- Deeb KK, Trump DL, Johnson CS. Vitamin D signalling pathways in cancer: potential for anticancer therapeutics. Nature reviews Cancer. 2007;7:684–700. doi: 10.1038/nrc2196. [DOI] [PubMed] [Google Scholar]
- Dudenkov DV, Yawn BP, Oberhelman SS, Fischer PR, Singh RJ, Cha SS, Maxson JA, Quigg SM, Thacher TD. Changing Incidence of Serum 25-Hydroxyvitamin D Values Above 50 ng/mL: A 10-Year Population-Based Study. Mayo Clinic proceedings. 2015;90:577–586. doi: 10.1016/j.mayocp.2015.02.012. [DOI] [PMC free article] [PubMed] [Google Scholar]
- Eapen BR. Photosensitivity in Smith-Lemli-Opitz syndrome: a flux balance analysis of altered metabolism. Bioinformation. 2007;2:78–82. doi: 10.6026/97320630002078. [DOI] [PMC free article] [PubMed] [Google Scholar]
- Garland CF, Garland FC, Gorham ED, Lipkin M, Newmark H, Mohr SB, Holick MF. The role of vitamin D in cancer prevention. American journal of public health. 2006;96:252–261. doi: 10.2105/AJPH.2004.045260. [DOI] [PMC free article] [PubMed] [Google Scholar]
- Grant WB. An ecologic study of dietary and solar ultraviolet-B links to breast carcinoma mortality rates. Cancer. 2002;94:272–281. doi: 10.1002/cncr.10196. [DOI] [PubMed] [Google Scholar]
- Holick MF, MacLaughlin JA, Clark MB, Holick SA, Potts JT, Jr, Anderson RR, Blank IH, Parrish JA, Elias P. Photosynthesis of previtamin D3 in human skin and the physiologic consequences. Science (New York, NY) 1980;210:203–205. doi: 10.1126/science.6251551. [DOI] [PubMed] [Google Scholar]
- Holick MF. Vitamin D and bone health. The Journal of nutrition. 1996;126:1159s–1164s. doi: 10.1093/jn/126.suppl_4.1159S. [DOI] [PubMed] [Google Scholar]
- Holick MF. Vitamin D deficiency. The New England journal of medicine. 2007;357:266–281. doi: 10.1056/NEJMra070553. [DOI] [PubMed] [Google Scholar]
- Holick MF, Binkley NC, Bischoff-Ferrari HA, Gordon CM, Hanley DA, Heaney RP, Murad MH, Weaver CM. Evaluation, treatment, and prevention of vitamin D deficiency: an Endocrine Society clinical practice guideline. The Journal of clinical endocrinology and metabolism. 2011;96:1911–1930. doi: 10.1210/jc.2011-0385. [DOI] [PubMed] [Google Scholar]
- Holick MF. The D-lightful vitamin D for child health. JPEN Journal of parenteral and enteral nutrition. 2012;36:9s–19s. doi: 10.1177/0148607111430189. [DOI] [PubMed] [Google Scholar]
- Hypponen E, Laara E, Reunanen A, Jarvelin MR, Virtanen SM. Intake of vitamin D and risk of type 1 diabetes: a birth-cohort study. Lancet (London, England) 2001;358:1500–1503. doi: 10.1016/S0140-6736(01)06580-1. [DOI] [PubMed] [Google Scholar]
- Institute of Medicine Committee to Review Dietary Reference Intakes for Vitamin, D., and Calcium. The National Academies Collection: Reports funded by National Institutes of Health. In: Ross AC, Taylor CL, Yaktine AL, Del Valle HB, editors. Dietary Reference Intakes for Calcium and Vitamin D. Washington (DC): National Academies Press (US), National Academy of Sciences; 2011. [PubMed] [Google Scholar]
- Irons M, Elias ER, Salen G, Tint GS, Batta AK. Defective cholesterol biosynthesis in Smith-Lemli-Opitz syndrome. Lancet (London, England) 1993;341:1414. doi: 10.1016/0140-6736(93)90983-n. [DOI] [PubMed] [Google Scholar]
- Fitzky BU, Witsch-Baumgartner M, Erdel M, Lee JN, Paik YK, Glossmann H, Utermann G, Moebius FF. Mutations in the Delta7-sterol reductase gene in patients with the Smith-Lemli-Opitz syndrome. Proceedings of the National Academy of Sciences of the United States of America. 1998;95:8181–8186. doi: 10.1073/pnas.95.14.8181. [DOI] [PMC free article] [PubMed] [Google Scholar]
- Kelley RI, Hennekam RC. The Smith-Lemli-Opitz syndrome. Journal of medical genetics. 2000;37:321–335. doi: 10.1136/jmg.37.5.321. [DOI] [PMC free article] [PubMed] [Google Scholar]
- Kumar J, Muntner P, Kaskel FJ, Hailpern SM, Melamed ML. Prevalence and associations of 25-hydroxyvitamin D deficiency in US children: NHANES 2001–2004. Pediatrics. 2009;124:e362–370. doi: 10.1542/peds.2009-0051. [DOI] [PMC free article] [PubMed] [Google Scholar]
- Munger KL, Levin LI, Hollis BW, Howard NS, Ascherio A. Serum 25-hydroxyvitamin D levels and risk of multiple sclerosis. Jama. 2006;296:2832–2838. doi: 10.1001/jama.296.23.2832. [DOI] [PubMed] [Google Scholar]
- Porter FD. Smith-Lemli-Opitz syndrome: pathogenesis, diagnosis and management. European journal of human genetics: EJHG. 2008;16:535–541. doi: 10.1038/ejhg.2008.10. [DOI] [PubMed] [Google Scholar]
- Prabhu AV, Luu W, Li D, Sharpe LJ, Brown AJ. DHCR7: A vital enzyme switch between cholesterol and vitamin D production. Progress in Lipid Research. 2016;64:138–151. doi: 10.1016/j.plipres.2016.09.003. [DOI] [PubMed] [Google Scholar]
- Reusch J, Ackermann H, Badenhoop K. Cyclic changes of vitamin D and PTH are primarily regulated by solar radiation: 5-year analysis of a German (50 degrees N) population. Hormone and metabolic research = Hormon- und Stoffwechselforschung = Hormones et metabolisme. 2009;41:402–407. doi: 10.1055/s-0028-1128131. [DOI] [PubMed] [Google Scholar]
- Rossi M, Federico G, Corso G, Parenti G, Battagliese A, Frascogna AR, Della Casa R, Dello Russo A, Strisciuglio P, Saggese G, et al. Vitamin D status in patients affected by Smith-Lemli-Opitz syndrome. Journal of inherited metabolic disease. 2005;28:69–80. doi: 10.1007/s10545-005-3676-8. [DOI] [PubMed] [Google Scholar]
- Vierucci F, Del Pistoia M, Fanos M, Gori M, Carlone G, Erba P, Massimetti G, Federico G, Saggese G. Vitamin D status and predictors of hypovitaminosis D in Italian children and adolescents: a cross-sectional study. European journal of pediatrics. 2013;172:1607–1617. doi: 10.1007/s00431-013-2119-z. [DOI] [PubMed] [Google Scholar]
- Vierucci F, Del Pistoia M, Fanos M, Erba P, Saggese G. Prevalence of hypovitaminosis D and predictors of vitamin D status in Italian healthy adolescents. Italian journal of pediatrics. 2014;40:54. doi: 10.1186/1824-7288-40-54. [DOI] [PMC free article] [PubMed] [Google Scholar]
- Vieth R. Vitamin D toxicity, policy, and science. Journal of bone and mineral research: the official journal of the American Society for Bone and Mineral Research. 2007;22(Suppl 2):V64–68. doi: 10.1359/jbmr.07s221. [DOI] [PubMed] [Google Scholar]
- Wang TJ, Zhang F, Richards JB, Kestenbaum B, van Meurs JB, Berry D, Kiel DP, Streeten EA, Ohlsson C, Koller DL, et al. Common genetic determinants of vitamin D insufficiency: a genome-wide association study. Lancet (London, England) 2010;376:180–188. doi: 10.1016/S0140-6736(10)60588-0. [DOI] [PMC free article] [PubMed] [Google Scholar]
- Wang TJ, Zhang F, Richards JB, Kestenbaum B, van Meurs JB, Berry D, Kiel DP, Streeten EA, Ohlsson C, Koller DL, et al. Common genetic determinants of vitamin D insufficiency: a genome-wide association study. Lancet (London, England) 2010;376:180–188. doi: 10.1016/S0140-6736(10)60588-0. [DOI] [PMC free article] [PubMed] [Google Scholar]
- Wassif CA, Maslen C, Kachilele-Linjewile S, Lin D, Linck LM, Connor WE, Steiner RD, Porter FD. Mutations in the human sterol delta7-reductase gene at 11q12-13 cause Smith-Lemli-Opitz syndrome. American journal of human genetics. 1998;63:55–62. doi: 10.1086/301936. [DOI] [PMC free article] [PubMed] [Google Scholar]
- Williams R, Novick M, Lehman E. Prevalence of hypovitaminosis D and its association with comorbidities of childhood obesity. The Permanente journal. 2014;18:32–39. doi: 10.7812/TPP/14-016. [DOI] [PMC free article] [PubMed] [Google Scholar]