

Abstract
This review presents an overview of the characterization techniques available to experimentally evaluate bone quality, defined as the geometric and material factors that contribute to fracture resistance independently of areal bone mineral density (aBMD) assessed by dual energy x-ray absorptiometry. The methods available for characterization of the geometric, compositional, and mechanical properties of bone across multiple length scales are summarized, along with their outcomes and their advantages and disadvantages. Examples of how each technique is used are discussed, as well as practical concerns such as sample preparation and whether or not each testing method is destructive. Techniques that can be used in vivo and those that have been recently improved or developed are emphasized, including high resolution peripheral quantitative computed tomography to evaluate geometric properties and reference point indentation to evaluate material properties. Because no single method can completely characterize bone quality, we provide a framework for how multiple characterization methods can be used together to generate a more comprehensive analysis of bone quality to complement aBMD in fracture risk assessment.
Keywords: one quality, vibrational spectroscopy, Fourier transform infrared imaging, Raman imaging, electron microscopy, computed tomography, reference point indentation, microindentation, nanoindentation, mechanical testing
I. Introduction
Measurements of areal bone mineral density (aBMD) assessed by dual-energy x-ray absorptiometry (DEXA) have historically been the standard for fracture risk prediction. However, the quantity of bone measured by aBMD incompletely describes fracture risk [1]. The ability of bone to resist fracture is influenced by the mass of the bone; its spatial distribution, including geometry and microarchitecture; and its material properties. Geometric characteristics include macroscopic features such as the cross-sectional properties of the whole bone, as well as smaller scale features such as the trabecular architecture. Tissue material properties include elastic modulus, strength, and fracture toughness, which are influenced by the composition and organization of the mineral and matrix components, as well as the presence of microdamage. These geometric, compositional, and material factors contribute to the “quality” of bone, and by extension to fracture resistance, independently of bone quantity. Therefore, for the purpose of this review, we define bone quality as the geometric and material factors that contribute to fracture resistance independently of aBMD.
Measurement techniques that evaluate bone quality to supplement DEXA-assessed aBMD are sought to improve prediction, and thereby eventual prevention, of fragility fractures across diseased and aging populations [2]. However, the ability to improve assessment of bone’s resistance to fracture from DEXA-assessed aBMD alone is complicated by the fact that the most direct assessment of fracture resistance, ex vivo destructive mechanical testing, cannot be performed in vivo.
This review covers commonly used bone quality measurement techniques, with an emphasis on the newest or most recently improved techniques, as well as those that are used in vivo. In particular, we compare the methods available for assessment of the geometric, compositional, and mechanical properties that contribute to bone quality; we detail their outcome measures; and we offer examples of how each technique is used currently or can be used in the future. Furthermore, each section is organized in descending order of the length scale of each assessment. Figure 1 positions each characterization method in terms of bone’s hierarchical structure, and Table 1 summarizes important features of each characterization technique.
Figure 1.
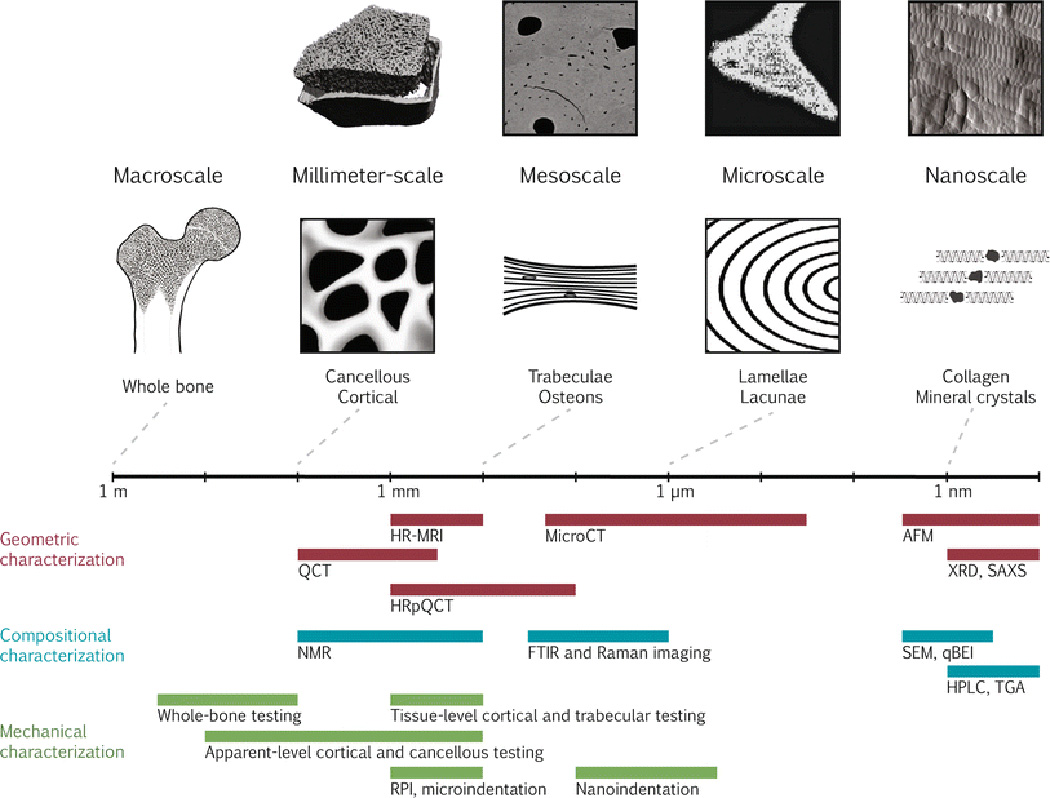
Bone quality measurement techniques are depicted on a logarithmic scale of the hierarchical structure of bone. Along the top from left to right, representative images of bone using the imaging techniques of HRpQCT (adapted with permission from [135]), qBEI (adapted with permission from [136]), FTIRI of crystallinity (adapted with permission from [137]), and AFM (adapted with permission from [138]) are shown. The field of view of the representative images corresponds with the scale bar. Along the bottom, each characterization technique is categorized as geometric, compositional, or mechanical and is depicted by a bar showing the approximate range of resolutions currently achievable.
Abbreviations: AFM = atomic force microscopy; FTIR = Fourier transform infrared; HPLC = high-performance liquid chromatography; HRMRI = high-resolution magnetic resonance imaging; HRpQCT = high-resolution peripheral quantitative computed tomography; Micro-CT = micro-computed tomography; NMR = nuclear magnetic resonance imaging; qBEI = quantitative backscattered electron imaging; QCT = quantitative computed tomography; RPI = reference point indentation; SAXS = small-angle x-ray scattering; SEM = scanning electron microscopy; TGA = thermogravimetric analysis; XRD = x-ray diffraction.
Table 1.
Summary of important features of each characterization method, categorized by geometric, compositional, or mechanical.
| Length scale of analysis |
Destructive? | Testing environment |
Research phase |
Compositional component (s) evaluated |
Spatially resolved ? |
Outcome variables | |
|---|---|---|---|---|---|---|---|
| Geometric | |||||||
| Characterization | |||||||
| Magnetic resonance imaging |
100’s µm to m |
No |
in vivo, ex vivo |
Broad clinical use |
water | Yes | BV/TV; Tb.D; Tb.Th; Tb.Sp; Tb.N; Tb.Conn; Tb.A; Ct.D; Ct.Th; Ct.Po |
| Quantitative computed tomography |
100’s µm | No |
in vivo, ex vivo |
Broad clinical use |
mineral | Yes | BMD; bone geometry; Ct.Th |
| High-resolution peripheral quantitative computed tomography |
10’s µm to mm |
No | in vivo | Clinical research |
mineral | Yes | BV/TV; Ct.D; Tb.D; Tb.Th; Tb.Sp; Tb.N |
| Micro-computed tomography |
50 nm to mm |
No |
in vivo on small animals, ex vivo |
Translational research |
mineral | Yes | BV/TV; Tb.D; Tb.Th; Tb.Sp; Tb.N; Tb.Conn; Tb.A; Ct.D; Ct.Th; Ct.Po, quantification of microdamage, osteocyte lacunae |
| Atomic force microscopy |
Å to µm | No; polished surface required |
ex vivo | Basic research |
mineral, matrix |
Yes | surface topology; stiffness mapping |
| X-ray diffraction | Å to nm | Yes; powdering of non- crystalline samples |
ex vivo | Basic research |
mineral | No | degree of mineralization; crystal size and perfection; atomic spacing |
| Small-angle x-ray scattering |
Å to nm | No | ex vivo | Basic research |
mineral, matrix |
Yes | crystal shape, thickness, orientation |
| Compositional | |||||||
| Characterization | |||||||
| Nuclear magnetic resonance |
100’s µm | No |
in vivo, ex vivo |
Basic research |
mineral, matrix, water |
No | BMD; water content |
| Fourier transform infrared spectroscopy |
µm to mm | Yes; sample homogenization or embedding required |
ex vivo | Translational research |
mineral, matrix |
Yes | mineral:matrix; carbonate:phosphate; collagen maturity; crystallinity; tissue maturity |
| Raman spectroscopy |
µm to mm | No; polished surface required |
in vivo, ex vivo |
Translational research |
mineral, matrix |
Yes | mineral:matrix; carbonate:phosphate; collagen maturity; crystallinity |
| Scanning electron microscopy: secondary electrons |
nm to mm | Yes; conductive coating required |
ex vivo | Basic research |
mineral, matrix |
Yes | surface topology |
| Scanning electron microscopy: quantitative backscattered electron imaging |
nm to mm | No; polished surface required |
ex vivo | Basic research |
mineral | Yes | BMDD |
| High-performance liquid chromatography |
Å to nm | Yes | ex vivo | Basic research |
matrix | No | collagen crosslinks; bone turnover markers; amino acid composition |
| Thermal gravimetric analysis |
Å to nm | Yes | ex vivo | Basic research |
mineral, matrix, water |
No | ash fraction |
| Mechanical | |||||||
| Characterization | |||||||
| Whole-bone testing | mm to m | Yes | ex vivo | Basic research |
mineral, matrix, water |
No | structural stiffness, strength, toughness |
| Apparent-level cortical and cancellous testing |
µm to cm | Yes | ex vivo | Basic research |
mineral, matrix, water |
No | apparent-level stiffness, strength, toughness |
| Tissue-level cortical and |
100’s µm to mm |
Yes | ex vivo | Basic research |
mineral, matrix, |
No | tissue-level stiffness, strength, toughness |
| trabecular testing Microindentation |
100’s µm | No; polished surface required |
ex vivo | Basic research |
water mineral, matrix, water |
Yes | hardness |
| Reference point indentation |
100’s µm | No |
in vivo, ex vivo |
Translational research |
mineral, matrix, water |
Yes | BMSi; ID; maximum force; energy dissipation; CID; loading slope; unloading slope |
| Nanoindentation | µm | No; polished surface required |
ex vivo | Basic research |
mineral, matrix, water |
Yes | hardness; unloading modulus |
Geometric and compositional abbreviations: BMD = bone mineral density; BMDD = bone mineral density distribution; BV/TV = bone volume fraction; Ct.D = cortical density; Ct.Po = cortical porosity; Ct.Th = cortical thickness; Tb.A = trabecular anisotropy; Tb.Conn = trabecular connectivity; Tb.D = trabecular density; Tb.N = trabecular number; Tb.Th = trabecular thickness; Tb.Sp = trabecular separation. Mechanical abbreviations: BMSi = bone material strength index; CID = creep indentation distance; ID = indentation distance.
II. Geometric Characterization
The organization and distribution of cortical and cancellous bone vary throughout the skeleton and with each bone’s function. By evaluating the geometric properties of cortical and cancellous bone at a variety of length scales (Figure 1), their influence on bone quality at larger length scales can be assessed. Because cancellous bone is generally more sensitive to pathologic changes than cortical bone due to its relatively greater metabolic activity, cancellous sites are highly clinically significant for diseased or aging populations. The length scale required to characterize cancellous bone geometry is typically smaller than that for cortical bone; thus, while many of the techniques described here focus on cancellous bone structure, they can also be used to characterize similarly sized, or larger, features in cortical bone. In addition, the research question drives the selection of the technique used to characterize geometric features: for example, if the research question addresses cortical thickness, then techniques that characterize millimeter-scale features in bone are adequate, and techniques capable of characterizing trabecular architecture (micron-scale features) may be unnecessary.
Therefore, identification of the key length scale or feature size of interest is critical to selection of the appropriate technique for characterization of geometric features of bone. At the micron- to nanometer-scale, bone is composed of a complex hierarchical structure of lamellae and mineralized collagen fibers that can be probed with advanced materials characterization techniques, including atomic force microscopy, x-ray diffraction, and x-ray scattering. The micron to millimeter scale tissue structures can be characterized with micro-computed tomographic techniques. Finally, the macroscopic structures can be characterized with clinical imaging modalities such as computed tomography and MRI. Key advantages of many of the techniques discussed in the following sections include the ability to 1) generate true volumetric bone densities (reported in g/cm3), as opposed to aBMD calculated via DEXA, and 2) make multiple measurements within the same individual over time, allowing for longitudinal assessment of bone geometry and microarchitecture with aging or treatment.
High-Resolution Magnetic Resonance Imaging (MRI)
Magnetic resonance imaging (MRI) is a widely available, nonionizing clinical modality used to image the water in skeletal tissues in vivo. MRI utilizes a large magnet to align the magnetic poles of the protons in the tissue being imaged, and then a radio frequency signal specific to hydrogen is added. Upon removing the radio wave, the magnetic vector associated with each proton relaxes and causes another radio wave to be emitted. The emitted radio wave can subsequently be analyzed for the time required for the proton to relax after the initial radio wave signal, as well as for the time required for the axial spin to return to its resting state. Because these two characteristic times vary for different types of tissue (e.g., bone, fat, marrow), a tissue-specific image can be created [3].
While standard clinical MRI techniques do not resolve trabecular bone, high-resolution MRI (HR-MRI) techniques can provide 3-D information on trabecular bone at peripheral sites (e.g., the radius, tibia, and calcaneus) with a resolution on the order of trabecular dimensions (in-plane resolution: ~110 µm, slice thickness: ~300 µm) [4]–[7]. MR imaging measures the water in marrow cavities; thus, trabecular architecture is derived from the negative MR image. Recent advancements allow for imaging of the proximal femur, a major site of clinical interest, though the signal-to-noise ratio (SNR) and the resolution (in plane resolution: ~250 µm, slice thickness: ~500 µm) are lower than those at peripheral sites [5]. The outcomes from MRI are bone volume fraction (BV/TV), trabecular thickness (Tb.Th), trabecular separation (Tb.Sp), trabecular number (Tb.N), trabecular anisotropy and connectivity, cortical thickness (Ct.Th), and cortical porosity (Ct.Po) [5], [8].
MRI studies show promise for monitoring osteoporosis treatment [9] and predicting fracture risk clinically [10]. MRI scans can also be used to generate 3-D bone geometry for finite element analysis (FEA) models, a numerical method that can be used to computationally predict a bone’s mechanical response to loading (see review by Hernandez, this issue). An FEA study using 3-D reconstructions of bone from MRI and micro-computed tomography images found stiffness to strongly correlate between the two imaging modalities, suggesting MRI-based models are suitable predictors of mechanical performance [11]. Some of the main drawbacks of MRI include limited ability to resolve trabeculae, low SNR, and high cost; however, the former two issues are being addressed with improved data collection and processing methods [12].
Quantitative Computed Tomographic Imaging
Quantitative computed tomography (QCT) assesses 3-D bone geometry and volumetric bone mineral density (vBMD) in vivo. vBMD measurements differ from aBMD measurements in that vBMD measures a true volumetric density (g/cm3), while aBMD represents the mass of bone mineral within the 2-D scan area (g/cm2).
In QCT, x-ray radiation is directed at an object of interest, and the attenuation of the x-rays as they interact with the object is recorded by a detector opposite the radiation source. The x-ray source and detector rotate around the object, and tomographic algorithms create a 3-D image reconstruction. Inclusion of a mineral standard or phantom in the scans allows for calculation of vBMD.
Cortical and cancellous bone compartments can be distinguished using QCT (Figure 1). The resolution of standard clinical QCT (in-plane resolution: ~500 µm) is sufficient to measure cortical thickness and volume; however, it is insufficient to characterize trabecular microarchitecture, as the thickness of individual trabeculae range from 50 to 300 µm [13]. QCT is particularly useful for imaging clinically relevant sites such as the spine and hip, though cortical volume measurements of the spine may include some subcortical bone [13]–[15].
Peripheral QCT (pQCT) imaging is a subset of QCT that allows QCT measurements to be taken at appendicular sites [13]. pQCT offers finer resolution (in plane resolution: ~200 to 500 µm) than QCT, but delivers higher effective radiation doses to patients and thus is limited to use on the peripheral sites [16], where the effective radiation dose is relatively low. For example, a QCT scan on an axial site delivers an effective radiation dose on the order of 5 mSv, while a pQCT scan of a peripheral site delivers an effective radiation dose less than 0.01 mSv [17].
High-Resolution QCT (HRpQCT)
High-resolution peripheral quantitative computed tomography (HRpQCT) allows for in vivo measurement of vBMD and resolution of cortical and trabecular features. The principle of image generation is similar to that of QCT systems, and the use of a calibration phantom allows conversion of x-ray attenuation to bone density. Similar to pQCT, HRpQCT can distinguish between cortical and cancellous bone regions; however, the resolution of HRpQCT is higher and can more accurately measure cancellous bone morphology. Sites available for HRpQCT assessment include the distal radius, distal tibia, hand, and fingers. Direct outcome measurements from HRpQCT include cortical bone density, trabecular bone density, total bone density, and mean cortical thickness. Using post-scanning algorithms, calculations of Tb.Th, Tb.Sp, and Tb.N are possible [18].
The newest commercial HRpQCT system (XtremeCT II, Scanco Medical, Brüttisellen, Switzerland) features a nominal isotropic pixel size as small as 17 µm; however, most of the published literature reports the use of a nominal isotropic pixel size between 82 µm and 270 µm [19]. At a resolution of 82 µm, cortical and trabecular bone are distinguishable, allowing for separate vBMD measurements of cortical and trabecular regions; however, trabecular thickness-independent algorithms are necessary to compute trabecular microarchitectural parameters [19], and cortical pore size may be below scan resolution [20]. Moreover, partial volume effects may arise in trabecular microarchitecture measurements because trabecular parameters (e.g., thickness and separation) are on the order of the scan’s spatial resolution.
The clinical applicability of HRpQCT is exemplified in studies showing microarchitectural differences between postmenopausal and premenopausal women as well as osteoporotic and osteopenic women [19], between type 2 diabetic and non-diabetic patients [21], and between risedronate- and placebo-treated menopausal women [22]. Another major benefit of HRpQCT is the ability to generate patient-specific FEA models of bone to assess its mechanical performance in different loading conditions. For example, stiffness and failure load derived from HRpQCT-based micro-FEA data from the radius and tibia were correlated with vertebral and non-vertebral fractures [23].
The effective radiation dose per HRpQCT scan is around 3 µSv, orders of magnitude lower than that delivered by QCT and pQCT scans [24]. Recent reviews highlight the promise for clinical use of HRpQCT [24], [25]. Disadvantages of this technique include 1) the availability of HRpQCT systems is currently limited to academic medical centers, and 2) the relatively few anatomic sites that can be imaged.
Micro-Computed Tomography (Micro-CT)
Micro-computed tomography (micro-CT) is used to characterize 3-D bone geometry and trabecular microarchitecture of biopsies or other excised tissues ex vivo or key skeletal regions of interest of small animals in vivo. Nominal resolution of micro-CT ranges from 1 to 100 µm, but recent advances have increased the nominal isotropic resolution for ex vivo analyses to 50 nm (Zeiss Xradia 800 Ultra, Zeiss, Oberkochen, Germany). Similar to QCT and HRpQCT, tomographic algorithms generate micro-CT 3-D images, but the attenuation data is collected in a slightly different manner: desktop micro-CT scanners designed for ex vivo specimens often have a rotational specimen stage and a stationary x-ray source and detector, while scanners designed for in vivo small animal scans have a stationary stage and a rotational source-detector gantry.
From 3-D micro-CT data reconstructions, trabecular microarchitecture is characterized through outcomes such as BV/TV, Tb.Th, Tb.Sp, Tb.N, trabecular connectivity and anisotropy measurements, and tissue mineral density (TMD) (g/cm3). TMD has the same units as vBMD, but, unlike vBMD, the volume of interest for TMD excludes voids and soft tissue; TMD therefore represents the density of the bone material itself, whereas vBMD may include porosity. In addition, measures of cortical porosity and thickness can also be calculated; however, adequate scan resolution should be carefully considered to achieve accurate cortical porosity measurements [26].
In small animals, micro-CT can be used to monitor skeletal morphology over time [27], and in human biopsies, it can determine the effects of a drug therapy [28] or a disease condition on bone morphology [29]. Quantification of microdamage [30], [31] and osteocyte lacunae in human biopsies or animal models is also possible, though isotropic resolutions less than 1 µm may be required, necessitating the use of a high-resolution desktop scanner or synchrotron source [32].
The primary advantages of this technique include the ability to characterize the details of trabecular architecture, microdamage, and even the osteocyte network; however, finer resolutions come at a cost of longer scan durations and greater radiation exposure. In addition, the specimen sizes that can be scanned ex vivo at the highest resolutions are limited (~100 mm diameter, 140 mm length).
Atomic Force Microscopy (AFM)
Atomic force microscopy (AFM) measures the force deflections that arise when a cantilever beam with an atomically sharp tip is scanned over a sample’s surface. Collection of topographic images with a sub-nanometer spatial resolution are possible [33]. In addition to imaging topography, AFMs can be used to manipulate sample surfaces (e.g., functionalization) and measure forces (e.g., stiffness mapping).
AFM has been used to document collagen fibril alignment and structure, including the 67 nm quarter-stagger fibril alignment [34], as well as bone’s sub-fibrillar structure [35]. It is also possible to image mineral platelets and the topology of fractured specimens [36]. Technological improvements now allow for high-speed AFM (HS-AFM) which maintains the nanometer resolution, but scans complete within seconds rather than minutes [37]. HS-AFM can therefore be used to measure dynamic processes including surface functionalization and diffusion.
One major advantage of AFM over other imaging techniques is the ability to image and probe samples in saline or other liquids, thereby maintaining the sample near biological conditions. Furthermore, AFM maintains a sub-nanometer resolution without the preparative steps like fixation, staining, metal coating, and critical point drying that are required for other imaging techniques like transmission electron microscopy (TEM). Disadvantages of AFM include a small scan area (scan area: hundreds of µm by hundreds of µm, height amplitude limit: 10 to 20 µm) and image distortion of some topological features such as overhangs and steep edges.
X-ray Diffraction and Scattering
X-ray Diffraction (XRD)
For ex vivo studies, x-ray diffraction (XRD) is the gold standard for characterizing the structure of bone mineral. In XRD, an incident beam of x-rays on a sample results in a diffracted ray with variations in intensity due to constructive and destructive interference from planes of atoms within the sample. The x-ray source and the detector are rotated through a range of angles, and the resulting data is processed to determine atomic spacing and structure. The primary outcomes of this technique are the spacings between various atomic planes; crystallite size can also be estimated from the plane spacing data.
The first XRD analysis of bone nearly a century ago established the mineral as hydroxyapatite [38]. Since then, XRD studies have increased in versatility, leading to important insights including the degree of mineralization and crystallinity as functions of tissue and animal age [39], the effect of crystallinity changes on mineral strain [40], and the effects of impurity substitution (e.g., fluoride, strontium, magnesium) into the hydroxyapatite lattice [41].
The key advantage of XRD is that it provides detailed information on the structure of bone mineral crystals. Because sample homogenization is necessary and powdering non-crystalline samples is standard, XRD is typically destructive, despite the diffraction process itself being nondestructive [42].
Small-angle X-ray Scattering (SAXS)
Small-angle x-ray scattering (SAXS) is a complementary technique to standard XRD that does not require homogenization of samples. In SAXS, the scattered rays from an incident x-ray beam are measured instead of the diffracted rays as in XRD. Outcome measurements from SAXS include crystal shape, average crystal thickness, and crystal orientation [43].
The advent of synchrotrons, which produce high energy, monochromatic x-rays, allowed SAXS characterization of bone tissue. The use of in situ synchrotron imaging has enabled a 3-D reconstruction of a trabecula with complete ultrastructural details [44], analysis of the internal stresses of cortical bone during a compressive load [45], studying the load transfer between the mineral and organic matrix of bone at the nanoscale [46], and evaluating strained microdamage at a resolution of 30 nm [47]. These studies show promise for translating structural measurements directly into mechanical property characterizations.
Key advantages of SAXS include the ability to image non-crystalline samples with minimal sample preparation, which allows for detailed insights into bone’s nanoscale structure, variations in tissue mineral density, and damage accumulation. However, SAXS suffers from a lower SNR than XRD; thus, a synchrotron source is required for these measurements.
III. Compositional Characterization
The nanoscale building blocks of bone are an organic matrix, composed mainly of type 1 collagen, a hydroxyapatite-like mineral, and water. In general, the collagen matrix provides bone’s ductility, the mineral provides bone’s stiffness and strength [48], and the water provides bone’s viscoelastic, or time-dependent, behavior [49]. Because toughness, which characterizes a bone’s ability to absorb energy before failure (see review by Burr, this issue), arises from the combination of ductility and strength, the collagen, mineral, and water components of bone are critical to fracture resistance. Therefore, characterization of the mineral, matrix, and water components of bone lends insight into bone quality and their contribution to structural integrity of whole bones [50], [51].
Nuclear Magnetic Resonance (NMR)
Nuclear magnetic resonance (NMR), also called magnetic resonance spectroscopy or nuclear paramagnetic resonance, operates using the same principles as MRI. Whereas MRI is typically used to image the water in a tissue, NMR can be used to measure other isotopes. NMR uses the responses of isotopes to an external magnetic field to generate compositional information about the sample being scanned. The response of a particular isotope to an external magnetic field is unique and depends on the isotope’s molecular environment, and the parameter used to describe an isotope’s response is called chemical shift. The two isotopes used to study bone with NMR are 1H and 31P. Although the feasibility of measuring cortical and cancellous tibial bone BMD has been demonstrated in vivo using 31P [52], a low SNR remains a key challenge for this isotope [53]. Therefore, here we focus primarily on 1H, or proton, NMR.
Proton NMR is used to characterize the water content in bone. Water in bone plays roles in transporting ions during mineralization, damping during mechanical loading, and regulating bone formation via fluid flow-mediated mechanotransduction. The water in bone falls into two main categories: bound and unbound. Bound water exists in Ca2+ coordination sites on the mineral and is associated with collagen fibrils. Unbound water, or bulk water, exists in the pores of the Haversian system and is used as an inverse measure of bone density [54].
Both varieties of water in bone are distinguishable through proton NMR [55]. In a study investigating water content, aging, and mechanical properties ex vivo, bound water increased with age while unbound water correlated to porosity. Additionally, both bound and unbound water influenced mechanical properties [56]. The important roles of water in bone and the push towards its use in clinical measurements is described in a recent review [55]. Advances in NMR technology in the past several decades have also enabled ultrafast Magic Angle Spinning (MAS) NMR on solid bone samples [57], [58]. Ultrafast MAS NMR has the potential help further elucidate the complex structure and order of bone’s hierarchical system beyond standard NMR measurements of water content and location.
Two main advantages of NMR are 1) the ability to scan in vivo without subjecting the patient to ionizing radiation, and 2) the technique is nondestructive, allowing repeated measurements on the same patient or sample. The principal disadvantage is the low SNR of isotopes other than 1H, which limits NMR’s versatility for specimens, like biological tissues, that have high water content.
Vibrational Spectroscopy and Imaging
Infrared (IR) spectroscopy and Raman spectroscopy can be used to determine the chemical signature of a sample. Both techniques rely on the characteristic fingerprints of molecular bond vibrations from a material’s constituents. When coupled to a microscope and an array detector, both of these techniques can be used in an imaging mode to assess material composition in a spatially resolved fashion [59].
In general, strong molecular bond vibrations in the IR spectrum correspond to weak bond vibrations in the Raman spectrum, and vice-versa. The differences in the strength of vibrational modes between IR and Raman arises from complex molecular symmetry, but typically a change in dipole moment indicates an IR active-mode, and a change in polarizability indicates a Raman active-mode. In bone, both IR and Raman spectroscopy can differentiate the molecular signals of the organic matrix components (collagen, proteoglycans, lipids, etc.) from the signals arising from the constituents of the hydroxyapatite (phosphate, carbonate).
FTIR Spectroscopy and Imaging
Fourier transform infrared spectroscopy (FTIR) is used primarily in transmission or absorption mode and requires a thin sample (thickness: ~2 µm). When characteristic frequencies of an incident infrared beam are absorbed by molecular bonds in the sample, the resulting interferogram is Fast Fourier Transformed into a spectrum in the frequency domain. The peaks in the resulting FTIR spectrum are analyzed to identify molecular species, qualitatively determine the amount of specific components, and provide information on the stoichiometry of a particular molecular species.
The outcome measurements from a typical FTIR spectrum of bone include the mineral to matrix ratio, indicating the extent of mineralization of the organic matrix; the carbonate to phosphate ratio, indicating the extent to which carbonate has been substituted into hydroxyapatite; the collagen maturity, indicating the relative crosslink proportion of mature trivalent crosslinks to immature divalent crosslinks; the crystallinity, a measure of crystal size and perfection; and acid phosphate content, a measure of tissue maturity [60], [61]. Furthermore, spatial mapping and information about tissue heterogeneity is possible through FTIR imaging (FTIRI) which allows for characterization of the above parameters across a region of interest with a spatial resolution around 6 µm2.
FTIR and FTIRI were used to detect differences in the quantity and quality of mineral in diseased Schmid metaphyseal chondrodysplasia bone compared to non-diseased bone [62], in collagen maturity between bone from rats treated with a lathyrogen and from untreated controls [63], and in heterogeneity of bisphosphonate treated postmenopausal women with fractures compared to non-fracture controls [64]. Together, these studies exemplify the power of FTIR and FTIRI in evaluating the mineral, organic matrix, and the relationship between the two.
Advantages of FTIR include spatial mapping with FTIRI, concurrent mineral and matrix evaluation, high sensitivity, and a high SNR relative to Raman allowing for faster data collection. A disadvantage of FTIR spectroscopy or imaging is that sample dehydration is required because water dominates the absorption spectrum in the infrared; thus, analysis of biological tissues in their native hydrated states is precluded. In addition, poly (methyl methacrylate) embedding and microtoming of thin sections (thickness: ~2 µm) is required for FTIRI. Finally, a disadvantage of FTIRI includes a coarser resolution than related techniques (FTIRI: ~6 µm, Raman imaging: ~1 µm).
Raman Spectroscopy and Imaging
Raman spectroscopy uses the inelastic scattering of incident light on a sample to detect changes in polarizability of molecules. The outcome variables for Raman spectroscopy are similar to those of FTIR, with the exceptions of crystallinity and acid phosphate [65]. Crystallinity in Raman spectroscopy is measured as the inverse of the full-width at half-maximum (FWHM) of the 959 cm−1 phosphate peak which is related to the length of the mineral crystallite c-axis [66].
Within the past decade, in vivo Raman capabilities have been realized [67]. Using spatially offset Raman spectroscopy (SORS), millimeter depths human tibial and finger tissue have been scanned [68]. A comprehensive analysis of the feasibility and promise of Raman in a clinical setting is described by Hanlon et al. [69].
Raman imaging offers several advantages relative to FTIRI, including a finer spatial resolution (~1 µm); the ability to scan thick, hydrated specimens, which allows for more versatile use in biological samples; and in vivo capabilities. The key drawback of Raman is its relatively low SNR, which substantially increases scan times relative to FTIR.
Scanning Electron Microscopy (EM)
SEM: Secondary Electrons
In scanning electron microscopy (SEM) an electron beam is rastered across a sample surface to determine topographical and compositional information with a resolution of tens of nanometers [70]. As the electrons from the beam contact the sample surface, energy from the incident electron is transferred to an atom in the sample. When this extra energy in the atom is released, a secondary electron is emitted and subsequently detected. Because the primary outcome of this technique is a detailed 2-D image of the specimen surface, secondary outcomes can include parameters quantifying formation and resorption areas in bone undergoing remodeling [71], [72].
SEM imaging has been used to demonstrate collagen fiber orientation and fiber deformation from an excised cortical bone specimen undergoing bending [73]. Furthermore, SEM and energy dispersive x-ray analysis, which allows for analysis of the elemental composition of a specimen, were used in concert to monitor the effect of bisphosphonate treatment on mineral content and quality of fracture healing in rats [74]. These studies demonstrate the capability of SEM to characterize both the organic and mineral components of bone. SEM images also can show the formation and resorption regions associated with bone remodeling [75].
An advantage of SEM is that it allows higher resolution than standard histology by optical microscopy, and thin sections need not be microtomed. With the exception of environmental SEM, SEM requires a conductive sample to avoid charging effects at the surface, so samples are typically coated with a thin conductive layer prior to imaging.
SEM: Quantitative Backscattered Electron Imaging (qBEI)
In addition to the signal measured from secondary electrons, SEM imaging also produces a backscattered electron signal which is used to generate a quantitative backscattered electron image (qBEI). As an electron beam is rastered across a sample, some of the incident electrons collide with atoms in the sample causing the electrons to be scattered backwards. The amount of backscattering an electron exhibits is proportional to the atomic number Z of the atom with which it collides; therefore, higher atomic numbered atoms will generate a higher backscattering signal. This is also called Z contrast.
Of the constituents in bone (organic matrix: C, O, H, N, P; mineral: Ca, O, H, P, Mg), calcium has the highest Z number (Z = 20). Calcium dominates qBEI image contrast, and it indicates different stages of mineralization in a tissue. The main outcome measurement for qBEI is bone mineral density distribution (BMDD) which details the degree of mineralization spatially across a region of interest [76]. Unlike standard in vivo BMD measurements, BMDD measurements using qBEI require bone tissue to be embedded in a plastic resin and imaged using an SEM. Because surface topography affects electron backscattering, polished samples are required.
BMDD measurements using qBEI can be calibrated against a calcium standard to determine calcium weight in clinical biopsies [76]. qBEI is a particularly useful technique when the mineral component of bone is expected to deleteriously affect bone quality, for example in patients with osteogenesis imperfecta [76] or in fragility fracture patients with acute or chronic illnesses [77]. Additionally, qBEI can characterize BMDD of multiple trabecular or cortical regions quickly at a resolution around 1 µm [78]. A key limitation of qBEI for clinical use is the need for a plastic embedded and polished biopsy.
High-Performance Liquid Chromatography (HPLC)
High-performance liquid chromatography (HPLC) is an analytical chemistry technique used to identify and quantify compounds in a liquid sample. HPLC works by pumping a sample through a column containing porous solid beads of known size and composition. Based on the physical and chemical interactions of the sample components with the column beads, each component elutes from the column at a signature rate, and the concentration of each component is measured precisely with a detector at the eluting end. Typical HPLC outcomes for bone quality are collagen crosslinks, bone turnover markers, and the amino acid composition.
The collagen crosslinks formed through enzymatic and non-enzymatic pathways have different effects on bone quality. Enzymatic crosslinks form through the action of lysyl oxidase and undergo a maturation process from an immature divalent crosslink to a mature trivalent crosslink. Enzymatic collagen crosslinks that have been measured using HPLC include the immature crosslinks of dehydrodihydroxynorleucine (DHLNL) and dehydrohydroxylysinonorleucine (HLNL), and the mature crosslinks of hydroxylysyl pyridinoline (HP) and lysyl pyridinoline (LP) [79]. Enzymatic crosslinks in humans stabilize around 10–15 years of age [79], and in general are associated with advantageous mechanical stabilization of the collagen matrix and as precursors to mineralization [80]. The specific crosslinks HP and LP are also used as markers for bone turnover [81]. HPLC measurements of non-enzymatic crosslinks include glycation endproducts like pentosidine which has been implicated in reduced bone quality in patients with osteoporosis or type 2 diabetes [82], and in normal aging [83].
Important benefits of HPLC are the precise measurement of concentrations of molecular components as low as [picomol] and the ability to measure many components in one test. HPLC is destructive and requires sample homogenization, specialized equipment, and technical expertise. Future improvements will aim for higher selectivity of components, decreased throughput time, and lowered cost.
Thermal Gravimetric Analysis (TGA)
Thermal gravimetric analysis (TGA) characterizes the mass of organic and inorganic constituents in a sample by monitoring the sample’s weight change with increasing temperature. For bone, samples are first dried at 110 °C to remove water. Continued heating between 200 and 600 °C causes the organic components to decompose until they are eliminated completely by combustion [84]. The remaining material after heating to 600 °C is called the ash weight, which consists only of the inorganic hydroxyapatite-like mineral in bone. The primary outcome is the ash fraction, which is obtained by dividing the ash weight by the initial dried sample weight.
TGA is the gold standard for determination of the mineral fraction in bone tissue; however, the primary drawback is that it is a destructive technique, leaving behind only the mineral component after combustion.
IV. Mechanical Characterization
A fragility fracture is a mechanical event in a biological system [85]. Bone’s resistance to fracture depends on many properties and their interactions including: 1) stiffness, the ability to resist elastic/reversible deformation; 2) strength, the ability to resist plastic/permanent deformation; 3) toughness, the ability to absorb energy during deformation; and 4) fracture toughness, the ability to prevent cracks from initiating and progressing. These properties also change with repetitive loading over time, a process known as fatigue, which is a complex process beyond the scope of this review [86], [87]. Although a discussion of fracture toughness testing is beyond the scope of this review, several reviews are available regarding fracture toughness of bone at multiple length scales [88]–[90].
Mechanical properties can be assessed at different levels of the bone structural hierarchy (Figure 1). In specifying a length scale at which to perform a mechanical test, influences from larger length scales can be removed, so that the test includes mechanical influences from the properties at and below the testing scale. For example, if a cancellous core from the proximal femur (mm length scale) is mechanically tested, the whole bone size and shape do not influence the test outcomes, and instead, the smaller scale properties (e.g., microarchitecture, composition, bone volume fraction) affecting the test outcome variables are included. Furthermore, the influence of heterogeneity and flaws on the outcomes of a mechanical test depend on the size of the tested sample. More specifically, a small structural or compositional flaw will have a larger effect on a tissue-level mechanical test than the same flaw would have on a whole-bone mechanical test.
The following section details common types of mechanical testing, their outcome variables, and the length scale assessed by each test. Though not discussed in detail here, bone tissue handling and storage conditions (e.g., number of freeze-thaw cycles, tissue fixation, hydration) prior to mechanical testing may strongly influence the test’s outcome variables and should be carefully controlled [91], [92].
Whole-bone Testing
Macroscale mechanical testing of whole bones is destructive and therefore only possible in studies using animal models or cadaveric tissue. In general, whole-bone testing involves stabilizing the bone of interest, applying a load (or displacement), and measuring the resulting deformation. The standard bones used for whole-bone testing are long bones and vertebrae, and typical loading modes include compression, tension, and bending [93]. For small animal studies, femoral bending tests are often performed because the diaphyseal cross-section is approximately elliptical, which simplifies subsequent mechanical analyses [88], [91], although other long bones and vertebrae can be tested depending on the research question. Outcome variables for a quasi-static load on a whole bone include a force-displacement curve, structural stiffness, structural strength, and toughness [94].
Mechanical testing of vertebrae from ovariectomized macaques treated with ibandronate showed significant increases in strength and stiffness with drug treatment [95], and testing of femora from rats with type 2 diabetes showed decreased strength, stiffness, and energy absorption arising from alterations of the collagen matrix [96]. These studies exemplify the utility of using whole-bone testing to study the effects of drug therapy and disease on the structural properties of bone. Drawbacks of whole-bone testing are that it is inherently destructive, and that this level of analysis is unable to decouple the structural and compositional factors that influence structural properties.
Apparent-level Bulk Cortical and Cancellous Bone Testing
Using regularly-shaped specimens of bulk cortical and cancellous tissue (width: mm to cm, length: mm to cm), mechanical tests allow determination of material properties of each tissue type including apparent-level stiffness, strength, and toughness. At this level of structural hierarchy, the effects of porosity are included in these measurements; thus, the outcomes are apparent-level properties. Testing at a smaller length scales is necessary to isolate tissue-level properties (see Tissue-level Cortical and Trabecular Testing).
Bulk tissue testing shows the mechanical properties of cancellous bone to be highly dependent on bone volume fraction, and, similarly, it shows the mechanical properties of cortical bone to be highly dependent on cortical porosity [97], [98]. Mechanical properties of both types of bone vary with anatomic site and loading direction [99], [100], which demonstrates the utility of separating mechanical tests by bulk tissue type and site. Similar to whole bone testing, bulk cortical and cancellous bone testing has proven useful in elucidating the effects of drug therapy, disease, and aging in animal and human studies [101]–[104]. A disadvantage of using this level of mechanical testing is the necessity for uniformly machined specimens.
Tissue-level Cortical and Trabecular Testing
Performing mechanical testing on the scale of cortical microbeams or individual trabeculae further removes the effect of geometry and structure from mechanical property measurements. Typical dimensions of tissue-level mechanical testing are hundreds of microns in width and height, and hundreds to thousands of microns in length. Due to the technical challenges of testing small specimens, micro-tensile or microbeam bending are favored over micro-compression tests.
Micro-tensile testing of single trabeculae in human vertebral bone revealed large differences in ultimate strain between trabeculae, even within a single donor, thus highlighting the variations in tissue at small scales [105]. Disadvantages of tissue-level testing are the complexity of sample preparation and test design. Also, machining regular prismatic specimens can introduce damage or other testing artifacts, and these limitations should be considered when interpreting tissue-level outcomes.
In addition to tissue-level mechanical testing, tissue-level material properties can also be estimated from whole-bone or apparent-level tests by normalizing the property by the sample’s geometry, as determined by micro-CT or other means. Estimation of tissue material properties from whole-bone structural properties relies on many underlying assumptions, including assuming material homogeneity and a prismatic cross-section, which are not appropriate for whole bones [91], [94]. Material properties estimated from whole-bone testing are poorly correlated with material properties assessed directly by nanoindentation [106]; thus, tissue material properties should be assessed directly with one of the techniques described below.
Indentation Testing
In an indentation, or hardness, test, the sample is subjected to a single, static force by a small tip, and the resulting indentation depth and size are recorded. In bone, indentation testing can be performed at several length scales, and it gives information regarding the resistance of bone tissue to plastic/permanent deformation.
For all length scales of indentation testing, tissue hydration, tip morphology, surface roughness, loading rate, and sample orientation must be carefully controlled [107]. Embedding samples in resin and polishing the surface can attenuate variability in outcome measures, though dehydration is known to increase hardness [108].
Microindentation
In a microindentation test, the sample is subjected to a static load, and the resulting geometry of the indentation impression after load removal is used to calculate hardness. Hardness is defined as the force applied divided by the area of the residual indentation, which characterizes the material’s resistance to plastic deformation [109]. Microindentation allows for hardness testing at the length scales of individual trabeculae and osteons of bone. The sampling volume includes microporosity associated with lacunae.
In one of the foundational studies involving microindentation of bone, microhardness correlated with degree of mineralization [109]. More recently, hardness differences along the three orthogonal directions of parallel-fibered bone were observed, indicating the sensitivity of microindentation to local microstructure [110]. Furthermore, microindentation hardness values can distinguish between severely damaged bone and intact bone [111], and it has also been used to characterize aged and osteoporotic bone [107].
Key advantages of microindentation are the simplicity of the technique and the ability to quickly map microhardness across a sample. The main disadvantage is that microindentation has a single outcome measurement, hardness.
Reference Point Indentation
Within the past decade, a new type of indentation testing known as reference point indentation (RPI) was developed. RPI measures bone material properties on a scale similar to that of microindentation ex vivo. There are two main RPI devices, the OsteoProbe (Active Life Scientific, Santa Barbara, CA) and the BioDent (Active Life Scientific, Santa Barbara, CA), which operate under different mechanical loading conditions resulting in dissimilar outcome measurements.
The in vivo OsteoProbe utilizes a single indent with three phases: 1) a linear preload which passes through soft tissue; 2) a quick impact; and 3) unloading as the probe is removed manually. The outcome variable from the OsteoProbe is called bone material strength index (BMSi) which is calculated as 100 times the indentation distance increase (IDI) of a calibration block of poly (methyl-methacrylate) divided by the IDI from the preload to the final load. Typical testing includes five or more indents spaced 2 mm apart. This testing practice accounts for bone’s heterogeneity and avoids measurement interference from previous indentations [112]. In contrast to the single impact-based OsteoProbe, the BioDent features a cyclic indentation technique with customizable parameters in preconditioning, maximum indentation force, and cycle number. The output measurement is a force-indentation distance curve with each cycle presented on the same plot in real-time, and the outcome parameters achievable for each cycle include: 1) maximum indentation distance; 2) maximum force reached; 3) energy dissipation (energy under the force-displacement curve); 4) creep indentation distance; 5) loading slope; and 6) unloading slope. Furthermore, the variance between cycles of each of these parameters can also be calculated [113], [114].
The physical meaning of the outcome variables of the OsteoProbe and the BioDent are still under debate [114]–[116]. The impact loading conditions from the OsteoProbe are dissimilar to the relatively slow loading rates of a traditional microhardness test. In addition, the deformation geometry is not measured; thus, a hardness value cannot be determined from OsteoProbe tests. Furthermore, the name BMSi is itself potentially a source of confusion, as it is not a rigorous measurement of strength and has not been correlated with strength from other standard testing modalities [115]. It has been proposed that the OsteoProbe measures cracking of lamellar bone at the periosteal surface of the tibia, and as such, the closest analog of BMSi would be tissue toughness; however, the correlation between BMSi and tissue-level toughness has also not yet been demonstrated [117]. Similar to the OsteoProbe, efforts to correlate BioDent outcomes to standard mechanical properties have been inconclusive [115]. The BioDent is most similar to a creep or low-cycle fatigue test [117], but differences in the RPI technology versus standard mechanical testing procedures complicate direct comparisons of outcomes. Furthermore, the outcome measurements from each device were found to be weakly related to each other, if at all, in human cadaveric tibiae [118].
Empirical evidence for the clinical utility of these techniques is bolstered by several studies using both the OsteoProbe and the BioDent. Studies using the OsteoProbe showed differences in BMSi between patient populations, including a decrease in BMSi in type 2 diabetic patients compared to non-diabetic patients [119], as well as an increase in BMSi of glucocorticoid treated- compared to non-treated patients [120]. Using the BioDent, the maximum indentation distance and indentation distance increase between the first and last cycle were higher in femoral fracture patients than in non-fracture controls, suggesting the BioDent can distinguish a clinical fracture population [121].
Key advantages of these techniques include the ability, for the first time, to directly measure mechanical properties of bone tissue in vivo. However, the outcome variables await rigorous validation, and standardization of RPI techniques between studies is lacking, complicating comparisons of RPI data across studies.
Nanoindentation
As in a microhardness test, in a nanoindentation test, a tip is loaded into and unloaded from the material of interest to probe the material properties of the sample. However, nanoindentation tests provide more information about the material behavior through the use of depth-sensing transducers. In nanoindentation, when force is applied to the nanoindenter tip, the tip displacement is continuously measured to produce a force-displacement curve. Hardness, representing the average pressure under load, is calculated as the maximum load divided by the indentation contact area; and the reduced modulus, which includes contributions from both the sample and the indenter, is calculated from the slope of the unloading portion of the force-displacement curve [122]. The elastic modulus of the sample, representing its resistance to elastic/reversible deformation, can be calculated from the reduced modulus, the Poisson’s ratio of the sample, and the material properties of the indenter.
In bone, nanoindentation has a spatial contact resolution around 1 µm which allows for characterization of the lower levels of bone’s hierarchical structure including lamellar and interlamellar regions [123]. Also, new instruments combine the imaging capability of an AFM with the mechanical testing capability of an indenter, thereby allowing for precise control over indentation location (within tenths of nm) and surface morphology [124]. Nanoindentation can be performed in a grid pattern resulting in a stiffness map [125], [126], and it can also be coupled to a Raman spectrometer such that mechanical and compositional information are collected simultaneously (TI 950 TriboIndenter, Hysitron, Minneapolis, MN).
When nanoindentation was used in conjunction with second harmonic generation imaging on trabecular bone tissue, lamellar bone was harder and had more aligned collagen as compared to interlamellar bone [127]. Several validation studies of anisotropic elastic moduli with acoustic microscopy or tensile testing provide support for the translation of nanoindentation measurements to the macroscale [128], [129]. These studies taken together demonstrate the feasibility of incorporating nanoindentation measurements of different sites into larger-scale models.
The capability for dynamic load- and displacement-control during nanoindentation allow acquisition of full force-displacement curves at µm-scale and even sub-µm-scale resolution. Nanoindentation also offers modulus mapping capabilities, and it can be coupled with simultaneous compositional testing like Raman spectroscopy, giving this technique versatility [130]. A drawback of nanoindentation is that its spatial resolution is effectively limited by specimen surface roughness; thus, careful sample preparation (e.g., surface polishing) is required for surface irregularities to be small in comparison to the indentation size [131].
V. Summary and Discussion
Direct assessment of bone’s resistance to fracture involves destructive mechanical testing, which is infeasible for clinical fracture risk evaluation. Although surrogate measures of fracture risk such as DEXA-assessed aBMD are clinically useful, they have important limitations as predictors of fracture risk [132], and bone quality measurements can provide complementary information. Here we have reviewed techniques available to assess the geometric and material factors that contribute to bone quality across multiple length scales (Figure 1) along with some of their key outcomes and characteristics (Table 1).
The techniques we review for geometric characterization include imaging technologies spanning length scales from nanometer to meter. These techniques share some common trade-offs, including 1) the size of the sample to be scanned versus the time required to complete a scan, which applies to MRI, all CT-based imaging modalities, and AFM imaging; 2) the scan resolution versus the radiation dose, which applies to in vivo characterization techniques that use x-ray sources, including QCT and HRpQCT; and 3) the clinical relevance of a site versus the amount of soft tissue that can interfere with scanning, which applies to MRI, QCT, and HRpQCT. These three trade-offs have attenuated over the past several decades and are expected to improve with future technological advances.
The techniques we review for compositional characterization characterize the collagen, mineral, and water components of bone spanning length scales from nanometer to meter. Of the methods reviewed, NMR and Raman offer in vivo capabilities. The remaining techniques require a biopsy, of which FTIR, Raman, SEM, and qBEI require special sample preparation and/or mounting; and HPLC and TGA are destructive. Despite many compositional characterization methods not being particularly well suited for clinical use, they offer powerful insights into the effects of diseases, aging, and drug therapies on bone composition that are typically not obtainable through noninvasive means. In clinical studies, these techniques can be performed on biopsies from a small subset of patients to provide detailed information on bone quality that cannot currently be assessed noninvasively.
Finally, we review the types of mechanical testing available for characterization of the mechanical properties of bone at different levels of structural hierarchy. The contributions of cancellous and cortical bone to whole-bone structural performance, as well as the variations in tissue-level properties, further demonstrate the importance of geometry and composition to bone’s mechanical properties. Mechanical testing remains the gold standard for assessment of bone stiffness, strength, toughness, and fracture resistance in cadaveric or animal models. In human clinical studies, bone geometry derived from a noninvasive imaging modality can be used in conjunction with finite element analysis (FEA) validated from cadaveric studies to simulate mechanical testing and predict mechanical properties of clinical populations [133].
Thus, although no single technique can completely characterize bone quality, many of the techniques discussed here can be synergistically combined to generate a more comprehensive understanding of bone geometry, composition, and mechanical properties. Useful combinations of characterization methods include HR-MRI or HRpQCT used with FEA modeling, which allows for non-invasive prediction of the effects of drug treatment on structural properties in human clinical studies, as well as nanoindentation and Raman spectroscopy, which allows simultaneous examination of the relationship between of compositional and mechanical properties in studies in which biopsies are available [21], [134]. Finally, advancements in techniques like Raman imaging and RPI, which were previously feasible only in a laboratory setting, are now enabling their transition into in vivo use. These types of in vivo characterization are expected to make previously unobtainable patient-specific information on bone quality available in the clinic.
Acknowledgments
Funding: This work was supported in part by NIH/NIAMS (K01AR064314) and NSF/CMMI (1452852) to ED and by NSF GRFP (DGE-1144153) to HBH.
Footnotes
Disclosures
Human or Animal Subjects: This article does not contain any studies with human or animal subjects performed by any of the authors.
References
- 1.Kanis JA, Johnell O, Oden A, Dawson A, De Laet C, Jonsson B. Ten year probabilities of osteoporotic fractures according to BMD and diagnostic thresholds. Osteoporos. Int. 2001;12(12):989–995. doi: 10.1007/s001980170006. [DOI] [PubMed] [Google Scholar]
- 2.Donnelly E, Lane JM, Boskey AL. Research perspectives: The 2013 AAOS/ORS research symposium on Bone Quality and Fracture Prevention. J. Orthop. Res. 2014 Jul;32(7):855–864. doi: 10.1002/jor.22626. [DOI] [PMC free article] [PubMed] [Google Scholar]
- 3.Berger A. Magnetic resonance imaging. BMJ. 2002 Jan;324(7328):35. doi: 10.1136/bmj.324.7328.35. [DOI] [PMC free article] [PubMed] [Google Scholar]
- 4.Choël L, Last D, Duboeuf F, Seurin MJ, Lissac M, Briguet A, Guillot G, Choel L, Last D, Duboeuf F, Seurin MJ, Lissac M, Briguet A, Guillot G. Trabecular alveolar bone microarchitecture in the human mandible using high resolution magnetic resonance imaging. Dentomaxillofacial Radiol. 2004 May;33(3):177–182. doi: 10.1259/dmfr/42933309. [DOI] [PubMed] [Google Scholar]
- 5.Krug R, Burghardt AJ, Majumdar S, Link TM. High-Resolution Imaging Techniques for the Assessment of Osteoporosis. Radiol. Clin. North Am. 2010 May;48(3):601–621. doi: 10.1016/j.rcl.2010.02.015. [DOI] [PMC free article] [PubMed] [Google Scholar]
- 6.Chang G, Deniz CM, Honig S, Egol K, Regatte RR, Zhu Y, Sodickson DK, Brown R. MRI of the hip at 7T: feasibility of bone microarchitecture, high-resolution cartilage, and clinical imaging. J. Magn. Reson. Imaging. 2014 Jun;39(6):1384–1393. doi: 10.1002/jmri.24305. [DOI] [PMC free article] [PubMed] [Google Scholar]
- 7.Magland JF, Rajapakse CS, Wright AC, Acciavatti R, Wehrli FW. 3D fast spin echo with out-of-slab cancellation: a technique for high-resolution structural imaging of trabecular bone at 7 Tesla. Magn. Reson. Med. 2010 Mar;63(3):719–727. doi: 10.1002/mrm.22213. [DOI] [PMC free article] [PubMed] [Google Scholar]
- 8.Majumdar S. Magnetic resonance imaging of trabecular bone structure. Top. Magn. Reson. Imaging. 2002;13(5):323–334. doi: 10.1097/00002142-200210000-00004. [DOI] [PubMed] [Google Scholar]
- 9.Wehrli FW, Ladinsky GA, Jones C, Benito M, Magland J, Vasilic B, Popescu AM, Zemel B, Cucchiara AJ, Wright AC, Song HK, Saha K, Peachey H, Snyder PJ. In vivo magnetic resonance detects rapid remodeling changes in the topology of the trabecular bone network after menopause and the protective effect of estradiol. J. Bone Miner. Res. 2008;23(5):730–740. doi: 10.1359/JBMR.080108. [DOI] [PMC free article] [PubMed] [Google Scholar]
- 10.Majumdar S, Genant HK, Grampp S, Newitt DC, Truong VH, Lin JC, Mathur a. Correlation of trabecular bone structure with age, bone mineral density, and osteoporotic status: in vivo studies in the distal radius using high resolution magnetic resonance imaging. J. Bone Miner. Res. 1997;12(1):111–118. doi: 10.1359/jbmr.1997.12.1.111. [DOI] [PubMed] [Google Scholar]
- 11.Rajapakse CS, Magland J, Zhang H, Liu XS, Wehrli SL, Guo XE, Wehrli FW. Implications of noise and resolution on mechanical properties of trabecular bone estimated by image-based finite-element analysis. J. Orthop. Res. 2009;27(10):1263–1271. doi: 10.1002/jor.20877. [DOI] [PMC free article] [PubMed] [Google Scholar]
- 12.Wehrli FW, Song HK, Saha K, Wright AC. Quantitative MRI for the assessment of bone structure and function. NMR Biomed. 2006 Nov;19(7):731–764. doi: 10.1002/nbm.1066. [DOI] [PubMed] [Google Scholar]
- 13.Engelke K, Adams JE, Armbrecht G, Augat P, Bogado CE, Bouxsein ML, Felsenberg D, Ito M, Prevrhal S, Hans DB, Lewiecki EM. Clinical Use of Quantitative Computed Tomography and Peripheral Quantitative Computed Tomography in the Management of Osteoporosis in Adults: The 2007 ISCD Official Positions. doi: 10.1016/j.jocd.2007.12.010. [DOI] [PubMed] [Google Scholar]
- 14.Genant HK, Engelke K, Prevrhal S. Advanced CT bone imaging in osteoporosis. Rheumatology. 2008;47(SUPPL. 4) doi: 10.1093/rheumatology/ken180. [DOI] [PMC free article] [PubMed] [Google Scholar]
- 15.Bousson V, Le Le Bras A, Roqueplan F, Kang Y, Mitton D, Kolta S, Bergot C, Skalli W, Vicaut E, Kalender W, Engelke K, Laredo J-D. Volumetric quantitative computed tomography of the proximal femur: relationships linking geometric and densitometric variables to bone strength. Role for compact bone. Osteoporos. Int. 2006 Jun;17(6):855–864. doi: 10.1007/s00198-006-0074-5. [DOI] [PubMed] [Google Scholar]
- 16.Lala D, Cheung AM, Lynch CL, Inglis D, Gordon C, Tomlinson G, Giangregorio L. Measuring Apparent Trabecular Structure With pQCT: A Comparison With HR-pQCT. J. Clin. Densitom. 2014 Jan;17(1):47–53. doi: 10.1016/j.jocd.2013.03.002. [DOI] [PubMed] [Google Scholar]
- 17.Damilakis J, Adams JE, Guglielmi G, Link TM. Radiation exposure in X-ray-based imaging techniques used in osteoporosis. Eur. Radiol. 2010 Nov;20(11):2707–2714. doi: 10.1007/s00330-010-1845-0. [DOI] [PMC free article] [PubMed] [Google Scholar]
- 18.Geusens P, Chapurlat R, Schett G, Ghasem-Zadeh A, Seeman E, de Jong J, van den Bergh J. High-resolution in vivo imaging of bone and joints: a window to microarchitecture. Nat. Rev. Rheumatol. 2014 May;10(5):304–313. doi: 10.1038/nrrheum.2014.23. [DOI] [PubMed] [Google Scholar]
- 19.Boutroy S, Bouxsein ML, Munoz F, Delmas PD. In vivo assessment of trabecular bone microarchitecture by high-resolution peripheral quantitative computed tomography. J. Clin. Endocrinol. Metab. 2005 Dec;90(12):6508–6515. doi: 10.1210/jc.2005-1258. [DOI] [PubMed] [Google Scholar]
- 20.Burghardt AJ, Buie HR, Laib A, Majumdar S, Boyd SK. Reproducibility of direct quantitative measures of cortical bone microarchitecture of the distal radius and tibia by HR-pQCT. Bone. 2010 Sep;47(3):519–528. doi: 10.1016/j.bone.2010.05.034. [DOI] [PMC free article] [PubMed] [Google Scholar]
- 21.Burghardt AJ, Issever AS, V Schwartz A, Davis KA, Masharani U, Majumdar S, Link TM. High-resolution peripheral quantitative computed tomographic imaging of cortical and trabecular bone microarchitecture in patients with type 2 diabetes mellitus. J. Clin. Endocrinol. Metab. 2010 Nov;95(11):5045–5055. doi: 10.1210/jc.2010-0226. [DOI] [PMC free article] [PubMed] [Google Scholar]
- 22.Bala Y, Chapurlat R, Cheung AM, Felsenberg D, Laroche M, Morris E, Reeve J, Thomas T, Zanchetta J, Bock O, Ghasem-Zadeh A, Djoumessi RMZ, Seeman E, Rizzoli R. Risedronate slows or partly reverses cortical and trabecular microarchitectural deterioration in postmenopausal women. J. Bone Miner. Res. 2014;29(2):380–388. doi: 10.1002/jbmr.2101. [DOI] [PubMed] [Google Scholar]
- 23.Vilayphiou N, Boutroy S, Szulc P, Van Rietbergen B, Munoz F, Delmas D, Chapurlat R. Finite element analysis performed on radius and tibia HR-pQCT images and fragility fractures at all sites in men. J. Bone Miner. Res. 2011;26(5):965–973. doi: 10.1002/jbmr.297. [DOI] [PubMed] [Google Scholar]
- 24.Nishiyama KK, Shane E. Clinical imaging of bone microarchitecture with HR-pQCT. Curr. Osteoporos. Rep. 2013;11(2):147–155. doi: 10.1007/s11914-013-0142-7. [DOI] [PMC free article] [PubMed] [Google Scholar]
- 25.Cheung AM, Adachi JD, Hanley DA, Kendler DL, Davison KS, Josse R, Brown JP, Ste-Marie LG, Kremer R, Erlandson MC, Dian L, Burghardt AJ, Boyd SK. High-resolution peripheral quantitative computed tomography for the assessment of bone strength and structure: A review by the canadian bone strength working group. Curr. Osteoporos. Rep. 2013;11(2):136–146. doi: 10.1007/s11914-013-0140-9. [DOI] [PMC free article] [PubMed] [Google Scholar]
- 26.Cooper D, Turinsky A, Sensen C, Hallgrimsson B. Effect of Voxel Size on 3D Micro-CT Analysis of Cortical Bone Porosity. Calcif. Tissue Int. 2007 Mar;80(3):211–219. doi: 10.1007/s00223-005-0274-6. [DOI] [PubMed] [Google Scholar]
- 27.Boyd SK, Davison P, Müller R, Gasser JA. Monitoring individual morphological changes over time in ovariectomized rats by in vivo micro-computed tomography. Bone. 2006 Oct;39(4):854–862. doi: 10.1016/j.bone.2006.04.017. [DOI] [PubMed] [Google Scholar]
- 28.Dempster DW, Cosman F, Kurland ES, Zhou H, Nieves J, Woelfert L, Shane E, Plavetić K, Müller R, Bilezikian J, Lindsay R. Effects of daily treatment with parathyroid hormone on bone microarchitecture and turnover in patients with osteoporosis: a paired biopsy study. J. Bone Miner. Res. 2001;16(10):1846–1853. doi: 10.1359/jbmr.2001.16.10.1846. [DOI] [PubMed] [Google Scholar]
- 29.Armas LAG, Akhter MP, Drincic A, Recker RR. Trabecular bone histomorphometry in humans with Type 1 Diabetes Mellitus. Bone. 2012;50(1):91–96. doi: 10.1016/j.bone.2011.09.055. [DOI] [PMC free article] [PubMed] [Google Scholar]
- 30.Wang X, Masse DB, Leng H, Hess KP, Ross RD, Roeder RK, Niebur GL. Detection of trabecular bone microdamage by micro-computed tomography. J. Biomech. 2007;40(15):3397–3403. doi: 10.1016/j.jbiomech.2007.05.009. [DOI] [PMC free article] [PubMed] [Google Scholar]
- 31.Tang SY, Vashishth D. A non-invasive in vitro technique for the three-dimensional quantification of microdamage in trabecular bone. Bone. 2007 May;40(5):1259–1264. doi: 10.1016/j.bone.2006.10.031. [DOI] [PMC free article] [PubMed] [Google Scholar]
- 32.Dong P, Haupert S, Hesse B, Langer M, Gouttenoire P-J, Bousson V, Peyrin F. 3D osteocyte lacunar morphometric properties and distributions in human femoral cortical bone using synchrotron radiation micro-CT images. Bone. 2014 Mar;60:172–185. doi: 10.1016/j.bone.2013.12.008. [DOI] [PubMed] [Google Scholar]
- 33.Giessibl FJ. AFM’s path to atomic resolution. Mater. Today. 2005;8(5):32–41. [Google Scholar]
- 34.Revenko I, Sommer F, Minh DT, Garrone R, Franc JM. Atomic force microscopy study of the collagen fibre structure. Biol. Cell. 1994;80(1):67–69. doi: 10.1016/0248-4900(94)90019-1. [DOI] [PubMed] [Google Scholar]
- 35.Baselt DR, Revel JP, Baldeschwieler JD. Subfibrillar structure of type I collagen observed by atomic force microscopy. Biophys. J. 1993;65(6):2644–2655. doi: 10.1016/S0006-3495(93)81329-8. [DOI] [PMC free article] [PubMed] [Google Scholar]
- 36.Thurner PJ, Oroudjev E, Jungmann R, Kreutz C, Kindt JH, Schitter G. Imaging of Bone Ultrastructure using Atomic Force Microscopy. Mod. Res. Educ. Top. Microsc. 2007:37–48. [Google Scholar]
- 37.Casuso I, Kodera N, Le Grimellec C, Ando T, Scheuring S. Contact-mode high-resolution high-speed atomic force microscopy movies of the purple membrane. Biophys. J. 2009 Sep;97(5):1354–1361. doi: 10.1016/j.bpj.2009.06.019. [DOI] [PMC free article] [PubMed] [Google Scholar]
- 38.de Jong WF. La Substance Minérale Dans les Os. Recl. des Trav. Chim. des Pays-Bas. 2010 Sep;45(6):445–448. [Google Scholar]
- 39.Bonar LC, Roufosse AH, Sabine WK, Grynpas MD, Glimcher MJ. X-ray diffraction studies of the crystallinity of bone mineral in newly synthesized and density fractionated bone. Calcif. Tissue Int. 1983 Dec;35(1):202–209. doi: 10.1007/BF02405032. [DOI] [PubMed] [Google Scholar]
- 40.Handschin RG, Stern WB. X-ray diffraction studies on the lattice perfection of human bone apatite (Crista Iliaca) Bone. 1995;16(4 SUPPL) [PubMed] [Google Scholar]
- 41.Eanes ED, Hailer AW. The Effect of Fluoride on the Size and Morphology of Apatite Crystals Grown from Physiologic Solutions. Calcif. Tissue Int. 1998;63(3):250–257. doi: 10.1007/s002239900522. [DOI] [PubMed] [Google Scholar]
- 42.Tadano S, Giri B. X-ray diffraction as a promising tool to characterize bone nanocomposites. Sci. Technol. Adv. Mater. 2016 Apr;12(6):064708. doi: 10.1088/1468-6996/12/6/064708. [DOI] [PMC free article] [PubMed] [Google Scholar]
- 43.Fratzl P, Groschner M, Vogl G, Plenk H, Eschberger J, Fratzl-Zelman N, Koller K, Klaushofer K. Mineral crystals in calcified tissues: a comparative study by SAXS. J. Bone Miner. Res. 1992 Mar;7(3):329–334. doi: 10.1002/jbmr.5650070313. [DOI] [PubMed] [Google Scholar]
- 44.Georgiadis M, Guizar-Sicairos M, Zwahlen A, Trüssel AJ, Bunk O, Müller R, Schneider P. 3D scanning SAXS: A novel method for the assessment of bone ultrastructure orientation. Bone. 2015;71:42–52. doi: 10.1016/j.bone.2014.10.002. [DOI] [PubMed] [Google Scholar]
- 45.Almer JD, Stock SR. Internal strains and stresses measured in cortical bone via high-energy X-ray diffraction. J. Struct. Biol. 2005 Oct;152(1):14–27. doi: 10.1016/j.jsb.2005.08.003. [DOI] [PubMed] [Google Scholar]
- 46.Gupta HS, Seto J, Wagermaier W, Zaslansky P, Boesecke P, Fratzl P. Cooperative deformation of mineral and collagen in bone at the nanoscale. Proc. Natl. Acad. Sci. 2006 Nov;103(47):17741–17746. doi: 10.1073/pnas.0604237103. [DOI] [PMC free article] [PubMed] [Google Scholar]
- 47.Brock GR, Kim G, Ingraffea AR, Andrews JC, Pianetta P, van der MCH. Nanoscale examination of microdamage in sheep cortical bone using synchrotron radiation transmission x-ray microscopy. PLoS One. 2013 Jan;8(3):e57942. doi: 10.1371/journal.pone.0057942. [DOI] [PMC free article] [PubMed] [Google Scholar]
- 48.Currey JD. Effects of Differences in Mineralization on the Mechanical Properties of Bone. Philos. Trans. R. Soc. B Biol. Sci. 1984 Feb;304(1121):509–518. doi: 10.1098/rstb.1984.0042. [DOI] [PubMed] [Google Scholar]
- 49.Sasaki N, Enyot A. Viscoelastic Properties of Bone as a Function of Water Content. J. Biomechics. 1995;28(1):130–815. doi: 10.1016/0021-9290(94)00130-v. [DOI] [PubMed] [Google Scholar]
- 50.Bailey AJ, Sims TJ, Ebbesen EN, Mansell JP, Thomsen JS, Mosekilde L. Age-Related Changes in the Biochemical Properties of Human Cancellous Bone Collagen: Relationship to Bone Strength. Calcif. Tissue Int. 1999 Sep;65(3):203–210. doi: 10.1007/s002239900683. [DOI] [PubMed] [Google Scholar]
- 51.Burstein AH, Zika JM, Heiple KG, Klein L. Contribution of collagen and mineral to the elastic-plastic properties of bone. J. Bone Joint Surg. Am. 1975 Oct;57(7):956–961. [PubMed] [Google Scholar]
- 52.Robson MD, Gatehouse D, Bydder GM, Neubauer S. Human Imaging of Phosphorus in Cortical and Trabecular Bone In Vivo. Magn. Reson. Med. 2004;51(5):888–892. doi: 10.1002/mrm.20055. [DOI] [PubMed] [Google Scholar]
- 53.Kuhn LT, Grynpas MD, Rey CC, Wu Y, Ackerman JL, Glimcher MJ. A comparison of the physical and chemical differences between cancellous and cortical bovine bone mineral at two ages. Calcif. Tissue Int. 2008 Aug;83(2):146–154. doi: 10.1007/s00223-008-9164-z. [DOI] [PMC free article] [PubMed] [Google Scholar]
- 54.Wehrli FW, Fernandez-Seara MA. Nuclear magnetic resonance studies of bone water. Ann. Biomed. Eng. 2005 Jan;33(1):79–86. doi: 10.1007/s10439-005-8965-8. [DOI] [PubMed] [Google Scholar]
- 55.Granke M, Does MD, Nyman JS. The Role of Water Compartments in the Material Properties of Cortical Bone. Calcif. Tissue Int. 2015 Sep;97(3):292–307. doi: 10.1007/s00223-015-9977-5. [DOI] [PMC free article] [PubMed] [Google Scholar]
- 56.Nyman JS, Ni Q, Nicolella DP, Wang X. Measurements of mobile and bound water by nuclear magnetic resonance correlate with mechanical properties of bone. Bone. 2008 Jan;42(1):193–199. doi: 10.1016/j.bone.2007.09.049. [DOI] [PMC free article] [PubMed] [Google Scholar]
- 57.Singh C, Rai RK, Kayastha AM, Sinha N. Ultra fast magic angle spinning solid - state NMR spectroscopy of intact bone. Magn. Reson. Chem. 2016 Feb;54(2):132–135. doi: 10.1002/mrc.4331. [DOI] [PubMed] [Google Scholar]
- 58.Mroue KH, Nishiyama Y, Kumar Pandey M, Gong B, McNerny E, Kohn DH, Morris MD, Ramamoorthy A. Proton-Detected Solid-State NMR Spectroscopy of Bone with Ultrafast Magic Angle Spinning. Sci. Rep. 2015 Jul;5(1) doi: 10.1038/srep11991. [DOI] [PMC free article] [PubMed] [Google Scholar]
- 59.Boskey AL, Mendelsohn R. Infrared spectroscopic characterization of mineralized tissues. Vib. Spectrosc. 2005 Jul;38(1–2):107–114. doi: 10.1016/j.vibspec.2005.02.015. [DOI] [PMC free article] [PubMed] [Google Scholar]
- 60.Boskey A, Mendelsohn R. Infrared analysis of bone in health and disease. Journal of Biomedical Optics. 2005 doi: 10.1117/1.1922927. [DOI] [PubMed] [Google Scholar]
- 61.Spevak L, Flach CR, Hunter T, Mendelsohn R, Boskey AL. FTIRI Parameters describing Acid Phosphate Substitution in Biologic Hydroxyapatite. Calcif. Tissue Int. 2013;92(5):418–428. doi: 10.1007/s00223-013-9695-9. [DOI] [PMC free article] [PubMed] [Google Scholar]
- 62.Paschalis EP, Jacenko O, Olsen B, deCrombrugghe B, Boskey AL. The role of type X collagen in endochondral ossification as deduced by Fourier transform infrared microscopy analysis. Connect. Tissue Res. 1996 Jan;35(1–4):371–377. doi: 10.3109/03008209609029214. [DOI] [PubMed] [Google Scholar]
- 63.Paschalis EP, Tatakis DN, Robins S, Fratzl P, Manjubala I, Zoehrer R, Gamsjaeger S, Buchinger B, Roschger A, Phipps R, Boskey AL, Dall’Ara E, Varga P, Zysset P, Klaushofer K, Roschger P. Lathyrism-induced alterations in collagen cross-links influence the mechanical properties of bone material without affecting the mineral. Bone. 2011 Dec;49(6):1232–1241. doi: 10.1016/j.bone.2011.08.027. [DOI] [PMC free article] [PubMed] [Google Scholar]
- 64.Donnelly E, Meredith DS, Nguyen JT, Gladnick BP, Rebolledo BJ, Shaffer AD, Lorich DG, Lane JM, Boskey AL. Reduced cortical bone compositional heterogeneity with bisphosphonate treatment in postmenopausal women with intertrochanteric and subtrochanteric fractures. J. Bone Miner. Res. 2012 Mar;27(3):672–678. doi: 10.1002/jbmr.560. [DOI] [PMC free article] [PubMed] [Google Scholar]
- 65.Carden A, Morris MD. Application of vibrational spectroscopy to the study of mineralized tissues (review) J. Biomed. Opt. 2000 Jan;5(3):259–268. doi: 10.1117/1.429994. [DOI] [PubMed] [Google Scholar]
- 66.Mandair GS, Morris MD. Contributions of Raman spectroscopy to the understanding of bone strength. Bonekey Rep. 2014 Aug;4:620. doi: 10.1038/bonekey.2014.115. 2015. [DOI] [PMC free article] [PubMed] [Google Scholar]
- 67.Matousek P, Stone N. Recent advances in the development of Raman spectroscopy for deep non-invasive medical diagnosis. J. Biophotonics. 2013;6(1):7–19. doi: 10.1002/jbio.201200141. [DOI] [PubMed] [Google Scholar]
- 68.Buckley K, Kerns JG, Parker AW, Goodship AE, Matousek P. Decomposition of in vivo spatially offset Raman spectroscopy data using multivariate analysis techniques. J. Raman Spectrosc. 2014 Feb;45(2):188–192. [Google Scholar]
- 69.Hanlon E, Manoharan R, Koo T, Shafer K, Motz J, Fitzmaurice M, Kramer J, Itzkan I, Dasari R, Feld M. Prospects for in vivo Raman spectroscopy. Phys. Med. Biol. 2000;45(2):R1–R59. doi: 10.1088/0031-9155/45/2/201. [DOI] [PubMed] [Google Scholar]
- 70.Geith T, Amarie S, Milz S, Bamberg F, Keilmann F. Visualisation of methacrylate-embedded human bone sections by infrared nanoscopy. J. Biophotonics. 2014 Jun;7(6):418–424. doi: 10.1002/jbio.201200172. [DOI] [PubMed] [Google Scholar]
- 71.Boyde A. Improved digital SEM of cancellous bone: scanning direction of detection, through focus for in-focus and sample orientation. J. Anat. 2003 Feb;202(2):183–194. doi: 10.1046/j.1469-7580.2003.00146.x. [DOI] [PMC free article] [PubMed] [Google Scholar]
- 72.Boyde A, Jones SJ. Scanning electron microscopy of bone: Instrument, specimen, and issues. Microsc. Res. Tech. 1996;33(2):92–120. doi: 10.1002/(SICI)1097-0029(19960201)33:2<92::AID-JEMT2>3.0.CO;2-0. [DOI] [PubMed] [Google Scholar]
- 73.Braidotti P, Branca FP, Stagni L. Scanning electron microscopy of human cortical bone failure surfaces. J. Biomech. 1997;30(2):155–162. doi: 10.1016/s0021-9290(96)00102-9. [DOI] [PubMed] [Google Scholar]
- 74.Perdikouri C, Tagil M, Isaksson H. Characterizing the composition of bone formed during fracture healing using scanning electron microscopy techniques. Calcif. Tissue Int. 2015;96(1):11–17. doi: 10.1007/s00223-014-9930-z. [DOI] [PubMed] [Google Scholar]
- 75.Boyde A, Maconnachie E, Reid SA, Delling G, Mundy GR. Scanning electron microscopy in bone pathology: review of methods, potential and applications. Scan. Electron Microsc. 1986 Jan;(Pt 4):1537–1554. [PubMed] [Google Scholar]
- 76.Roschger P, Fratzl P, Eschberger J, Klaushofer K. Validation of quantitative backscattered electron imaging for the measurement of mineral density distribution in human bone biopsies. Bone. 1998;23(4):319–326. doi: 10.1016/s8756-3282(98)00112-4. [DOI] [PubMed] [Google Scholar]
- 77.Sutton-Smith P, Beard H, Fazzalari N. Quantitative backscattered electron imaging of bone in proximal femur fragility fracture and medical illness. J. Microsc. 2008;229(1):60–66. doi: 10.1111/j.1365-2818.2007.01867.x. [DOI] [PubMed] [Google Scholar]
- 78.Blouin S, Puchegger S, Roschger A, Berzlanovich A, Fratzl P, Klaushofer K, Roschger P. Mapping Dynamical Mechanical Properties of Osteonal Bone by Scanning Acoustic Microscopy in Time-of-Flight Mode. Microsc. Microanal. 2014:1–13. doi: 10.1017/S1431927614000646. [DOI] [PubMed] [Google Scholar]
- 79.Eyre DR, Dickson IR, Van Ness K. Collagen cross-linking in human bone and articular cartilage. Age-related changes in the content of mature hydroxypyridinium residues. Biochem. J. 1988;252(2):495–500. doi: 10.1042/bj2520495. [DOI] [PMC free article] [PubMed] [Google Scholar]
- 80.Knott L, Bailey AJ. Collagen cross-links in mineralizing tissues: A review of their chemistry, function, and clinical relevance. Bone. 1998 doi: 10.1016/s8756-3282(97)00279-2. [DOI] [PubMed] [Google Scholar]
- 81.Uebelhart D, Gineyts E, Chapuy MC, Delmas PD. Urinary excretion of pyridinium crosslinks: a new marker of bone resorption in metabolic bone disease. Bone Miner. 1990 Jan;8(1):87–96. doi: 10.1016/0169-6009(91)90143-n. [DOI] [PubMed] [Google Scholar]
- 82.Saito M, Marumo K. Collagen cross-links as a determinant of bone quality: a possible explanation for bone fragility in aging, osteoporosis, and diabetes mellitus. Osteoporos. Int. 2010 Feb;21(2):195–214. doi: 10.1007/s00198-009-1066-z. [DOI] [PubMed] [Google Scholar]
- 83.Odetti P, Rossi S, Monacelli F, Poggi A, Cirnigliaro M, Federici M, Federici A. Advanced glycation end products and bone loss during aging. Ann. N. Y. Acad. Sci. 2005 Jun;1043:710–717. doi: 10.1196/annals.1333.082. [DOI] [PubMed] [Google Scholar]
- 84.Iafisco M, Foltran I, Sabbatini S, Tosi G, Roveri N. Electrospun nanostructured fibers of collagen-biomimetic apatite on titanium alloy. Bioinorg. Chem. Appl. 2012 Jan;2012:123953. doi: 10.1155/2012/123953. [DOI] [PMC free article] [PubMed] [Google Scholar]
- 85.Hernandez CJ, Keaveny TM. A biomechanical perspective on bone quality. Bone. 2006 doi: 10.1016/j.bone.2006.06.001. [DOI] [PMC free article] [PubMed] [Google Scholar]
- 86.Carter DR, Hayes WC, Schurman DJ. Fatigue life of compact bone—II. Effects of microstructure and density. J. Biomech. 1976 Jan;9(4):211–218. doi: 10.1016/0021-9290(76)90006-3. [DOI] [PubMed] [Google Scholar]
- 87.Carter DR, Hayes WC. Compact bone fatigue damage—I. Residual strength and stiffness. J. Biomech. 1977 Jan;10(5–6):325–337. doi: 10.1016/0021-9290(77)90005-7. [DOI] [PubMed] [Google Scholar]
- 88.Ritchie RO, Koester KJ, Ionova S, Yao W, Lane NE, Ager JW. Measurement of the toughness of bone: A tutorial with special reference to small animal studies. Bone. 2008 doi: 10.1016/j.bone.2008.04.027. [DOI] [PMC free article] [PubMed] [Google Scholar]
- 89.Bonfield W. Advances in the fracture mechanics of cortical bone. J. Biomech. 1987 doi: 10.1016/0021-9290(87)90025-x. [DOI] [PubMed] [Google Scholar]
- 90.Ural A, Vashishth D. Hierarchical perspective of bone toughness – from molecules to fracture [Google Scholar]
- 91.Turner CH, Burr DB. Basic biomechanical measurements of bone: A tutorial. Bone. 1993;14(4):595–608. doi: 10.1016/8756-3282(93)90081-k. [DOI] [PubMed] [Google Scholar]
- 92.Nyman JS, Roy A, Shen X, Acuna RL, Tyler JH, Wang X. The influence of water removal on the strength and toughness of cortical bone. J. Biomech. 2006;39(5):931–938. doi: 10.1016/j.jbiomech.2005.01.012. [DOI] [PMC free article] [PubMed] [Google Scholar]
- 93.Currey JD. The structure and mechanics of bone. J. Mater. Sci. 2012;47(1):41–54. [Google Scholar]
- 94.Van der Meulen MCH, Jepsen KJ, Miki B. Understanding bone strength: Size isn’t everything. Bone. 2001;29(2):101–104. doi: 10.1016/s8756-3282(01)00491-4. [DOI] [PubMed] [Google Scholar]
- 95.Müller R, Hannan M, Smith SY, Bauss F. Intermittent ibandronate preserves bone quality and bone strength in the lumbar spine after 16 months of treatment in the ovariectomized cynomolgus monkey. J. Bone Miner. Res. 2004 Nov;19(11):1787–1796. doi: 10.1359/JBMR.040809. [DOI] [PubMed] [Google Scholar]
- 96.Saito M, Fujii K, Mori Y, Marumo K. Role of collagen enzymatic and glycation induced cross-links as a determinant of bone quality in spontaneously diabetic WBN/Kob rats. Osteoporos. Int. 2006 doi: 10.1007/s00198-006-0155-5. [DOI] [PubMed] [Google Scholar]
- 97.Currey JD. The Effect of Porosity and Mineal Content on the Young’s Modulus of Elasticity of Compact Bone. J. Biomechics. 1988;21(2):131–139. doi: 10.1016/0021-9290(88)90006-1. [DOI] [PubMed] [Google Scholar]
- 98.Seeman E. Bone quality: The material and structural basis of bone strength. J. Bone Miner. Metab. 2008;26(1):1–8. doi: 10.1007/s00774-007-0793-5. [DOI] [PubMed] [Google Scholar]
- 99.Goldstein SA. The mechanical properties of trabecular bone: Dependence on anatomic location and function. J. Biomech. 1987;20(11–12):1055–1061. doi: 10.1016/0021-9290(87)90023-6. [DOI] [PubMed] [Google Scholar]
- 100.Reilly DT, Burstein AH. The elastic and ultimate properties of compact bone tissue. J. Biomech. 1975;8(6) doi: 10.1016/0021-9290(75)90075-5. [DOI] [PubMed] [Google Scholar]
- 101.Tang SY, Allen MR, Phipps R, Burr DB, Vashishth D. Changes in non-enzymatic glycation and its association with altered mechanical properties following 1-year treatment with risedronate or alendronate. Osteoporos. Int. 2009 Jun;20(6):887–894. doi: 10.1007/s00198-008-0754-4. [DOI] [PMC free article] [PubMed] [Google Scholar]
- 102.Zimmermann EA, Schaible E, Bale H, Barth HD, Tang SY, Reichert P, Busse B, Alliston T, Ager JW, Ritchie RO. Age-related changes in the plasticity and toughness of human cortical bone at multiple length scales. Proc. Natl. Acad. Sci. U. S. A. 2011;108(35):14416–14421. doi: 10.1073/pnas.1107966108. [DOI] [PMC free article] [PubMed] [Google Scholar]
- 103.Zioupos P, Currey J. Changes in the Stiffness, Strength, and Toughness of Human Cortical Bone With Age. Bone. 1998;22(1):57–66. doi: 10.1016/s8756-3282(97)00228-7. [DOI] [PubMed] [Google Scholar]
- 104.Fazzalari NL, Forwood MR, Smith K, Manthey BA, Herreen P. Assessment of Cancellous Bone Quality in Severe Osteoarthrosis: Bone Mineral Density, Mechanics, and Microdamage. Bone. 1998 Apr;22(4):381–388. doi: 10.1016/s8756-3282(97)00298-6. [DOI] [PubMed] [Google Scholar]
- 105.Hernandez CJ, Tang SY, Baumbach BM, Hwu B, Sakkee AN, van der Ham F, DeGroot J, Banks RA, Keaveny TM. Trabecular microfracture and the influence of pyridinium and non- enzymatic glycation mediated collagen cross-links. 2005;37(6):825–832. doi: 10.1016/j.bone.2005.07.019. [DOI] [PMC free article] [PubMed] [Google Scholar]
- 106.Silva MJ, Brodt MD, Fan Z, Rho J-Y. Nanoindentation and whole-bone bending estimates of material properties in bones from the senescence accelerated mouse SAMP6. J. Biomech. 2004;37:1639–1646. doi: 10.1016/j.jbiomech.2004.02.018. [DOI] [PubMed] [Google Scholar]
- 107.Zysset PK. Indentation of bone tissue: A short review. Osteoporos. Int. 2009;20(6):1049–1055. doi: 10.1007/s00198-009-0854-9. [DOI] [PubMed] [Google Scholar]
- 108.Hoffler CE. An Application of Nanoindentation Technique to Measure Bone Tissue Lamellae Properties. J. Biomech. Eng. 2005;127(7):1046. doi: 10.1115/1.2073671. [DOI] [PubMed] [Google Scholar]
- 109.Weaver JK. The Microscopic Hardness of Bone. J. Bone Jt. Surg. 1966;48(2):273–288. [PubMed] [Google Scholar]
- 110.Ziv V, Wagner HD, Weiner S. Microstructure-microhardness relations in parallel-fibered and lamellar bone. Bone. 1996;18(5):417–428. doi: 10.1016/8756-3282(96)00049-x. [DOI] [PubMed] [Google Scholar]
- 111.Dall’Ara E, Schmidt R, Zysset P. Microindentation can discriminate between damaged and intact human bone tissue. Bone. 2012;50(4):925–929. doi: 10.1016/j.bone.2012.01.002. [DOI] [PubMed] [Google Scholar]
- 112.Bridges D, Randall C, Hansma PK. A new device for performing reference point indentation without a reference probe. Rev. Sci. Instrum. 2012 Apr;83(4):044301. doi: 10.1063/1.3693085. [DOI] [PMC free article] [PubMed] [Google Scholar]
- 113.Hansma P, Turner P, Drake B, Yurtsev E, Proctor A, Mathews P, Lulejian J, Lelujian J, Randall C, Adams J, Jungmann R, Garza-de-Leon F, Fantner G, Mkrtchyan H, Pontin M, Weaver A, Brown MB, Sahar N, Rossello R, Kohn D. The bone diagnostic instrument II: indentation distance increase. Rev. Sci. Instrum. 2008 Jun;79(6):064303. doi: 10.1063/1.2937199. [DOI] [PMC free article] [PubMed] [Google Scholar]
- 114.Allen MR, McNerny EM, Organ JM, Wallace JM. Response to Comments on ‘True Gold or Pyrite: A Review of Reference Point Indentation for Assessing Bone Mechanical Properties In Vivo’. J. Bone Miner. Res. 2015 Dec;30(12):2327. doi: 10.1002/jbmr.2699. [DOI] [PubMed] [Google Scholar]
- 115.Allen MR, McNerny EM, Organ JM, Wallace JM. True Gold or Pyrite: A Review of Reference Point Indentation for Assessing Bone Mechanical Properties In Vivo. J. Bone Miner. Res. 2015 Sep;30(9):1539–1550. doi: 10.1002/jbmr.2603. [DOI] [PMC free article] [PubMed] [Google Scholar]
- 116.Farr JN, Amin S, Khosla S. Regarding ‘True Gold or Pyrite: A Review of Reference Point Indentation for Assessing Bone Mechanical Properties In Vivo’. J. Bone Miner. Res. 2015 Dec;30(12):2325–2326. doi: 10.1002/jbmr.2700. [DOI] [PMC free article] [PubMed] [Google Scholar]
- 117.Jepsen KJ, Schlecht SH. Biomechanical mechanisms: resolving the apparent conundrum of why individuals with type II diabetes show increased fracture incidence despite having normal BMD. J. Bone Miner. Res. 2014 Apr;29(4):784–786. doi: 10.1002/jbmr.2189. [DOI] [PMC free article] [PubMed] [Google Scholar]
- 118.Karim L, Van Vliet M, Bouxsein ML. Comparison of cyclic and impact-based reference point indentation measurements in human cadaveric tibia. Bone. 2015 Apr; doi: 10.1016/j.bone.2015.03.021. [DOI] [PMC free article] [PubMed] [Google Scholar]
- 119.Farr JN, Drake MT, Amin S, Melton LJ, McCready LK, Khosla S. In vivo assessment of bone quality in postmenopausal women with type 2 diabetes. J. Bone Miner. Res. 2014 Apr;29(4):787–795. doi: 10.1002/jbmr.2106. [DOI] [PMC free article] [PubMed] [Google Scholar]
- 120.Mellibovsky L, Prieto-Alhambra D, Mellibovsky F, Güerri-Fernández R, Nogués X, Randall C, Hansma K, Díez-Perez A. Bone Tissue Properties Measurement by Reference Point Indentation in Glucocorticoid-Induced Osteoporosis. J. Bone Miner. Res. 2015 Sep;30(9):1651–1656. doi: 10.1002/jbmr.2497. [DOI] [PubMed] [Google Scholar]
- 121.Güerri-Fernández RC, Nogués X, Quesada Gõmez JM, Torres Del Pliego E, Puig L, García-Giralt N, Yoskovitz G, Mellibovsky L, Hansma K, Díez-Pérez A, Quesada Gómez JM, Torres Del Pliego E, Puig L, García-Giralt N, Yoskovitz G, Mellibovsky L, Hansma K, Díez-Pérez A. Microindentation for in vivo measurement of bone tissue material properties in atypical femoral fracture patients and controls. J. Bone Miner. Res. 2013 Jan;28(1):162–168. doi: 10.1002/jbmr.1731. [DOI] [PubMed] [Google Scholar]
- 122.Oliver WC, Pharr GM. An improved technique for determining hardness and elastic modulus using load and displacement sensing indentation experiments. J. Mater. Res. 1992;7(6):1564–1583. [Google Scholar]
- 123.Zysset PK, Edward Guo X, Edward Hoffler C, Moore KE, Goldstein SA. Elastic modulus and hardness of cortical and trabecular bone lamellae measured by nanoindentation in the human femur. J. Biomech. 1999;32(10):1005–1012. doi: 10.1016/s0021-9290(99)00111-6. [DOI] [PubMed] [Google Scholar]
- 124.Hengsberger S, Kulk A, Zysset P. A Combined Atomic Force Microscopy and Nonoindentation Technique to Investigate the Elastic Properties of Bine Structural Units. Eur. Cells Mater. 2001;1(C):12–17. doi: 10.22203/ecm.v001a02. [DOI] [PubMed] [Google Scholar]
- 125.Constantinides G, Ravi Chandran KS, Ulm FJ, Van Vliet KJ. Grid indentation analysis of composite microstructure and mechanics: Principles and validation. Mater. Sci. Eng. A. 2006;430(1–2):189–202. [Google Scholar]
- 126.Uskokovic PS, Tang CY, Tsui CP, Ignjatovic N, Uskokovic DP. Micromechanical properties of a hydroxyapatite/poly-l-lactide biocomposite using nanoindentation and modulus mapping. J. Eur. Ceram. Soc. 2007 Jan;27(2–3):1559–1564. [Google Scholar]
- 127.Donnelly E, Williams RM, Downs Sa, Dickinson ME, Baker SP, van der Meulen MCH. Quasistatic and dynamic nanomechanical properties of cancellous bone tissue relate to collagen content and organization. J. Mater. Res. 2006;21(08):2106–2117. [Google Scholar]
- 128.Turner CH, Rho J, Takano Y, Tsui TY, Pharr GM. The elastic properties of trabecular and cortical bone tissues are similar: Results from two microscopic measurement techniques. J. Biomech. 1999;32(4):437–441. doi: 10.1016/s0021-9290(98)00177-8. [DOI] [PubMed] [Google Scholar]
- 129.Hengsberger S, Enstroem J, Peyrin F, Zysset P. How is the indentation modulus of bone tissue related to its macroscopic elastic response? A validation study. J. Biomech. 2003 Oct;36(10):1503–1509. doi: 10.1016/s0021-9290(03)00131-3. [DOI] [PubMed] [Google Scholar]
- 130.Tai K, Dao M, Suresh S, Palazoglu A, Ortiz C. Nanoscale heterogeneity promotes energy dissipation in bone. Nat. Mater. 2007;6(6):454–462. doi: 10.1038/nmat1911. [DOI] [PubMed] [Google Scholar]
- 131.Donnelly E, Baker SP, Boskey AL, van der Meulen MCH. Effects of surface roughness and maximum load on the mechanical properties of cancellous bone measured by nanoindentation. J. Biomed. Mater. Res. A. 2006 May;77(2):426–435. doi: 10.1002/jbm.a.30633. [DOI] [PMC free article] [PubMed] [Google Scholar]
- 132.Marshall D, Johnell O, Wedel H. Meta-analysis of how well measures of bone mineral density predict occurrence of osteoporotic fractures. BMJ. 1996 May;312(7041):1254–1259. doi: 10.1136/bmj.312.7041.1254. [DOI] [PMC free article] [PubMed] [Google Scholar]
- 133.Crawford RP, Cann CE, Keaveny TM. Finite element models predict in vitro vertebral body compressive strength better than quantitative computed tomography. doi: 10.1016/s8756-3282(03)00210-2. [DOI] [PubMed] [Google Scholar]
- 134.Keaveny TM, Hoffmann F, Singh M, Palermo L, Bilezikian JP, Greenspan SL, Black DM. Femoral bone strength and its relation to cortical and trabecular changes after treatment with PTH, alendronate, and their combination as assessed by finite element analysis of quantitative CT scans. J. Bone Miner. Res. 2008 Dec;23(12):1974–1982. doi: 10.1359/JBMR.080805. [DOI] [PMC free article] [PubMed] [Google Scholar]
- 135.Liu XS, Stein EM, Zhou B, Zhang CA, Nickolas TL, Cohen A, Thomas V, McMahon DJ, Cosman F, Nieves J, Shane E, Guo XE. Individual trabecula segmentation (ITS)-based morphological analyses and microfinite element analysis of HR-pQCT images discriminate postmenopausal fragility fractures independent of DXA measurements. J. Bone Miner. Res. 2012 Feb;27(2):263–272. doi: 10.1002/jbmr.562. [DOI] [PMC free article] [PubMed] [Google Scholar]
- 136.Milovanovic P, Zimmermann EA, Riedel C, vom Scheidt A, Herzog L, Krause M, Djonic D, Djuric M, Püschel K, Amling M, Ritchie RO, Busse B. Multi-level characterization of human femoral cortices and their underlying osteocyte network reveal trends in quality of young, aged, osteoporotic and antiresorptive-treated bone. Biomaterials. 2015;45):46–55. doi: 10.1016/j.biomaterials.2014.12.024. [DOI] [PubMed] [Google Scholar]
- 137.Boskey AL. Bone composition: relationship to bone fragility and antiosteoporotic drug effects. Bonekey Rep. 2013 Dec;2 doi: 10.1038/bonekey.2013.181. [DOI] [PMC free article] [PubMed] [Google Scholar]
- 138.Wallace JM, Chen Q, Fang M, Erickson B, Orr BG, Banaszak Holl MM. Type I Collagen Exists as a Distribution of Nanoscale Morphologies in Teeth, Bones, and Tendons. Langmuir. 2010 May;26(10):7349–7354. doi: 10.1021/la100006a. [DOI] [PMC free article] [PubMed] [Google Scholar]