

ABSTRACT
Clustered regularly interspaced short palindromic repeats and CRISPR-associated protein (CRISPR-Cas) systems store the memory of past encounters with foreign DNA in unique spacers that are inserted between direct repeats in CRISPR arrays. For only a small fraction of the spacers, homologous sequences, called protospacers, are detectable in viral, plasmid, and microbial genomes. The rest of the spacers remain the CRISPR “dark matter.” We performed a comprehensive analysis of the spacers from all CRISPR-cas loci identified in bacterial and archaeal genomes, and we found that, depending on the CRISPR-Cas subtype and the prokaryotic phylum, protospacers were detectable for 1% to about 19% of the spacers (~7% global average). Among the detected protospacers, the majority, typically 80 to 90%, originated from viral genomes, including proviruses, and among the rest, the most common source was genes that are integrated into microbial chromosomes but are involved in plasmid conjugation or replication. Thus, almost all spacers with identifiable protospacers target mobile genetic elements (MGE). The GC content, as well as dinucleotide and tetranucleotide compositions, of microbial genomes, their spacer complements, and the cognate viral genomes showed a nearly perfect correlation and were almost identical. Given the near absence of self-targeting spacers, these findings are most compatible with the possibility that the spacers, including the dark matter, are derived almost completely from the species-specific microbial mobilomes.
KEYWORDS: CRISPR-Cas, bacteriophages, mobilome, oligonucleotide composition, spacer acquisition
IMPORTANCE
The principal function of CRISPR-Cas systems is thought to be protection of bacteria and archaea against viruses and other parasitic genetic elements. The CRISPR defense function is mediated by sequences from parasitic elements, known as spacers, that are inserted into CRISPR arrays and then transcribed and employed as guides to identify and inactivate the cognate parasitic genomes. However, only a small fraction of the CRISPR spacers match any sequences in the current databases, and of these, only a minority correspond to known parasitic elements. We show that nearly all spacers with matches originate from viral or plasmid genomes that are either free or have been integrated into the host genome. We further demonstrate that spacers with no matches have the same properties as those of identifiable origins, strongly suggesting that all spacers originate from mobile elements.
INTRODUCTION
CRISPR-Cas (clustered regularly interspaced palindromic repeats and CRISPR-associated proteins) systems are adaptive (acquired) immune systems of archaea and bacteria that store memory of past encounters with foreign DNA in unique spacer sequences that are excised from viral and plasmid genomes by the Cas adaptation machinery or, alternatively, reverse transcribed from foreign RNA and inserted into CRISPR arrays (1–4). Driven by the overwhelming success of the Cas9 and later Cas12a (Cpf1) endonucleases as two of the new generation of genome editing, regulation, and interrogation tools (5–9), comparative genomics, structures, biochemical activities, and biological functions of CRISPR-Cas systems have been recently explored in unprecedented detail (1, 2, 10, 11).
The CRISPR defense response involves three distinct stages. In the first stage, adaptation of a complex of Cas1, Cas2, and in some cases additional Cas proteins mediates excision of fragments from the target DNA (these fragments are known as protospacers), followed by their insertion into the CRISPR array, typically at the leader end of the array (3, 12). In the second stage, the CRISPR array is transcribed, and the primary transcript, the pre-CRISPR RNA, is processed into mature CRISPR RNAs (crRNAs) either by a distinct complex of Cas proteins (in type I and type III class 1 CRISPR-Cas systems), by the effector protein (in type VA and type VI systems of class 2), or by the bacterial RNase III with aid from the trans-acting CRISPR (tracr) RNA (in type II and type V-B systems of class 2) (13–18). The mature crRNA consists of a unique spacer of 25 to 65 bp in length (depending on the CRISPR-Cas type and subtype) flanked by portions of the adjacent repeats. In the third and final stage, interference, the effector Cas protein complex mediates recognition of the target DNA or RNA via base-pairing between the spacer and cognate protospacer, followed by cleavage of the target by Cas nucleases (19–24).
The requirements for the extent of complementarity between the spacers in the crRNA and the recognized sequences in the target differ substantially between types and subtypes of CRISPR-Cas systems (25–28). The initial experiments with type II systems indicated that a perfect match was required (29). However, numerous subsequent studies have shown that, in most CRISPR-Cas systems, target recognition and cleavage allow several mismatches between the crRNA spacer and the target (25–28). For several CRISPR-cas variants that have been studied in detail, perfect complementarity was required within the seed sequence of 6 to 12 nucleotides, whereas several mismatches could be tolerated in the rest of the spacer (28, 30).
In addition to their central role in interference, crRNAs contribute also to the adaptation stage through the mechanism known as priming (31–33). During priming, a crRNA complexed with CRISPR effector proteins base-pairs with partially complementary sequences in the target DNA and stimulates (primes) acquisition of new spacers without causing cleavage of the target. The complementarity requirements for priming are relaxed compared to those for interference (32). From the evolutionary standpoint, both the requirement for only partial guide-target complementarity for interference and the priming mechanism, with even less stringent requirements, can be construed as strategies to prevent parasite escape from CRISPR surveillance. However, the likely cost of such adaptive strategies involves an increased rate of autoimmune reactions due to accidental recognition of self sequences. Thus, evolution of CRISPR specificity appears to involve an inherent trade-off between broad-range defense and autoimmunity.
The efficiency and mechanisms of self versus nonself discrimination at the adaptation stage appear to differ between CRISPR-Cas types and subtypes. Some level of discrimination is achieved by both type I and type III systems through recognition of actively replicating and transcribed DNA and in the case of type III systems via direct cleavage of transcripts by dedicated nucleases, which is a prerequisite for the cleavage of the cognate DNA (34–38). However, for type II systems, it has been shown that when the effector nuclease Cas9 is inactivated, preventing target cleavage, the great majority of the incorporated spacers originate from the host DNA (39). Moreover, self-derived spacers have been detected also in some microbial genomes (40–42). Thus, the specificity of the spacers toward foreign genomes could be caused primarily by selection against cells with incorporated self-targeting spacers, and the efficacy of such selection is likely to differ among microbes.
Apart from the mechanisms of self versus nonself discrimination, perhaps an even bigger question in the CRISPR field is the origin of the bulk of the spacers. For a small fraction of the spacers, protospacers have been reported, often in viral and plasmid genomes, but the substantial majority of the spacers remain without a match, representing vast CRISPR “dark matter” (43–49).
Here, we report a comprehensive census of the spacers from CRISPR-cas loci in the available bacterial and archaeal genomes; our census revealed a heavy dominance of spacers derived from mobile genetic elements (MGE) among the spacer subset with detectable matches. We then compared the features of the dark matter spacer sequences with those of the spacers with matches as well as host and virus genomes. The results of these analyses suggested that (nearly) all spacers in the CRISPR arrays from sequenced bacterial and archaeal genomes originated from the pool of MGE (mobilome) associated with the genome, in which the given CRISPR-cas locus resides, and its close relatives.
RESULTS
Comprehensive census of CRISPR spacers from bacterial and archaeal genomes.
In order to explore the origins of CRISPR spacers, a computational pipeline was developed that identified all CRISPR arrays from complete and partial bacterial and archaeal genomes. The distribution of CRISPR arrays associated with different CRISPR-Cas types and subtypes across the prokaryotic phyla (see Table S1 and Fig. S1 in the supplemental material) closely reproduces the previous observations and confirms the main observed trends (50, 51). These trends include the nearly universal presence of CRISPR-cas in both bacterial and archaeal thermophiles, as opposed to the patchy distribution in mesophiles; the almost exclusive presence of class 2 in bacteria but not in archaea; the overall dominance of type I, in particular subtypes I-B, I-C, and I-E; and the rarity of the recently discovered types IV, V, and VI. The orphan CRISPR arrays (those not associated with cas genes) that in this work were detected using a conservative approach (only those that consisted of repeats similar to repeats in arrays from complete CRISPR-Cas loci were included) comprised about 25% in the analyzed complete microbial genomes. The causes of the nonuniform distribution of the CRISPR-Cas systems in the microbial world remain enigmatic and present a major challenge of uncovering the underlying biological factors, which are most likely a combination of features of the different CRISPR-Cas variants and aspects of the lifestyles of the respective microbes. The pipeline was then used to extract the spacers from the detected CRISPR arrays and employ them as queries to search the viral and prokaryotic subsets of the Nonredundant Nucleotide Database at NCBI (NIH, Bethesda, MD) for protospacers under stringent criteria for homology detection (Fig. 1) (see Materials and Methods for details). The use of such restrictive criteria is necessitated by the short lengths of the spacers, which mean that hits with even a small fraction of mismatches are likely obtained by chance.
FIG 1 .

Computational pipeline for identification and analysis of CRISPR spacers.
Distribution of CRISPR arrays in complete genomes. Download FIG S1, PDF file, 0.3 MB (312.9KB, pdf) .
This is a work of the U.S. Government and is not subject to copyright protection in the United States. Foreign copyrights may apply.
Completely assembled genomes with CRISPR arrays. Download TABLE S1, PDF file, 0.2 MB (179.6KB, pdf) .
This is a work of the U.S. Government and is not subject to copyright protection in the United States. Foreign copyrights may apply.
These searches yielded 2,981 spacer matches (protospacers) in viral sequences and 23,385 matches in prokaryotic sequences (Fig. 1). We then examined the provenance of the detected protospacers across the diversity of the CRISPR-Cas systems and the prokaryotic phyla. In general agreement with findings of previous analyses that were performed on much smaller genomic data sets, protospacers were identified for ~7% of the spacers, with the fractions for different CRISPR-Cas subtypes ranging from 1 to 19% (Table 1). The fraction of detected protospacers was typically higher for type I and type II CRISPR-Cas systems, in which this fraction spans the entire range, compared to type III, where this fraction was uniformly low, at 1 to 2% (Table 1).
TABLE 1 .
Distribution of spacers with matches among CRISPR-Cas subtypes
| CRISPR-Cas type or subtypea | Total no. of spacers | No. of spacers with hits | % of spacers with hits | Spacers with matches in sequences fromb: |
||
|---|---|---|---|---|---|---|
| Viral | Intergenic | ORFs | ||||
| CAS-I | 5,670 | 513 | 0.09 | 0.79 | 0.08 | 0.13 |
| CAS-I-A | 6,942 | 102 | 0.01 | 0.77 | 0.04 | 0.19 |
| CAS-I-B | 54,781 | 2,682 | 0.05 | 0.88 | 0.03 | 0.10 |
| CAS-I-C | 38,571 | 2,376 | 0.06 | 0.84 | 0.02 | 0.13 |
| CAS-I-D | 9,096 | 65 | 0.01 | 0.71 | 0.14 | 0.15 |
| CAS-I-E | 59,783 | 4,475 | 0.07 | 0.84 | 0.03 | 0.13 |
| CAS-I-F | 28,131 | 4,868 | 0.17 | 0.92 | 0.02 | 0.06 |
| CAS-I-U | 7,494 | 312 | 0.04 | 0.79 | 0.04 | 0.17 |
| CAS-II-A | 13,967 | 2,679 | 0.19 | 0.90 | 0.01 | 0.09 |
| CAS-II-B | 461 | 9 | 0.02 | 0.44 | 0.33 | 0.22 |
| CAS-II-C | 13,022 | 1,060 | 0.08 | 0.71 | 0.05 | 0.24 |
| CAS-III | 4,662 | 72 | 0.02 | 0.78 | 0.01 | 0.21 |
| CAS-III-A | 9,249 | 179 | 0.02 | 0.74 | 0.06 | 0.20 |
| CAS-III-B | 12,241 | 260 | 0.02 | 0.86 | 0.05 | 0.10 |
| CAS-III-C | 1,917 | 42 | 0.02 | 0.88 | 0.02 | 0.10 |
| CAS-III-D | 8,345 | 120 | 0.01 | 0.78 | 0.03 | 0.19 |
| CAS-IV-A | 1,582 | 147 | 0.09 | 0.72 | 0.03 | 0.24 |
| CAS-V-A | 592 | 5 | 0.01 | 1.00 | 0.00 | 0.00 |
| CAS-V-B | 168 | 8 | 0.05 | 0.88 | 0.00 | 0.13 |
| CAS-VI-A | 179 | 8 | 0.04 | 0.50 | 0.13 | 0.38 |
| CAS-VI-B | 682 | 50 | 0.07 | 0.72 | 0.06 | 0.22 |
| CAS-VI-C | 34 | 2 | 0.06 | 0.50 | 0.00 | 0.50 |
| CAS-V-U | 320 | 3 | 0.01 | 0.67 | 0.00 | 0.33 |
| Unidentified | 85,462 | 6,327 | 0.07 | 0.84 | 0.05 | 0.11 |
| Total | 363,351 | 26,364 | 0.07 | |||
Identification and classification of the CRISPR-Cas systems were as previously described (50, 51). CAS-I and CAS-III denote loci that could be assigned to types I and III, respectively, but not to a specific subtype. The unidentified are orphan CRISPR arrays and incomplete CRISPR-cas loci.
The percentage of the total number of spacers with matches.
A similar range was detected for the fraction of spacers with matches across the bacterial and archaeal phyla (Table 2), but substantial deviations from the global average of ~7% in several phyla were notable. Thus, anomalously high fractions of spacers with matches were detected in Spirochaetia, Fusobacteria, and Gammaproteobacteria. In sharp contrast, the CRISPR arrays in archaea, especially hyperthermophiles, were poor in matches, with none at all detected in Thermococci or Thermoplasmata; furthermore, the only phylum of hyperthermophilic bacteria for which a large number of CRISPR arrays were identified also had only 1% matching spacers (Table 2). A multiple regression analysis showed that both the assignment to a CRISPR subtype and classification into an archaeal or bacterial phylum make substantial and largely independent contributions to the variation of the fractions of spacers with detectable matches; jointly, the two factors explain about 75% of the variance of this fraction (see Text S1 for details). The paucity of spacer matches in hyperthermophiles is puzzling, because all these organisms possess CRISPR-cas loci (as opposed to only a minority among mesophiles) (50), with the implication that CRISPR activity is essential for the survival of these organisms. The lack of recognizable spacers could be due to undersampling of the respective viromes and/or to preferential utilization of partially matching spacers by the CRISPR-Cas systems of thermophiles. Generally, the aspects of the biology of different groups of prokaryotes that determine the activity of the CRISPR-Cas systems, and hence the fraction of spacers with matches, remain to be identified and explored.
TABLE 2 .
Distribution of spacers with matches among bacterial and archaeal phyla
| Phylum or group and species | Total no. of spacersa | No. of spacers with matchesa | % of spacers with matches | Spacers with matches inb: |
||
|---|---|---|---|---|---|---|
| Viral | Intergenic | ORFs | ||||
| Actinobacteria | 54,875 | 3,614 | 0.07 | 0.76 | 0.05 | 0.19 |
| Alphaproteobacteria | 8,135 | 120 | 0.01 | 0.69 | 0.07 | 0.24 |
| Bacteroidetes/Chlorobi | 18,611 | 840 | 0.05 | 0.78 | 0.03 | 0.19 |
| Betaproteobacteria | 14,013 | 908 | 0.06 | 0.69 | 0.14 | 0.16 |
| Chloroflexi | 6,523 | 30 | 0.00 | 0.77 | 0.03 | 0.20 |
| Crenarchaeota | 11,212 | 119 | 0.01 | 0.90 | 0.02 | 0.08 |
| Cyanobacteria/ Melainabacteria | 20,295 | 126 | 0.01 | 0.75 | 0.04 | 0.21 |
| Deinococcus-Thermus | 4,057 | 85 | 0.02 | 0.75 | 0.04 | 0.21 |
| Deltaproteobacteria or Epsilonproteobacteria | 13,588 | 378 | 0.03 | 0.60 | 0.06 | 0.34 |
| Firmicutes | 93,332 | 7,643 | 0.08 | 0.90 | 0.02 | 0.08 |
| Fusobacteria | 3,427 | 629 | 0.18 | 0.92 | 0.01 | 0.06 |
| Gammaproteobacteria | 67,202 | 10,238 | 0.15 | 0.91 | 0.03 | 0.06 |
| Halobacteria | 5,121 | 74 | 0.01 | 0.55 | 0.08 | 0.36 |
| Methanobacteria | 2,218 | 47 | 0.02 | 0.70 | 0.04 | 0.26 |
| Methanococci | 1,639 | 6 | 0.00 | 0.50 | 0.00 | 0.50 |
| Methanomicrobia | 10,399 | 141 | 0.01 | 0.91 | 0.02 | 0.06 |
| Nitrospira | 1,088 | 13 | 0.01 | 0.85 | 0.00 | 0.15 |
| Planctomycetes | 1,650 | 14 | 0.01 | 0.79 | 0.14 | 0.07 |
| Spirochaetia | 5,114 | 1,173 | 0.23 | 0.73 | 0.04 | 0.24 |
| Synergistia | 1,702 | 22 | 0.01 | 0.64 | 0.00 | 0.36 |
| Tenericutes | 1,050 | 26 | 0.02 | 0.73 | 0.04 | 0.23 |
| Thermococci | 3,210 | 16 | 0.00 | 0.31 | 0.00 | 0.69 |
| Thermoplasmata | 1,270 | 6 | 0.00 | 0.17 | 0.17 | 0.67 |
| Thermotogae | 3,731 | 31 | 0.01 | 0.94 | 0.00 | 0.06 |
| Unclassified bacteria | 2,814 | 6 | 0.00 | 0.67 | 0.00 | 0.33 |
| Total | 356,276 | 26,305 | 0.07 | |||
Only phyla with >1,000 unique spacers were included; hence, the data reflect slightly lower total numbers of spacers than data in Table 1.
The percentage of the total number of spacers with matches.
Distribution of spacer hits: contributions of microbial diversity and diversity of CRISPR-Cas systems. Download TEXT S1, PDF file, 0.2 MB (199.1KB, pdf) .
This is a work of the U.S. Government and is not subject to copyright protection in the United States. Foreign copyrights may apply.
The CRISPR-Cas spacers have been demonstrated to insert in a polarized fashion, mostly in the beginning of arrays, adjacent to the leader sequence (although in some case, internal insertion has been observed as well), resulting in growth of the array that, however, subsequently contracts via the loss of distal spacers (52, 53). Recently, the mechanistic basis for the polarized spacer integration of the spacers at the beginning of an array was described, whereby the integration host factor binds to the leader sequence, bending the DNA upstream of the array and guiding the Cas1-Cas2 complex to the first repeat (54, 55). Indeed, a notable excess of spacers with matches was observed near the ends of the arrays, with a sharp decline downstream (Fig. 2A and B). The CRISPR arrays can be transcribed in the same direction as the adjacent cas genes or in the opposite direction. Thus, identification of the transcription direction for CRISPR arrays requires additional analysis that can rely on the presence of a distinct, degenerate repeat at the promoter-distant end of the array (56). Our analysis of the directionality of the detected arrays based on the position of the degenerate repeat (i.e., a repeat with multiple mismatches to the consensus for the given array) confirmed the drop in the fraction of spacers with matches from the beginning to the end of arrays despite the decrease in the amount of data available for analysis due to the absence of a readily detectable degenerate repeat in many arrays (Fig. S2). These findings indicate that insertion of new spacers at the proximal end of arrays, adjacent to the leader, is a general trend in CRISPR-Cas systems.
FIG 2 .

Distribution of spacers with matches along the CRISPR arrays. (A) Probability density functions for the spacers with matches (real) and for the same spacers placed randomly onto the array 100 times (random). (B) Probability density function (pdf) of the difference between the number of spacers with matches and randomly placed spacers along the array. Given the difficulty of polarizing CRISPR arrays automatically and under the assumption that new spacers are incorporated at the leader end but not at the distal end of an array, the results are shown from either end (0) to the middle of the array (0.5).
Protospacer frequencies for relative CRISPR array positions. Download FIG S2, PDF file, 0.1 MB (70.2KB, pdf) .
This is a work of the U.S. Government and is not subject to copyright protection in the United States. Foreign copyrights may apply.
The great majority of spacers with matches originate from mobile genetic elements.
In most subtypes of CRISPR-Cas systems and in most bacterial and archaeal phyla, 70 to 90% of the spacers with matches (protospacers) originated from virus or provirus sequences (proviruses were consistently identified with two independent approaches [Fig. S3; see also Materials and Methods]) (Tables 1 and 2), in agreement with the common notion that CRISPR-Cas is primarily engaged in antivirus defense. Notably, subsets of virus-specific spacers are shared between different species and even genera of bacteria (e.g., Staphylococcus-Streptococcus and Escherichia-Cronobacter), yielding a host-virus network that includes several large connected components (Fig. 3; Data Set S1).
FIG 3 .
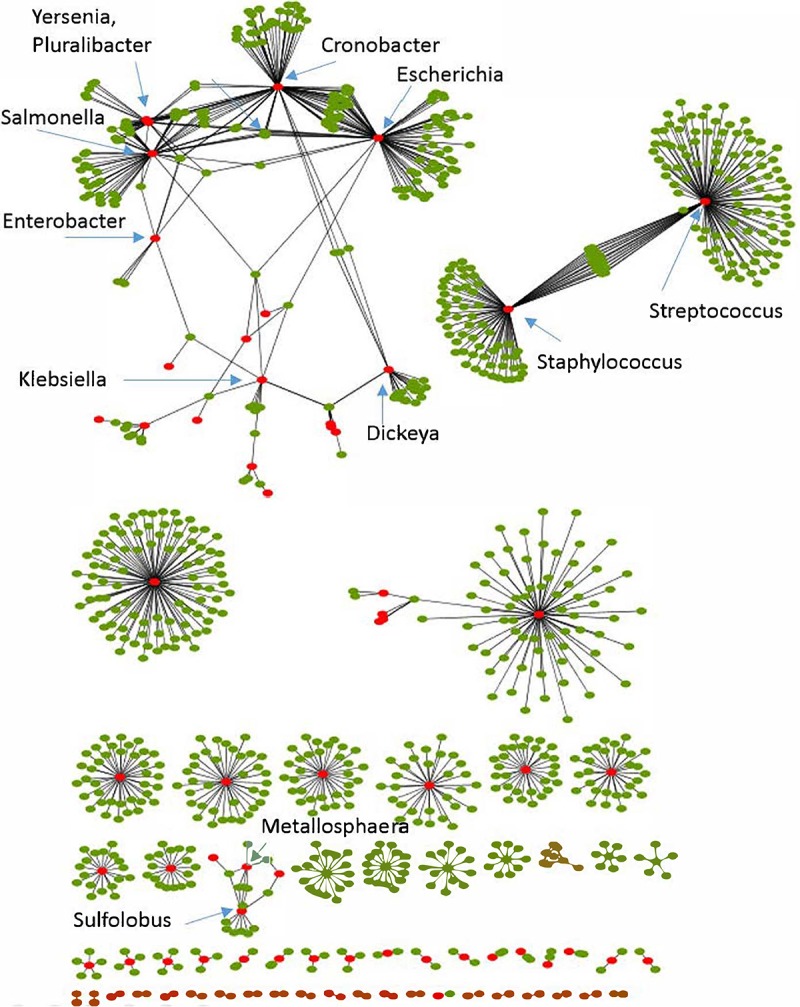
Virus-host bipartite network derived from spacer sharing. Red nodes, bacteria or archaea; green nodes, viruses; edges, shared spacer-protospacer pairs.
Identification of prophage regions by using different approaches. Download FIG S3, PDF file, 0.1 MB (145.8KB, pdf) .
This is a work of the U.S. Government and is not subject to copyright protection in the United States. Foreign copyrights may apply.
A host-virus network with several large connected components. Download DATA SET S1, TXT file, 2 MB (2.1MB, txt) .
This is a work of the U.S. Government and is not subject to copyright protection in the United States. Foreign copyrights may apply.
Analysis of the provenance of nonviral protospacers showed a clear preponderance of sequences from gene families implicated in conjugal transfer and replication of plasmids, such as type IV secretion systems (57) (Fig. 4; Data Set S2). Notably, several protospacers also originated from cas genes, particularly cas3 (Fig. 4; Table S2), recapitulating the recent finding of cas-matching protospacers in orphan CRISPR arrays (58). Of the remaining genes containing protospacers, many are unannotated, which is typically caused by low sequence conservation, and potentially could originate from viruses or plasmids as well. A small fraction of spacer matches mapped to genomic regions annotated as intergenic (Tables 1 and 2), but manual examination of such cases led to identification of putative protein-coding genes that apparently had been missed by the genome annotation (Text S2). Complete reannotation of the available prokaryotic genomes is a demanding project outside the scope of the present work but, with this caveat, only a small fraction of the detected protospacers could be traced to sequences demonstrably not originating from viruses or other mobile genetic elements. Previous analyses of CRISPR arrays from individual bacterial and archaeal genomes have found widely different fractions of self-matching spacers (1, 40–42). Our current, comprehensive analysis indicates that the overwhelming majority of the spacers that persist long enough to be detected are derived from viruses and other mobile elements (collectively known as the mobilome [59]), apparently indicating strong selection against self-targeting spacers. Clearly, the biological underpinning of such selection is the strong deleterious effect of self-targeting spacers that, when engaged by the CRISPR interference machinery, introduce double-strand breaks into the host genome which are likely to be lethal, especially if such a break occurs in an essential gene (60–62).
FIG 4 .

Breakdown of the protospacers from nonviral genes, by gene family. Colors indicate genes implicated in conjugal transfer of plasmids and plasmid replication, a putative phage gene (not annotated as such), and a cas3 gene. The protein family names are from the CDD database.
Examples of intergenic hits into unannotated ORFs. Download TEXT S2, PDF file, 0.1 MB (101.5KB, pdf) .
This is a work of the U.S. Government and is not subject to copyright protection in the United States. Foreign copyrights may apply.
Spacers in CRISPR arrays. Download TABLE S2, PDF file, 0.1 MB (145.3KB, pdf) .
This is a work of the U.S. Government and is not subject to copyright protection in the United States. Foreign copyrights may apply.
Sequences from gene families implicated in conjugal transfer and replication of plasmids. Download DATA SET S2, TXT file, 0.04 MB (45.6KB, txt) .
This is a work of the U.S. Government and is not subject to copyright protection in the United States. Foreign copyrights may apply.
To further illustrate these findings, it can be instructive to examine the protospacers from several well-characterized organisms in greater detail; to this end, we selected genomes from the bacterial genera Escherichia, Bacillus, and Clostridium and the archaeal genus Sulfolobus (Text S3). The genome of Escherichia coli strain CI5 contains two CRISPR arrays, one in a type I-E locus with 25 spacers and another stand-alone array with 20 spacers that is located 27 kb upstream of the I-E locus. Both arrays share the same repeat sequence. Protospacers were detected only for the first array, and all 6 of these matched prophage regions in various Escherichia coli strains. The genome of Bacillus coagulans strain 36D1 contains 3 adjacent CRISPR arrays that consist of identical repeats and are associated with a type I-B and a stand-alone array with distinct repeats. Of the 117 spacers contained in these 4 arrays, 8 spacers from the type I-B-linked arrays matched protospacers in provirus regions in various Bacillus strains, and one spacer from the stand-alone array matched a type II secretion system operon. The genome of Clostridium botulinum strain 111 encompasses 4 arrays, 2 of which are associated with type I-B loci, one with a type III-B locus, and two that are stand alone, with 75 spacers in total. Among these spacers, matching protospacers were detected for 14, 2, and 5 in the two type I-B arrays, respectively, 6 in the type III-B array, and 1 in the stand-alone array. Eleven of these protospacers mapped to prophages and the rest mapped to unknown open reading frames (ORFs). The genome of the crenarcheon Sulfolobus solfataricus strain P2 contains 6 CRISPR arrays, all with the same similar repeat sequence. One of these arrays is equally close to type I-A and type III-B loci in the S. solfataricus genome, 3 are associated with the type I-A locus, and the remaining two are stand-alone arrays. These arrays encompass between 24 and 102 spacers, with 416 spacers in total and 17 identified protospacers, 12 of which, all contained in the array associated with the type I-A CRISPR-cas locus, matched sequences in the Sulfolobus monocaudavirus SMV1 and Acidianus two-tailed virus genomes. Taken together, these observations on selected genomes are fully compatible with the results of the bulk analysis in demonstrating a relatively low fraction of spacers with perfectly matching protospacers, of which almost all attributable ones map to MGE.
Protospacer examples for selected genera. Download TEXT S3, PDF file, 0.1 MB (147.9KB, pdf) .
This is a work of the U.S. Government and is not subject to copyright protection in the United States. Foreign copyrights may apply.
The origins of CRISPR spacer dark matter.
From where do ~93% of the spacers that comprise the dark matter of CRISPR arrays come? In an attempt to gain insight into the origin of these spacers, we compared the nucleotide compositions of the spacers, the respective prokaryotic genomes, and the virus genomes containing the corresponding protospacers. The compositions of the three sequence sets showed a near-perfect correlation and were almost identical across the entire range of GC contents; closely similar results were obtained regardless of whether all spacers were included or only spacers with matches were included (Fig. 5A and B). Compatible results were obtained when we compared dinucleotide and tetranucleotide compositions among the same sequence sets, using principal-component analysis (standard multidimensional scaling); all points formed a homogeneous cloud, without any detectable partitioning (Fig. 6A and B). The large-scale observations are compatible with previous reports on oligonucleotide compositions in microbial communities (63). Given the wide range of the GC contents covered, from ~20 to ~70%, and the near-indistinguishable features of the three sets of sequence, these observations strongly suggest that they all come from a single, intermixing, species-specific sequence pool. Bacteriophage genomes are generally considered to have a lower GC content than the host genomes, such that prophages form AT-rich genomic islands (64), which seems to be at odds with the near-perfect correlation we observed. To investigate this discrepancy, we compared the GC content of phage and host genomes for several bacteria for which numerous phages have been characterized; all available phage genomes were included in this analysis, regardless of whether corresponding spacers were detected. In most cases, there was indeed a considerable AT bias in phages, but numerous phage genomes had the same composition as the host and spacers (Fig. 7). Conceivably, the majority of spacers come from the most abundant phages that match the hosts in GC content. These observations are also in agreement with a recent demonstration of a close correspondence between the oligonucleotide compositions of the genomes of bacteriophages and the corresponding host bacteria (65).
FIG 5 .

Correlations between the nucleotide compositions of spacers, the genomes of the respective microbes, and their viruses. (A) GC content of spacers versus GC content of microbial genomes and viruses. (B) GC content of spacers with matches versus GC content of microbial genomes and viruses. Linear trend lines are shown for the GC content of spacers (green) and viral genomes (red), and the x = y line is included to guide the eye.
FIG 6 .

Correlations between the nucleotide compositions of spacers, genomes of bacteria with numerous characterized viruses, and the corresponding viral genomes.
FIG 7 .

Results of principal-component analysis of the oligonucleotide compositions of spacers and the genomes of the respective microbes and their viruses. (A) Dinucleotide compositions; (B) tetranucleotide compositions. Black circles, spacers; green circles, microbes; red circles, virus. The analysis was performed using standard multidimensional scaling.
We further investigated the provenance of the dark matter spacers by using an alternative approach. Matches to genomes from different microbial taxa, in the range from strains within the same species to different domains (archaea and bacteria), were tallied for CRISPR spacers and for “mock spacers,”, i.e., 1,000 randomly sampled sequence segments of the same length from each CRISPR-carrying genome. The distributions of the matches were substantially different for the two sequence sets: the spacers matched genomic sequences almost exclusively within the same species, and almost none were found outside the same genus, whereas for the mock spacers, numerous matches were detected in distantly related genomes (Fig. 8A). The distributions of the number of matches per (mock) spacer were quite different also, with the spacers being largely unique or matching only a few sequences, in contrast to the distribution for the mock spacers, which was dominated by a peak of abundant matches (Fig. 8B). These observations indicate that the protospacers come from a sequence pool that is sharply different from the average genomic sequence in terms of evolutionary conservation. The protospacer sequences are extremely poorly conserved, which is the property of the mobilome.
FIG 8 .

Spacer sequence conservation compared to the genomic average. (A) Distributions of matches for the spacers and the mock spacers across the microbial taxonomic ranks. (B) Distributions of the number of matches to the same species per spacer for the spacers and the mock spacers.
DISCUSSION
In the present dissection of the CRISPR (proto)spacer space, we made three principal observations. First, we found that the fractions of spacers with matches (or in other words, the fraction of detected protospacers) spanned a wide range from 0 to more than 20% for the different CRISPR-Cas subtypes and different bacterial and archaeal phyla (Tables 1 and 2). One of the key factors resulting in such a broad distribution of the detectable protospacer fraction is likely the different tolerances to mismatches for interference among the CRISPR-Cas variants. Indeed, a substantial difference between type I and type III systems has been reported, with the latter allowing for more mismatches than the former (25). In accord with these observations, the fraction of spacers with matches among the spacers from the type III systems was consistently low in the present analysis (Table 1). However, additional biological factors, such as the diversity and abundance of viruses to which microbes of a particular group are exposed, are most likely for the observed distribution of spacers matches (53, 66, 67). Elucidation if the interplay between these factors is a major challenge for CRISPR biology.
Second, the spacers with detectable protospacer matches that persist in CRISPR arrays originate (almost) exclusively from genomes of MGE, mostly viruses but also plasmids. This is not an unexpected finding, as it is compatible with multiple previous observations on individual prokaryotic genomes, but the overwhelming dominance of mobilome-derived sequences is now validated quantitatively on the scale of the entire prokaryotic sequence space. Notably, the great majority of viral protospacers were actually detected in provirus sequences. In part, this could be caused by the bias caused by the current incompleteness of the virus sequence database, but the possibility also exists that CRISPR-Cas systems play a particularly important role in the control of provirus induction. Such a mechanism is suggested by the demonstration of transcription-dependent targeting of viral genomes by at least some CRISPR-Cas systems (34–38).
The strong selectivity of the CRISPR-Cas systems toward the mobilome is likely to stem from two sources, namely, self versus nonself discrimination at the stage of spacer incorporation and selection (preferential survival) of microbial clones incorporating nonself spacers. The mechanisms of discrimination remain far from being perfectly understood, but at least some preference for nonself genomes has been demonstrated through recognition by the adaptation complex of actively replicating and repaired and/or transcribed DNA (34–38). Selection appears to be critically important as well, at least in some CRISPR-Cas variants, because when the nuclease activity of the effector is abolished and the deleterious effect of self-matching spacers is accordingly eliminated, such spacers do accumulate (39). The relative contributions of self versus nonself discrimination and selection to the dominance of the mobilome as the source of detectable protospacers remain to be assessed and are likely to differ across the diversity of the CRISPR-Cas systems. Regardless, the result is a (near) complete exclusion of “regular” (not originating from MGE) microbial sequences from the genomic spacer space. This exclusion involves not only the host but also other microbes, suggesting that CRISPR-Cas systems provide protection from viruses and other MGE, on many occasions preventing plasmid spread, but they might not create a major barrier for horizontal gene transfer via other routes, such as transformation, conceivably because these mechanisms do not require active replication or expression of the foreign DNA. Notably, comparison of the distributions of spacers originating from different sources along the length of the CRISPR arrays showed a more abrupt decline for nonviral spacers (Fig. S2), i.e., those originating primarily from plasmids, suggesting that, on average, selection maintains spacers against more deleterious elements for longer times. It has been reported that in some cases, self-targeting spacers could be functional through gene regulation or reshaping microbial genomes, e.g., by eliminating pathogenicity islands (62, 68). The present results indicate that, although undoubtedly biologically interesting and potentially impactful, such phenomena have at best a minor effect on the structure of the spacers space.
The second key finding of this work is the demonstration that CRISPR spacers, both those with matches and the dark matter, the respective microbial genomes, and their viruses (both those for which spacers were detected and those for which there were none) appear to belong to the same genomic pool as determined by (oligo)nucleotide composition analysis. Together with the dominance of viral and plasmid sequences among the protospacers (spacers with matches), these observations lead to the extrapolation that the overwhelming majority, and possibly nearly all, spacers originate from the same source, namely, the species-specific mobilome.
Then, whence the dark matter? There seem to be two complementary explanations. First, the dramatic excess of spacers without matches over those with detectable protospacers implies that for most microbes, the “pan-mobilome” that they encounter in the course of evolution is vast and still largely untapped. This conclusion is compatible with the observations of “open” pangenomes for many bacteria and archaea (69–71) and an extremely high rate of gene replacement for the poorly conserved subset of microbial genes (72). These findings imply that a vast, “effectively infinite” reservoir of genes is accessible to most microbes, and it appears most likely that a major if not the dominant part of this gene pool consists of MGE (73). Second, the lack of spacer matches is likely to be caused by progressive amelioration of the spacer sequences, primarily through mutational escape of viruses, which results in the loss of information that is required to recognize protospacers, at least in a database search. Indeed, in population dynamics studies, it has been demonstrated that viruses rapidly escape from CRISPR, such that only the most recently acquired spacers match viral genomic sequences precisely (74). In the actual biological setting, spacers with mismatches can still be employed for interference and/or primed adaptation (28, 30, 32). Again, the relative contributions of the two factors remain to be investigated. The importance of amelioration is implied by the precipitous decline of the fraction of spacers with matches from the beginning toward the middle of arrays (Fig. 2). Furthermore, in Escherichia coli, the only microbe for which the virome can be considered comprehensively characterized, there are virtually no spacers with matches to the known viral genomes, suggesting that the apparently inactive CRISPR arrays in this bacterium have accumulated mismatches to the cognate protospacers that render them unrecognizable (75). Further characterization of the pan-mobilomes of diverse bacteria and measurement of spacer amelioration rates should improve our understanding of the evolution of the CRISPR spacer space and the virus-host arms race.
MATERIALS AND METHODS
Prokaryotic genome database.
Archaeal and bacterial genomic sequences were downloaded in March 2016 from the NCBI ftp website (ftp://ftp.ncbi.nlm.nih.gov/genomes/all/). The precomputed ORF annotation was accepted for well-annotated genomes (coding density of >0.6 coding sequences per kilobase), and the rest of the genomes were annotated using Meta-GeneMark (76) with the standard model MetaGeneMark_v1.mod (heuristic model for genetic code 11 and genetic code 30). The resulting database consisted of 4,961 completely assembled genomes, 43,599 partial genomes, or 6,342,452 nucleotide sequences altogether (genome partitions, such as chromosomes and plasmids, and contigs).
Detection and annotation of CRISPR arrays.
All contigs from the prokaryotic genome database were analyzed with CRISPRFinder (77), which identified 61,581 CRISPR arrays, and PILER-CR (78), which identified 49,817 arrays. Arrays were merged by coordinates (CRISPRFinder array annotation was taken in case of overlap), which produced a set of 65,194 CRISPR arrays. CRISPR-Cas types and subtypes were assigned to CRISPR arrays by using previously described procedures (50, 79). All ORFs within 10 kb upstream and downstream of an array were annotated using RPS-BLAST (80), with 30,953 protein profiles (from the COG, pfam, and cd collections) from the NCBI CDD database (81) and 217 custom CRISPR-Cas protein profiles (79). In cases of multiple CRISPR-Cas systems present for an examined locus, the annotation of the first detected variant was used to annotate the array.
Given the frequent misidentification of CRISPR arrays (Text S4), a filtering procedure for “orphan” CRISPR arrays (i.e., the arrays that were not associated with cas genes) was applied. A set of repeats from CRISPR arrays identified within typical CRISPR-cas loci was collected, and these were assumed to represent bona fide CRISPR arrays (positive set). A BLASTN (82) search was performed for all repeats from orphan CRISPR arrays against the positive set, and BLAST hits were collected that showed at least 90% identity and 90% coverage with repeats from the positive set. All arrays that did not produce such hits against the positive set were discarded. The resulting 42,352 CRISPR arrays were used for further analysis.
Examples of mispredicted CRISPR arrays. Download TEXT S4, PDF file, 0.1 MB (114.9KB, pdf) .
This is a work of the U.S. Government and is not subject to copyright protection in the United States. Foreign copyrights may apply.
For 16,648 CRISPR arrays, the direction of transcription was determined from the position of the degenerate repeat (56). For each array, the number of mismatches between each of the two repeats at the ends of the array and the consensus sequence for the given array was counted. If one of the two end repeats had 0 mismatches to the repeat consensus while the one other had 3 or more mismatches, transcription was assumed to proceed in the direction from the perfect repeat to the degenerate one. For the rest of the arrays, where such a difference between the two terminal repeats was not observed, the direction of transcription was considered unknown.
Detection of protospacers.
A set of unique spacers was extracted from the 42,352 CRISPR arrays via comparison of the direct and reverse complement sequences. The full complement of CRISPR arrays contained 720,391 spacers in total, with 363,460 unique spacers.
A BLASTN search with the command line parameters max_target_seqs 10000000 -dust no -word_size 8 was performed for the unique spacer set against the virus part (NCBI taxid 10,239) of the NR/NT nucleotide collection (83) and against the prokaryotic database described above. The hits with at least 95% sequence identity to a spacer and at least 95% sequence coverage (i.e., one or two mismatches were allowed) were accepted as protospacers. This threshold was defined from the results of a comparison of the number of spacer BLAST hits in prokaryotic and eukaryotic virus sequences (Fig. S4), where eukaryotic viruses served as a control data set for false predictions. The threshold was set at the lowest false discovery rate, 0.06. As a result, 2,981 spacer matches were detected in viral sequences and 23,385 matches were detected in prokaryotic sequences.
Defining the threshold for CRISPR spacer identification. Download FIG S4, PDF file, 0.1 MB (68.6KB, pdf) .
This is a work of the U.S. Government and is not subject to copyright protection in the United States. Foreign copyrights may apply.
Annotation of protospacers in prokaryotic genomes.
To identify protospacers that belonged to proviruses among the 23,385 spacer matches obtained in the prokaryotic genomic sequences, the following procedure was applied: (i) all ORFs within 3 kb upstream and downstream of a spacer hit were collected; (ii) a PSI-BLAST (82) search was conducted for all ORFs from these loci against the virus part of the NR database (83), using the command line parameters -seg no -evalue 0.000001 -dbsize 20000000; (iii) a protospacer was classified as (pro)viral if it overlapped an ORF with a match in the viral part of the NR database or if two or more ORFs with matches in the viral sequence set were identified within the neighborhood of the protospacer. Among the 23,385 spacer matches in prokaryotic genomes, 19,704 spacers targeted ORFs, of which 16,819 were classified as (pro)viral. Among the 3,679 spacer-targeting intergenic regions, 2,799 were classified as (pro)viral.
The results obtained with this classification procedure were compared to those obtained with PhiSpy (84), a commonly used prophage finding tool (used with default parameters) for the protospacer matches identified in the 4,961 completely assembled genomes. Of the 1,240 spacer matches in complete genomes, 999 hits were identified as targeting (pro)virus based on the ad hoc procedure described above. Using PhiSpy, 902 spacers were mapped to proviruses, of which 819 overlapped with the set of 999 viral matches detected by the ad hoc method, indicating high consistency for predictions by the two approaches.
The distribution of protospacers across CRISPR-Cas types and subtypes was obtained from the unique spacer set. In cases when a unique spacer was identified in CRISPR arrays from different subtypes, only one instance was counted. The same procedure was applied to estimate the distribution of protospacers among the bacterial and archaeal phyla.
Annotation of spacer matches in nonviral ORFs.
The 2,885 ORFs that were targeted by spacers but not classified as viral proteins were annotated with 30,953 protein profiles (COG, pfam, cd) from the NCBI CDD database, and 217 custom CRISPR-Cas protein profiles were annotated using RPS-BLAST (with an E value cutoff of 10e−4). Profile hits were obtained for 1,616 ORFs. The 1,269 ORFs with no identified profile hits were clustered using UCLUST (85), with a similarity threshold of 0.3. To assign ORFs to COG functional categories, the same procedure was performed against the COG proteins profiles only (86). The summary statistics for the functional categories was assembled using the COG table and are available at ftp://ftp.ncbi.nih.gov/pub/COG/COG2014/static/lists/homeCOGs.html.
Bipartite host-virus network analysis.
The set of 2,981 spacer matches in the viral part of the NT/NR nucleotide collection was used to build a bipartite network with two types of nodes: CRISPR hosts and targeted viruses. All CRISPR hosts from the same genus were collapsed into a single node. Edges between network nodes were assigned when a protospacer matching a spacer in a given host was identified in a virus. The network was visualized using the Cytoscape software (87).
Nucleotide composition analysis of hosts, spacers and viruses.
Nucleotide composition analysis was performed with the data set of 2,104 complete genomes that contained CRISPR arrays. Frequencies of mono-, di-, and tetranucleotides were calculated in genome sequences. The standard prcomp function from the R package was used for standard multidimensional scaling.
Species with the most extensively sampled viromes were identified from the “/host” tag in the RefSeq database for double-stranded DNA viruses. The hosts and the number of phages in RefSeq from this analysis were as follows: E. coli, 144; P. aeruginosa, 103; S. aureus, 77; P. acnes, 42; Synechococcus sp., 21; Mycobacterium, 21. Host species were analyzed separately, together with the associated viruses.
Comparison of distributions of spacer and random fragment matches in prokaryotic genomes.
The comparison of the matches distribution for spacers and random fragments was performed on 2,104 complete genomes that contained CRISPR arrays. For each genome, 1,000 random fragments, with a length equal to the median length of spacers in the given genome were extracted. A BLASTN search against the prokaryotic database was performed for these fragments and for spacers, with following parameters: -max_target_seqs 10000000 -dust no -word_size 8. Exact matches were selected for further analysis.
Data availability.
The data used for the analysis reported here are available in .ftp form at ftp://ftp.ncbi.nih.gov/pub/wolf/_suppl/spacerome/.
Code availability.
The customary computer code used in this analysis is available at ftp://ftp.ncbi.nih.gov/pub/wolf/_suppl/spacerome/.
ACKNOWLEDGMENTS
We thank Uri Gophna (Tel Aviv University) for helpful suggestions and the Koonin group members for discussions.
S.A.S., Y.I.W., and E.V.K. designed the research; S.A.S. and V.S. performed the research; S.A.S., K.S.M., Y.I.W., K.V.S., and E.V.K. analyzed the results; E.V.K. wrote the manuscript, which was read, edited, and approved by all authors.
S.A.S. and K.V.S. are partially supported by SkolTech-MIT Next Generation Program Grant. K.V.S. was supported by grant NIH RO1 GM10407.
Footnotes
Citation Shmakov SA, Sitnik V, Makarova KS, Wolf YI, Severinov KV, Koonin EV. 2017. The CRISPR spacer space is dominated by sequences from species-specific mobilomes. mBio 8:e01397-17. https://doi.org/10.1128/mBio.01397-17.
REFERENCES
- 1.Sorek R, Lawrence CM, Wiedenheft B. 2013. CRISPR-mediated adaptive immune systems in bacteria and archaea. Annu Rev Biochem 82:237–266. doi: 10.1146/annurev-biochem-072911-172315. [DOI] [PubMed] [Google Scholar]
- 2.Mohanraju P, Makarova KS, Zetsche B, Zhang F, Koonin EV, van der Oost J. 2016. Diverse evolutionary roots and mechanistic variations of the CRISPR-Cas systems. Science 353:aad5147. doi: 10.1126/science.aad5147. [DOI] [PubMed] [Google Scholar]
- 3.Amitai G, Sorek R. 2016. CRISPR-Cas adaptation: insights into the mechanism of action. Nat Rev Microbiol 14:67–76. doi: 10.1038/nrmicro.2015.14. [DOI] [PubMed] [Google Scholar]
- 4.Silas S, Mohr G, Sidote DJ, Markham LM, Sanchez-Amat A, Bhaya D, Lambowitz AM, Fire AZ. 2016. Direct CRISPR spacer acquisition from RNA by a natural reverse transcriptase-Cas1 fusion protein. Science 351:aad4234. doi: 10.1126/science.aad4234. [DOI] [PMC free article] [PubMed] [Google Scholar]
- 5.Hsu PD, Lander ES, Zhang F. 2014. Development and applications of CRISPR-Cas9 for genome engineering. Cell 157:1262–1278. doi: 10.1016/j.cell.2014.05.010. [DOI] [PMC free article] [PubMed] [Google Scholar]
- 6.Doudna JA, Charpentier E. 2014. Genome editing. The new frontier of genome engineering with CRISPR-Cas9. Science 346:1258096. doi: 10.1126/science.1258096. [DOI] [PubMed] [Google Scholar]
- 7.Shalem O, Sanjana NE, Zhang F. 2015. High-throughput functional genomics using CRISPR-Cas9. Nat Rev Genet 16:299–311. doi: 10.1038/nrg3899. [DOI] [PMC free article] [PubMed] [Google Scholar]
- 8.Komor AC, Badran AH, Liu DR. 2017. CRISPR-Based technologies for the manipulation of eukaryotic genomes. Cell 168:20–36. doi: 10.1016/j.cell.2016.10.044. [DOI] [PMC free article] [PubMed] [Google Scholar]
- 9.Dominguez AA, Lim WA, Qi LS. 2016. Beyond editing: repurposing CRISPR-Cas9 for precision genome regulation and interrogation. Nat Rev Mol Cell Biol 17:5–15. doi: 10.1038/nrm.2015.2. [DOI] [PMC free article] [PubMed] [Google Scholar]
- 10.Wright AV, Nuñez JK, Doudna JA. 2016. Biology and applications of CRISPR systems: harnessing nature’s toolbox for genome engineering. Cell 164:29–44. doi: 10.1016/j.cell.2015.12.035. [DOI] [PubMed] [Google Scholar]
- 11.van der Oost J, Westra ER, Jackson RN, Wiedenheft B. 2014. Unravelling the structural and mechanistic basis of CRISPR-Cas systems. Nat Rev Microbiol 12:479–492. doi: 10.1038/nrmicro3279. [DOI] [PMC free article] [PubMed] [Google Scholar]
- 12.Sternberg SH, Richter H, Charpentier E, Qimron U. 2016. Adaptation in CRISPR-Cas systems. Mol Cell 61:797–808. doi: 10.1016/j.molcel.2016.01.030. [DOI] [PubMed] [Google Scholar]
- 13.Brouns SJ, Jore MM, Lundgren M, Westra ER, Slijkhuis RJ, Snijders AP, Dickman MJ, Makarova KS, Koonin EV, van der Oost J. 2008. Small CRISPR RNAs guide antiviral defense in prokaryotes. Science 321:960–964. doi: 10.1126/science.1159689. [DOI] [PMC free article] [PubMed] [Google Scholar]
- 14.Deltcheva E, Chylinski K, Sharma CM, Gonzales K, Chao Y, Pirzada ZA, Eckert MR, Vogel J, Charpentier E. 2011. CRISPR RNA maturation by trans-encoded small RNA and host factor RNase III. Nature 471:602–607. doi: 10.1038/nature09886. [DOI] [PMC free article] [PubMed] [Google Scholar]
- 15.Charpentier E, Richter H, van der Oost J, White MF. 2015. Biogenesis pathways of RNA guides in archaeal and bacterial CRISPR-Cas adaptive immunity. FEMS Microbiol Rev 39:428–441. doi: 10.1093/femsre/fuv023. [DOI] [PMC free article] [PubMed] [Google Scholar]
- 16.Fonfara I, Richter H, Bratovič M, Le Rhun A, Charpentier E. 2016. The CRISPR-associated DNA-cleaving enzyme Cpf1 also processes precursor CRISPR RNA. Nature 532:517–521. doi: 10.1038/nature17945. [DOI] [PubMed] [Google Scholar]
- 17.East-Seletsky A, O’Connell MR, Knight SC, Burstein D, Cate JH, Tjian R, Doudna JA. 2016. Two distinct RNase activities of CRISPR-C2c2 enable guide-RNA processing and RNA detection. Nature 538:270–273. doi: 10.1038/nature19802. [DOI] [PMC free article] [PubMed] [Google Scholar]
- 18.Swarts DC, van der Oost J, Jinek M. 2017. Structural basis for guide RNA processing and seed-dependent DNA targeting by CRISPR-Cas12a. Mol Cell 66:221–233.e4. doi: 10.1016/j.molcel.2017.03.016. [DOI] [PMC free article] [PubMed] [Google Scholar]
- 19.Barrangou R. 2013. CRISPR-Cas systems and RNA-guided interference. Wiley Interdiscip Rev RNA 4:267–278. doi: 10.1002/wrna.1159. [DOI] [PubMed] [Google Scholar]
- 20.Plagens A, Richter H, Charpentier E, Randau L. 2015. DNA and RNA interference mechanisms by CRISPR-Cas surveillance complexes. FEMS Microbiol Rev 39:442–463. doi: 10.1093/femsre/fuv019. [DOI] [PMC free article] [PubMed] [Google Scholar]
- 21.Nishimasu H, Nureki O. 2017. Structures and mechanisms of CRISPR RNA-guided effector nucleases. Curr Opin Struct Biol 43:68–78. doi: 10.1016/j.sbi.2016.11.013. [DOI] [PubMed] [Google Scholar]
- 22.Han W, Li Y, Deng L, Feng M, Peng W, Hallstrøm S, Zhang J, Peng N, Liang YX, White MF, She Q. 2017. A type III-B CRISPR-Cas effector complex mediating massive target DNA destruction. Nucleic Acids Res 45:1983–1993. doi: 10.1093/nar/gkw1274. [DOI] [PMC free article] [PubMed] [Google Scholar]
- 23.Abudayyeh OO, Gootenberg JS, Konermann S, Joung J, Slaymaker IM, Cox DB, Shmakov S, Makarova KS, Semenova E, Minakhin L, Severinov K, Regev A, Lander ES, Koonin EV, Zhang F. 2016. C2c2 is a single-component programmable RNA-guided RNA-targeting CRISPR effector. Science 353:aaf5573. doi: 10.1126/science.aaf5573. [DOI] [PMC free article] [PubMed] [Google Scholar]
- 24.Smargon AA, Cox DB, Pyzocha NK, Zheng K, Slaymaker IM, Gootenberg JS, Abudayyeh OA, Essletzbichler P, Shmakov S, Makarova KS, Koonin EV, Zhang F. 2017. Cas13b Is a type VI-B CRISPR-Associated RNA-guided RNase differentially regulated by accessory proteins Csx27 and Csx28. Mol Cell 65:618–630.e7. doi: 10.1016/j.molcel.2016.12.023. [DOI] [PMC free article] [PubMed] [Google Scholar]
- 25.Manica A, Zebec Z, Steinkellner J, Schleper C. 2013. Unexpectedly broad target recognition of the CRISPR-mediated virus defence system in the archaeon Sulfolobus solfataricus. Nucleic Acids Res 41:10509–10517. doi: 10.1093/nar/gkt767. [DOI] [PMC free article] [PubMed] [Google Scholar]
- 26.Stoll B, Maier LK, Lange SJ, Brendel J, Fischer S, Backofen R, Marchfelder A. 2013. Requirements for a successful defence reaction by the CRISPR-Cas subtype I-B system. Biochem Soc Trans 41:1444–1448. doi: 10.1042/BST20130098. [DOI] [PubMed] [Google Scholar]
- 27.Künne T, Swarts DC, Brouns SJ. 2014. Planting the seed: target recognition of short guide RNAs. Trends Microbiol 22:74–83. doi: 10.1016/j.tim.2013.12.003. [DOI] [PubMed] [Google Scholar]
- 28.Xue C, Seetharam AS, Musharova O, Severinov K, Brouns SJ, Severin AJ, Sashital DG. 2015. CRISPR interference and priming varies with individual spacer sequences. Nucleic Acids Res 43:10831–10847. doi: 10.1093/nar/gkv1259. [DOI] [PMC free article] [PubMed] [Google Scholar]
- 29.Barrangou R, Fremaux C, Deveau H, Richards M, Boyaval P, Moineau S, Romero DA, Horvath P. 2007. CRISPR provides acquired resistance against viruses in prokaryotes. Science 315:1709–1712. doi: 10.1126/science.1138140. [DOI] [PubMed] [Google Scholar]
- 30.Semenova E, Jore MM, Datsenko KA, Semenova A, Westra ER, Wanner B, van der Oost J, Brouns SJ, Severinov K. 2011. Interference by clustered regularly interspaced short palindromic repeat (CRISPR) RNA is governed by a seed sequence. Proc Natl Acad Sci U S A 108:10098–10103. doi: 10.1073/pnas.1104144108. [DOI] [PMC free article] [PubMed] [Google Scholar]
- 31.Datsenko KA, Pougach K, Tikhonov A, Wanner BL, Severinov K, Semenova E. 2012. Molecular memory of prior infections activates the CRISPR/Cas adaptive bacterial immunity system. Nat Commun 3:945. doi: 10.1038/ncomms1937. [DOI] [PubMed] [Google Scholar]
- 32.Fineran PC, Gerritzen MJ, Suárez-Diez M, Künne T, Boekhorst J, van Hijum SA, Staals RH, Brouns SJ. 2014. Degenerate target sites mediate rapid primed CRISPR adaptation. Proc Natl Acad Sci U S A 111:E1629–E1638. doi: 10.1073/pnas.1400071111. [DOI] [PMC free article] [PubMed] [Google Scholar]
- 33.Semenova E, Savitskaya E, Musharova O, Strotskaya A, Vorontsova D, Datsenko KA, Logacheva MD, Severinov K. 2016. Highly efficient primed spacer acquisition from targets destroyed by the Escherichia coli type I-E CRISPR-Cas interfering complex. Proc Natl Acad Sci U S A 113:7626–7631. doi: 10.1073/pnas.1602639113. [DOI] [PMC free article] [PubMed] [Google Scholar]
- 34.Goldberg GW, Jiang W, Bikard D, Marraffini LA. 2014. Conditional tolerance of temperate phages via transcription-dependent CRISPR-Cas targeting. Nature 514:633–637. doi: 10.1038/nature13637. [DOI] [PMC free article] [PubMed] [Google Scholar]
- 35.Goldberg GW, Marraffini LA. 2015. Resistance and tolerance to foreign elements by prokaryotic immune systems—curating the genome. Nat Rev Immunol 15:717–724. doi: 10.1038/nri3910. [DOI] [PMC free article] [PubMed] [Google Scholar]
- 36.Levy A, Goren MG, Yosef I, Auster O, Manor M, Amitai G, Edgar R, Qimron U, Sorek R. 2015. CRISPR adaptation biases explain preference for acquisition of foreign DNA. Nature 520:505–510. doi: 10.1038/nature14302. [DOI] [PMC free article] [PubMed] [Google Scholar]
- 37.Samai P, Pyenson N, Jiang W, Goldberg GW, Hatoum-Aslan A, Marraffini LA. 2015. Co-transcriptional DNA and RNA cleavage during type III CRISPR-Cas immunity. Cell 161:1164–1174. doi: 10.1016/j.cell.2015.04.027. [DOI] [PMC free article] [PubMed] [Google Scholar]
- 38.Jiang W, Samai P, Marraffini LA. 2016. Degradation of phage transcripts by CRISPR-Associated RNases enables Type III CRISPR-Cas immunity. Cell 164:710–721. doi: 10.1016/j.cell.2015.12.053. [DOI] [PMC free article] [PubMed] [Google Scholar]
- 39.Wei Y, Terns RM, Terns MP. 2015. Cas9 function and host genome sampling in type II-A CRISPR-Cas adaptation. Genes Dev 29:356–361. doi: 10.1101/gad.257550.114. [DOI] [PMC free article] [PubMed] [Google Scholar]
- 40.Stern A, Keren L, Wurtzel O, Amitai G, Sorek R. 2010. Self-targeting by CRISPR: gene regulation or autoimmunity? Trends Genet 26:335–340. doi: 10.1016/j.tig.2010.05.008. [DOI] [PMC free article] [PubMed] [Google Scholar]
- 41.Hooton SP, Brathwaite KJ, Connerton IF. 2016. The bacteriophage carrier state of Campylobacter jejuni features changes in host non-coding RNAs and the acquisition of new host-derived CRISPR spacer sequences. Front Microbiol 7:355. doi: 10.3389/fmicb.2016.00355. [DOI] [PMC free article] [PubMed] [Google Scholar]
- 42.Hooton SP, Connerton IF. 2014. Campylobacter jejuni acquire new host-derived CRISPR spacers when in association with bacteriophages harboring a CRISPR-like Cas4 protein. Front Microbiol 5:744. doi: 10.3389/fmicb.2014.00744. [DOI] [PMC free article] [PubMed] [Google Scholar]
- 43.Bolotin A, Quinquis B, Sorokin A, Ehrlich SD. 2005. Clustered regularly interspaced short palindrome repeats (CRISPRs) have spacers of extrachromosomal origin. Microbiology 151:2551–2561. doi: 10.1099/mic.0.28048-0. [DOI] [PubMed] [Google Scholar]
- 44.Mojica FJ, Díez-Villaseñor C, García-Martínez J, Soria E. 2005. Intervening sequences of regularly spaced prokaryotic repeats derive from foreign genetic elements. J Mol Evol 60:174–182. doi: 10.1007/s00239-004-0046-3. [DOI] [PubMed] [Google Scholar]
- 45.Pourcel C, Salvignol G, Vergnaud G. 2005. CRISPR elements in Yersinia pestis acquire new repeats by preferential uptake of bacteriophage DNA, and provide additional tools for evolutionary studies. Microbiology 151:653–663. doi: 10.1099/mic.0.27437-0. [DOI] [PubMed] [Google Scholar]
- 46.Tyson GW, Banfield JF. 2008. Rapidly evolving CRISPRs implicated in acquired resistance of microorganisms to viruses. Environ Microbiol 10:200–207. doi: 10.1111/j.1462-2920.2007.01444.x. [DOI] [PubMed] [Google Scholar]
- 47.van Houte S, Buckling A, Westra ER. 2016. Evolutionary ecology of prokaryotic immune mechanisms. Microbiol Mol Biol Rev 80:745–763. doi: 10.1128/MMBR.00011-16. [DOI] [PMC free article] [PubMed] [Google Scholar]
- 48.England WE, Whitaker RJ. 2013. Evolutionary causes and consequences of diversified CRISPR immune profiles in natural populations. Biochem Soc Trans 41:1431–1436. doi: 10.1042/BST20130243. [DOI] [PubMed] [Google Scholar]
- 49.Childs LM, England WE, Young MJ, Weitz JS, Whitaker RJ. 2014. CRISPR-induced distributed immunity in microbial populations. PLoS One 9:e101710. doi: 10.1371/journal.pone.0101710. [DOI] [PMC free article] [PubMed] [Google Scholar]
- 50.Makarova KS, Wolf YI, Alkhnbashi OS, Costa F, Shah SA, Saunders SJ, Barrangou R, Brouns SJ, Charpentier E, Haft DH, Horvath P, Moineau S, Mojica FJ, Terns RM, Terns MP, White MF, Yakunin AF, Garrett RA, van der Oost J, Backofen R, Koonin EV. 2015. An updated evolutionary classification of CRISPR-Cas systems. Nat Rev Microbiol 13:722–736. doi: 10.1038/nrmicro3569. [DOI] [PMC free article] [PubMed] [Google Scholar]
- 51.Shmakov S, Smargon A, Scott D, Cox D, Pyzocha N, Yan W, Abudayyeh OO, Gootenberg JS, Makarova KS, Wolf YI, Severinov K, Zhang F, Koonin EV. 2017. Diversity and evolution of class 2 CRISPR-Cas systems. Nat Rev Microbiol 15:169–182. doi: 10.1038/nrmicro.2016.184. [DOI] [PMC free article] [PubMed] [Google Scholar]
- 52.Westra ER, Brouns SJ. 2012. The rise and fall of CRISPRs—dynamics of spacer acquisition and loss. Mol Microbiol 85:1021–1025. doi: 10.1111/j.1365-2958.2012.08170.x. [DOI] [PubMed] [Google Scholar]
- 53.Weinberger AD, Sun CL, Pluciński MM, Denef VJ, Thomas BC, Horvath P, Barrangou R, Gilmore MS, Getz WM, Banfield JF. 2012. Persisting viral sequences shape microbial CRISPR-based immunity. PLoS Comput Biol 8:e1002475. doi: 10.1371/journal.pcbi.1002475. [DOI] [PMC free article] [PubMed] [Google Scholar]
- 54.Wright AV, Doudna JA. 2016. Protecting genome integrity during CRISPR immune adaptation. Nat Struct Mol Biol 23:876–883. doi: 10.1038/nsmb.3289. [DOI] [PubMed] [Google Scholar]
- 55.Yoganand KN, Sivathanu R, Nimkar S, Anand B. 2017. Asymmetric positioning of Cas1-2 complex and Integration Host Factor induced DNA bending guide the unidirectional homing of protospacer in CRISPR-Cas type I-E system. Nucleic Acids Res 45:367–381. doi: 10.1093/nar/gkw1151. [DOI] [PMC free article] [PubMed] [Google Scholar]
- 56.Biswas A, Fineran PC, Brown CM. 2014. Accurate computational prediction of the transcribed strand of CRISPR non-coding RNAs. Bioinformatics 30:1805–1813. doi: 10.1093/bioinformatics/btu114. [DOI] [PubMed] [Google Scholar]
- 57.Smillie C, Garcillán-Barcia MP, Francia MV, Rocha EP, de la Cruz F. 2010. Mobility of plasmids. Microbiol Mol Biol Rev 74:434–452. doi: 10.1128/MMBR.00020-10. [DOI] [PMC free article] [PubMed] [Google Scholar]
- 58.Almendros C, Guzmán NM, García-Martínez J, Mojica FJ. 2016. Anti-cas spacers in orphan CRISPR4 arrays prevent uptake of active CRISPR-Cas I-F systems. Nat Microbiol 1:16081. doi: 10.1038/nmicrobiol.2016.81. [DOI] [PubMed] [Google Scholar]
- 59.Frost LS, Leplae R, Summers AO, Toussaint A. 2005. Mobile genetic elements: the agents of open source evolution. Nat Rev Microbiol 3:722–732. doi: 10.1038/nrmicro1235. [DOI] [PubMed] [Google Scholar]
- 60.Vercoe RB, Chang JT, Dy RL, Taylor C, Gristwood T, Clulow JS, Richter C, Przybilski R, Pitman AR, Fineran PC. 2013. Cytotoxic chromosomal targeting by CRISPR/Cas systems can reshape bacterial genomes and expel or remodel pathogenicity islands. PLoS Genet 9:e1003454. doi: 10.1371/journal.pgen.1003454. [DOI] [PMC free article] [PubMed] [Google Scholar]
- 61.Selle K, Klaenhammer TR, Barrangou R. 2015. CRISPR-based screening of genomic island excision events in bacteria. Proc Natl Acad Sci U S A 112:8076–8081. doi: 10.1073/pnas.1508525112. [DOI] [PMC free article] [PubMed] [Google Scholar]
- 62.Heussler GE, O’Toole GA. 2016. Friendly fire: biological functions and consequences of chromosomal targeting by CRISPR-Cas systems. J Bacteriol 198:1481–1486. doi: 10.1128/JB.00086-16. [DOI] [PMC free article] [PubMed] [Google Scholar]
- 63.Dick GJ, Andersson AF, Baker BJ, Simmons SL, Thomas BC, Yelton AP, Banfield JF. 2009. Community-wide analysis of microbial genome sequence signatures. Genome Biol 10:R85. doi: 10.1186/gb-2009-10-8-r85. [DOI] [PMC free article] [PubMed] [Google Scholar]
- 64.Mortimer JR, Forsdyke DR. 2003. Comparison of responses by bacteriophages and bacteria to pressures on the base composition of open reading frames. Appl Bioinformatics 2:47–62. [PubMed] [Google Scholar]
- 65.Zhang M, Yang L, Ren J, Ahlgren NA, Fuhrman JA, Sun F. 2017. Prediction of virus-host infectious association by supervised learning methods. BMC Bioinformatics 18(Suppl 3):60. doi: 10.1186/s12859-017-1473-7. [DOI] [PMC free article] [PubMed] [Google Scholar]
- 66.Weinberger AD, Wolf YI, Lobkovsky AE, Gilmore MS, Koonin EV. 2012. Viral diversity threshold for adaptive immunity in prokaryotes. mBio 3:e00456-00412. doi: 10.1128/mBio.00456-12. [DOI] [PMC free article] [PubMed] [Google Scholar]
- 67.Iranzo J, Lobkovsky AE, Wolf YI, Koonin EV. 2013. Evolutionary dynamics of the prokaryotic adaptive immunity system CRISPR-Cas in an explicit ecological context. J Bacteriol 195:3834–3844. doi: 10.1128/JB.00412-13. [DOI] [PMC free article] [PubMed] [Google Scholar]
- 68.Westra ER, Buckling A, Fineran PC. 2014. CRISPR-Cas systems: beyond adaptive immunity. Nat Rev Microbiol 12:317–326. doi: 10.1038/nrmicro3241. [DOI] [PubMed] [Google Scholar]
- 69.Tettelin H, Riley D, Cattuto C, Medini D. 2008. Comparative genomics: the bacterial pan-genome. Curr Opin Microbiol 11:472–477. doi: 10.1016/j.mib.2008.09.006. [DOI] [PubMed] [Google Scholar]
- 70.Lapierre P, Gogarten JP. 2009. Estimating the size of the bacterial pan-genome. Trends Genet 25:107–110. doi: 10.1016/j.tig.2008.12.004. [DOI] [PubMed] [Google Scholar]
- 71.Puigbò P, Lobkovsky AE, Kristensen DM, Wolf YI, Koonin EV. 2014. Genomes in turmoil: quantification of genome dynamics in prokaryote supergenomes. BMC Biol 12:66. doi: 10.1186/s12915-014-0066-4. [DOI] [PMC free article] [PubMed] [Google Scholar]
- 72.Wolf YI, Makarova KS, Lobkovsky AE, Koonin EV. 2016. Two fundamentally different classes of microbial genes. Nat Microbiol 2:16208. doi: 10.1038/nmicrobiol.2016.208. [DOI] [PubMed] [Google Scholar]
- 73.Daubin V, Ochman H. 2004. Start-up entities in the origin of new genes. Curr Opin Genet Dev 14:616–619. doi: 10.1016/j.gde.2004.09.004. [DOI] [PubMed] [Google Scholar]
- 74.Andersson AF, Banfield JF. 2008. Virus population dynamics and acquired virus resistance in natural microbial communities. Science 320:1047–1050. doi: 10.1126/science.1157358. [DOI] [PubMed] [Google Scholar]
- 75.Savitskaya E, Lopatina A, Medvedeva S, Kapustin M, Shmakov S, Tikhonov A, Artamonova II, Logacheva M, Severinov K. 2017. Dynamics of Escherichia coli type I-E CRISPR spacers over 42 000 years. Mol Ecol 26:2019–2026. doi: 10.1111/mec.13961. [DOI] [PMC free article] [PubMed] [Google Scholar]
- 76.Zhu W, Lomsadze A, Borodovsky M. 2010. Ab initio gene identification in metagenomic sequences. Nucleic Acids Res 38:e132. doi: 10.1093/nar/gkq275. [DOI] [PMC free article] [PubMed] [Google Scholar]
- 77.Grissa I, Vergnaud G, Pourcel C. 2007. CRISPRFinder: a web tool to identify clustered regularly interspaced short palindromic repeats. Nucleic Acids Res 35:W52–W57. doi: 10.1093/nar/gkm360. [DOI] [PMC free article] [PubMed] [Google Scholar]
- 78.Edgar RC. 2007. PILER-CR: fast and accurate identification of CRISPR repeats. BMC Bioinformatics 8:18. doi: 10.1186/1471-2105-8-18. [DOI] [PMC free article] [PubMed] [Google Scholar]
- 79.Makarova KS, Koonin EV. 2015. Annotation and classification of CRISPR-Cas systems. Methods Mol Biol 1311:47–75. doi: 10.1007/978-1-4939-2687-9_4. [DOI] [PMC free article] [PubMed] [Google Scholar]
- 80.Marchler-Bauer A, Panchenko AR, Shoemaker BA, Thiessen PA, Geer LY, Bryant SH. 2002. CDD: a database of conserved domain alignments with links to domain three-dimensional structure. Nucleic Acids Res 30:281–283. doi: 10.1093/nar/30.1.281. [DOI] [PMC free article] [PubMed] [Google Scholar]
- 81.Marchler-Bauer A, Derbyshire MK, Gonzales NR, Lu S, Chitsaz F, Geer LY, Geer RC, He J, Gwadz M, Hurwitz DI, Lanczycki CJ, Lu F, Marchler GH, Song JS, Thanki N, Wang Z, Yamashita RA, Zhang D, Zheng C, Bryant SH. 2015. CDD: NCBI’s conserved domain database. Nucleic Acids Res 43:D222–D226. doi: 10.1093/nar/gku1221. [DOI] [PMC free article] [PubMed] [Google Scholar]
- 82.Altschul SF, Madden TL, Schäffer AA, Zhang J, Zhang Z, Miller W, Lipman DJ. 1997. Gapped BLAST and PSI-BLAST: a new generation of protein database search programs. Nucleic Acids Res 25:3389–3402. doi: 10.1093/nar/25.17.3389. [DOI] [PMC free article] [PubMed] [Google Scholar]
- 83.NCBI Resource Coordinators 2017. Database resources of the National Center for Biotechnology Information. Nucleic Acids Res 45:D12–D17. doi: 10.1093/nar/gkw1071. [DOI] [PMC free article] [PubMed] [Google Scholar]
- 84.Akhter S, Aziz RK, Edwards RA. 2012. PhiSpy: a novel algorithm for finding prophages in bacterial genomes that combines similarity- and composition-based strategies. Nucleic Acids Res 40:e126. doi: 10.1093/nar/gks406. [DOI] [PMC free article] [PubMed] [Google Scholar]
- 85.Edgar RC. 2010. Search and clustering orders of magnitude faster than BLAST. Bioinformatics 26:2460–2461. doi: 10.1093/bioinformatics/btq461. [DOI] [PubMed] [Google Scholar]
- 86.Galperin MY, Makarova KS, Wolf YI, Koonin EV. 2015. Expanded microbial genome coverage and improved protein family annotation in the COG database. Nucleic Acids Res 43:D261–D269. doi: 10.1093/nar/gku1223. [DOI] [PMC free article] [PubMed] [Google Scholar]
- 87.Smoot ME, Ono K, Ruscheinski J, Wang PL, Ideker T. 2011. Cytoscape 2.8: new features for data integration and network visualization. Bioinformatics 27:431–432. doi: 10.1093/bioinformatics/btq675. [DOI] [PMC free article] [PubMed] [Google Scholar]
Associated Data
This section collects any data citations, data availability statements, or supplementary materials included in this article.
Supplementary Materials
Distribution of CRISPR arrays in complete genomes. Download FIG S1, PDF file, 0.3 MB (312.9KB, pdf) .
This is a work of the U.S. Government and is not subject to copyright protection in the United States. Foreign copyrights may apply.
Completely assembled genomes with CRISPR arrays. Download TABLE S1, PDF file, 0.2 MB (179.6KB, pdf) .
This is a work of the U.S. Government and is not subject to copyright protection in the United States. Foreign copyrights may apply.
Distribution of spacer hits: contributions of microbial diversity and diversity of CRISPR-Cas systems. Download TEXT S1, PDF file, 0.2 MB (199.1KB, pdf) .
This is a work of the U.S. Government and is not subject to copyright protection in the United States. Foreign copyrights may apply.
Protospacer frequencies for relative CRISPR array positions. Download FIG S2, PDF file, 0.1 MB (70.2KB, pdf) .
This is a work of the U.S. Government and is not subject to copyright protection in the United States. Foreign copyrights may apply.
Identification of prophage regions by using different approaches. Download FIG S3, PDF file, 0.1 MB (145.8KB, pdf) .
This is a work of the U.S. Government and is not subject to copyright protection in the United States. Foreign copyrights may apply.
A host-virus network with several large connected components. Download DATA SET S1, TXT file, 2 MB (2.1MB, txt) .
This is a work of the U.S. Government and is not subject to copyright protection in the United States. Foreign copyrights may apply.
Examples of intergenic hits into unannotated ORFs. Download TEXT S2, PDF file, 0.1 MB (101.5KB, pdf) .
This is a work of the U.S. Government and is not subject to copyright protection in the United States. Foreign copyrights may apply.
Spacers in CRISPR arrays. Download TABLE S2, PDF file, 0.1 MB (145.3KB, pdf) .
This is a work of the U.S. Government and is not subject to copyright protection in the United States. Foreign copyrights may apply.
Sequences from gene families implicated in conjugal transfer and replication of plasmids. Download DATA SET S2, TXT file, 0.04 MB (45.6KB, txt) .
This is a work of the U.S. Government and is not subject to copyright protection in the United States. Foreign copyrights may apply.
Protospacer examples for selected genera. Download TEXT S3, PDF file, 0.1 MB (147.9KB, pdf) .
This is a work of the U.S. Government and is not subject to copyright protection in the United States. Foreign copyrights may apply.
Examples of mispredicted CRISPR arrays. Download TEXT S4, PDF file, 0.1 MB (114.9KB, pdf) .
This is a work of the U.S. Government and is not subject to copyright protection in the United States. Foreign copyrights may apply.
Defining the threshold for CRISPR spacer identification. Download FIG S4, PDF file, 0.1 MB (68.6KB, pdf) .
This is a work of the U.S. Government and is not subject to copyright protection in the United States. Foreign copyrights may apply.
Data Availability Statement
The data used for the analysis reported here are available in .ftp form at ftp://ftp.ncbi.nih.gov/pub/wolf/_suppl/spacerome/.