Summary
Human glioblastomas (GBMs) harbour a subpopulation of glioblastoma stem cells (GSCs) that drive tumourigenesis. However, the origin of intra-tumoural functional heterogeneity between GBM cells remains poorly understood. Here we study the clonal evolution of barcoded GBM cells in an unbiased way following serial xenotransplantation to define their individual fate behaviours. Independent of an evolving mutational signature, we show that the growth of GBM clones in vivo is consistent with a remarkably neutral process involving a conserved proliferative hierarchy rooted in GSCs. In this model, slow-cycling stem-like cells give rise to a more rapidly cycling progenitor population with extensive self-maintenance capacity, that in turn generates non-proliferative cells. We also identify rare “outlier” clones that deviate from these dynamics, and further show that chemotherapy facilitates the expansion of pre-existing drug-resistant GSCs. Finally, we show that functionally distinct GSCs can be separately targeted using epigenetic compounds, suggesting new avenues for GBM targeted therapy.
Introduction
Glioblastoma (GBM) is the most common and malignant form of adult brain tumour1. Central to our understanding of GBM biology is the idea that tumour initiation, maintenance, and regrowth following treatment are seeded by glioblastoma stem cells (GSCs)2,3. Evidence for a proliferative hierarchy in GBM has been derived from xenotransplantation of specific GBM subsets defined by surface marker expression2, genetic lineage tracing in mouse models3 and more recently, single-cell RNA-sequencing4,5. In parallel, GBMs exhibit substantial intra-tumoural genomic heterogeneity6,7 that could theoretically be based in GSCs with variations in growth potential, treatment responsiveness, or invasiveness8–10. However, recent evidence from other systems demonstrate that the intrinsic growth dynamics of a functionally homogeneous population of stem cells is already sufficient to create a wide range of clonal growth behaviours11–14. Therefore, it is yet unclear whether the heterogeneity of human GBM clones is primarily derived from their genomic heterogeneity, or the stochastic outcome of their hierarchical mode of growth.
DNA barcoding is a methodology that enables the proliferative capacity of individual cells to be resolved within polyclonal populations, with diverse applications in stem cell and cancer biology. Recent investigations with this strategy have already provided crucial insights into the lineage potential of normal stem cells15, the proliferative heterogeneity of their transformed counterparts16, as well as mechanisms of cancer drug resistance17 and metastasis18. Importantly, characterizations of population dynamics in a quantitative and unbiased way can be used to inform a mathematical framework to explain complex behaviours13,17. Here, we perform DNA barcoding of primary GBM cells in order to investigate the quantitative behaviours of GSC clones, creating a general, minimal model of GBM growth in which a high degree of intra-tumoural functional complexity can be derived from a homogeneous population of stem-like cells.
Lineage tracing of human GBM cells
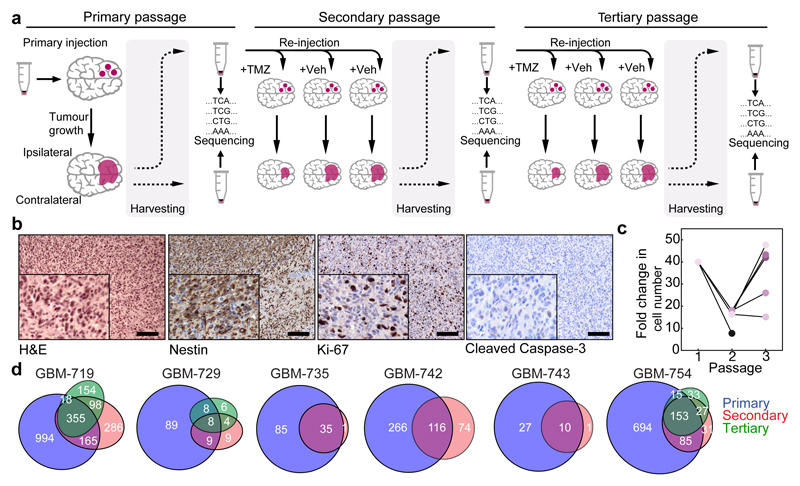
Lineage tracing assays based on genetic mouse models have demonstrated that quiescent stem-like cells promote brain tumour recurrence following chemotherapy3,19. However, it remains unclear how these cells contribute to tumour growth in genetically heterogeneous human GBM6,7,20,21. To identify potential differences in tumour clone-initiating potential, tolerance to chemotherapy and invasion capacity, we made use of a lentiviral barcoding strategy to trace the output of individual cells in vivo (Fig. 1a)15,16,22. Freshly dissociated cells from primary (GBM-719, -729, -735, -743, and -754) and recurrent (GBM-742) GBMs were transduced with a library of biologically neutral barcodes prior to their transplantation into the brains of NOD/SCID/IL-2γ-/- (NSG) mice within 24 hours of isolation, a time window below the doubling time of GSCs (Extended Data Fig. 1a-c). For each tumour sample, spiked-in controls were included to estimate relative clone sizes from barcode read counts (Extended Data Fig. 1d-f). Given the high library diversity (~2×10⁵) and limiting transduction efficiency across experiments (<38%), the majority of labelled cells were expected to carry unique barcodes (Extended Data Fig. 1g-h and Supplementary Theory 1).
Figure 1. Serial transplantation scheme and characterization of barcoded glioblastoma xenografts.
a, General transplantation scheme for barcoded xenografts derived from primary GBM tumour cells (GBM-719). b, Staining of a secondary GBM-719 xenograft with the indicated markers, scale bar = 100 μm. c, Tumour growth quantified as the estimated fold-change in cell number between injection and harvesting for different ipsilateral derived GBM-719 xenografts. Lines indicate serial transplantation trajectories. d, Proportional Venn diagrams depicting the number of barcoded clones unique to each passage or shared between passages for the indicated experiment.
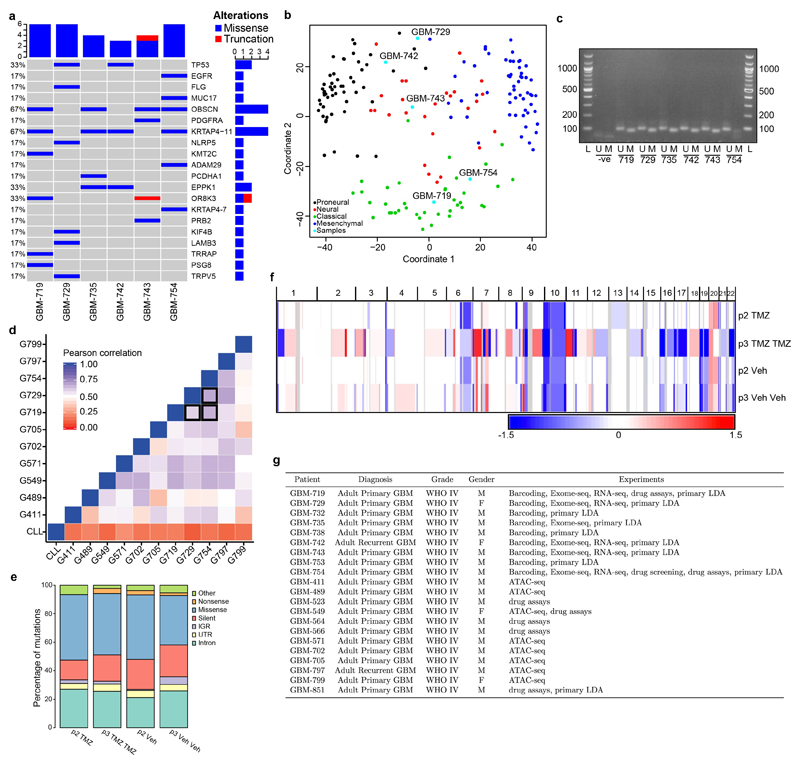
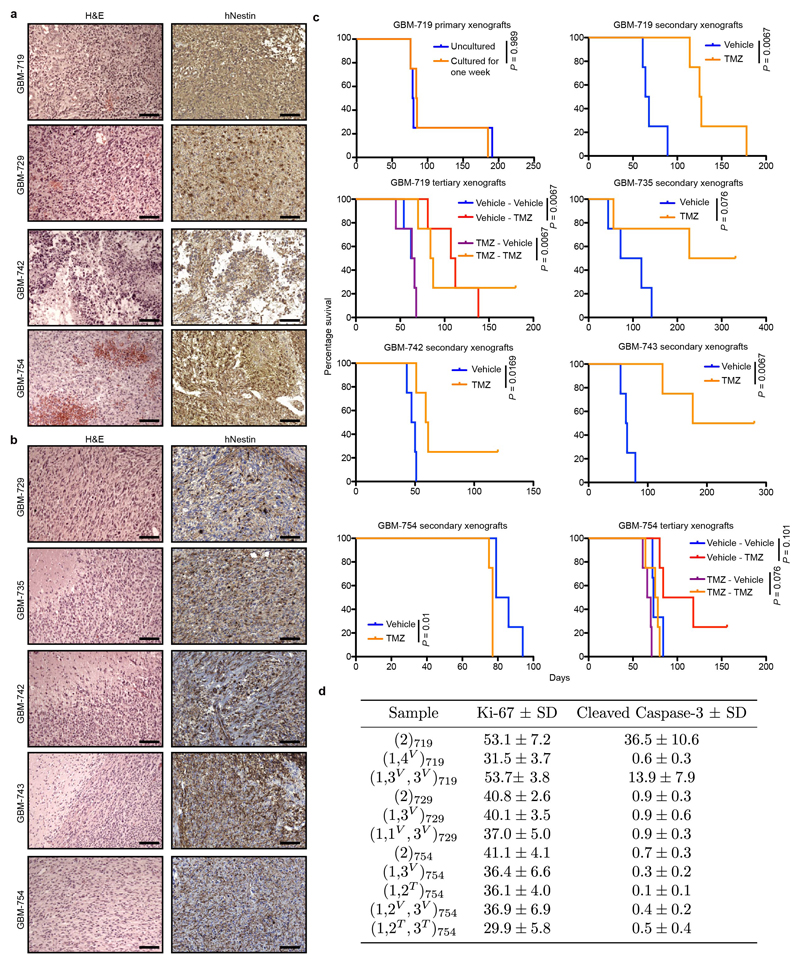
Exome and RNA sequencing of primary tumours identified mutations in common GBM-associated genes (TP53, EGFR, PDGFRA) and signatures of the Classical and Proneural transcriptional subgroups (Extended Data Fig. 2a-b)20. Histologically, xenografts resemble human GBM and have abundant expression of the neural precursor marker nestin (Fig. 1b and Extended Data Fig. 3a-b)2. Consistent with the significant inter-patient heterogeneity of human GBM20,21, tumours generated from different primary samples differed in proliferative activity, apoptosis rates, growth rates and response to temozolomide (TMZ) chemotherapy (Extended Data Fig. 3c-d). In the following, we focused first on GBM-719 for which the largest xenograft data set was available, using xenografts from other GBMs to test for consistency in their properties.
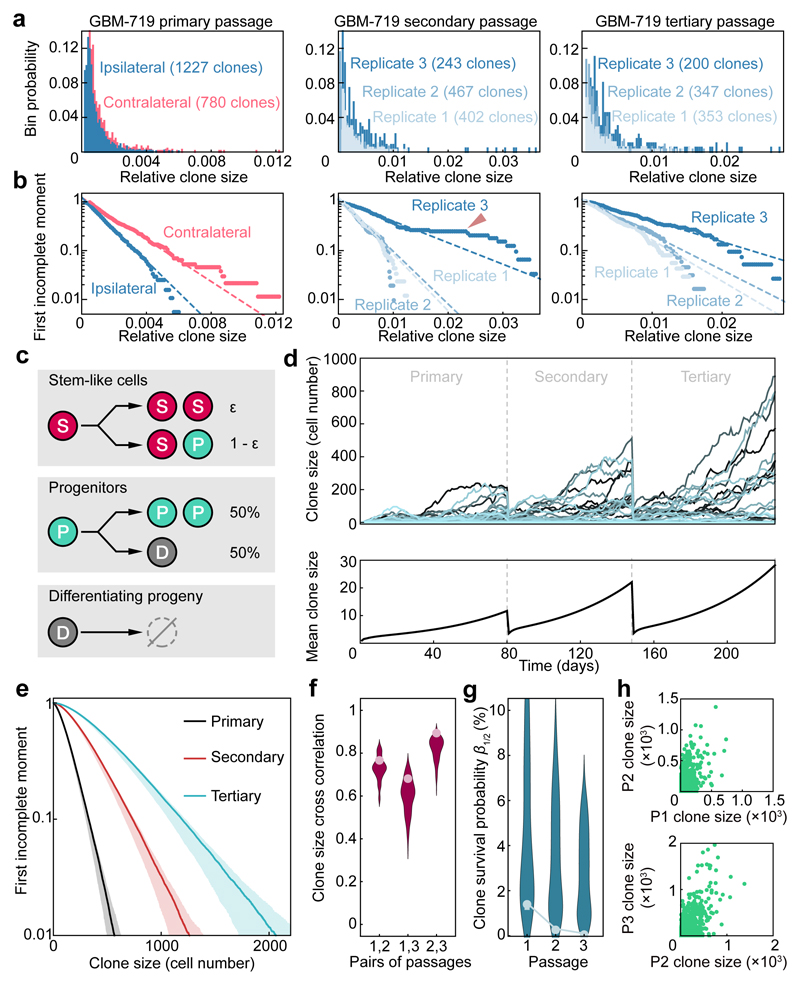
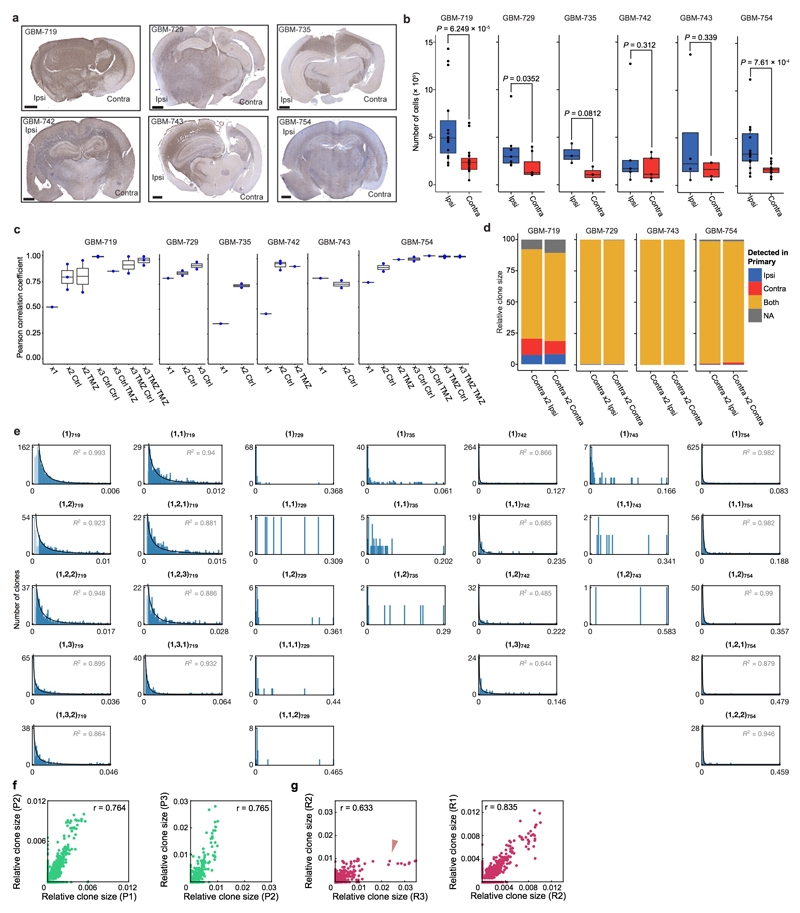
Growth of GBM cells in vivo was concomitant with expansion in both the injected (ipsilateral) and non-injected (contralateral) hemispheres (Fig. 1c and Extended Data Fig. 4a-b). For GBM-719, 1,532 clones (derived from ~3% of barcoded cells) expanded above the detection threshold, with 475 present in both hemispheres. The sizes of these “surviving” clones were broadly distributed, with the majority remaining small (Fig. 2a). A further, smaller reduction in clone number was observed upon serial passaging, with a fraction becoming apparent only in the second passage, indicating that some clonogenic cells did not reach the detection threshold within the first passage (Fig. 1d). These observations suggest that the primary GBM population contained only a subset of cells with continuous tumour-maintaining activity (GSCs). However, the abundance of surviving clones and broad size distributions demonstrate that tumour growth does not rely on the activity of a few tumour-initiating cells (Fig. 2a and Extended Data Fig. 4e)4,5.
Figure 2. Clonal dynamics of GBM is consistent with a conserved proliferative hierarchy.
a, Clone size distributions of xenografts derived from GBM-719 cells across different passages. For the primary passage, distributions for the ipsilateral (blue) and contralateral sides (red) are shown. For the secondary and tertiary passages, distributions for the ipsilateral side from different replicate experiments are shown (shades of blue). b, First incomplete moment of the corresponding clone size distributions shown in panel (a), displayed on a logarithmic scale (Supplementary Theory 2). Dashed lines show exponentials as a guide for the eye. The red arrowhead indicate deviations from exponential behaviour due to a small number (<4%) of outlier clones. c, A minimal model of tumour growth based on a three-component hierarchy involving transitions from a slow-cycling stem-like compartment (S) to a more rapidly cycling progenitor population (P) to a non-dividing compartment (D). Following S cell divisions, a fraction, ε, result in symmetric fate outcome while the remainder lead to asymmetric fate. With equal probability, P cells divide symmetrically or give rise to D cells which, in turn, rapidly undergo apoptosis. d, Representative clone size trajectories computed for the model shown in (c). Different curves correspond to different clones across three serial passages, along with the average over all trajectories, with the S cell division rate of 0.15/ day, the P cell division rate of 1/day, the D cell apoptosis rate of 0.5/day and ε = 15% (for details, see Supplementary Theory 5). e, First incomplete moment of the clone size distribution across passages derived from 2×10⁶ simulated clone trajectories. The shaded areas show the regions within which 95% of the respective curves fall for repeated simulations with 5×10⁴ clones each. For each passage, the first incomplete moment follows an approximate exponential size dependence. Parameters as in panel (d). f, Clone size correlation for different passages in the model (distributions) and from representative xenografts derived from GBM-719 cells (data points). Distributions show model results within the biologically plausible parameter range (see Supplementary Theory, Table S2). See Supplementary Theory, Figure S3 for other patients. g, Fraction of initially injected clones growing above half of the characteristic clone frequency n0/2 for the same datasets as in (f) (see Supplementary Theory 6.3). See Supplementary Theory, Figure S2 for other patients. h, Simulated examples of clone size correlations across successive serial passages. Parameters are as in panel (d).
GBM clones are uniformly invasive
We next sought to define the invasive capacity of barcoded GBM clones by comparing clonal composition between the ipsilateral and contralateral hemispheres, the latter representing expansion of invasive cells (Extended Data Fig. 4a-b). In all experiments, the sizes of clones in both hemispheres were either highly correlated from the first passage on, or became highly correlated soon thereafter (Extended Data Fig. 4c), indicating that clonal behaviour in the contralateral side reflected their behaviour in the ipsilateral side. We then asked whether clones that were exclusively found in the contralateral side have a higher invasive capacity. However, xenografts derived from re-injecting contralaterally-harvested cells were primarily composed of clones that had been present in both hemispheres in the previous passage (Extended Data Fig. 4d). It follows that self-renewal and invasion capacity are coincident properties of the same labelled clones within each human GBM. Spatial separation of genetically distinct clones may therefore represent transient variations in local dispersal, which become amplified over time6,10,23,24.
Neutral hierarchical growth dynamics
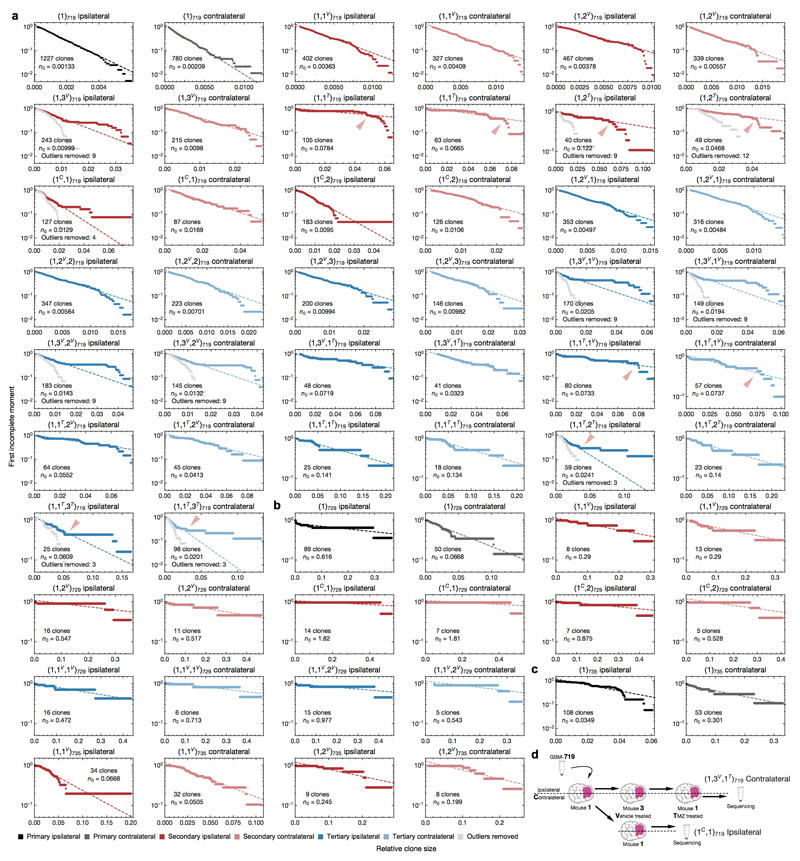
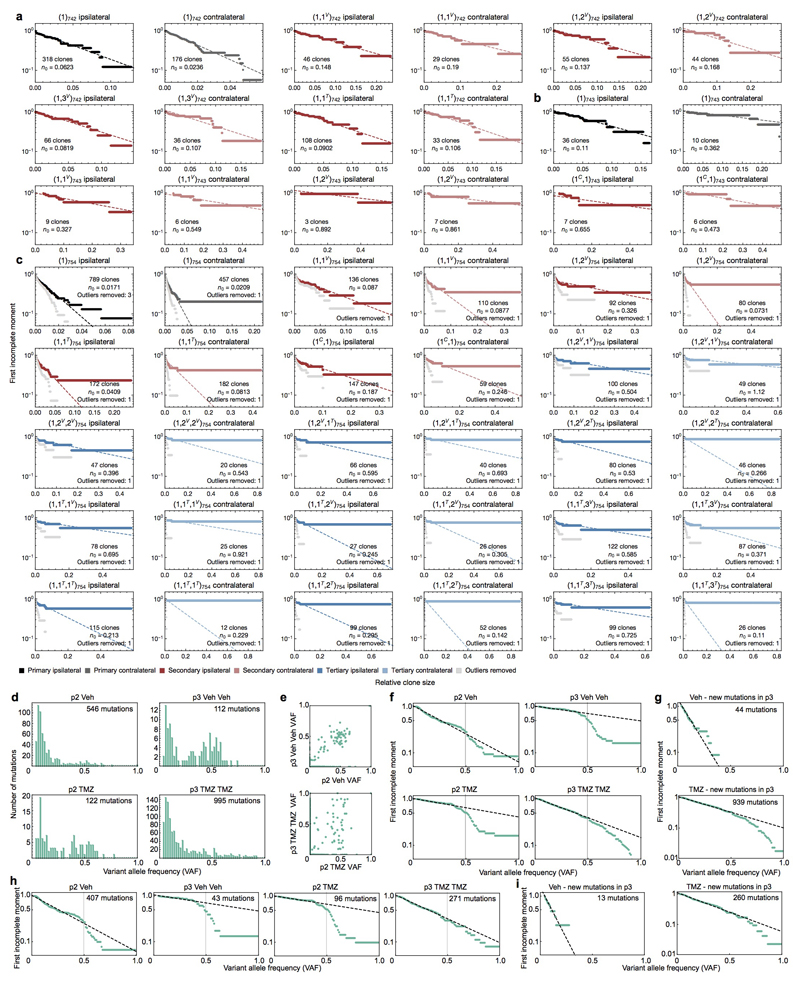
A consistent feature of clone sizes across all passages and between hemispheres was their broad distribution (Fig. 2a and Extended Data Fig. 4e). Such functional heterogeneity could derive from engrained “fitness” advantages of some tumour-initiating cells over others, resulting from heritable genetic or epigenetic alterations8. Alternatively, variation in clonal output could result from “neutral” processes, reflecting the chance outcome of cell fate decisions obtained within an equipotent tumour-initiating population11,12. To discriminate between these possibilities, we looked for evidence of equipotency in the distribution of relative clone size. Remarkably, the distributions were found to be consistent with a negative binomial dependence — as evidenced by the exponential form of the first incomplete moment (Fig. 2b, Extended Data Figs. 5-6 and Supplementary Theory 2). Some xenografts also showed a minority (<4%) of large clones that lay outside this distribution (Fig. 2b and Extended Data Fig. 4g, red arrowhead), a feature returned to below. With clone size distributions across all 6 patient tumour samples largely characterized by just one parameter (the constant of the exponential), these observations suggest that GBM intra-tumoural heterogeneity derives primarily from the growth characteristics of a single equipotent cell population rather than an engrained differential fitness of subclones, an unexpected finding given the inter- and intra-patient genomic diversity of GBM and the ongoing genomic evolution observed in xenografts (Extended Data Fig. 5-6 and Supplementary Theory 3)6,7,20,21.
How could a negative binomial clone size distribution arise? Such behaviour is common in population dynamics and is typically associated with processes involving the sporadic creation of “individuals” —cells in this case— that, when born, undergo a stochastic process, selecting with equal probability between duplication (birth) or loss (death) and supported by a slow influx from another compartment (immigration) – a “critical birth-death process with immigration” (Supplementary Theory 3)25. In the tumour context, this behaviour translates to a proliferative hierarchy in which a slow-cycling stem cell-like population undergoes serial rounds of invariant asymmetric cell division, giving rise to a self-sustaining, rapidly-dividing progenitor population that generates short-lived non-proliferative progeny (Fig. 2c and Supplementary Theory 4).
But, is a mode of strictly invariant asymmetric cell division plausible? Since most barcoded clones survive dilution through serial passaging (Fig. 1d), individual clones at the end of the previous passage are likely to host a multiplicity of stem-like cells. Cell division must therefore also lead to symmetric fate outcomes so that their numbers can accumulate in individual clones. However, so long as asymmetric fate outcomes predominate, the resulting clone size distributions do not depart significantly from the observed negative binomial form (Supplementary Theory 4).
Based on a quantitative analysis of clone size, we propose that human GBM growth in xenografts is defined by a minimal model involving a defined GSC hierarchy (Fig. 2c and Supplementary Theory 4). To challenge the model and define the minimal set of parameters governing GBM growth, we used stochastic simulations to compare the predicted clonal dynamics with experimental findings (Fig. 2d-h and Supplementary Theory 5). In assessing the viability of the model, we constrained the simulation using a range of biologically plausible parameters based on the overall expansion of xenografts along with the proportion of actively dividing and apoptotic cells (Extended Data Fig. 3d and Supplementary Theory 5). Over the determined range of parameters, simulations revealed an approximately negative binomial clone size distribution across all serial passages (Fig. 2e), consistent with experiment. Using the unique barcoding of clones, we assessed correlations of clone size and survival likelihoods across serial passages. Remarkably, the minimal model captured the range of data to a high level of accuracy (Fig. 2f-h, Extended Data Fig. 4f and Supplementary Theory 6). Quantitative analysis of clone size distributions for GBM-742 and GBM-754, in addition to independent analysis of mutational data derived from GBM-719 xenografts, also provided strong evidence in favour of the same paradigm (Extended Data Fig. 6d-i, Supplementary Theory 6-7).
Two divergent GSC phenotypes
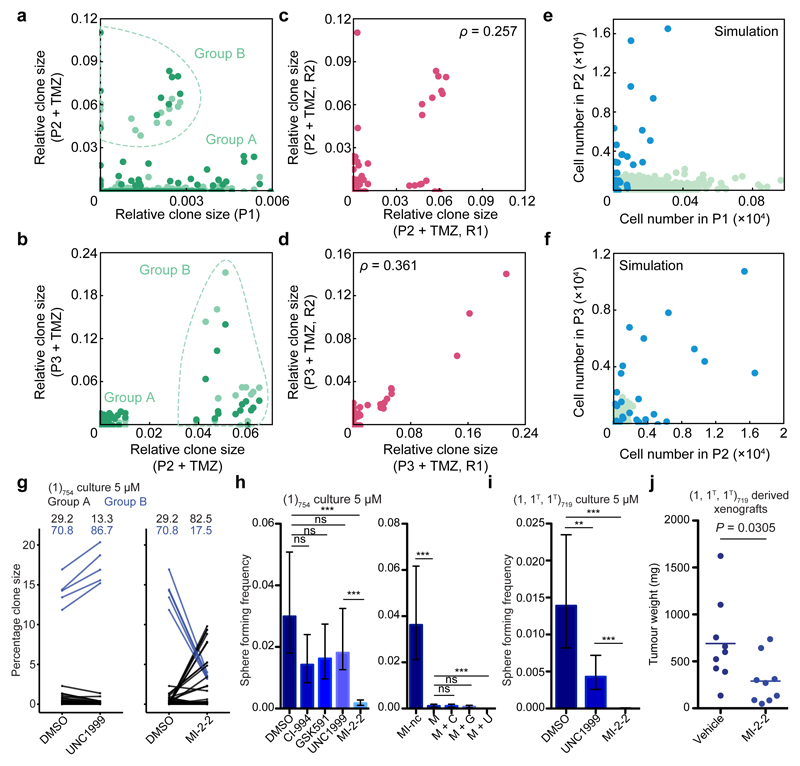
Building on the findings above, we next sought to define the effect of TMZ chemotherapy on clonal dynamics. Analysis of the TMZ-treated xenografts clearly distinguished two divergent behaviours: A majority of clones were sensitive to TMZ treatment and present at low abundances (“Group A” in Fig. 3a,b), while a minority were present at frequencies almost an order of magnitude greater, consistent with treatment resistance (“Group B” in Fig. 3a,b). Comparison of the TMZ-treated secondary xenografts with the untreated primary xenograft indicated that the sizes of sensitive clones were largely uncorrelated across serial passages, whereas the sizes of the resistant clones appeared to be positively correlated (Fig. 3a). Interestingly, the further coincidence of distinct resistant clones in drug-treated replicate xenografts (Figs. 3c,d) suggests that the resistance phenotype can be pre-existing within the parental population.
Figure 3. Chemotherapy reveals clonal transformations in GBM.
a, Correlation of clone sizes for the primary, untreated xenograft with secondary xenografts treated with TMZ (light and dark dots indicate two replicate secondary xenografts). Light dataset – Group A: 1255 data points, Group B: 15 data points; dark dataset – Group A: 1228 data points, Group B: 10 data points. b, Correlation of clone sizes for a secondary TMZ-treated xenograft (light dots in panel (a)) with tertiary TMZ-treated xenografts, light and dark dots indicate two replicate tertiary xenografts. Light dataset – Group A: 95 data points, Group B: 15 data points; dark dataset – Group A: 117 data points, Group B: 15 data points. c, Correlation of the two replicate secondary xenografts shown in (a) with Spearman’s rho indicated. d, Correlation of the two replicate tertiary xenografts shown in (b) with Spearman’s rho indicated. e-f, Correlation of clone sizes obtained from simulations with a subset of clones being resistant to cell death (blue dots) and the remaining clones following unperturbed dynamics (green dots) for a primary and secondary passage (e) and a secondary and tertiary passage (f) (see Supplementary Theory 6.5). The S cell division rate is set at 0.1/day, the P cell division rate is 1.5/day, ε = 10%, and the apoptosis rate is set at 0.7/day with a 0.5% chance of each clone to show resistance to apoptosis (see Supplementary Theory, Table S3). g, Selectivity of UNC1999 and MI-2-2 for group A and B clones respectively, representative of 2 technical replicate experiments. Shown are relative clone sizes after DMSO treatment, or regrowth following selection with indicate compounds. The indicated values are clone sizes for groups A (black) and B (blue), lines connect the same barcoded clone under different conditions. h, Reduction of self- renewal ability upon treatment with epigenetic compounds alone and in combination as assessed by limiting dilution analysis (LDA), representative of 3 independent experiments (MI-nc: inactive control for MI-2-2, M: MI-2-2, C: CI-994, G: GSK591, U: UNC1999). P = 0.0663 for DMSO vs. CI-994, 0.132 for DMSO vs. GSK591, 0.216 for DMSO vs. UNC1999, 5.74×10⁻¹³ for DMSO vs. MI-2-2, 4.11×10⁻¹⁸ for MI-nc vs. M, 1 for M vs. M+C, 0.432 for M vs. M+G, 8.53×10⁻⁸ for M vs. M+U. i, MI-2-2 abrogates self-renewal in TMZ-transformed GBM-719 population, representative of 3 independent experiments. P = 3.73×10⁻³ for DMSO vs. UNC1999, 1.16×10⁻²⁷ for DMSO vs MI-2-2, 1.61×10⁻¹⁶ for UNC1999 vs MI-2-2. All LDA results are representative of 3 independent experiments with the remaining experiments presented in Extended Data Fig. 9. Analysis of all LDA results was performed using ELDA software34, error bars represent 95% confidence interval (ns P > 0.05, * P ≤ 0.05, ** P ≤ 0.01, *** P ≤ 0.001). j, MI-2-2 inhibits tumour growth in subcutaneous xenografts derived from TMZ-transformed GBM-719 cells, n = 9 tumours per group, two-sided unpaired t-test. The horizontal line indicates the mean tumour weight of each experimental group.
Based on this classification, we analysed the clone size distribution within each group separately. Sensitive clones maintained an approximate negative binomial dependence (Extended Data Fig. 5a) suggesting that, in sharp contrast with the mouse model3, TMZ-treatment leaves the proliferative hierarchy of the majority of tumour cells unperturbed. In contrast, resistant clones could not be captured by the same dynamics (Extended Data Fig. 5a, red arrowheads). However, with an additional acquired resistance to apoptosis, we found that the original model parameters were sufficient to explain the scale of the observed behaviours of resistant clones (compare Fig. 3a to Fig. 3e and Fig. 3b to Fig. 3f, Supplementary Theory 6.5). Importantly, large outlier clones can be detected even in untreated tumours across different GBM cases (Extended Data Figs. 5-6). Taken together, these results demonstrate that a minority of clones in pre- and post-treatment tumours conform to perturbed growth dynamics, and may constitute a key driver in the clonal evolution of human GBM. We define these outliers as “Group B” clones, and the majority that behave according to the negative binomial distribution as “Group A”.
Epigenetic targeting of distinct GSCs
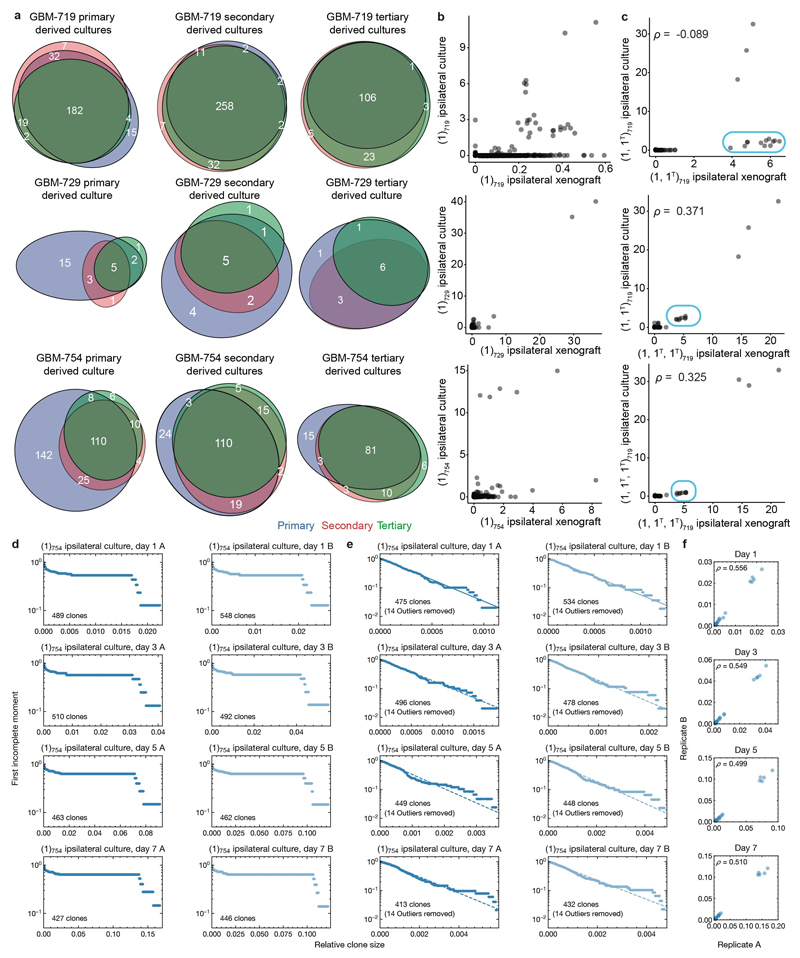
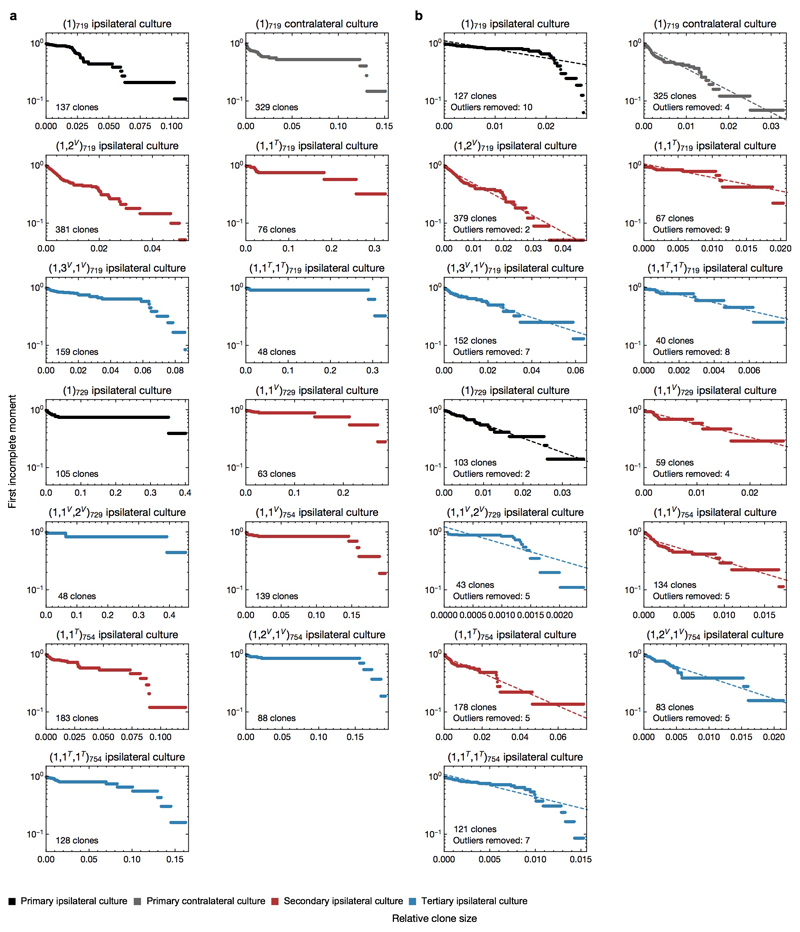
We next questioned whether the Group B phenotype exposes new therapeutic vulnerabilities. Primary GSC cultures26 established from xenografts maintained a mixture of clones seen in primary, secondary and tertiary passages (Extended Data Fig. 7a-b). Moreover, both cultures and xenografts derived from the same parental TMZ-treated xenograft were relatively concordant in their relative clonal abundances (Extended Data Fig. 7c), suggesting that GSC cultures can recapitulate their growth behaviour in vivo. Strikingly, Group A clones from the GBM-754 primary xenograft-derived culture model (1)754, for which the most data was available, maintained a negative binomial distribution after an approximate 7-fold expansion in vitro, consistent with maintenance of the proliferative hierarchy under culture conditions (Extended Data Fig. 7d,e). This included the correlations of outlier clones between replicates (Extended Data Fig. 7f), corroborating the previously observed presence of Group B clones in untreated xenografts (Fig. 2b). Most cultures derived from other xenografts also adhered to a negative binomial distribution once the largest outliers were removed (Extended Data Fig.8a-b).
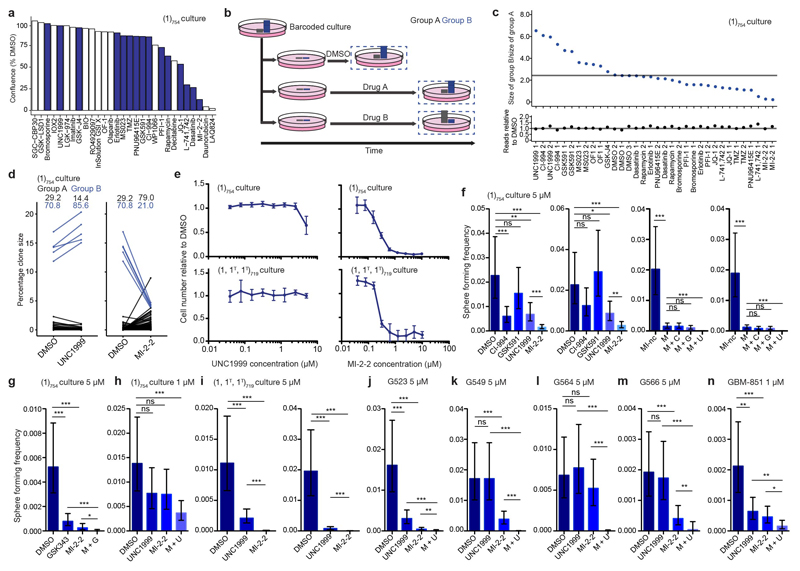
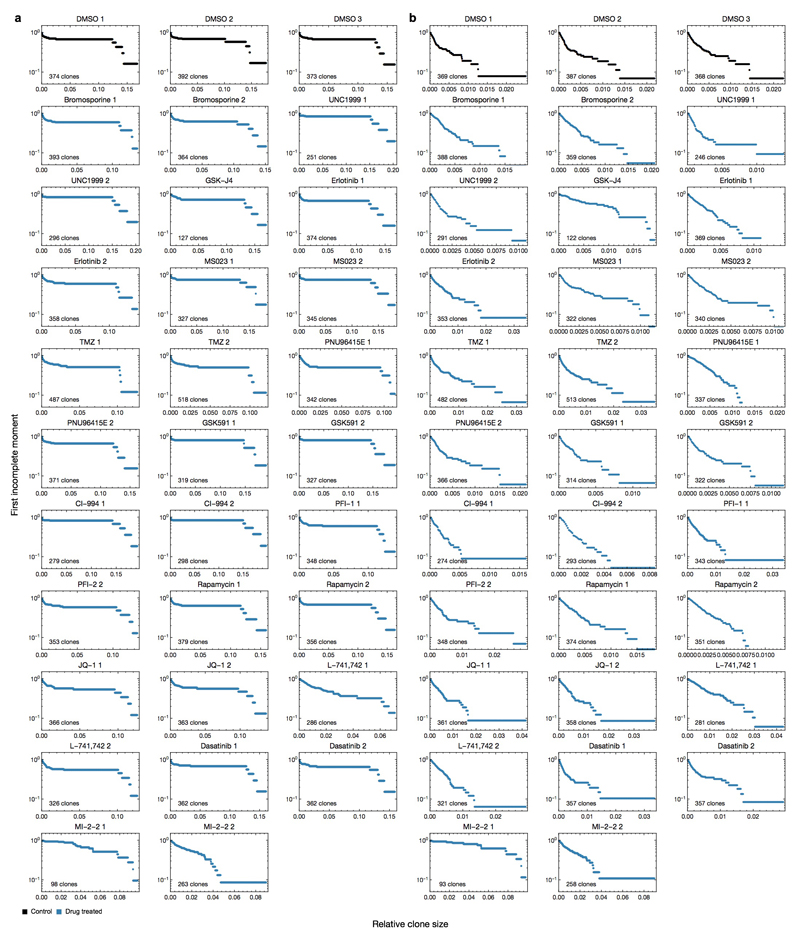
We next combined in vitro drug selection of the (1)754 culture with barcode sequencing to determine whether resistance arises proportionately from each clone type (Extended Data Fig. 9a,b). GSC cultures analyzed by assay for transposase-accessible chromatin with high-throughput sequencing (ATAC-seq) identified a shared epigenetic state, leading us to focus on epigenetic targets (Extended Data Fig. 2d). Cells subjected to drug selection were allowed to repopulate to a similar density as control, in order to model tumour regrowth following therapy (Extended Data Fig. 9b). The drug treatments induced a range of changes to clonal dominance patterns (Extended Data Fig. 9c). However, the same negative binomial distribution was maintained in most cases, indicating that the underlying dynamics of Group A clones are largely unperturbed (Extended Data Fig. 10a,b). Intriguingly, a Menin-Mixed Lineage Leukemia (MLL) interaction inhibitor (MI-2-2)27–29 was selective against Group B clones, as repopulation following selection derived primarily from Group A clones (Fig. 3g, Extended Data Fig. 9d). By the same logic, and consistent with the requirement for Enhancer of zeste homolog 2 (EZH2) in GSC maintenance30, we found that an EZH2 inhibitor (UNC1999) was instead selective against Group A clones (Fig. 3g, Extended Data Fig. 9d). MI-2-2 is growth inhibitory in a polyclonal context, consistent with its specificity for the highly proliferative clone type (Extended Data Fig. 9e). Targeting both clone types by combining MI-2-2 with an EZH2 inhibitor (UNC1999 or GSK343) was uniquely sufficient to eradicate self-renewal (Fig. 3h, Extended Data Fig. 9f-h). Consistent with TMZ-induced selection for Group B clones in GBM-719, MI-2-2 treatment of TMZ-transformed cells eradicated self-renewal and reduced tumour growth in vivo (Fig. 3i-j, Extended Data Fig. 9i). Efficacy of the UNC1999/MI-2-2 combination was mirrored in 4 additional models (G523, G549, G564, G566) even when single drug treatments did not affect self-renewal, and in GBM-851 primary cells (Extended Data Fig. 9j-n). While Menin-MLL inhibition is especially effective in targeting paediatric glioma that carry histone 3 variant H3.3 mutations27, these findings warrant further pre-clinical studies of MI-2-2 in advanced, post-treatment adult GBM.
Discussion
Efforts to define the identity and behaviour of tumour-maintaining cells in human GBM have focused on genetic intra-tumoural heterogeneity9,31. Yet the majority of subclonal mutations in cancer may be biologically neutral14,32. At first sight, the emergence of clonal heterogeneity suggests that the evolving mutational landscape may confer a range of fitness advantages on GSCs. However, quantitative analysis of clone sizes indicates that clonal heterogeneity can be explained by robust features of a conserved proliferative hierarchy. In this model, heterogeneity in clonal expansion does not derive from genetic diversity but, in common with other cancer models11,12, emerges as the predictable outcome of chance fate decisions made by GSCs and their progeny. Given the correlation of human GBM cell transcriptomes with those of normal outer radial glial cells and intermediate progenitors33, these results suggest that the initiation of human GBM may be associated with the aberrant reactivation of a surprisingly normal developmental program.
While the majority of GSC clones adhere to neutral, hierarchical growth dynamics (Group A), we identified a minority subset that showed a different growth characteristic (Group B). It is currently unknown whether Group B clones share common molecular features between different patient tumours. Intriguingly, however, these dominant clones are sensitive to an epigenetic drug (MI-2-2) previously shown to be effective in H3.3 mutant paediatric glioblastoma27. Together with the fact that adult GSCs can converge into an epigenetic state reminiscent of paediatric GBM due to selective downregulation of H3.3 expression29, it is tempting to speculate that Group B clones in adult GBM may share additional epigenetic features of H3.3 mutant paediatric GBM cells and H3.3-low adult GSCs29. Alternatively, Group B clones may arise from Group A clones after a gradual accumulation of genetic mutations that alters their mode of growth7. Future studies should target the origin and functional properties of these clones, and assess whether they contribute disproportionately to GBM malignancy.
Methods
No statistical methods were used to predetermine sample size. For animal studies, all animals were included for the analysis. Animals from separate litters were randomly and evenly divided between experimental groups to control for animal age. The investigators were not blinded to group allocation during the experiments and outcome assessment.
Processing of patient samples
GBM tumour samples were obtained from consenting patients, and all procedures are approved by the Research Ethics Boards at The Hospital for Sick Children (Toronto, Canada), St. Michael’s Hospital (Toronto, Canada) and Toronto Western Hospital (Toronto, Canada). Following surgical resection, tumour specimens were immediately subjected to mechanical and enzymatic dissociation in artificial cerebrospinal fluid (aCSF) containing trypsin, hyaluronidase, and kyneuric acid at 37°C. GSC culture models were established as previously described26, and matched to primary GBM tumour tissue by microsatellite genotyping (The Centre for Applied Genomics, Hospital for Sick Children). GSC cultures were also randomly and intermittently tested for mycoplasma contamination by PCR. For barcoding experiments, primary single-cell suspensions were subjected to magnetic bead depletion to remove cells expressing human CD31 and CD45 markers (130-091-935, 130-045-801, Miltenyi Biotech), thereby excluding endothelial and hematopoietic lineages prior to lentiviral barcoding.
Exome sequencing
For the primary tumour samples, DNA was extracted from flash frozen primary tumour pieces using an AllPrep DNA/RNA Mini Kit (80204, Qiagen). Genomic DNA libraries from which exons are captured were constructed according to British Columbia Cancer Agency Genome Sciences Centre plate-based and paired-end library protocols on a Microlab NIMBUS liquid handling robot (Hamilton, USA). Briefly, 1 µg of high molecular weight genomic DNA was sonicated (Covaris LE220) in 62.5 µL volume to 250-350 bp. Sonicated DNA was purified with PCRClean DX magnetic beads (Aline Biosciences). The DNA fragments were end-repaired, phosphorylated and bead purified in preparation for A-tailing using a custom NEB Paired-End Sample Prep Premix Kit (New England Biolabs). Illumina sequencing adapters were ligated overnight at 16°C and adapter ligated products bead purified and enriched with 6 cycles of PCR using primers containing a hexamer index that enables library pooling. 200 ng for each of 6 different libraries were pooled prior to whole exome capture using Agilent SureSelect All Exon V6+UTR probes. The pooled libraries were hybridized to the RNA probes at 65°C for 24 hours. Following hybridization, streptavidin-coated magnetic beads (Dynal, MyOne) were used for exome capture. Post-capture material was purified on MinElute columns (Qiagen) followed by post-capture enrichment with 6 cycles of PCR using primers that maintain the library-specific indices. The pooled libraries were sequenced on Illumina Hiseq 2500 using V4 sequencing chemistry at PE125 following Illumina recommendations (Canada’s Michael Smith Genome Sciences Centre, BC Cancer Agency).
For the GBM-719 xenograft samples, GFP positive barcoded cells were isolated by FACS (MoFlo Astrios, Beckman Coulter) from in vitro expanded cells (p3 TMZ TMZ) or directly from dissociated tumours (all remaining samples) and subjected to DNA extraction using a PrepGEM DNA extraction kit (PTI0050, ZyGEM) prior to whole-genome amplification using a REPLI-g Mini kit (150023, Qiagen). 200 ng of DNA per sample was used to generate cDNA libraries following Agilent SureSelect XT target enrichment kit as per protocol. 750 ng from each cDNA library was then hybridized for 24 hours using the All Exon V5 capture baits from Agilent. Captured, enriched libraries were size validated using the Agilent Bioanalyzer DNA high sensitivity chip and library concentration was validated by qPCR (Kapa Technologies). All libraries were normalized to 10 nM and diluted to 2 nM before being denatured with 0.1N NaOH. Denatured library pools were diluted for a final time down to 14 pM of pooled libraries and loaded onto Illumina cBot for cluster generation. The clustered flow cell was sequenced paired-end 100 cycles using an Illumina HiSeq 2000 (Princess Margaret Genomics Centre, University Health Network).
For the germline reference sample, DNA was extracted from the patient’s whole blood using a DNeasy Blood & Tissue kit (69504, Qiagen). The library was prepared using Agilent SureSelect Human Exome Library Preparation V4 kit for paired end sequencing on a HiSeq 2500 platform. In brief, 750 ng of genomic DNA was fragmented to 200-bp on average using a Covaris LE220 instrument. Sheared DNA was end-repaired and the 3' ends adenylated prior to ligation of adapters with overhang-T. Genomic library was amplified by PCR using 10 cycles and hybridized with biotinylated probes that target exonic regions; the enriched exome libraries were amplified by an additional 8 cycles of PCR. Exome libraries were validated on a Bioanalyzer 2100 DNA High Sensitivity chip (Agilent Technologies) for size and by qPCR using the Kapa Library Quantification Illumina/ABI Prism Kit protocol (KAPA Biosystems) for quantities. Exome libraries were pooled and sequenced with the TruSeq SBS sequencing chemistry using a V4 high throughput flowcell on a HiSeq 2500 platform following Illumina's recommended protocol (The Centre for Applied Genomics, Hospital for Sick Children).
Exome sequencing analysis of primary tumours
For the primary tumour samples, Fastq files were aligned to the human reference genome hg38 with BWA (0.7.9a, -M option)35. The BAM files were further processed using MarkDuplicates (Picard Tools 2.6.0), indel realignment (GATK 3.6 RealignerTargetCreator and IndelRealigner) and BaseRecalibration (GATK 3.6 BaseRecalibrator and PrintReads)36. Samtools 1.3.1 mpileup (-B, -q10 -d10000000 options)37 was run on the processed BAM files to generate the input to Varscan. Varscan (2.4.2), mpileup2cns was applied to call snp and indels in each sample (--p-value 0.01 --min-var-freq 0.03, other default parameters)38. The calls were annotated with Annovar (20160201, using refGene genes)39. To identify the important somatic variants, the calls were further filtered to include only the following annotated events: nonsynonymous_SNV, stopgain, stoploss and frameshift_deletion. In addition, calls were removed if they were in the dbSNP database40 as part of the snp147Common file downloaded from the UCSC server which contains uniquely mapped variants that appear in at least 1% of the population or are 100% non-reference. Therefore, the flagged SNPs (uniquely mapped variants, excluding Common SNPs, that have been flagged by dbSNP as "clinically associated") were not removed. In addition, calls were further filtered out if they had an AF>0.001 in ExAC (exac03, ExAC_ALL)41 or 1000 Genome Project (1000g2015aug_all)42. Subclonal mutations with variant allele frequency < 0.2 were excluded.
Exome sequencing analysis of xenografts
For the GBM-719 xenograft samples, read pairs were aligned to the hg19 reference sequence using the Burrows-Wheeler Aligner (v0.7.12)35, and samples were demultiplexed using Picard tools (v1.140). Data were then sorted and duplicate marked using Picard and SAMtools37. Local realignment around insertions or deletions (indels) and base-quality score recalibration was performed using the Genome Analysis toolkit (v3.4-46)36. QualiMap (v2.1)43 was used to evaluate resulting sequencing alignment data. To correct for coverage discrepancies between Agilent V4 (germline reference sample) and V5 (xenograft samples) capture baits, an intersection of common regions was performed using bedtools (v2.26.0)44. Common regions with 0X coverage in the blood or greater than 500X coverage in either reference or xenografts were removed from subsequent analysis.
The MuTect (v.1.15) algorithm45 was used for somatic variant calling and false-positive filtering. Resulting variants were annotated using Oncotator (v.2.8.0)46, including common databased variants (ClinVar47, 1000 Genomes (phase 1 variant set)48, dbSNP (build 138)40, COSMIC (v71)49). Germline variants found in the 1000 Genomes Project, dbSNP build 138 were excluded. Cellularity, ploidy and allele-specific copy number was estimated from normal-xenograft pairs using the Sequenza algorithm (v2.1.2)50. Cutoffs of log 2 copy number ratios between -0.35 and +0.3 were set to assign genome losses and gains, respectively.
RNA sequencing
RNA was extracted from the same flash frozen primary tumour pieces as for exome sequencing using a Qiagen AllPrep DNA/RNA Mini Kit (80204, Qiagen). Qualities of total RNA samples were determined using an Agilent Bioanalyzer RNA Nanochip or Caliper RNA assay and arrayed into a 96-well plate (Thermo Fisher Scientific). Polyadenylated (PolyA+) RNA was purified using the NEBNext Poly(A) mRNA Magnetic Isolation Module (E7490L, NEB) from 500 ng total RNA normalized in 35 µL for DNase I-treatment (1 Unit, Invitrogen). DNase-treated RNA was purified using RNA MagClean DX beads (Aline Biosciences, USA) on a Microlab NIMBUS liquid handler (Hamilton Robotics, USA). Messenger RNA selection was performed using NEBNext Oligod(T)25 beads (NEB) with incubation at 65°C for 5 minutes followed by snap-chilling at 4°C to denature RNA and facilitate binding of poly(A) mRNA to the beads. mRNA was eluted in 36 µL of Tris Buffer.
First-strand cDNA was synthesized from the purified polyadenylated messenger RNA using the Maxima H Minus First Strand cDNA Synthesis kit (Thermo-Fisher, USA) and random hexamer primers at a concentration of 5 µM along with a final concentration of 1 µg/uL Actinomycin D, followed by PCR Clean DX bead purification on a Microlab NIMBUS robot (Hamilton Robotics, USA). The second strand cDNA was synthesized following the NEBNext Ultra Directional Second Strand cDNA Synthesis protocol (NEB) that incorporates dUTP in the dNTP mix, allowing the second strand to be digested using USER™ enzyme (NEB) in the post-adapter ligation reaction and thus achieving strand specificity.
cDNA was fragmented by Covaris LE220 sonication for 55 seconds at a “Duty cycle” of 20% and “Intensity” of 5 to achieve 200-250 bp average fragment lengths. The paired-end sequencing library was prepared following the BC Cancer Agency Genome Sciences Centre strand-specific, plate-based library construction protocol on a Microlab NIMBUS robot (Hamilton Robotics, USA). Briefly, the sheared cDNA was subject to end-repair and phosphorylation in a single reaction using an enzyme premix (NEB) containing T4 DNA polymerase, Klenow DNA Polymerase and T4 polynucleotide kinase, incubated at 20°C for 30 minutes. Repaired cDNA was purified in 96-well format using PCR Clean DX beads (Aline Biosciences, USA), and 3’ A-tailed (adenylation) using Klenow fragment (3’ to 5’ exo minus) and incubation at 37°C for 30 minutes prior to enzyme heat inactivation. Illumina PE adapters were ligated at 20°C for 15 minutes. The adapter-ligated products were purified using PCR Clean DX beads, then digested with USER™ enzyme (1U/µL, NEB) at 37°C for 15 minutes followed immediately by 13 cycles of indexed PCR using Phusion DNA Polymerase (Thermo Fisher Scientific Inc. USA) and Illumina’s PE primer set. PCR parameters: 98°C for 1 minute followed by 13 cycles of 98°C 15 seconds, 65°C 30 seconds and 72°C 30 seconds, and then 72°C 5 minutes. The PCR products were purified and size-selected using a 1:1 PCR Clean DX beads-to-sample ratio (twice), and the eluted DNA quality was assessed with Caliper LabChip GX for DNA samples using the High Sensitivity Assay (PerkinElmer, Inc. USA) and quantified using a Quant-iT dsDNA High Sensitivity Assay Kit on a Qubit fluorometer (Invitrogen) prior to library pooling and size-corrected final molar concentration calculation for Illumina HiSeq 2500 sequencing with paired-end 75 base reads (Canada’s Michael Smith Genome Sciences Centre, BC Cancer Agency).
RNA sequencing analysis
Fastq files were aligned with STAR (2.4.2a)51 on the hg38 human reference genome. FPKM values were computed with the DESeq2 fpkm function52 using the raw read count per gene (ReadsPerGene.out.tab file from STAR output), with size factor normalization and gene length derived from the hg38 GTF files used for the alignment. Subgroup classification was done using the simple GBM classifier53. This 32-gene classifier permits greater accuracy of GBM subgroup classification when using RNA-seq data instead of gene expression microarrays, as was performed in the original subgrouping study20. One of the 32 genes was not quantified in the analysis so the classifier was run using 31 genes.
Assay for transposase-accessible chromatin with high-throughput sequencing (ATAC-seq)
The open chromatin profiles of 11 GSC lines were defined using ATAC-seq as described previously54 and the prepared libraries were sequenced with 50 bp single end reads. Reads were mapped to hg19 using bowtie255 and peaks of open chromatin were called with MACS256. The correlation between samples was calculated as the Pearson correlation of the quantile-normalized signal across the peak catalogue. Here, the peak catalogue corresponds to all peak regions identified across the sample cohort, and the signal refers to the fold enrichment of the signal per million reads in a sample over a modelled local background. The chronic lymphocytic leukaemia (CLL) data used in this comparison was taken from a published dataset57, and the raw signal was normalized together with the GSC cohort.
MGMT promoter methylation assay
Primary tumour DNA was subjected to bisulfite conversion using the EZ DNA Methylation-Gold Kit (D5005, Zymo Research), and MGMT promoter methylation status was assessed using a two-step PCR protocol as previously described58. PCR products, including water control, were visualized by electrophoresis on a 2% agarose gel along with a 100 base pair ladder (NEB).
Lentiviral barcoding
The lentiviral barcode library has been described previously15. For viral transduction, 1×10⁶ primary GBM cells were seeded per plate onto 10-cm cell culture dishes that are coated with poly-L-ornithine (PLO, Sigma) and laminin (Sigma). The culture media consisted of serum-free Neurocult NS-A Basal (Stemcell Technologies) media, supplemented with 2 mmol/L L-gutamine, N2 and B27 supplements, 75 µg bovine serum albumin, 10 ng/mL recombinant human EGF (rhEGF), 10 ng/mL basic fibroblast growth factor (bFGF), and 2 µg/mL heparin (Sigma)26. Primary cells were incubated for approximately 12 hours at 37°C with lentivirus at an appropriate concentration to minimize multiple integration events. The concentration of lentivirus used was previously determined by titrating the library with a human fetal derived neural stem cell culture (HF7450), and assessing GFP positivity by flow cytometry (LSR II, BD Biosciences) 48 hours post-transduction. Barcoded cells were washed 5 times with PBS to remove remaining lentivirus, and immediately harvested by accutase (Sigma) treatment for orthotopic injection. A separate cell aliquot was cultured for 48 hours to allow for GFP expression, and transduction efficiency was determined by flow cytometry (LSR II, BD Biosciences).
Mouse xenografts
All mouse procedures were approved by The Hospital for Sick Children’s Animal Care Committee. For intracranial injections, animals were first anesthetized with isoflurane and given Ketoprofen as an analgesic. Tumour cells were then suspended in a 2 µl volume of PBS and injected in the forebrains of female NOD/SCID/IL-2γ-/- (NSG) mice of age 1-3 months with a Hamilton syringe and stereotactic device. The coordinates for orthotropic injections are 4 mm anterior of lambda, 2 mm to the right of the midline, and 3 mm deep. For secondary and tertiary xenografts, 25 mg/kg TMZ (Sigma) solubilized in Cremophor or vehicle controls were administered by gastric gavage for 5 consecutive days, 10 days post-injection. Mice were sacrificed for further processing once neurological symptoms are observed, or at experiment endpoint (6 months). Survival analysis was performed using GraphPad Prism 5 software.
Processing of xenografts
Forebrains were obtained from animals displaying neurological symptoms, and the two hemispheres (ipsilateral and contralateral) were dissected for processing separately. Each hemisphere was dissociated to single-cell suspensions as described in the “processing of patient samples” section. Cells were subsequently subjected to magnetic bead depletion to remove contaminating mouse cells (130-104-694, Miltenyi Biotech) prior to serial transplantation. Serial xenografts were always established without any intermediate culturing step. Either the ipsilateral or contralateral fraction from a single mouse was used to establish serial xenografts. Approximately 15% of xenograft cells were used without magnetic bead depletion for PCR amplification, library preparation and deep amplicon sequencing of barcodes. One xenograft per experimental group was set aside for histological analysis. Splinkerette PCR according to a previously published protocol59 was performed in order to identify unique barcode vector integration sites from xenografts.
Histopathology and immunohistochemistry
Mouse brains were fixed in 4% paraformaldehyde (PFA), washed in 70% ethanol and paraffin embedded. 6 μm coronal sections were generated for further analysis. Haematoxylin and Eosin staining was carried out according to manufacturer’s instructions (MHS32-1L, Sigma-Aldrich and 6766009, Thermo Scientific). Antibodies for immunohistochemistry include anti-Nestin (MAB5326, Millipore used at 1:500), anti-Ki-67 (M7240, Dako used at 1:500) and anti-Cleaved Caspase-3 (9661, Cell Signaling used at 1:500). A secondary anti-Mouse HRP antibody (A9044, Sigma 1:500) was used for detection using 3,3’-diaminobenzidine (DAB), Alkaline Phosphatase (AP) and Mouse on Mouse (M.O.M) detection kits (Vector Laboratories). Images were acquired using a 3DHistech Pannoramic 250 Flash II Slide Scanner and processed using Pannoramic Viewer software (3DHISTECH). Automatic detection and quantification of Ki-67 and Cleaved Caspase-3 staining was performed on six representative images per sample, using TMARKER software60.
Barcode sequencing
Spiked-in controls were generated using a human fetal derived neural stem cell line (HF7450) using the previously described protocol15, and combined into single wells of a 96-well plate. For the GBM-719 experiment and the first sequencing run, the cell numbers used as spiked-in controls were 10, 100, 250, 500, and 5000. For all subsequent in vivo experiments and the second sequencing run, the cell numbers used were 10, 100, and 5000. For all in vitro experiments and the third sequencing run, the cell numbers used were 10, 100, 500, and 5000. Separate spiked-in control only wells containing barcode sequences derived from 25,000 and 100,000 cells were also included in the GBM-719 experiment, to test accuracy of extrapolation for larger clones. The same was done in the third sequencing run for in vitro experiments, using a control of 50,000 cells. Xenograft samples were combined with spiked-in controls and subjected to DNA extraction using a PrepGEM DNA extraction kit (PTI0050, ZyGEM) followed by ethanol precipitation and deep amplicon sequencing as described previously15. Briefly, a two-step PCR protocol was used to generate barcode amplicons with fault-tolerant sample indices, and equimolar samples were pooled and loaded onto a single lane of a flow cell for paired-end sequencing on the Illumina MiSeq platform (Canada’s Michael Smith Genome Sciences Centre, BC Cancer Agency).
Barcode data analysis
Barcode sequences were extracted from raw data files with custom scripts, and those with a minimum base quality of 20 that matched the flanking regions (with up to 3 mismatches) surrounding the barcode sequence were kept. A merging of highly similar barcodes was performed in order to limit the number of false positive barcode sequences that may arise from sequencing errors61. Specifically, a list of read counts corresponding to all unique barcode sequences was generated, and read counts corresponding to sequences with up to three mismatches were combined into the most abundant sequence. Barcode sequence logograms were generated using the R package ggseqlogo (https://github.com/omarwagih/ggseqlogo). Spiked-in controls were retrieved for defining noise thresholds and clone size estimation as described previously16,22. We defined fractional read value (FRV) as the read count for a particular barcode sequence divided by the sum read counts of all spiked-in controls in the sample. A relationship was generated between FRVs and control cell number for spiked-in controls across all samples. A Cook’s distance of 4/n was used to define outlier controls and the relationship was generated again with those outliers removed to estimate clone sizes. This step was performed to ensure that outlier controls do not influence the estimation of relative clone sizes in the majority of samples within a particular sequencing run. FRV thresholds were determined from spiked-in controls in order to maximize the difference between the true positive rate (TPR) and false positive rate (FPR), and only clones with FRVs greater than the threshold were kept. The total cell number for each sample was estimated by summing up estimated cell numbers for each clone in the sample that are above detection threshold. Relative clone sizes were then determined by dividing the cell numbers for each clone by the total cell number calculated for each sample. Proportional Venn diagrams for barcode sequences were generated with eulerAPE v3 software62.
Generation of xenograft-derived cultures
Dissociated primary GBM xenografts were cultured as described in the “lentiviral barcoding” section after depletion of contaminating mouse cells (130-104-694, Miltenyi Biotech). All short-term cultures were subjected to 2 to 3 passages prior to barcode sequencing. Short-term cultures were not subjected to mycoplasma testing or microsatellite genotyping, although in all cases the identified barcode sequences of cultures matched those of the corresponding xenograft series.
Cell culture assays
For proliferation assays, GSCs were propagated for 11 days in triplicate under previously described conditions26. Viable cells were counted on days 0, 2, 4, 7, 9, and 11 with a Countess Automated Cell Counter (Thermo Fischer Scientific), excluding apoptotic cells that stained positive for trypan blue (Thermo Fischer Scientific). Doubling times were calculated during exponential growth phase (between days 4 and 11) using the formula t/log102 × log10(Nt2/Nt1), where Nt1 and Nt2 are the number of cells on days 4 and 11 respectively and t is the elapsed time in hours. For dosage response assays, GSCs were cultured with drug for 5 days with 6 technical replicates per dose, without any media changes. Cell viability relative to DMSO control was then assessed by AlamarBlue assay (Thermo Fisher Scientific) using a Gemini EM Fluorescence Microplate Reader (Molecular Devices).
Drug screening
Primary drug screens were carried out in 96-well format on passage 2-3 cultures that were grown under previously described conditions26. An Incucyte Zoom live-cell analysis system (Essen Bioscience) was used to quantify confluency according to manufacturer’s instructions. In order to characterize drug responsiveness of barcoded clones, a second screen was performed where cells were seeded on 6-well plates, subjected to a single round of drug selection in duplicate, and harvested for barcode sequencing when the culture reached approximately the same confluency as DMSO controls (~90%). In this assay, culture media was refreshed every 3 days without drug. The concentrations of drugs used for screening were as follows: Rapamycin: 20 nM, Dasatinib: 125 nM, BIO; Daunorubicin: 1 μM, LGK-974; RO4929097; WP1066: 2 μM, Imatinib: 2.5 μM, Bromosporine; CI-994; GSK591; GSK-J4; GSK-LSD1; InSolution γ-Secretase Inhibitor X; IOX2; JQ-1; L-741,742; LAQ824; MI-2-2; MS023; OF-1; Olaparib; PFI-1; PNU96515E; SGC-CBP30; UNC1999: 5 μM, Erlotinib: 10 μM, TMZ: 50 μM. Once ~90% confluency is reached, all surviving cells were used for DNA extraction and barcode sequencing as described above.
Limiting dilution analysis (LDA)
Cells were plated onto Flat bottom 96 well plates (Sarstedt) in 100 μL of culture media, 6 replicates per cell dose. The culturing conditions are described previously26, with the exception that culture plates were not coated with PLO and laminin to allow for sphere formation. For analysis of primary, uncultured GBM cells, two-fold dilutions from 4000 cells to 8 cells were used and scored after two weeks of culture. For analysis of established GSC cultures, two-fold dilutions from 2000 cells to 4 cells were used and scored after one to two weeks of culture. Drugs were added only once on the first day at either 1 μM or 5 μM as indicated for each experiment, with 50 μL of fresh media added to each well after the first week. Investigators were blinded to the label for each plate during data collection. Data were analyzed using ELDA software34.
In vivo drug assay
To test the effect of MI-2-2 treatment in vivo on tumour growth, 200,000 (1,1T,1T)719 cells were transplanted subcutaneously into the flanks of NSG mice (6 mice per treatment group, total 12 mice) and allowed to grow for 1 week prior to drug treatment. Mice were then treated with either 20 mg/kg MI-2-2 (444825, Millipore) or vehicle control (15% DMSO, 25% PEG, 60% PBS) for 2 weeks by intraperitoneal injection. The treatment schedule was Monday, Wednesday, Friday of each week for a total of 6 treatments. Mice were then monitored for tumour formation and sacrificed once the control tumours reached endpoint for measurement (127 days between injection and sacrifice). Flanks in which tumours were not visible were excluded from analysis. Subcutaneous tumour size did not exceed the limit set by the experimental protocol with The Hospital for Sick Children’s Animal Care Committee (17 mm in the longest dimension).
Stochastic simulations
A standard stochastic simulation algorithm63 was used to simulate realizations of the stochastic process defined by the model shown in Fig. 2c and described fully in Supplementary Theory section 5. Clone size distributions, clone size cross correlations and the ratio of surviving clones were then calculated from 100,000 realizations of the system for each parameter set. To compare the model with experiments, we simulated the system using 108 equidistant parameter sets located in the region of biologically plausible parameters and compared the results to experimental data points.
Extended Data
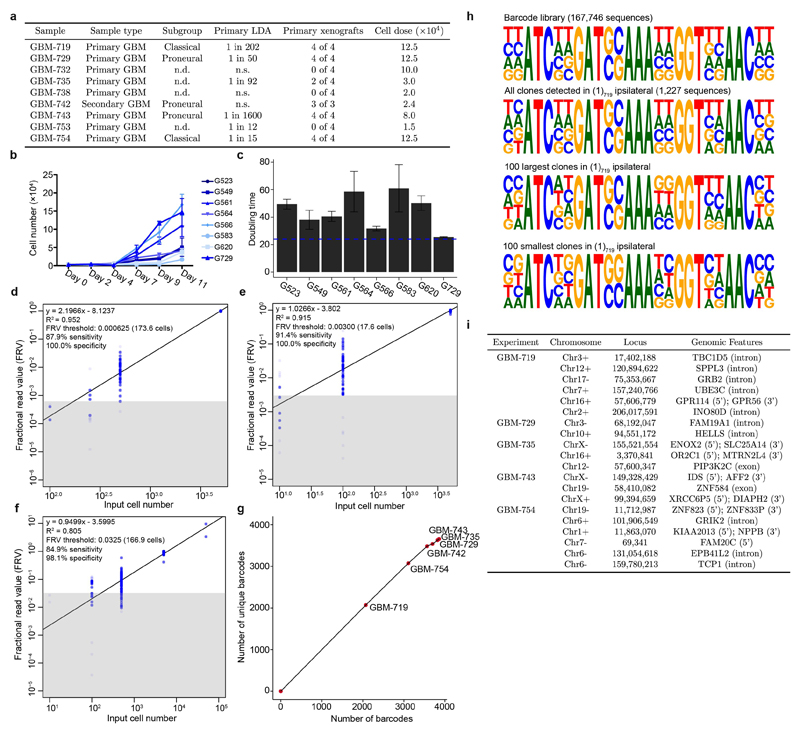
Extended data Figure 1. Barcode data processing.
a, Summary of GBM models used for barcoding experiments indicating TCGA subgroups as determined by RNA-Seq20, self-renewing frequency as assessed by primary limiting dilution analysis (LDA), the number of primary xenografts successfully established and the cell dose used for primary xenografts (n.d: not done, n.s: no spheres). b, Proliferation kinetics of GSC cultures in vitro. Data are shown as mean ± sd of 3 technical replicates. c, Cell doubling times of GSCs grown in culture calculated using the data in (b). Data are shown as mean ± sd of 3 technical replicates, horizontal line marks 24 hours. d-f, Relationship between fractional read value (FRV) and input cell numbers in spiked-in controls for the three sequencing runs. The highly influential data points (Cook’s distance > 4/n) are grayed out and not used for regression analysis to estimate relative clone sizes. The black line is the line of best fit, and the grey box indicates sequencing noise threshold. g, Analysis of barcode sequence saturation across six in vivo experiments. h, Position weight matrices depicting the representation of variable nucleotides in the barcode library, the (1)719 ipsilateral sample, as well as the largest and smallest 100 clones in that sample. The height of nucleotides at each position represents its relative frequency, with the most frequently occurring nucleotide shown in the top position. i, Summary of unique barcode integration sites identified by splinkerette PCR.
Extended data Figure 2. Molecular characterization of GBMs and GBM xenografts.
a, Oncoprint plot of mutations identified in primary GBM tissue samples that are of the top 200 recurrently mutated genes in the provisional TCGA dataset21. b, Multidimensional scaling plot for the 32-gene simple GBM classification method using RNA-Seq53. Shown are the TCGA samples with RNA-Seq data and 5 patient samples used in the current study. TCGA samples are labelled and coloured according to their original subgroup as determined from microarray expression analysis20. c, Methylation-specific PCR assay for the MGMT promoter in 6 primary GBMs. L: ladder, -ve: water only control, U: unmethylated PCR product, M: methylated PCR product. Specific ladder marker sizes are shown in base pairs. d, Pairwise correlation of ATAC-Seq peak intensities across GSC culture models and compared with a chronic lymphocytic leukaemia (CLL) control57. Black outline highlights correlations for GSC cultures derived from the GBMs used for the in vivo barcoding study (G719, G729, G754). e, Summary of somatic mutations identified using exome sequencing from representative GBM-719 barcoded xenografts, grouped according to type. p2 Veh: passage 2; treated with vehicle, p2 TMZ: passage 2; treated with TMZ, p3 Veh Veh: passage 3; treated with vehicle at passages 2 and 3, p3 TMZ TMZ: passage 3; treated with TMZ at passages 2 and 3 and briefly expanded in vitro prior to sequencing. f, Heat map representing relative copy number profiles from whole exome sequencing of GBM-719 xenograft samples. Segments of gains (red) or deletions (blue) are colour-coded based on log2 copy number ratios. Frequent loss of chromosome 10 is a common observation in GBM. g, Summary of patient characteristics for all tumour samples used throughout the study, and the experiment(s) that each sample is used for.
Extended data Figure 3. Functional characterization of GBMs and GBM xenografts.
a, H&E and human-specific nestin staining in primary glioblastoma specimens, scale bar = 100 µm. b, H&E and human-specific nestin staining for representative GBM xenografts, scale bar = 100 µm. c, Survival analysis of xenografts derived from the indicated GBM model and treatment conditions. All survival analyses were performed using a log-rank test (n = 4 mice per group with the exception of the GBM-754 experiment, Vehicle – Vehicle group which contains 3 mice). d, Quantification of percentage proliferative activity in serial xenografts by Ki-67 staining and percentage apoptosis by cleaved Caspase-3 staining, mean ± sd of 6 representative sections from the same xenograft sample.
Extended data Figure 4. GSCs are able to invade contralaterally and have heterogeneous clonal outputs.
a, Human-specific nestin staining in representative xenografts between ipsilateral and contralateral hemispheres (scale bar = 1mm, Ipsi: ipsilateral hemisphere, Contra: contralateral hemisphere). b, Comparison of cell numbers recovered from xenografts between the ipsilateral and contralateral fractions, two-sided paired t-tests. Single data points are overlaid over the box plot, the horizontal line represents the median, and the lower and upper hinges represent the 25th and 75th quartiles respectively. The lower and upper whiskers extend from the hinge to the lowest and highest values within 1.5 times the inter-quartile range (IQR). c, Plot of Pearson correlation coefficients comparing relative clone sizes between two hemispheres, for the indicated sample groups. The box-plots are displayed as with panel (b). d, Clonal composition of tumours generated serially from contralateral fractions, grouped according to the geographical distribution of each detected clone in the previous (primary) passage. e, Clone size distributions for representative xenograft samples. All data shown are from ipsilateral hemispheres, not treated with TMZ, and generated from ipsilateral-derived cells from the previous passage (in the case of secondary and tertiary xenografts). Fits to a negative binomial distribution (curve) are included for patients with rich data sets (GBM-719, GBM-742, and GBM-754), used for quantitative analyses. Plot titles identify the respective sequence of serial passages by the nomenclature introduced in the Supplementary Theory. f, Representative correlation of clone size between successive serial passages of GBM-719 untreated xenografts with Pearson’s r indicated. P1: primary passage, P2: secondary passage, P3: tertiary passage. g, Representative correlations of clone size between different secondary passage replicate experiments derived from the same primary xenograft as panel (f), with Pearson’s r indicated. The red arrowhead shows deviations from a linear correlation due to large outliers. R1: replicate 1, R2: replicate 2, R3: replicate 3.
Extended data Figure 5. First incomplete moment of clone size distributions for GBM-719, -729, and -735 xenografts.
a-c, First incomplete moments of the clone size distributions for all xenograft samples derived from patient tumours GBM-719 (a), GBM-729 (b), and GBM-735 (c). Samples are named according to the sequence of samples injected, V: vehicle treated, T: TMZ treated, C: generated from the contralateral fraction of the previous passage. For illustrative purposes, GBM-719 xenografts (a) that are TMZ-treated are marked with a red arrowhead where the distribution appears to deviate from the negative binomial. The indicated fit parameter n0 describe a characteristic clone size of the population (Supplementary Theory 2-3). Where Group B clones (large outliers) were removed to generate a more accurate fit, the number of clones removed is indicated and the re-calculated first incomplete moment distributions with outliers removed are plotted in grey. d, Schematic describing how a sequence of treatments resulting in a particular xenograft sample is incorporated into the sample nomenclatures.
Extended data Figure 6. First incomplete moment of clone size distributions for GBM-742, -743, and -754 xenografts and variant allele frequencies (VAFs) for GBM-719 xenografts.
a-c, First incomplete moments of the clone size distributions for all xenografts derived from the tumours GBM-742 (a), GBM-743 (b), and GBM-754 (c). Sample and plot annotations are as described for Extended data figure 5. d, Distribution of variant allele frequencies (VAFs) across GBM-719 xenograft samples. Mutations with a VAF of 0.5 likely corresponds to variants in the clonal population (found in all cells within the tumour), while less prevalent mutations correspond to subclonal populations defined by recent mutational events found only in a subset of cells. e, Comparison of VAF values for mutations in paired secondary and tertiary passages. f, First incomplete moments show a negative binomial distribution for VAF values below 0.5 across xenograft samples. The dashed line shows a fit to the exponential and the vertical line marks a VAF of 0.5. g, First incomplete moments for mutations that are newly detected in the tertiary vehicle- and TMZ-treated passage. h, Same as panel (f) after filtering out mutations that do not occur in diploid regions of the genome. i, Same as panel (g) after filtering out mutations that do not occur in diploid regions of the genome.
Extended data Figure 7. Barcode analysis of xenograft derived cultures.
a, Proportional Venn diagrams depicting the number of unique and shared barcoded clones as defined by the in vivo passages (primary, secondary, or tertiary), that are also detectable within the specified xenograft-derived cultures. b, Comparison of clone sizes between paired primary xenografts and primary xenograft-derived GSC cultures. c, Correlation of clone sizes between TMZ-treated GBM-719 xenografts, and cultures derived from these xenografts. A select cluster of clones that become outcompeted after secondary xenografts are outlined in blue, and Spearman’s rho coefficients are as indicated. d, First incomplete moments of the full clone size distributions for GBM-754 primary xenograft cultures at different times throughout culture expansion. e, First incomplete moments of the clone size distributions used in panel (d), with the 14 largest outlier clones removed from each sample. f, Pairwise clone size comparisons between replicate cultures in (d), with Spearman’s rho indicated.
Extended data Figure 8. First incomplete moment of clone size distributions for remaining GBM xenograft derived cultures.
a, Plots of first incomplete moment for cultures derived from the indicated GBM xenografts. b, Same as (a), with the indicated number of large outlier clones removed from the analysis.
Extended data Figure 9. Epigenetic drug screening of GBM-754 primary xenograft culture.
a, Primary drug screen of GBM-754 primary xenograft-derived culture, with growth assessed as culture density relative to DMSO control. Compounds highlighted in blue were used in subsequent experiments. b, Strategy to identify clonal differences in drug response. Cells are treated in duplicate with each compound, and allowed to repopulate to the same density as DMSO controls prior to barcode sequencing. c, Summary of results from drug repopulation experiments. The top plot shows the ratio between sum relative clone sizes of Group B and Group A, technical replicates are denoted as 1, 2, or 3. The horizontal line marks the mean Group B/Group A ratio for DMSO treated cultures. The bottom plot shows the number of reads obtained from each sample after repopulation, relative to DMSO. The horizontal line marks the mean number of reads for DMSO samples. d, Additional technical replicate experiments related to Fig. 3g, demonstrating selectivity of UNC1999 and MI-2-2 on Group A and B clones respectively. e, Dose response assays for the indicated GSC culture models upon UNC1999 and MI-2-2 treatment, mean ± sd of 6 technical replicates. f, Two additional independent experiments related to Fig. 3h. P values for the left and right replicates respectively are 6.95 × 10⁻⁴; 0.148 for DMSO vs. CI-994, 0.338; 0.55 for DMSO vs. GSK591, 3.31 × 10⁻³; 0.0177 for DMSO vs. UNC1999, 2.15 × 10⁻¹¹; 1.59 × 10⁻⁷ for DMSO vs. MI-2-2, 1.49 × 10⁻¹⁰; 3.7 × 10⁻¹² for MI-nc vs. M, 0.963; 0.408 for M vs. M + C, 0.355; 0.408 for M vs. M + G, 2.68 × 10⁻⁹; 6.06 × 10⁻⁸ for M vs. M + U. g, Combined effect of GSK343 and MI-2-2 on self-renewal. P = 4.42 × 10⁻⁶ for DMSO vs GSK343, 2.96 × 10⁻¹² for DMSO vs MI-2-2, 3.62 × 10⁻⁶ for GSK343 vs M + G, 0.0125 for MI-2-2 vs M + G. h, Combined effect of UNC1999 and MI-2-2 on self-renewal when used at 1 μM, representative of 3 independent experiments. P = 0.147 for DMSO vs. UNC1999, 0.129 for DMSO vs MI-2-2, 9.84 × 10⁻⁴ for DMSO vs. M + U. i, Two additional independent experiments related to Fig. 3i. P values for the left and right replicates respectively are 4.59 × 10⁻⁵; 4.81 × 10⁻¹⁵ for DMSO vs. UNC1999, 3.28 × 10⁻²⁵; 1.13 × 10⁻³¹ for DMSO vs MI-2-2, 1.86 × 10⁻¹¹; 3.61 × 10⁻⁶ for UNC1999 vs MI-2-2. j-m, Combined effect of UNC1999 and MI-2-2 on self-renewal in the indicated GSC culture models. P values for the G523, G549, G564, G566 experiments respectively are 1.9 × 10⁻⁵; 1; 0.758; 0.799 for DMSO vs UNC1999, 8.14 × 10⁻¹⁸; 2.14 × 10⁻⁴; 0.503; 6.12 × 10⁻⁴ for DMSO vs MI-2-2, 2.72 × 10⁻¹²; 3.28 × 10⁻³⁰; 1.15 × 10⁻²¹; 2.54 × 10⁻⁸ for UNC1999 vs M + U, 7.69 × 10⁻³; 1.26 × 10⁻¹⁵; 2.61 × 10⁻¹⁸; 8.82 × 10⁻³ for MI-2-2 vs M + U. n, Combined effect of UNC1999 and MI-2-2 on self-renewal of uncultured GBM-851 cells. P = 3.01 × 10⁻³ for DMSO vs UNC1999, 1.36 × 10⁻⁴ for DMSO vs MI-2-2, 3.11 × 10⁻³ for UNC1999 vs M + U, 0.0276 for MI-2-2 vs M + U. Analysis of LDA results was performed using ELDA software34, error bars represent 95% confidence interval (ns P > 0.05, * P ≤ 0.05, ** P ≤ 0.01, *** P ≤ 0.001).
Extended data Figure 10. First incomplete moment of the clone size distributions for drug-treated GBM-754 primary xenograft cultures.
a, First incomplete moments of the full clone size distributions of GBM-754 primary xenograft cultures treated with different drugs. b, First incomplete moments of the clone size distributions used in panel (a), with 5 group B clones removed.
Supplementary Material
Acknowledgements
We thank R.D. Corbett, P. Plettner, N. Khuu and G. Edin for technical advice. We would also like to thank the SickKids-UHN Flow Cytometry Facility for assistance with FACS, SickKids Laboratory Animal Services for animal housing and veterinary support, and The Centre for Applied Genomics, Princess Margaret Genomics Centre, and Canada’s Michael Smith Genome Sciences Centre for sequencing and bioinformatics support. This study was supported by the Canadian Institutes of Health Research (funding reference number 142434). This study was conducted with the support of the Ontario Institute for Cancer Research through funding provided by the Government of Ontario. P.B.D. is supported by grants from Stand Up 2 Cancer (SU2C) Canada, Canadian Institutes for Health Research, Ontario Institute for Cancer Research, Canadian Cancer Society, the Hospital for Sick Children Foundation, Jessica’s Footprint Foundation, B.R.A.I.N. Child and the Hopeful Minds Foundation. P.B.D. also holds a Garron Family Chair in Childhood Cancer Research at The Hospital for Sick Children. B.D.S. acknowledges the support of the Wellcome Trust (grant number 098357/Z/12/Z). C.J.E. acknowledges grant support from the Canadian Cancer Society and the Terry Fox Run. Research supported by SU2C Canada Cancer Stem Cell Dream Team Research Funding (SU2C-AACR-DT-19-15) provided by the Government of Canada through Genome Canada and the Canadian Institute of Health Research, with supplemental support from the Ontario Institute for Cancer Research through funding provided by the Government of Ontario. Stand Up To Cancer Canada is a program of the Entertainment Industry Foundation Canada. Research Funding is administered by the American Association for Cancer Research International - Canada, the scientific partner of SU2C Canada.The Structural Genomics Consortium is funded by AbbVie, Bayer, Boehringer Ingelheim, GSK, Genome Canada, Ontario Genomics Institute, Janssen, Lilly, Merck, Novartis, the government of Ontario, Pfizer, Takeda, and the Wellcome Trust.
Footnotes
Author Contributions
X.L. and P.B.D. conceptualized the study and were assisted by L.V.N., R.J.V., N.I.P., F.J.C., H.J.S., M.G., and C.J.E. in experimental design. P.B.D. and B.D.S. supervised the study. X.L. performed in vivo and in vitro barcoding experiments and drug validation studies. D.J.J., B.D.S., X.L., D.P., A.C., and P.B.D. analysed and interpreted barcoding results. D.J.J. and B.D.S. developed the theoretical model of tumour growth, performed simulations and wrote the supplemental theory section. F.M.G.C., L.M.R., M.D.T., and T.J.P. analysed WES and RNA-seq results. P.G. and M.L. performed ATAC-seq and analysed results. R.J.V., L.L., M.K., N.I.P., F.J.C., H.W., C.C., B.L., N.R., R.H., and S. Dolma assisted in performing the experiments. M.M., A.J.M., R.A.M., Y.M., and M.H. oversaw the generation of sequencing data. L.V.N. and C.J.E. designed, generated, and validated the barcode library. P.P. and C.H.A. assisted with in vitro drug assays. M.D.C., S. Das, M.B. contributed all GBM tumour samples used in the study. X.L., D.J.J., C.J.E., B.D.S., and P.B.D. wrote the manuscript, all authors contributed to data interpretation and approved the manuscript.
Author Information
Reprints and permissions information is available at www.nature.com/reprints. Readers are welcome to comment on the online version of the paper.
The authors declare no competing financial interests.
Data availability
ATAC-seq data have been deposited at the Gene Expression Omnibus (http://www.ncbi.nlm.nih.gov/geo) under the accession number GSE96088. WES and RNA-seq data have been deposited at the European Genome-phenome Archive (http://www.ebi.ac.uk/ega) under the accession number EGAS00001002424. All other data are available as Supplementary Data Tables, Source Data, or upon reasonable request from the corresponding authors (P.B.D. and B.D.S.).
Code availability
Code used throughout this study are available upon reasonable request from the corresponding authors (P.B.D. and B.D.S.).
References
- 1.Stupp R, et al. Radiotherapy plus concomitant and adjuvant temozolomide for glioblastoma. N Engl J Med. 2005;352:987–996. doi: 10.1056/NEJMoa043330. [DOI] [PubMed] [Google Scholar]
- 2.Singh SK, et al. Identification of human brain tumour initiating cells. Nature. 2004;432:396–401. doi: 10.1038/nature03128. [DOI] [PubMed] [Google Scholar]
- 3.Chen J, et al. A restricted cell population propagates glioblastoma growth after chemotherapy. Nature. 2012;488:522–526. doi: 10.1038/nature11287. [DOI] [PMC free article] [PubMed] [Google Scholar]
- 4.Patel AP, et al. Single-cell RNA-seq highlights intratumoral heterogeneity in primary glioblastoma. Science. 2014;344:1396–1401. doi: 10.1126/science.1254257. [DOI] [PMC free article] [PubMed] [Google Scholar]
- 5.Tirosh I, et al. Single-cell RNA-seq supports a developmental hierarchy in human oligodendroglioma. Nature. 2016;539:309–313. doi: 10.1038/nature20123. [DOI] [PMC free article] [PubMed] [Google Scholar]
- 6.Sottoriva A, et al. Intratumor heterogeneity in human glioblastoma reflects cancer evolutionary dynamics. Proc Natl Acad Sci U S A. 2013;110:4009–4014. doi: 10.1073/pnas.1219747110. [DOI] [PMC free article] [PubMed] [Google Scholar]
- 7.Johnson BE, et al. Mutational analysis reveals the origin and therapy-driven evolution of recurrent glioma. Science. 2014;343:189–193. doi: 10.1126/science.1239947. [DOI] [PMC free article] [PubMed] [Google Scholar]
- 8.Greaves M. Cancer stem cells: back to Darwin? Semin Cancer Biol. 2010;20:65–70. doi: 10.1016/j.semcancer.2010.03.002. [DOI] [PubMed] [Google Scholar]
- 9.Piccirillo SG, et al. Genetic and functional diversity of propagating cells in glioblastoma. Stem Cell Reports. 2015;4:7–15. doi: 10.1016/j.stemcr.2014.11.003. [DOI] [PMC free article] [PubMed] [Google Scholar]
- 10.Snuderl M, et al. Mosaic amplification of multiple receptor tyrosine kinase genes in glioblastoma. Cancer Cell. 2011;20:810–817. doi: 10.1016/j.ccr.2011.11.005. [DOI] [PubMed] [Google Scholar]
- 11.Driessens G, Beck B, Caauwe A, Simons BD, Blanpain C. Defining the mode of tumour growth by clonal analysis. Nature. 2012;488:527–530. doi: 10.1038/nature11344. [DOI] [PMC free article] [PubMed] [Google Scholar]
- 12.Sanchez-Danes A, et al. Defining the clonal dynamics leading to mouse skin tumour initiation. Nature. 2016;536:298–303. doi: 10.1038/nature19069. [DOI] [PMC free article] [PubMed] [Google Scholar]
- 13.Rulands S, Simons BD. Tracing cellular dynamics in tissue development, maintenance and disease. Curr Opin Cell Biol. 2016;43:38–45. doi: 10.1016/j.ceb.2016.07.001. [DOI] [PubMed] [Google Scholar]
- 14.Simons BD. Deep sequencing as a probe of normal stem cell fate and preneoplasia in human epidermis. Proc Natl Acad Sci U S A. 2016;113:128–133. doi: 10.1073/pnas.1516123113. [DOI] [PMC free article] [PubMed] [Google Scholar]
- 15.Nguyen LV, et al. Clonal analysis via barcoding reveals diverse growth and differentiation of transplanted mouse and human mammary stem cells. Cell Stem Cell. 2014;14:253–263. doi: 10.1016/j.stem.2013.12.011. [DOI] [PubMed] [Google Scholar]
- 16.Nguyen LV, et al. Barcoding reveals complex clonal dynamics of de novo transformed human mammary cells. Nature. 2015;528:267–271. doi: 10.1038/nature15742. [DOI] [PubMed] [Google Scholar]
- 17.Bhang HE, et al. Studying clonal dynamics in response to cancer therapy using high-complexity barcoding. Nat Med. 2015;21:440–448. doi: 10.1038/nm.3841. [DOI] [PubMed] [Google Scholar]
- 18.Wagenblast E, et al. A model of breast cancer heterogeneity reveals vascular mimicry as a driver of metastasis. Nature. 2015;520:358–362. doi: 10.1038/nature14403. [DOI] [PMC free article] [PubMed] [Google Scholar]
- 19.Vanner RJ, et al. Quiescent sox2(+) cells drive hierarchical growth and relapse in sonic hedgehog subgroup medulloblastoma. Cancer Cell. 2014;26:33–47. doi: 10.1016/j.ccr.2014.05.005. [DOI] [PMC free article] [PubMed] [Google Scholar]
- 20.Verhaak RG, et al. Integrated genomic analysis identifies clinically relevant subtypes of glioblastoma characterized by abnormalities in PDGFRA, IDH1, EGFR, and NF1. Cancer Cell. 2010;17:98–110. doi: 10.1016/j.ccr.2009.12.020. [DOI] [PMC free article] [PubMed] [Google Scholar]
- 21.Brennan CW, et al. The somatic genomic landscape of glioblastoma. Cell. 2013;155:462–477. doi: 10.1016/j.cell.2013.09.034. [DOI] [PMC free article] [PubMed] [Google Scholar]
- 22.Nguyen LV, et al. DNA barcoding reveals diverse growth kinetics of human breast tumour subclones in serially passaged xenografts. Nat Commun. 2014;5:5871. doi: 10.1038/ncomms6871. [DOI] [PMC free article] [PubMed] [Google Scholar]
- 23.Sottoriva A, et al. A Big Bang model of human colorectal tumor growth. Nat Genet. 2015;47:209–216. doi: 10.1038/ng.3214. [DOI] [PMC free article] [PubMed] [Google Scholar]
- 24.Waclaw B, et al. A spatial model predicts that dispersal and cell turnover limit intratumour heterogeneity. Nature. 2015;525:261–264. doi: 10.1038/nature14971. [DOI] [PMC free article] [PubMed] [Google Scholar]
- 25.Bailey NTJ. The Elements of Stochastic Processes with Applications to the Natural Sciences. John Wiley & Sons; 1990. [Google Scholar]
- 26.Pollard SM, et al. Glioma stem cell lines expanded in adherent culture have tumor-specific phenotypes and are suitable for chemical and genetic screens. Cell Stem Cell. 2009;4:568–580. doi: 10.1016/j.stem.2009.03.014. [DOI] [PubMed] [Google Scholar]
- 27.Funato K, Major T, Lewis PW, Allis CD, Tabar V. Use of human embryonic stem cells to model pediatric gliomas with H3.3K27M histone mutation. Science. 2014;346:1529–1533. doi: 10.1126/science.1253799. [DOI] [PMC free article] [PubMed] [Google Scholar]
- 28.Borkin D, et al. Pharmacologic inhibition of the Menin-MLL interaction blocks progression of MLL leukemia in vivo. Cancer Cell. 2015;27:589–602. doi: 10.1016/j.ccell.2015.02.016. [DOI] [PMC free article] [PubMed] [Google Scholar]
- 29.Gallo M, et al. MLL5 Orchestrates a Cancer Self-Renewal State by Repressing the Histone Variant H3.3 and Globally Reorganizing Chromatin. Cancer Cell. 2015;28:715–729. doi: 10.1016/j.ccell.2015.10.005. [DOI] [PubMed] [Google Scholar]
- 30.Suva ML, et al. EZH2 is essential for glioblastoma cancer stem cell maintenance. Cancer Res. 2009;69:9211–9218. doi: 10.1158/0008-5472.can-09-1622. [DOI] [PubMed] [Google Scholar]
- 31.Meyer M, et al. Single cell-derived clonal analysis of human glioblastoma links functional and genomic heterogeneity. Proc Natl Acad Sci U S A. 2015;112:851–856. doi: 10.1073/pnas.1320611111. [DOI] [PMC free article] [PubMed] [Google Scholar]
- 32.Williams MJ, Werner B, Barnes CP, Graham TA, Sottoriva A. Identification of neutral tumor evolution across cancer types. Nat Genet. 2016;48:238–244. doi: 10.1038/ng.3489. [DOI] [PMC free article] [PubMed] [Google Scholar]
- 33.Pollen AA, et al. Molecular identity of human outer radial glia during cortical development. Cell. 2015;163:55–67. doi: 10.1016/j.cell.2015.09.004. [DOI] [PMC free article] [PubMed] [Google Scholar]
- 34.Hu Y, Smyth GK. ELDA: extreme limiting dilution analysis for comparing depleted and enriched populations in stem cell and other assays. J Immunol Methods. 2009;347:70–78. doi: 10.1016/j.jim.2009.06.008. [DOI] [PubMed] [Google Scholar]
- 35.Li H, Durbin R. Fast and accurate long-read alignment with Burrows-Wheeler transform. Bioinformatics. 2010;26:589–595. doi: 10.1093/bioinformatics/btp698. [DOI] [PMC free article] [PubMed] [Google Scholar]
- 36.McKenna A, et al. The Genome Analysis Toolkit: a MapReduce framework for analyzing next-generation DNA sequencing data. Genome Res. 2010;20:1297–1303. doi: 10.1101/gr.107524.110. [DOI] [PMC free article] [PubMed] [Google Scholar]
- 37.Li H, et al. The Sequence Alignment/Map format and SAMtools. Bioinformatics. 2009;25:2078–2079. doi: 10.1093/bioinformatics/btp352. [DOI] [PMC free article] [PubMed] [Google Scholar]
- 38.Koboldt DC, et al. VarScan 2: somatic mutation and copy number alteration discovery in cancer by exome sequencing. Genome Res. 2012;22:568–576. doi: 10.1101/gr.129684.111. [DOI] [PMC free article] [PubMed] [Google Scholar]
- 39.Wang K, Li M, Hakonarson H. ANNOVAR: functional annotation of genetic variants from high-throughput sequencing data. Nucleic Acids Res. 2010;38:e164. doi: 10.1093/nar/gkq603. [DOI] [PMC free article] [PubMed] [Google Scholar]
- 40.Sherry ST, et al. dbSNP: the NCBI database of genetic variation. Nucleic Acids Res. 2001;29:308–311. doi: 10.1093/nar/29.1.308. [DOI] [PMC free article] [PubMed] [Google Scholar]
- 41.Lek M, et al. Analysis of protein-coding genetic variation in 60,706 humans. Nature. 2016;536:285–291. doi: 10.1038/nature19057. [DOI] [PMC free article] [PubMed] [Google Scholar]
- 42.Auton A, et al. A global reference for human genetic variation. Nature. 2015;526:68–74. doi: 10.1038/nature15393. [DOI] [PMC free article] [PubMed] [Google Scholar]
- 43.Garcia-Alcalde F, et al. Qualimap: evaluating next-generation sequencing alignment data. Bioinformatics. 2012;28:2678–2679. doi: 10.1093/bioinformatics/bts503. [DOI] [PubMed] [Google Scholar]
- 44.Quinlan AR, Hall IM. BEDTools: a flexible suite of utilities for comparing genomic features. Bioinformatics. 2010;26:841–842. doi: 10.1093/bioinformatics/btq033. [DOI] [PMC free article] [PubMed] [Google Scholar]
- 45.Cibulskis K, et al. Sensitive detection of somatic point mutations in impure and heterogeneous cancer samples. Nat Biotechnol. 2013;31:213–219. doi: 10.1038/nbt.2514. [DOI] [PMC free article] [PubMed] [Google Scholar]
- 46.Ramos AH, et al. Oncotator: cancer variant annotation tool. Hum Mutat. 2015;36:E2423–2429. doi: 10.1002/humu.22771. [DOI] [PMC free article] [PubMed] [Google Scholar]
- 47.Landrum MJ, et al. ClinVar: public archive of relationships among sequence variation and human phenotype. Nucleic Acids Res. 2014;42:D980–985. doi: 10.1093/nar/gkt1113. [DOI] [PMC free article] [PubMed] [Google Scholar]
- 48.Abecasis GR, et al. An integrated map of genetic variation from 1,092 human genomes. Nature. 2012;491:56–65. doi: 10.1038/nature11632. [DOI] [PMC free article] [PubMed] [Google Scholar]
- 49.Forbes SA, et al. COSMIC: mining complete cancer genomes in the Catalogue of Somatic Mutations in Cancer. Nucleic Acids Res. 2011;39:D945–950. doi: 10.1093/nar/gkq929. [DOI] [PMC free article] [PubMed] [Google Scholar]
- 50.Favero F, et al. Sequenza: allele-specific copy number and mutation profiles from tumor sequencing data. Ann Oncol. 2015;26:64–70. doi: 10.1093/annonc/mdu479. [DOI] [PMC free article] [PubMed] [Google Scholar]
- 51.Dobin A, et al. STAR: ultrafast universal RNA-seq aligner. Bioinformatics. 2013;29:15–21. doi: 10.1093/bioinformatics/bts635. [DOI] [PMC free article] [PubMed] [Google Scholar]
- 52.Love MI, Huber W, Anders S. Moderated estimation of fold change and dispersion for RNA-seq data with DESeq2. Genome Biol. 2014;15:550. doi: 10.1186/s13059-014-0550-8. [DOI] [PMC free article] [PubMed] [Google Scholar]
- 53.Crisman TJ, et al. Identification of an Efficient Gene Expression Panel for Glioblastoma Classification. PLoS One. 2016;11:e0164649. doi: 10.1371/journal.pone.0164649. [DOI] [PMC free article] [PubMed] [Google Scholar]
- 54.Buenrostro JD, Giresi PG, Zaba LC, Chang HY, Greenleaf WJ. Transposition of native chromatin for fast and sensitive epigenomic profiling of open chromatin, DNA-binding proteins and nucleosome position. Nat Methods. 2013;10:1213–1218. doi: 10.1038/nmeth.2688. [DOI] [PMC free article] [PubMed] [Google Scholar]
- 55.Langmead B, Salzberg SL. Fast gapped-read alignment with Bowtie 2. Nat Methods. 2012;9:357–359. doi: 10.1038/nmeth.1923. [DOI] [PMC free article] [PubMed] [Google Scholar]
- 56.Zhang Y, et al. Model-based analysis of ChIP-Seq (MACS) Genome Biol. 2008;9:R137. doi: 10.1186/gb-2008-9-9-r137. [DOI] [PMC free article] [PubMed] [Google Scholar]
- 57.Rendeiro AF, et al. Chromatin accessibility maps of chronic lymphocytic leukaemia identify subtype-specific epigenome signatures and transcription regulatory networks. Nat Commun. 2016;7:11938. doi: 10.1038/ncomms11938. [DOI] [PMC free article] [PubMed] [Google Scholar]
- 58.Palmisano WA, et al. Predicting lung cancer by detecting aberrant promoter methylation in sputum. Cancer Res. 2000;60:5954–5958. [PubMed] [Google Scholar]
- 59.Uren AG, et al. A high-throughput splinkerette-PCR method for the isolation and sequencing of retroviral insertion sites. Nat Protoc. 2009;4:789–798. doi: 10.1038/nprot.2009.64. [DOI] [PMC free article] [PubMed] [Google Scholar]
- 60.Schuffler PJ, et al. TMARKER: A free software toolkit for histopathological cell counting and staining estimation. J Pathol Inform. 2013;4:S2. doi: 10.4103/2153-3539.109804. [DOI] [PMC free article] [PubMed] [Google Scholar]
- 61.Thielecke L, et al. Limitations and challenges of genetic barcode quantification. Sci Rep. 2017;7:43249. doi: 10.1038/srep43249. [DOI] [PMC free article] [PubMed] [Google Scholar]
- 62.Micallef L, Rodgers P. eulerAPE: drawing area-proportional 3-Venn diagrams using ellipses. PLoS One. 2014;9:e101717. doi: 10.1371/journal.pone.0101717. [DOI] [PMC free article] [PubMed] [Google Scholar]
- 63.Gillespie DT. Exact stochastic simulation of coupled chemical reactions. The Journal of Physical Chemistry. 1977;81:2340–2361. doi: 10.1021/j100540a008. [DOI] [Google Scholar]
Associated Data
This section collects any data citations, data availability statements, or supplementary materials included in this article.


