

Abstract
Neuroimaging data have been widely used to derive possible biomarkers for Alzheimer’s Disease (AD) diagnosis. As only certain brain regions are related to AD progression, many feature selection methods have been proposed to identify informative features (i.e., brain regions) to build an accurate prediction model. These methods mostly only focus on the feature-target relationship to select features which are discriminative to the targets (e.g., diagnosis labels). However, since the brain regions are anatomically and functionally connected, there could be useful intrinsic relationships among features. In this paper, by utilizing both the feature-target and feature-feature relationships, we propose a novel sparse regression model to select informative features which are discriminative to the targets and also representative to the features. We argue that the features which are representative (i.e., can be used to represent many other features) are important, as they signify strong “connection” with other ROIs, and could be related to the disease progression. We use our model to select features for both binary and multi-class classification tasks, and the experimental results on the Alzheimer’s Disease Neuroimaging Initiative (ADNI) dataset show that the proposed method outperforms other comparison methods considered in this work.
1 Introduction
Magnetic Resonance Imaging (MRI) data have become one of the most commonly used neuroimaging data to obtain biomarkers for Alzheimer’s Disease (AD), as they are widely available, non-invasive, affordable, and may show early signs of neurodegeneration in human brain [6,19]. As neuroimaging data are very high in dimension, most methods [4,17] prefer to use Region-Of-Interest (ROI)-based features instead of the original voxel values for analysis. However, not all the ROIs are related to disease progression, and thus a lot of feature selection methods have been proposed [4,15,20]. For example, Zhang and Shen [17] and Wang et al. [15] used multi-task learning to select common features for classification and regression tasks, i.e., features are jointly selected to discriminate both classification labels and clinical scores. These feature selection methods are task-oriented, as they exploit the feature-target relationship to select features which are discriminative to the targets. Feature-feature relationship, e.g., correlations among features, however, is ignored in these methods.
The MRI ROI-based features are actually correlated or “connected” in some ways. This can be deduced based on the facts that the ROIs are anatomically and functionally connected [11,12,14]. Thus, we hypothesize that there exist intrinsic relationships among the features, i.e., ROIs. We then devise a self-representation formulation to measure how well a feature can be used to represent other features. We argue that a more representative feature, i.e., a feature which can be used to represent many other features, is more important and useful in AD study. In the context of brain connectivity, a more representative feature could also signify a strong “connection” between this feature and other features. Thus, a representation-oriented feature selection method, which selects representative features without considering the target information, can also be used for AD diagnosis.
In this study, we consider both the feature-target and feature-feature relationships to formulate a novel feature selection method. Our method combines the complementary advantages of both the task-oriented and the representation-oriented methods, to select features, which are both discriminative to the targets and representative to the other features. More specifically, our formulation consists of three components: (1) task-oriented component: to obtain a discriminative coefficient matrix, which denotes the discriminative power of the features to the targets in supervised learning; (2) representation-oriented component: to obtain a representative coefficient matrix, whose row denotes the representative power of a feature representing other features in unsupervised learning; (3) joint sparsity constraint: to remove features that are neither discriminative nor representative, by jointly penalizing the above discriminative and representative coefficient matrices via an ℓ2,1-norm regularization. We then use the selected features to conduct both binary and multi-class classification tasks for different stages of AD diagnosis.
The contributions of this paper are three-fold: (i) we utilize the self-representation characteristics of the MRI ROI-based data to extract the feature-feature relationship for conducting feature selection, while the previous methods [2,16] mostly used it to extract the sample-sample relationship for clustering purpose; (ii) we consider both the feature-target and feature-feature relationships in the formulation of a novel joint feature selection method, while most of the previous AD studies [18,20,21] utilized the feature-target relationship, thus ignoring intrinsic relationships among the features that could be also useful; and (iii) we simultaneously consider both binary and multi-class classification tasks, for a more practical clinical application, while most of the previous studies [15,17] focused on the binary classification for AD study.
2 Method
Let X ∈ ℝn×d and Y ∈ {0, 1}n×c, denote the feature matrix and the target matrix of all MRI data, respectively, where n, d, and c denote the numbers of the samples (or subjects), the features, and the targets (i.e., class labels), respectively. We use xi and xj to denote the i-th row (sample) and the j-th column (feature) of X, respectively. The corresponding target vector for xi is given as yi = [yi1,…, yij,…, yic] ∈ {0, 1}c, where yij = 1 indicates that xi is belonged to the j-th class, and vice versa.
2.1 Task-Oriented Supervised Feature Selection
In our case, a prediction task is defined as a problem using X to predict a single column (label) of Y. If there are multiple columns of Y, e.g., in multi-class classification scenario, we will end up with a multi-task learning problem. In the task-oriented feature selection method, we aim to select features, which are useful in the prediction task(s), based on the feature-target relationship. The motivation of considering the feature-target relationship is that, the high-level representation Y is the abstraction of the low-level representation X, thus they should have inherent relationships. In this paper, we assume that there exists a linear relationship between the feature matrix X and the target matrix Y. By using a linear regression model, the feature-target relationship can be explained by using a coefficient matrix W ∈ ℝd×c, which maps X to Y to achieve a minimum prediction residual , where XW is the prediction of Y. As not all the features (i.e., ROIs) are related to AD [15,17], we impose a sparsity constraint on W to select features that are discriminative to the targets. Then the resulting linear regression model with an added bias term and a sparsity constraint is given as
| (1) |
where b ∈ ℝc×1 is a bias term, e ∈ ℝn×1 denotes a vector with all ones, λ is a sparsity control parameter, ‖·‖F is the Frobenius norm, bT is the transpose operator on b, and ‖·‖2,1 is the ℓ2,1-norm regularization, which is defined as . The least square loss function (i.e., the first term in Eq. (1)) computes the sum of the prediction residuals, while the ℓ2,1-norm regularization (i.e., the second term in Eq. (1)) helps in selecting common discriminative features for all the prediction tasks.
The use of the ℓ2,1-norm regularization in Eq. (1) is based on the assumption that, a feature that is important to represent a target could also be informative to other targets, and vice versa. Thus, such a feature should be jointly selected or un-selected in representing the targets. Specifically, each column of W denotes the coefficient vector for one task, while each row of W denotes the weight vector of a feature for all the prediction tasks. The ℓ2,1-norm regularization first groups features in each row of W with the ℓ2-norm, and subsequently imposes row sparsity for the grouped features using the ℓ1-norm. Thus, the ℓ2,1-norm regularization tends to cause all-zero value rows in W. As each row of W corresponds to one feature in X, this is equivalent to joint feature selection for all the targets, i.e., selecting common brain regions that contribute to the clinical decision (e.g., AD, progressive Mild Cognitive Impairment (pMCI), stable MCI (sMCI) and Normal Control (NC)).
2.2 Representation-Oriented Unsupervised Feature Selection
The previous AD studies have observed the following neurophysiological characteristics: (i) AD may affect multiple brain regions simultaneously, rather than just a single region [17]; and (ii) human brain is a complex system where the brain regions are functionally interacting with each other [10]. In this regards, we assume that there are dependencies among ROIs (i.e., features), and thus devise a new regularizer to utilize this relational characteristic among ROIs for feature selection. Specifically, we define a linear regression model such that each feature xi in X can be represented as a linear combination of other features:
| (2) |
where sij is a weight between the i-th feature vector xi and the j-th feature vector xj, and pi is the bias term for the i-th feature. si = [s1i,…,sdi]T is a weight vector, where each element indicates the contribution of the corresponding feature in representing xi. In matrix form, Eq. (2) is equivalent to X ≈ XS−epT, where S ∈ ℝd×d is the coefficient matrix (with sij denotes its (i, j)-th element) and p = [p1,…, pj,…, pd]T ∈ ℝd×1 is the bias vector. By regarding the representation of each feature as a task and devising a sparsity constraint across tasks with an ℓ2,1-norm regularization, we define a representation-oriented feature selection method as follows1:
| (3) |
where α is a sparsity control parameter. The ℓ2,1-norm regularization ‖S‖2,1 penalizes all coefficients in the same row of S together for joint selection of features in reconstructing the feature matrix X.
The first term in Eq. (3) is a self-representation term, as X is approximated by a multiplication of a matrix to itself, i.e., XS + epT (we can ignore the bias term without lost of generality). Self-representation has been used in the literature to extract the sample-sample relationship [2,7], but, in our application, we use it to extract the feature-feature relationship, as each element of S can be regarded as a proximity measure between two features. Specifically, each column of S indicates how other features are used to represent a feature in X, while each row of S indicates how useful of a feature in representing other features. Moreover, the ℓ2-norm value of each row of S indicates the representativeness of a feature, i.e., how much contribution is the feature in representing others. In this study, we argue that a more representative feature (ROI) is more desirable, as it could be the main ROI that affects the disease progression, thus justifying the use of ℓ2,1-norm in the second term of Eq. (3).
2.3 Proposed Objective Function
We propose to combine the task-oriented feature selection method in Eq. (1) and the representation-oriented feature selection method in Eq. (3) into a unified framework, to take advantages of these two feature selection methods, i.e., complementary relationships of the feature-target and feature-feature relationships. The final objective function is given as follows:
| (4) |
where A = [W, S] ∈ ℝd×(c+d) is defined as a joint analyzer, i.e., a horizontal concatenation of W and S. Each row of A reflects the importance of a feature in jointly predicting the targets and representing other features.
We illustrate our formulation in Fig. 1. In brief, our formulation iteratively learns the coefficient matrices from both the task-oriented (the first term in Eq. (4)) and representation-oriented (the second term in Eq. (4)) feature selection methods until Eq. (4) achieves its optimal solution. The ℓ2,1-norm regularization in the third term of Eq. (4) encourages joint row sparsity in A, i.e., it encourages to have rows of all-zero values in A. Since each row of A is corresponding to a feature index in X, an all-zero value row indicates to unselect the corresponding feature in X. Since W and S give us the discriminative and representative information about the features, respectively, the selected features are discriminative and representative. Given the selected features, we use them to train a support vector machine (SVM) as our classifier.
Fig. 1.
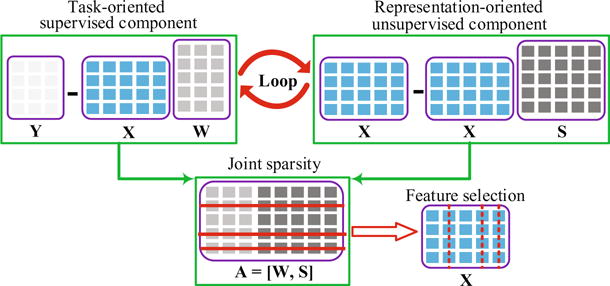
The framework of the proposed method, where the solid red lines and the dot red lines, respectively, imply removing the rows of A and the columns (i.e., features) of X. (Color figure online)
3 Experimental Results
We conducted experiments using the ADNI dataset (‘www.adni-info.org’) to compare the proposed method with the comparison methods, including “Original”, Fisher Score (FS) [1], Laplacian Score (LS) [5], SELF-representation (SELF) [18], Multi-Modal Multi-Task (M3T) [17], and Sparse Joint Classification and Regression (SJCR) [15]. “Original” method uses all the original features for classification, without any feature selection. Both FS and LS are the classic supervised (task-oriented) feature selection methods in machine learning. SELF is our unsupervised representation-oriented feature selection method, with the objective function given in Eq. (3). M3T and SJCR are the most recent task-oriented methods for AD diagnosis.
In our experiments, we used the baseline MRI data including 226 NC, 186 AD, and 393 MCI subjects. MCI subjects were clinically subdivided into 118 pMCI and 124 sMCI by checking which subjects have converted to AD within 24 months. We preprocessed MRI images by sequentially conducting spatial distortion correction, skull-stripping, and cerebellum removal, and then segmented MRI images into gray matter, white matter, and cerebrospinal fluid. We further parcellated MRI images into 93 ROIs based on a Jacob template, followed by computing the gray matter tissue volumes of the ROIs as features. With this, we obtained 93 gray matter volumes from one MRI image.
We considered two binary classification tasks (i.e., AD vs. NC and pMCI vs. sMCI) and two multi-class classification tasks (i.e., AD vs. NC vs. MCI (3-Class) and AD vs. NC vs. pMCI vs. sMCI (4-Class). The performance metrics used are classification ACCuracy (ACC), SENsitivity (SEN), SPEcificity (SPE), and Area Under Curve (AUC) for binary classification, while we only used ACC for multi-class classification.
We used 10-fold cross-validation to test all the methods, and employed a nested 5-fold cross-validation for model selection, where the parameter values were chosen from the ranges of {10−5, 10−3 …, 105} for all methods. We repeated the whole process 10 times and report the average results in this paper.
3.1 Classification Results
We summarize the results of all the methods in Table 1, with the following observations: (i) In the binary classification tasks, the proposed method outperforms all the comparison methods, with the improvement of average classification accuracies over other methods as 8.50 % (vs. Original), 3.80 % (vs. FS), 4.55 % (vs. LS), 4.99 % (vs. SELF), 3.30 % (vs. SJCR), and 3.75 % (vs. M3T), respectively. Based on these results, we confirm the superiority of our proposed method, which considers both the feature-target and feature-feature relationships, and selects the discriminative and representative features jointly. (ii) In the multi-class classification tasks, our method also outperforms all the comparison methods. For example, in the 3-class classification, our proposed method achieves an average classification accuracy of 63.9 %, an improvement of 14.5 % (vs. Original), 6.6 % (vs. FS), 6.0 % (vs. LS), 4.6 % (vs. SELF), 3.2 % (vs. M3T), and 3.6 % (vs. SJCR), respectively. In the 4-class classification, our proposed method achieves an average classification accuracy of 59.3 %, an improvement of 11.1 % (vs. Original), 8.0 % (vs. FS), 6.6 % (vs. LS), 5.7 % (vs. SELF), 4.0 % (vs. M3T), and 5.3 % (vs. SJCR), respectively. (iii) We found that the representation-oriented feature selection method (i.e., SELF) alone performs relatively poor, compared with the task-oriented feature selection methods (i.e., FS, LF, M3T, and JCSR). This is probably due to its unsupervised learning, i.e., without using target information. However, when it is used in conjunction with a task-oriented method, as in our proposed method, it helps enhance classification accuracies. This confirms our assumption that complementary information between the feature-target and the feature-feature relationships is useful for AD diagnosis.
Table 1.
Classification performance for all the methods.
| Methods | AD vs. NC | pMCI vs. sMCI | 3-Class | 4-Class | ||||||
|---|---|---|---|---|---|---|---|---|---|---|
| ACC | SEN | SPE | AUC | ACC | SEN | SPE | AUC | ACC | ACC | |
| Original | 0.781∗ | 0.856∗ | 0.725∗ | 0.799∗ | 0.645∗ | 0.623∗ | 0.601∗ | 0.700∗ | 0.494∗ | 0.482∗ |
| FS | 0.854∗ | 0.862∗ | 0.775∗ | 0.852∗ | 0.686⋆ | 0.651∗ | 0.647∗ | 0.732∗ | 0.573∗ | 0.513∗ |
| LS | 0.852∗ | 0.873∗ | 0.758∗ | 0.860∗ | 0.673∗ | 0.648∗ | 0.638∗ | 0.738∗ | 0.579∗ | 0.527∗ |
| SELF | 0.844∗ | 0.872∗ | 0.782⋆ | 0.818∗ | 0.673∗ | 0.670⋆ | 0.655∗ | 0.734∗ | 0.593∗ | 0.536∗ |
| M3T | 0.875∗ | 0.871∗ | 0.788∗ | 0.897⋆ | 0.675∗ | 0.678⋆ | 0.697⋆ | 0.775⋆ | 0.607⋆ | 0.553∗ |
| SJCR | 0.861∗ | 0.853∗ | 0.762⋆ | 0.883⋆ | 0.680∗ | 0.664⋆ | 0.668∗ | 0.766⋆ | 0.603∗ | 0.540∗ |
| Proposed | 0.903 | 0.915 | 0.819 | 0.912 | 0.713 | 0.681 | 0.755 | 0.781 | 0.639 | 0.593 |
(or ∗): Statistically significant results with p < 0.05 (or p < 0.001) between our method and all other comparison methods using paired-sample t-tests.
3.2 Most Discriminative Brain Regions
Figure 2 shows the frequency map of the proposed feature selection method, i.e., how frequently a feature is selected in 100 experiments, for all the classification tasks. From the figure, we observe that: (i) Our method, on average, selected 58.0 (AD vs. NC), 53.0 (pMCI vs. sMCI), 50.6 (3-Class), and 35.3 (4-Class) numbers of features, out of 93 features (as known as ROIs), respectively. (ii) The commonly top selected regions in all four different classification tasks are uncus right (22), hippocampal formation right (30), uncus left (46), middle temporal gyrus left (48), hippocampal formation left (69), amygdala left (76), middle temporal gyrus right (80), and amygdala right (83), where the number in the parentheses represents an index of the respective ROI. These regions are consistent with the regions selected in the previous literature that worked on binary classification [17]. In addition, these regions also have been reported to be closely related to AD and its prodromal stage (i.e., MCI) in clinical diagnosis [3,8]. In this regard, these regions could be used as the potential biomarkers for AD or MCI diagnosis. It is worth noting that the comparison methods also selected most of the above ROIs, but with a lesser frequency and consistency than our method.
Fig. 2.
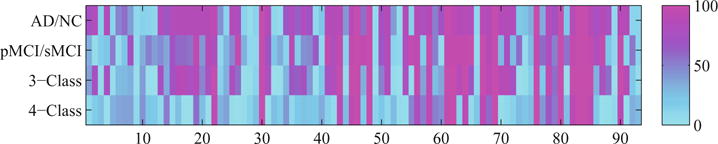
The frequency map (i.e., how frequent a feature (one of 93 ROIs) is selected in 100 experiments) of the proposed feature selection method for four different types of classification tasks. The horizontal axis indicates the indices of ROIs, while their full names can be found in the Supplementary Material.
4 Conclusion
In this paper, we proposed a novel feature selection method to consider both the feature-target relationship and the feature-feature relationship, by combining a task-oriented supervised method and a representation-oriented unsupervised method into a linear regression framework. Our proposed method selected features, which are discriminative to the targets and also representative to the other features. Our experimental results on the ADNI MRI data validated the effectiveness of our proposed method in both binary classification and multi-class classification tasks. In the future work, we will extend our proposed framework to the dataset with incomplete information [9,13,22].
Supplementary Material
Acknowledgments
This work was supported in part by NIH grants (EB006733, EB008374, EB009634, MH100217, AG041721, AG042599). Heung-Il Suk was supported in part by Institute for Information & communications Technology Promotion (IITP) grant funded by the Korea government (MSIP) (No. B0101-16-0307, Basic Software Research in Human-level Lifelong Machine Learning (Machine Learning Center)). Xiaofeng Zhu was supported in part by the National Natural Science Foundation of China under grants 61573270 and 61263035.
Footnotes
Electronic supplementary material The online version of this chapter (doi:10.1007/978-3-319-47157-0_10) contains supplementary material, which is available to authorized users.
Note that since a vector xi in the observation X can be used to represent itself, there always exists a feasible (trivial) solution. That is, its corresponding coefficient in S equals to one and all the other coefficients equal to zero. However, due to our assumption of dependencies among ROIs, i.e., rank(X) < min(n, d), where rank(X) indicates the rank of the matrix X, there also exist non-trial solutions in the space of I − null(X) [7], where null(X) stands for the null space of X.
References
- 1.Duda RO, Hart PE, Stork DG. Pattern Classification. Wiley; Hoboken: 2012. [Google Scholar]
- 2.Elhamifar E, Vidal R. Sparse subspace clustering: algorithm, theory, and applications. IEEE Trans Pattern Anal Mach Intell. 2013;35(11):2765–2781. doi: 10.1109/TPAMI.2013.57. [DOI] [PubMed] [Google Scholar]
- 3.Fox NC, Schott JM. Imaging cerebral atrophy: normal ageing to Alzheimer’s disease. Lancet. 2004;363(9406):392–394. doi: 10.1016/S0140-6736(04)15441-X. [DOI] [PubMed] [Google Scholar]
- 4.Guerrero R, Ledig C, Rueckert D. Manifold alignment and transfer learning for classification of Alzheimer’s disease. In: Wu G, Zhang D, Zhou L, editors. MLMI 2014. Vol. 8679. Springer; Heidelberg: 2014. pp. 77–84. (LNCS). [Google Scholar]
- 5.He X, Cai D, Niyogi P. Laplacian score for feature selection. NIPS. 2005:507–514. [Google Scholar]
- 6.Huang L, Jin Y, Gao Y, Thung K, Shen D, Initiative, A.D.N. et al. Longitudinal clinical score prediction in alzheimers disease with soft-split sparse regression based random forest. Neurobiol Aging. 2016;46:180–191. doi: 10.1016/j.neurobiolaging.2016.07.005. [DOI] [PMC free article] [PubMed] [Google Scholar]
- 7.Liu G, Lin Z, Yan S, Sun J, Yu Y, Ma Y. Robust recovery of subspace structures by low-rank representation. IEEE Trans Pattern Anal Mach Intell. 2013;35(1):171–184. doi: 10.1109/TPAMI.2012.88. [DOI] [PubMed] [Google Scholar]
- 8.Misra C, Fan Y, Davatzikos C. Baseline and longitudinal patterns of brain atrophy in MCI patients, and their use in prediction of short-term conversion to AD: results from ADNI. NeuroImage. 2009;44(4):1415–1422. doi: 10.1016/j.neuroimage.2008.10.031. [DOI] [PMC free article] [PubMed] [Google Scholar]
- 9.Qin Y, Zhang S, Zhu X, Zhang J, Zhang C. Semi-parametric optimization for missing data imputation. Appl Intell. 2007;27(1):79–88. [Google Scholar]
- 10.Sato JR, Hoexter MQ, Fujita A, Rohde LA. Evaluation of pattern recognition and feature extraction methods in ADHD prediction. Front Syst Neurosci. 2012;6:68. doi: 10.3389/fnsys.2012.00068. [DOI] [PMC free article] [PubMed] [Google Scholar]
- 11.Suk H, Wee C, Lee S, Shen D. Supervised discriminative group sparse representation for mild cognitive impairment diagnosis. Neuroinformatics. 2015;13(3):277–295. doi: 10.1007/s12021-014-9241-6. [DOI] [PMC free article] [PubMed] [Google Scholar]
- 12.Suk H, Wee C, Lee S, Shen D. State-space model with deep learning for functional dynamics estimation in resting-state fMRI. NeuroImage. 2016;129:292–307. doi: 10.1016/j.neuroimage.2016.01.005. [DOI] [PMC free article] [PubMed] [Google Scholar]
- 13.Thung K, Wee C, Yap P, Shen D. Neurodegenerative disease diagnosis using incomplete multi-modality data via matrix shrinkage and completion. NeuroImage. 2014;91:386–400. doi: 10.1016/j.neuroimage.2014.01.033. [DOI] [PMC free article] [PubMed] [Google Scholar]
- 14.Thung K, Wee C, Yap P, Shen D. Identification of progressive mild cognitive impairment patients using incomplete longitudinal MRI scans. Brain Struct Funct. 2015:1–17. doi: 10.1007/s00429-015-1140-6. [DOI] [PMC free article] [PubMed] [Google Scholar]
- 15.Wang H, Nie F, Huang H, Risacher S, Saykin AJ, Shen L. Identifying AD-sensitive and cognition-relevant imaging biomarkers via joint classification and regression. In: Fichtinger G, Martel A, Peters T, editors. MICCAI 2011, Part III. Vol. 6893. Springer; Heidelberg: 2011. pp. 115–123. (LNCS). [DOI] [PMC free article] [PubMed] [Google Scholar]
- 16.Zhang C, Qin Y, Zhu X, Zhang J, Zhang S. Clustering-based missing value imputation for data preprocessing. INDIN. 2006:1081–1086. [Google Scholar]
- 17.Zhang D, Shen D. Multi-modal multi-task learning for joint prediction of multiple regression and classification variables in Alzheimer’s disease. NeuroImage. 2012;59(2):895–907. doi: 10.1016/j.neuroimage.2011.09.069. [DOI] [PMC free article] [PubMed] [Google Scholar]
- 18.Zhu P, Zuo W, Zhang L, Hu Q, Shiu SCK. Unsupervised feature selection by regularized self-representation. Pattern Recogn. 2015;48(2):438–446. [Google Scholar]
- 19.Zhu X, Suk H, Lee S, Shen D. Canonical feature selection for joint regression and multi-class identification in Alzheimers disease diagnosis. Brain Imaging Behav. 2015:1–11. doi: 10.1007/s11682-015-9430-4. [DOI] [PMC free article] [PubMed] [Google Scholar]
- 20.Zhu X, Suk HI, Shen D. Multi-modality canonical feature selection for Alzheimer’s disease diagnosis. In: Golland P, Hata N, Barillot C, Hornegger J, Howe R, editors. MICCAI 2014, Part II. Vol. 8674. Springer; Heidelberg: 2014. pp. 162–169. (LNCS). [DOI] [PMC free article] [PubMed] [Google Scholar]
- 21.Zhu X, Suk H, Wang L, Lee SW, Shen D, Alzheimer’s Disease Neuroimaging Initiative et al. A novel relational regularization feature selection method for joint regression and classification in ad diagnosis. Med Image Anal. 2015 doi: 10.1016/j.media.2015.10.008. [DOI] [PMC free article] [PubMed] [Google Scholar]
- 22.Zhu X, Zhang S, Jin Z, Zhang Z, Xu Z. Missing value estimation for mixed-attribute data sets. IEEE Trans Knowl Data Eng. 2011;23(1):110–121. [Google Scholar]
Associated Data
This section collects any data citations, data availability statements, or supplementary materials included in this article.