Abstract
As malignant tumours develop, they interact intimately with their microenvironment and can activate autophagy1, a catabolic process which provides nutrients during starvation. How tumours regulate autophagy in vivo and whether autophagy affects tumour growth is controversial2. Here we demonstrate, using a well characterized Drosophila melanogaster malignant tumour model3,4, that non-cell-autonomous autophagy is induced both in the tumour microenvironment and systemically in distant tissues. Tumour growth can be pharmacologically restrained using autophagy inhibitors, and early-stage tumour growth and invasion are genetically dependent on autophagy within the local tumour microenvironment. Induction of autophagy is mediated by Drosophila tumour necrosis factor and interleukin-6-like signalling from metabolically stressed tumour cells, whereas tumour growth depends on active amino acid transport. We show that dormant growth-impaired tumours from autophagy-deficient animals reactivate tumorous growth when transplanted into autophagy-proficient hosts. We conclude that transformed cells engage surrounding normal cells as active and essential microenvironmental contributors to early tumour growth through nutrient-generating autophagy.
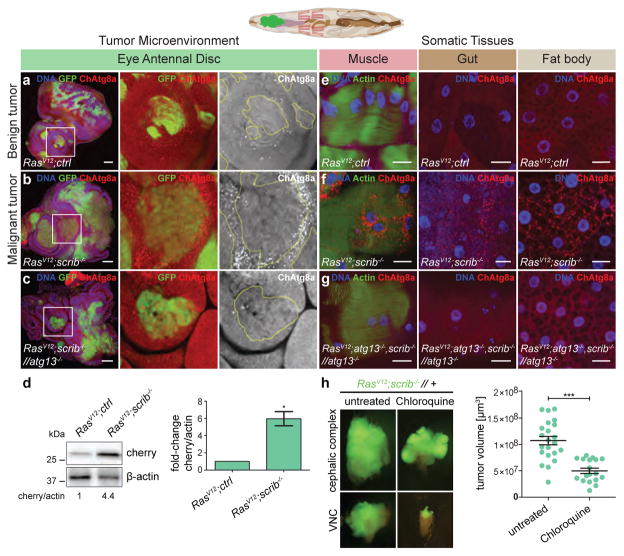
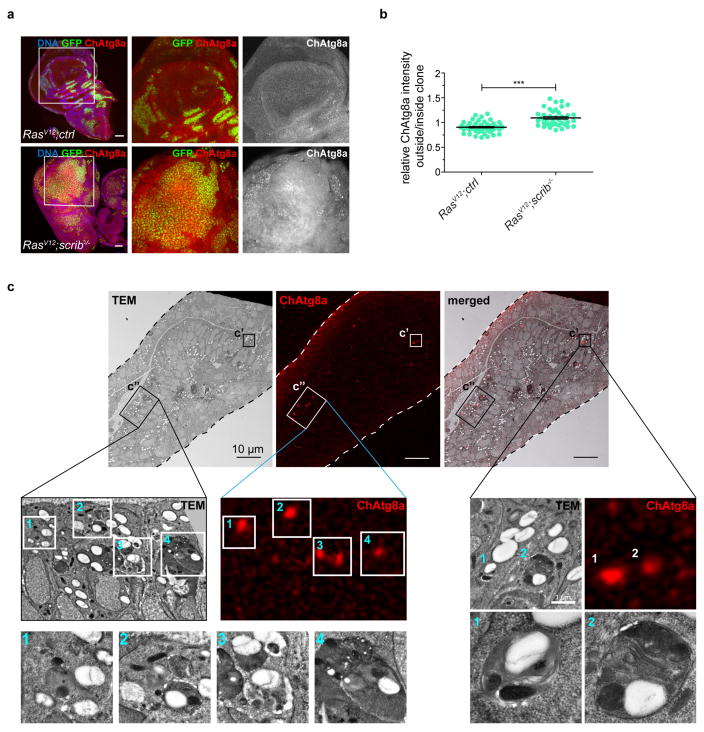
To assess autophagy during Drosophila tumour growth, we generated green fluorescent protein (GFP)-labelled malignant RasV12scrib−/− eye imaginal disc (EAD) tumours in animals carrying the autophagosome marker Atg8a tagged with mCherry (ChAtg8a) under the control of its endogenous promoter5,6. These tumours grow and invade the central nervous system, eventually killing the host3,4,7. In contrast to RasV12-expressing clones, ChAtg8a puncta accumulated strongly in epithelial cells surrounding RasV12scrib−/− tumour cells, with only marginal accumulation in the tumour itself (Fig. 1a, b and Extended Data Fig. 1a, b).
Figure 1. RasV12scrib−/− tumours induce NAA.
Top, cartoon showing colour-coded larval tissues. a–c, Representative confocal images of eye-antennal discs (EAD) carrying RasV12clones (a), RasV12scrib−/− clones (b), and RasV12scrib−/− clones confronted with atg13−/− cells (c). Insets (white outline) are shown enlarged. n = 24 (RasV12ctrl) n = 20 (RasV12scrib−/− and n = 5 (RasV12scrib−/− //atg13−/−) discs from three independent experiments. d, Western blot analysis and quantification of ChAtg8a processing in EAD. e, ChAtg8a puncta in various tissues from feeding mid L3 larvae carrying RasV12 clones. f, g, RasV12scrib−/− tumours in wild-type (f) and atg13-deficient animals (g). Representative confocal images of n = 11 (RasV12ctrl), n = 7 (RasV12scrib−/−) and n = 4 (RasV12atg13−/−scrib−/− //atg13−/−) animals from three independent experiments. h, Epifluorescent images of cephalic complex and VNC and tumour volume quantification of RasV12scrib−/− tumours at day 10 fed with chloroquine. n = 22 (untreated), n = 18 (Chloroquine). Data are mean ± s.e.m. from three independent pooled experiments (d, h). *P = 0.0266 from one-sample t-test (d); ***P = 0.0003 from unpaired two-tailed t-test (h). Scale bars, 50 μm (a–c) or 25 μm (e–g). For gel source images, see Supplementary Data.
ChAtg8a structures were readily assigned to autophagic structures by correlative light and electron microscopy (Extended Data Fig. 1c) and were not observed in cells deficient in the essential autophagy gene atg13, and lysosomal processing of ChAtg8a increased in the presence of tumour cells. Together, these data demonstrate that the presence of ChAtg8a reflects autophagy activity in this system (Fig. 1c, d; for gel source data, see Supplementary Data).
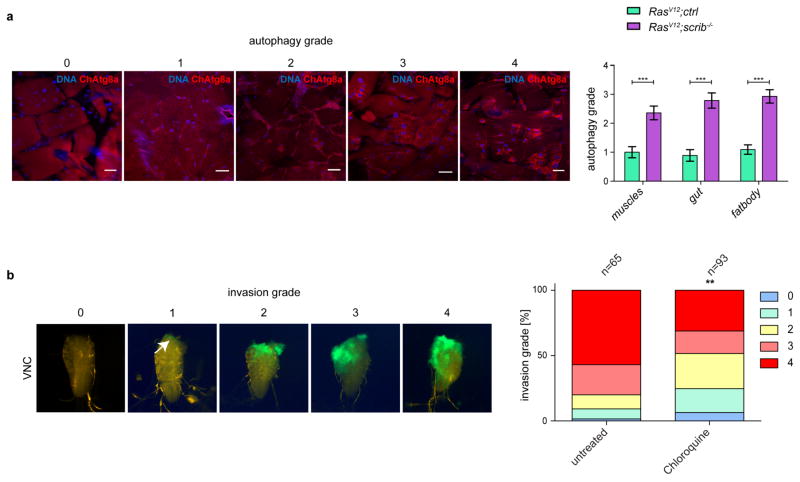
As adult Drosophila tumours have recently been found to induce a cachexia-like response in the animal8,9, we assessed whether peripheral organs responded to eye-specific tumours in larvae. Upregulation of autophagy was observed in the muscle, fat body and midgut of RasV12scrib−/− but not RasV12 tumour-bearing larvae and was lost altogether in atg13-deficient animals8,9 (Fig. 1e–g and Extended Data Fig. 2a). Taken together, these data show that malignant RasV12scrib−/−, but not benign RasV12 tumours lead to local and systemic non-cell-autonomous autophagy (NAA).
Oral administration of the autophagy flux inhibitor chloroquine10 led to a significant reduction in tumour growth and invasion (Fig. 1h and Extended Data Fig. 2b). Therefore, we investigated whether NAA in the microenvironment, distal organs or both may contribute to tumour growth. We generated recombinant chromosomes that allowed autophagy to be ablated through the induction of atg13 or atg14 deficiency in specific compartments during tumour growth (Extended Data Figs 3, 4). RasV12scrib−/− tumours were generated with the simultaneous prevention of autophagy: (i) within the tumour only; (ii) in the surrounding cell population only; (iii) in both cell populations within the tumour-bearing organ; or (iv) in the entire animal.
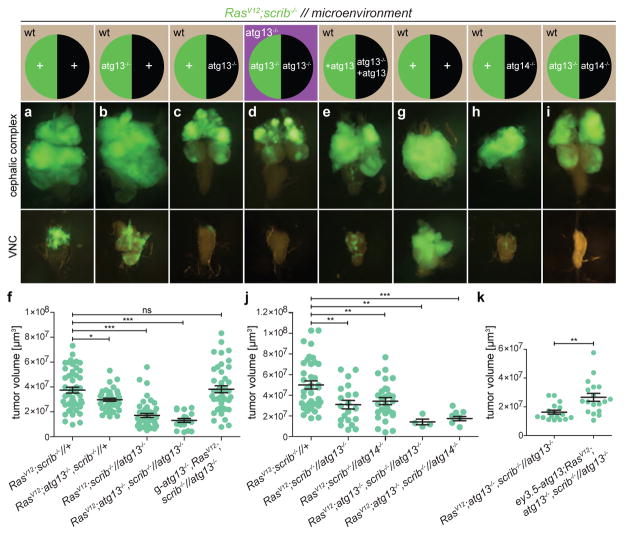
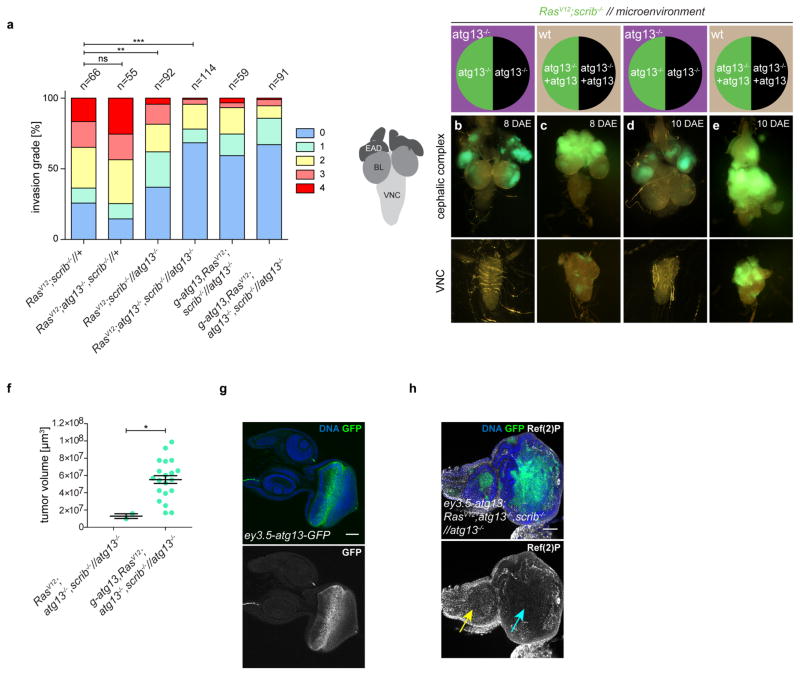
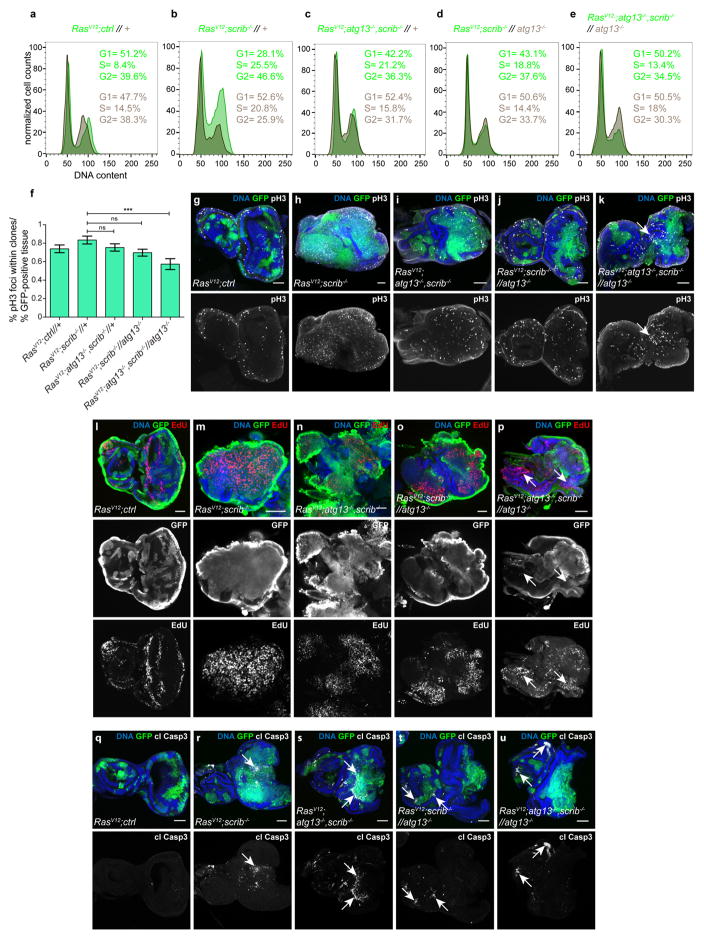
RasV12scrib−/− tumours overgrew, with most invading into the ventral nerve cord (VNC) by day 8 (refs 3, 4, 7) (Fig. 2a, f and Extended Data Fig. 5a). Consistent with previous work, we found that preventing autophagy within the tumour caused a moderate, albeit significant, reduction in tumour volume11,12, but did not reduce invasion (Fig. 2b, f and Extended Data Fig. 5a). By contrast, ablation of autophagy in cells surrounding RasV12scrib−/− clones strongly reduced tumour growth and invasion (Fig. 2c, f and Extended Data Fig. 5a). Removal of autophagy in both cell populations through the creation of a mutant animal with complete loss of function in atg13 reduced tumour volume and invasiveness even further (Fig. 2d, f and Extended Data Fig. 5a). In both contexts, tumour growth was rescued by complementation with a genomic atg13 construct (Fig. 2e, f and Extended Data Fig. 5b–f). Each of these manipulations reduced the elevated cell cycle entry and progression displayed by tumour cells (Extended Data Fig. 6a–p), with no marked increase in tumour apoptosis (Extended Data Fig. 6q–u). Finally, we induced defective autophagy specifically in the tumour-bearing organ through mitotic recombination between the atg14 and atg13, scrib-carrying chromosome arms. Notably, tumour growth was reduced by a similar extent in this organ-specific mutant as in fully mutant atg13 animals, suggesting that the role autophagy plays in support of tumour growth is local (Fig. 2g–j). To test this, we rescued atg13 expression specifically in eye discs (ey3.5-atg13)13 and found that this restored autophagic activity and significantly rescued tumour growth in tumour-bearing atg13 mutant animals (Fig. 2k and Extended Data Fig. 5g, h). Taken together, these results show that RasV12scrib−/− tumours require local NAA for initial tumour growth and expansive invasion into neighbouring tissue.
Figure 2. Local NAA is required for tumour growth and invasion.
a–e, g–i, Cartoon (top)illustrates the genotype of EAD (circle, tumour cells in green, microenvironment in black) and other somatic tissues (square). Fluorescent images of tumour growth and invasion (green) in the indicated tissues at day 8 or day 10 is shown below. a depicts RasV12scrib−/− tumours and b depicts tumours with tumour cells deficient in atg13. c depicts RasV12scrib−/− tumours surrounded by an atg13-null microenvironment whereas d depicts an entirely atg13-null animal. e depicts an atg13-null EAD complemented with transgenic atg13, rescuing tumour growth. f, Quantification of tumour volumes at day 8. n = 49 (RasV12scrib−/−//+); n = 42 (RasV12atg13−/−scrib−/−//+); n = 45 (RasV12scrib−/−//atg13−/−); n = 18 (RasV12atg13−/−scrib−/−//atg13−/−); n = 43 (g-atg13+RasV12scrib−/−//atg13−/−). g depicts RasV12scrib−/− tumours at day 10, h shows the same but with atg14-null cells in the microenvironment, whereas i shows atg13-deficient tumours confronted with atg14−/− cells in the microenvironment. j, Quantification of tumour volumes of the indicated genotypes at day 8. n = 38 (RasV12scrib−/−//+). n = 20 (RasV12scrib−/−//atg13−/−). n = 28 (RasV12scrib−/− //atg14−/−). n = 4 (RasV12atg13+scrib−/−//atg13−/−). n = 8 (RasV12atg13−/−scrib−/− //atg14−/−). k, Tumour volumes with or without EAD-specific rescue construct ey3.5-atg13 at day 10. n = 17 (RasV12atg13−/−scrib−/−//atg13−/−). n = 18 (ey3.5-atg13+RasV12atg13−/−scrib−/−//atg13−/−). Values depict mean ± s.e.m. of three independent pooled experiments (f, j, k). NS, not significant, *P ≤ 0.05, **P ≤ 0.01, ***P < 0.0001 from one-way ANOVA with Dunnett’s correction (f, j). **P = 0.0011 from unpaired two-tailed t-test (k).
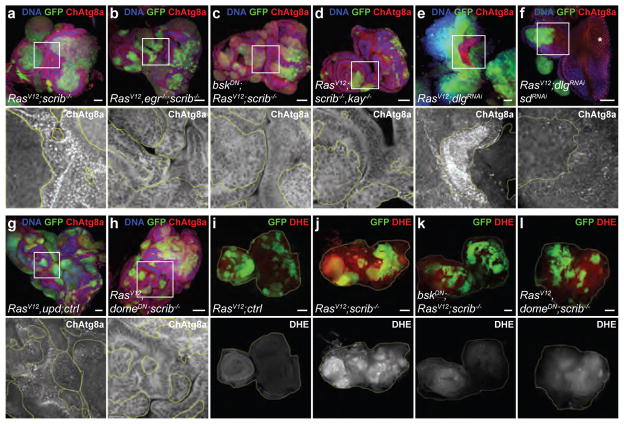
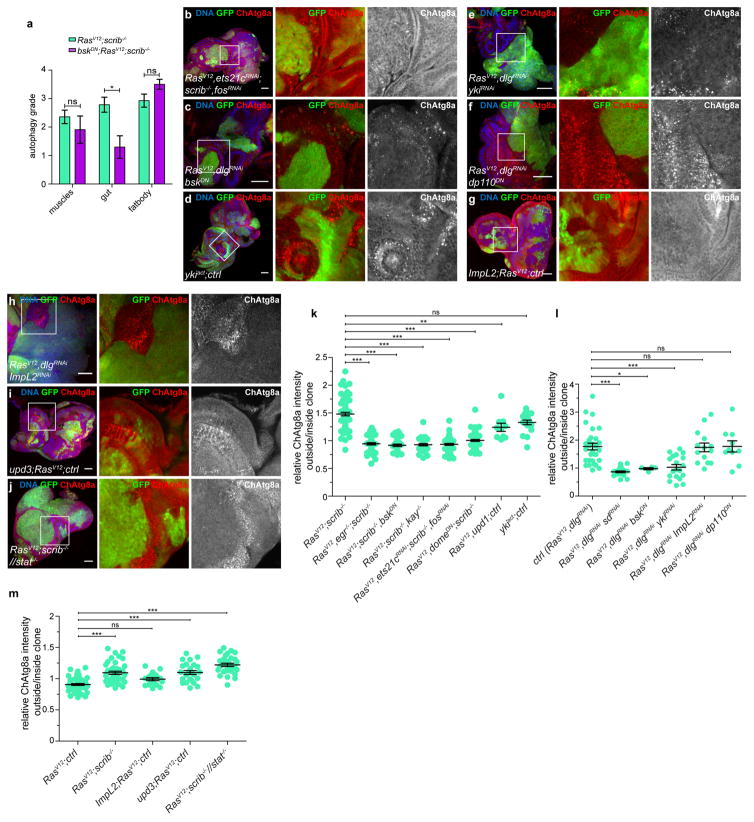
Earlier studies have established that the growth and invasion of RasV12scrib−/− tumours involve the TNF–JNK–Fos and IL-6–JAK–STAT cytokine signalling pathways3,14–19. RasV12scrib−/− tumours failed to induce NAA in TNF-deficient (egr−/−) animals or when JNK activity was blocked in the tumour (Fig. 3a–d and Extended Data Fig. 7b, k), indicating that autophagy requires tumour-specific TNF/JNK signalling. Notably, systemic autophagy activation remained when JNK signalling was inhibited, suggesting that local and systemic control of autophagy are achieved by different mechanisms (Extended Data Fig. 7a).
Figure 3. RasV12 scrib−/− tumours produce ROS and induce NAA downstream of Egr/TNF, JNK, Sd/Yki and Upd cytokines.
a–h, Representative confocal images of EAD from three independent experiments, quantified in Extended Data Fig. 7k, l, m and fluorescently labelled as indicated. Insets (white outline) are shown enlarged, clones are outlined in yellow. Cells are under the following conditions: RasV12scrib−/− (a); RasV12egr−/−scrib−/− (b); bskDNRasV12scrib−/− (c); RasV12scrib−/−kay−/− (d); RasV12dlgRNAi (e); RasV12dlgRNAisdRNAi (f); RasV12upd ctrl (g); RasV12domeDNscrib−/− (h). i–l, Dihydroethidium staining of EADs to measure ROS production, with cells under the following conditions: RasV12ctrl (i; n = 8); RasV12scrib−/− (j; n = 30); bskDNRasV12scrib−/− (k; n = 11); RasV12domeDNscrib−/− (l; n = 8). domeDN cells are unable to signal through JAK/STAT pathways, bskDN cells are unable to signal through JNK pathways. EADs are outlined for better visibility. Scale bars, 50 μm (a–l).
JNK cooperates with Hippo (encoded by hpo)/Yorkie (encoded by yki)/Scalloped (encoded by sd) signalling to drive tumour growth in RasV12scrib−/− animals18. To evaluate the role of Hippo signalling, we knocked down the Scrib polarity module component discs large (encoded by dlg1) while simultaneously overexpressing RasV12 in half of the eye-antennal disc15,20. These tumours phenocopied RasV12scrib−/− tumours, rapidly out-growing the neighbouring microenvironmental cells that exhibited robust induction of NAA (Fig. 3e). However, JNK inhibition reversed NAA, validating the system for epistasis analysis (Extended Data Fig. 7c, l). The overexpression of Ykiact alone recapitulated induction of NAA (Extended Data Fig. 7d, k), whereas silencing of either yki or sd in RasV12dlg1RNAi tumours reversed overgrowth and NAA (Fig. 3f and Extended Data Fig. 7e, l). This does not appear to be a consequence of reduced tumour growth, as discs in which tumour burden was reduced by expression of dominant negative PI3K (dp110DN) still showed robust NAA (Extended Data Fig. 7f, l). The data suggest that the transcriptional target(s) that are required for NAA respond both to Yki/Sd and to Fos. Targets of Yki/Sd and Fos include the insulin-binding antagonist ImpL2, a mediator of organ wasting8,9, and the IL-6-like inflammatory cytokines unpaired 1, unpaired 2 and unpaired 3 (ref. 19). Although ImpL2 was neither necessary nor sufficient for the induction of NAA, the overexpression of either upd or upd3 by RasV12 animals induced NAA, suggesting that these cytokines can mediate NAA (Fig. 3g and Extended Data Fig. 7g–i, l, m).
To investigate how cytokine signalling may regulate NAA, we inactivated downstream JAK–STAT signalling in either tumours or the microenvironment specifically. We observed a robust NAA response in discs in which microenvironmental signalling was disrupted, but this was absent when signalling was inactivated in the tumour (Fig. 3h and Extended Data Fig. 7j, m), suggesting that NAA induction involves autocrine signalling.
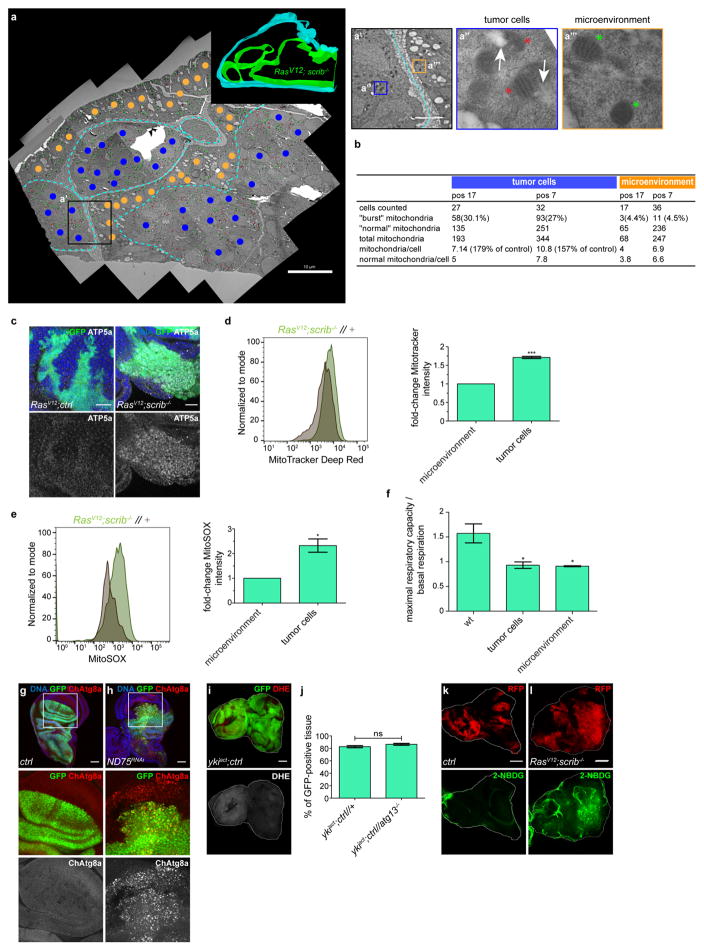
Assays revealed that RasV12scrib−/− tumours have damaged mitochondria, increased mitochondrial mass and production of reactive oxygen species (ROS), and altered respiration (Fig. 3i, j and Extended Data Fig. 8a–f). Experimental mitochondrial ROS generation induced by ND75 knockdown was sufficient to trigger autophagy21 (Extended Data Fig. 8g, h). Ykiact-induced NAA did not involve increased ROS and the growth of these benign-like tumours does not depend on NAA (Extended Data Fig. 8i, j). Inhibition of either JNK or JAK–STAT in RasV12scrib−/− tumours reversed ROS accumulation18 (Fig. 3k, l). Thus, high levels of ROS and NAA are co-regulated in RasV12scrib−/− tumours and rely on co-transcriptional changes in Fos-, Yki/Sd- and STAT-mediated mitogenic signalling.
The direct inducer of NAA in this context has still to be defined, but it may not be a single factor. Efforts to scavenge ROS by pharmaceutical or genetic means failed to reverse RasV12scrib− induced NAA, although scavenger efficacy could not be confirmed. Nevertheless, these data suggest that highly proliferative RasV12scrib−/− Drosophila tumours are metabolically stressed, produce high levels of ROS and potentially rely on increased import of nutrients—as in humans. Indeed, we observed an increase in the import of the fluorescently labelled glucose analogue (2-NBDG) in RasV12scrib− tumour cells (Extended Data Fig. 8k, l)
Microenvironmental autophagy has been proposed to provide recycled nutrients, including amino acids, locally in order to support tumour growth22. If this is the case, then tumour growth should be hypersensitive to reduced amino acid import. To test this, we silenced the cationic and neutral amino acid transporter slimfast (encoded by slif), the loss of which has previously been shown to have minimal effect on proliferation of wild-type cells23. Silencing of slif markedly reduced growth of RasV12dlgRNAi tumours, indicating that the metabolic demand of tumour cells to sustain growth and proliferation is met, in part, by the increased import of amino acids (Fig. 4a and Extended Data Fig. 9a).
Figure 4. Malignant tumours are dependent on amino acid import and host autophagy.
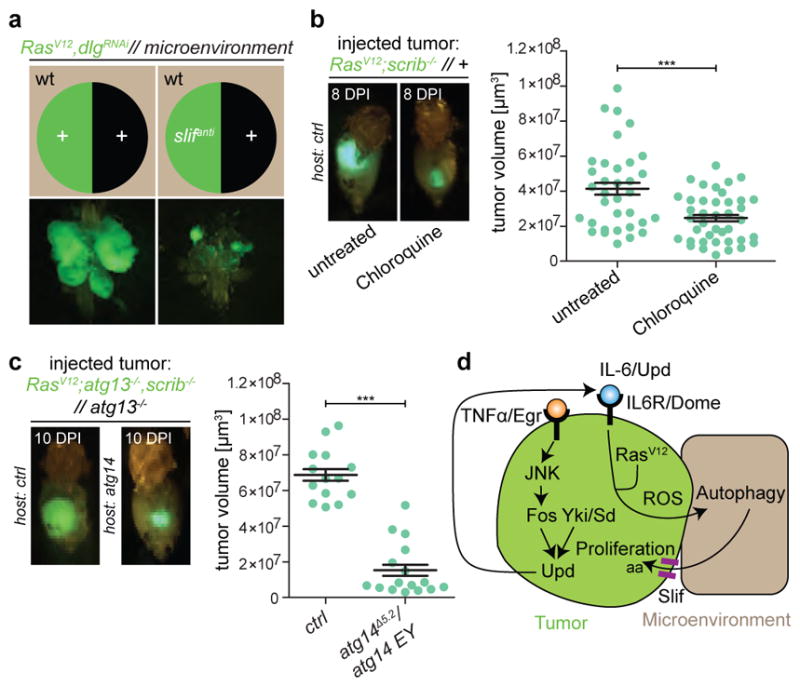
a, Representative transformed cephalic complexes of RasV12dlgRNAi animals with or without knockdown of the amino acid transporter slimfast. n = 15 (RasV12dlgRNAi) and n = 13 (RasV12dlgRNAislifanti) from three independent experiments. b, Allograft tumour growth in hosts raised on control or chloroquine-enriched food at 8 days post injection (DPI). n = 34 (untreated) and n = 40 (chloroquine). c, RasV12atg13−/−scrib−/−//atg13−/− tissue allografted into control and atg14-mutant hosts. n = 14 (ctrl hosts) and n = 16 (atg14Δ15-4/atg14 EY14568 hosts). d, A schematic summarizing key findings. Autophagy is induced in the epithelial microenvironment of RasV12scrib−/− tumours. Transformed cells display mitochondrial dysfunction with ROS generation, and require JNK signalling, transcriptional activity of Fos and Sd/Yki and cell-autonomous JAK/STAT signalling to elicit NAA, which may provide recycled nutrients, such as amino acids (AA) to support tumour growth. Data are mean ± s.e.m. of three independent pooled experiments; ***P = 0.0003 (b) and ***P < 0.0001 (c) from unpaired two-tailed t-test.
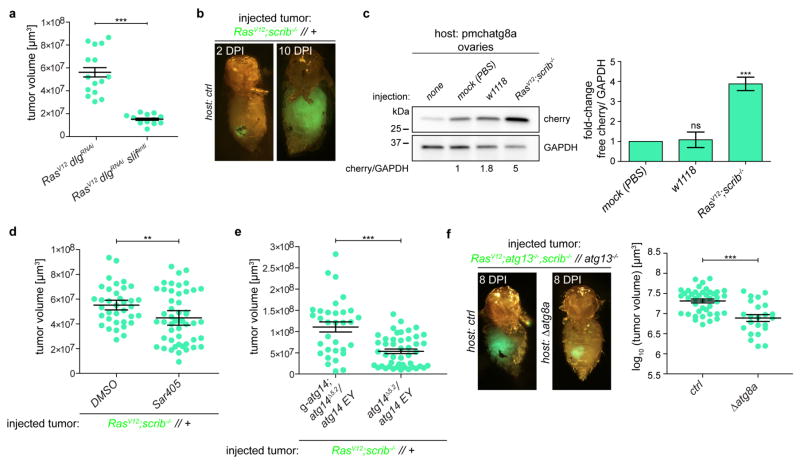
To investigate whether the requirement of autophagy for tumour growth is permanent and reliant on local factors, we performed allograft experiments24. RasV12scrib−/− allografts grew into large tumours, with a concomitant increase in control host ChAtg8a processing (Extended Data Fig. 9b, c). Tumour growth could be pharmacologically restricted by administration of autophagy inhibitors; notably, tumours also grew more poorly in atg14Δ5.2/atg14EY14568 hypomorphic hosts than in control hosts (Fig. 4b and Extended Data Fig. 9d, e). This suggests that the autophagy capacity of the host, and not tumour location or original tumour environment, determines growth. To investigate whether the lack of tumour growth in autophagy-deficient animals is reversible, we transplanted poorly growing RasV12atg13−/−scrib−/−//atg13−/− tumours into control or atg14Δ5.2/atg14EY14568 hosts. Strikingly, this autophagy-deficient tumour tissue, which grew very poorly in atg13 mutant larvae (Fig. 2d), was capable of regrowth and formed large tumours when transplanted into a control host (Fig. 4c). By contrast, RasV12atg13−/−scrib−/−//atg13−/− tumours transplanted into atg14Δ5.2/atg14EY14568 or atg8 hosts remained smaller (Fig. 4c and Extended Data Fig. 9f). Thus, autophagy-deficient tumours are dormant but can resume growth in an autophagy-proficient ectopic environment.
Malignant tumour growth induces autophagy, both in the microenvironment and distal tissues. Locally, normal epithelial cells are engaged as an active part of the microenvironment, supporting tumour proliferation by autophagy. Systemically, autophagy in distant organs may support the growth of allografted tumour tissue. Most previous studies have focused on the cell-autonomous role of autophagy in Ras-driven malignancies2,11,25. In line with these studies, we find that cell-autonomous autophagy supports tumour growth, although our experimental model shows that the non-cell-autonomous effects of autophagy are much more striking. Our studies are consistent with a model in which early tumours concomitantly upregulate the import of nutrients and engage the microenvironment to recycle nutrients to support their own growth through autophagy (Fig. 4d). Given the conserved pathways studied, similar tumour–microenvironment co-operation may occur in human cancers.
METHODS
Fly husbandry
Stocks and crosses were kept at 25 °C on standard potato mash fly food containing 32.7 g dried potato powder, 60 g sucrose, 27.3 g dry yeast, 7.3 g agar, 4.55 ml propionic acid, and 2 g nipagin per litre, resulting in a final concentration of 15.3 g l−1 protein and 6 g l−1 sugar.
Fly genetics
Clones of mutant cells were generated in EADs using the mosaic analysis with a repressible marker (MARCM) and CoinFLP systems with ey-flp5,20. Detailed genotypes of the experimental animals are described in Supplementary Information.
Fly stocks
(1) Frt82B, (2) y, w;P{EPgy2}atg14EY14568, (3) y,v; sd-RNAiTRiP.JF02514, (4) y,v; yki-RNAiTRiP.HMS00041, (5) y, w, ey-FLP.N2, UAS-Dcr-2; sp./CyO, (6) sp./CyO; CoinFLP-Gal4/TM6C, (7) ubx-flp1, tubGal4, UAS-GFP, y,w; Frt82B tubP-Gal80/TM6, (8) UAS-mCD8-GFP, and (9) UAS- slifUY681 were obtained from the Bloomington Stock Center. (10) atg14Δ5.2, (11) g-atg13, (12) g-atg14, (13) ey3.5-Hsp70-DmAtg13 and (14) ey3.5-Hsp70-DmAtg13-GFP (this study). (15) Frt82B, scrib2,(16) atg8d4, (17) 3xCh-atg8a (G. Juhász). The following stocks were provided to us (18) y,w,ey-flp; Act>y+>Gal4, UAS-GFP/CyO; Frt82B, tub-Gal80, (19) y,w;UAS-RasV12/CyO; Frt82B/TM6B; (20) y,w; UAS-RasV12,UAS-domeΔcyt2.1/CyO; Frt82B, scrib2/TM6B and (21) UAS-RasV12, UAS-upd; Frt82B (T. Xu). (22) UAS-RasV12/CyO; Frt82B scrib1, UAS-bskDN/TM6B, (23) w;UAS-ets21clong-RNAi,UAS-RasV12/CyO; Frt82B scrib1, UAS-fos39/19RNAi/TM6B, (24) w;UAS-RasV12/CyO; Frt82B scrib1, kay3/TM6B, (25) w;UAS-RasV12, exp::LacZ;Frt82B scrib1/S-T (M. Uhlirova)18, (26) y,w,ey-flp1;act>y+>GFP,UAS-GFP,egr1/CyO;FRT82,tub80/TM6B, (27) y,w, eyFLP1; G454, Act>y+>Gal4, UAS-mRFP; FRT82B, Tub-Gal80 (T. Igaki)27,28, (28) >Ras,egr3/CyO; FRT82B, scrib1/TM6B (M. Vidal)17, (29) atg13Δ81 (T. P. Neufeld)29, (30) w, upd3 p[XP]d0495 (M. Zeidler), (31) pmCh-atg8a (E. Baehrecke)6, (32) UAS-BskDN (D. Bohmann), (33) Frt82B stat92E85C9 (G. Halder), (34) UAS-s.Imp-L2 (E. Hafen)30, (35) UAS-dlgRNAi, UAS-RasV12 (ref. 15), (36) UAS-dp110D945A (S. M. Cohen).
Generation of atg14 deletion and genomic rescue stocks
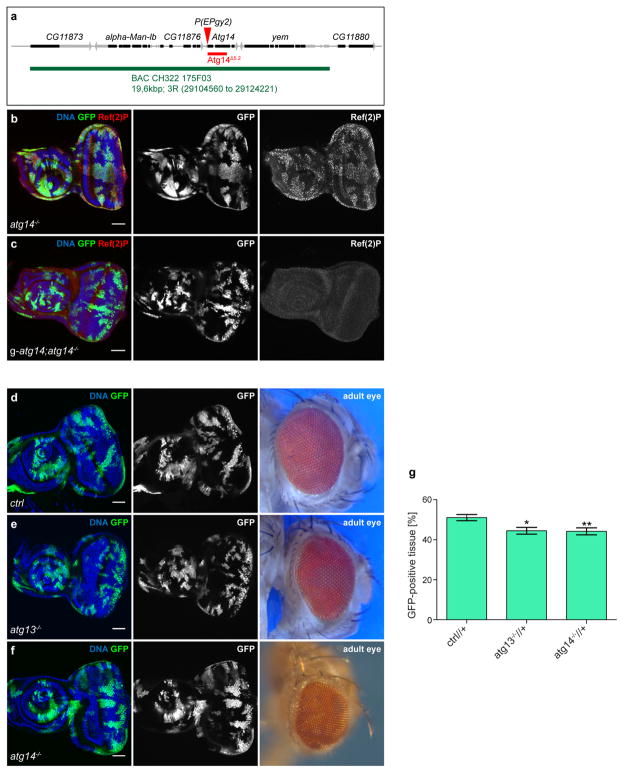
The viable P-element line y1 w67c23; P{EPgy2}atg14EY14568 was used to create small deletions in the CG11877/atg14 locus by transposase-mediated imprecise excision. The resulting deletion of 1,191 bp in atg14Δ5.2 removed the ATG start site and 2/3 of the coding region. Genomic rescue stocks were created using BACs from the P[acman] resources, covering the atg13 (CH322-168O18, 21 kbp) or atg14 (CH322-175F03 20 kbp) locus, respectively. ΦC31 integrase-mediated transgenesis was used for site-directed integration in the cytological site 22A3 (Best Gene), creating the g-atg13 and g-atg14 genomic rescue transgenes.
Generation of transgenic ey3.5-Hsp70-DmAtg13
The vector backbone was obtained by cutting pattB with HpaI and XbaI. This PhiC31 integrase-compatible plasmid utilizes the hsp70 minimal promoter to clone the enhancer region; in this case, an eye-specific ‘ey3.5’ fragment (ey3.5-hsp70P from pEy3.5-tTA plasmid13 and DmAtg13 from pBluescript-SK-DmAtg13 plasmid (LD09558, DGRC)). Fragments were PCR amplified and sub-cloned into the pattB vector using Gibson Assembly Master Mix (E2611L, NEB). For eGFP-DmAtg13 rescue fly lines, eGFP coding sequence was inserted into pBluescript-SK-DmAtg13. The resulting DmAtg13-eGFP fragment was used to generate the pattB-ey3.5-hsp70P-DmAtg13-eGFP construct (further cloning details are available upon request). X-chromosome-specific insertions of pattB-ey3.5-hsp70P-DmAtg13 and pattB-ey3.5-hsp70P-DmAtg13-eGFP were generated with site-directed integration by ΦC31 integrase-mediated transgenesis in the cytological site 2A3 (Best Gene).
Immunofluorescence microscopy
Third instar eye-antennal discs were dissected in PBS and fixed in 4% pFA for 30 min at room temperature. Samples were washed twice with PBX (0.3% (v/v) Triton X-100, 3% BSA in PBS) and blocked for 1 h at room temperature. Incubation with the primary antibody was performed overnight at 4 °C, followed by two washes in PBX and incubation with secondary antibody for 2.5 h at room temperature. Hoechst 33342 (Life technologies, H3570, final concentration 5 μg ml−1) and Alexa Fluor-647 Phalloidin (H3572, 1:200) were added to stain nuclei and actin, respectively. For systemic autophagy scoring, mid-L3 larvae (5 days after 24 h egg lay) were dissected and fixed in 4% paraformaldehyde for 5 h, followed by Hoechst and phalloidin staining. Samples were mounted in Vectashield mounting medium (H-1000) and observed with a Zeiss LSM 710 or LSM 780 confocal microscope. Antibodies used in this study: phospho-histone 3 (Upstate, rabbit, 1:1,000), cleaved caspase-3 (Cell Signaling, rabbit, 1:1,000), Ref(2)P (rabbit, 1:2,000), GFP (Invitrogen, rabbit, 1:300), ATPa5 (15H4C4) (Abcam, mouse, 1:1,000). Secondary antibodies were from Jackson Immunoresearch (Alexa Fluor 488, Alexa Fluor 647 and Dy 649) and Molecular Probes (Alexa Fluor 555).
EdU incorporation
Cephalic complexes including EADs of wandering L3 larvae were dissected in Schneider’s medium (Gibco) and allowed to incorporate EdU (5-ethynyl-2′-deoxyuridine; 5 μM) for 10 min at room temperature followed by fixation in 4% pFA for 30 min. Samples were washed and blocked in PBX, EdU-click-iT labelling was carried out according to the manufacturer’s instructions (Life Technologies, C-10338). Clones were labelled with anti-GFP antibodies overnight.
2-NBDG sugar-uptake assay
EADs of third instar larvae were dissected out and collected in Drosophila larval saline (HEPES-NaOH (pH 7.1), 87 mM NaCl, 40 mM KCl, 8 mM CaCl2, 50 mM sucrose and 5 mM trehalose) on ice. Discs were incubated at room temperature in 0.25 mM 2-(N-(7-nitrobenz-2-oxa-1,3-diazol-4-yl)amino)2-deoxyglucose (2-NBDG, Life Lechnologies) for 15 min, rinsed with larval saline, mounted and imaged immediately.
Dihydroethidium staining
Dihydroethidium (DHE) staining was performed as described previously (http://www.nature.com/protocolexchange/protocols/414). In brief, EADs of wandering L3 larvae were dissected in Schneider’s medium (Gibco) and incubated for 7 min in 30 μM DHE (Life Technologies, D11347) at room temperature followed by three 5-min washes in Schneider’s medium. Discs were subsequently fixed in 4% paraformaldehyde for 5 min, washed once in PBS, mounted and imaged immediately.
Tumour volume analysis, pH3 quantification and relative intensity measurements
Cephalic complexes, including EAD, brain lobes and ventral nerve cord, were dissected at day 8 or 10 after 24-h egg lay, fixed in 4% paraformaldehyde and scored for invasion. Representative overview images were taken on a Leica MZ FLIII fluorescence stereomicroscope with a Leica DFC420 camera. Subsequently, samples were mounted in Vectashield for volume quantification with spacers to avoid squashing of the tissue. Confocal z-stacks were recorded with a section thickness of 3 μm. GFP-positive tumour volume was calculated from 3D-reconstructions of absolute intensities of confocal z-stacks using Imaris 7.6.3 software. Relative clone size was calculated as a ratio of GFP positive tissue volume normalized to total disc volume visualized with Hoechst 33342 staining.
Phosphorylated histone 3 was quantified from single confocal sections. Background was subtracted (rolling ball radius 15 pixels) and phosphorylated histone 3 spots were thresholded automatically using the ‘default’ threshold in Fiji. Particles smaller than 10 pixels were excluded from analysis. GFP clone area was extracted using rolling ball background subtraction (radius 300 pixels) and ‘Li’ thresholding. Phosphorylated histone 3 spots within GFP clones were extracted with the binary feature extractor. The area of the full disc was derived from DNA staining with Hoechst. Images were subjected to background subtraction (rolling ball radius 500 pixels) and thresholded with the ‘Li’ threshold. Phosphorylated histone 3-positive spots within GFP clones were normalized to total numbers of spots and to percentage of GFP-positive tissue area within a disc.
Relative ChAtg8a intensities ratios were calculated by measuring average intensities in 5 ROIs (70-pixel diameter) within and 5 ROIs outside a clone in single confocal sections. Two clones per disc were measured, avoiding the area posterior to the morphogenetic furrow because of the developmental autophagy pattern in this region.
Western blotting
Western blotting was carried out according to standard procedures. In total, 20 eye discs or 15–20 ovaries per gel lane were collected on ice in PBS and EDTA-free protease inhibitor cocktail (Roche) and spun down briefly and gently. Supernatant was discarded and pellets were resuspended in 1× Laemmli sample buffer (1–1.5 μl per eye disc or ovary). Samples were separated on 4–20% mini-PROTEAN TGX gels (Biorad). Primary antibodies used were mCherry (Acris, goat, 1:500), β-actin (Sigma, mouse, 1:5,000) and GAPDH (Abcam, mouse, 1:1,000) followed by horseradish-peroxidase-conjugated secondary antibodies (Jackson Immunolabs). Densitometry measurements were carried out in Fiji.
Drug treatment
Drugs were added to standard fly food in the following final concentrations: chloroquine (C6628, Sigma) 2.5 mg ml−1, SAR405 15 μM (synthesized by ApexBio). Crosses were flipped directly onto the drug-containing medium. Adult female hosts were kept on a yeast-fortified drug-enriched diet before injection. Yeast was omitted after injection and vials were flipped daily.
Allograft assays
Transplantation assays were carried out as previously described24. In brief, young female hosts were kept on a yeast-fortified diet for 2 days before injection. Eight-day-old donor larvae were washed once in ethanol and four times in Millipore water, then tumours were dissected out in PBS. EAD tumour or control tissue were cut into small pieces with a scalpel, aspirated into a sharpened glass capillary and injected into the abdomens of hosts (Nanoject II, Drummond). Vials were flipped daily. Tumours were dissected out 8–10 days after injection and subjected to volume quantification by confocal microscopy.
Electron microscopy
For correlative light and electron microscopy experiments, EADs were dissected in PBS and fixed for 1 h on ice in 4% formaldehyde, 0.1% glutaraldehyde/0.1 M PHEM (240 mM PIPES, 100 mM HEPES, 8 mM MgCl2, 40 mM EGTA; pH 6.9). Chemically fixed eye imaginal discs were then embedded in 2% (w/v) low-melting-point (LMP) agarose as described previously for C. elegans embryos. A piece of aclar foil was topped with a second piece of aclar foil with a 1 cm × 1 cm hole in the middle. A small drop of pre-warmed LMP agarose was placed in the middle of this hole. Imaginal eye discs were transferred to the LMP agarose and the cavity was covered with a third piece of aclar foil and a glass slide and everything was put on ice. After agarose gelling the assembly was dismounted and a small piece of agar containing the EAD was punched out using a biopsy punch and transferred to a high pressure freezing carrier. Samples were high pressure frozen using a Leica HPM100, and freeze substitution and embedding were performed as follows: sample carriers designed for flat embedding were filled with 4 ml of freeze substituent (0.1% (w/v) uranyl acetate in acetone) and placed in a temperature-controlled AFS2 (Leica) equipped with an FPS robot (Leica). Freeze-substitution occurred at −90 °C for 48 h before the temperature was raised to −45 °C over a time span of 9 h. The samples were kept in the freeze substituent at −45 °C for 5 h before washing three times with acetone and infiltrated with increasing concentrations of Lowicryl HM20 (10%, 25%, 75%; 4 h each). During the last two steps, the temperature was gradually raised to −25 °C before infiltration three times with 100% Lowicryl (10 h each). Subsequent UV-polymerization occurred for 48 h at −25 °C, for 9 h during which the temperature was evenly raised to +20 °C. Polymerization then continued for another 24 h at 20 °C. Serial sections (~100 nm) were cut on an Ultracut UCT ultramicrotome (Leica) and collected on 200-mesh carbon-coated grids. Samples were immediately placed in a water droplet in a glass bottom Mattek dish and observed on a Delta Vision Deconvolution microscope (Applied Precision, GE Healthcare) using a 63× objective and 2× 2 binning. In order to restore the GFP signal for identification of MARCM clones, the grid was placed in a droplet of 0.01 M NaOH (pH 12) instead of water and observed on a Delta Vision Deconvolution microscope using a 40× objective and 2× 2 binning. After recording the fluorescent GFP signal, the grid was thoroughly washed in water before commencing with post-staining for electron microscopy. The position of the fluorescent signal relative to the asymmetric centre of the carbon coated grid was later used to find the same position in the electron microscope. After recording the fluorescent signal, the grid was carefully recovered from the water droplet, poststained for 10 min with 2% uranyl acetate in 70% methanol and for 5 min with lead citrate. Sections were observed at 80 kV in a JEOL-JEM 1230 electron microscope and images were recorded using iTEM software with a Morada camera (Olympus). The fluorescent background signal outlining the tissue was used to align the fluorescent image with the electron microscopy image. The overlay of the fluorescent image with the electron micrograph was done with Photoshop CS4.
Flow cytometry
For cell cycle profiling, 30–40 third instar EADs per genotype were dissected in PBS and dissociated in 500 μl 10× trypsin–EDTA solution (Sigma, T4174) by gentle agitation at room temperature for 2 h. Hoechst 33342 (Life Technologies, H3570) was added after 1 h at a final concentration of 5 μl ml−1. Trypsin was inactivated with fetal bovine serum (FBS) (2%), suspended cells were transferred into a 5-ml polystyrene tube with cell strainer cap (Falcon, 352235) and stained with propidium iodide for live–dead cell sorting. For mitotracker and mitoSOX measurements, 50–60 third instar EADs per genotype were dissected in PBS and dissociated in 1 ml of 10× trypsin–EDTA solution by gentle agitation at room temperature for 2 h. Trypsin was inactivated with FBS (2%). The cell suspension was centrifuged at 300g for 5 min at room temperature, and the pellet resuspended in Schneider’s medium (Gibco) supplemented with 10% FBS (Sigma, 7524). Samples were either incubated with 5 μM MitoSOX Red (mitochondrial superoxide indicator, Life Technologies, M36008) or 200 nM MitoTracker Deep Red FM (Life Technologies, M22426) at room temperature for 15 min followed by a wash. DNA content or fluorescence intensity was measured on a BD LSR II flow cytometer (Becton Dickinson) and the data were analysed using FlowJo software (Tree Star Inc.). 10,000 GFP-positive cells were analysed for cell cycle profiling, 50,000 cells for Mitotracker and MitoSOX.
Seahorse analysis
Approximately 50–100 third instar EADs per genotype were dissociated in 500 μl trypsin–EDTA (Sigma, T4174) for 2 h followed by inactivation by FBS (2%). The cell suspension was centrifuged at 300g for 5 min at room temperature, and the pellet resuspended in Schneider’s medium (Gibco) supplemented with 10% FBS (Sigma, 7524). Cells were passed through a cell strainer and run through FACS DiVa cell sorter (Becton Dickinson). 30,000, GFP+ (tumour) or GFP− (microenvironment) cells per well were sorted into Cell-Tak (Corning) coated 96-well Seahorse plates (Seahorse-bio). Sorting was carried out in Schneider’s Drosophila medium (Gibco) that was replaced with Seahorse medium supplemented with 2 mM sodium pyruvate, 11 mM glucose and 2 mM L-glutamine (pH 7.4). Respiration rates were measured using Seahorse XF Cell Mito Stress Test-kit (Seahorse Bio) using a Seahorse XFe96 analyser (Seahorse Bioscience).
Statistical analysis and reproducibility
Results are presented as mean ± s.e.m. in scatter plots or bar graphs, which were created in GraphPad Prism 5. Data were log-transformed before analysis if necessary to achieve approximately normal distribution. A P value < 0.05 was considered statistically significant for all datasets. Statistical significance was determined by using one-way ANOVA followed by Dunnett’s multiple comparisons test for multiple samples. A one-sample t-test was used for comparisons to point-normalized data; two-tailed, unpaired t-tests were used for pairwise comparisons, Chi-squared test for contingency data. P values are indicated in the figure legends when possible (Graph Pad Prism 5 does not provide exact P values for ANOVA with Dunnett’s correction). No statistical method was used to predetermine sample size. Animals were randomized for drug feeding experiments. Sex and age of animals are indicated in the respective experiments and Supplementary Information. Investigators were blinded for invasion scoring. Sample sizes (n) of animals and number of biological repeats of experiments are indicated in the corresponding figure legends. For cell cycle profiling (Extended Data Fig. 6a–e) and metabolic analysis by Seahorse (Extended Data Fig. 8f) only one representative experiment out of three is shown. Error bars in Extended Data Fig. 8f indicate mean ± s.e.m. of 2–4 technical replicates.
Data availability
Source data for Figs 1d, h, 2f, j, k, 4b–c and Extended Data Figs 1b, 2a–b, 3g, 5a, f, 6f, 7k–m, 8d–f, j, 9a, c–f have been provided (statistical source data). All other data supporting the findings of this study are available from the corresponding author on request.
Extended Data
Extended Data Figure 1. NAA is induced in the wing disc and ChAtg8a signal derives from autophagic structures.
a, Representative confocal images of wing imaginal discs of ChAtg8a-animals carrying RasV12 scrib−/− tumours are shown. n = 17 (RasV12ctrl) and n = 19 (RasV12scrib−/−) discs from three independent experiments. b, Quantification of relative ChAtg8a intensities inside and outside clones of indicated genotypes from single confocal sections. Values represent mean and s.e.m. of three independent pooled experiments. n = 24 discs (RasV12ctrl), n = 20 discs (RasV12scrib−/−) ***P < 0.0001 from unpaired two-tailed t-test. c, Transmission electron microscopy, confocal and overlay images correlating fluorescent puncta with organelles at the ultrastructural level (insets are shown enlarged). ChAtg8a-positive areas correlate with autophagosomes and autolysosomes (1–3) and apoptotic cells with autolysosomal profiles (4). Scale bars, 50 μm (a) and 10 μm (c).
Extended Data Figure 2. RasV12 scrib−/− tumours induce systemic autophagy in distal tissues and their invasive properties are reduced by pharmacological treatment.
a, Representative confocal images of muscles in transgenic ChAtg8a larvae used to grade the strength of autophagy induction in the presence of RasV12scrib−/− tumours in muscle, gut and adipose tissues at day 5 after egg-lay. Data are mean ± s.e.m. from three independent pooled experiments. RasV12ctrl, n = 11 animals (muscles and fat body) or n = 9 animals (gut); RasV12scrib−/−, n = 7 animals (muscles, gut, fatbody). Scale bars, 50 μm. b, Representative images of VNCs used to grade tumour invasion severity upon chloroquine treatment at day 10 after egg-lay White arrow indicates weakly visible GFP-positive invading tumour tissue. Quantification is based on three independent pooled experiments. n = 65(untreated) or n = 93 (chloroquine). ***P = 0.0004 (muscles), ***P < 0.0001 (gut and fatbody) from unpaired two tailed t-test (a). **P = 0.0021 from chi-squared test (b). (a).
Extended Data Figure 3. Generation and characterization of an atg14 allele.
a, Cartoon depicting the genomic location of the atg14 gene and the 1,191-bp lesion created by P-element-induced imprecise excision (red). The atg14Δ5.2 null allele lacks the ATG start site and approximately two-thirds of the coding region, leading to pupal lethality. The genomic BAC rescue construct, CH322-175F03 covers the atg14 locus and its genomic insertion, g-atg14, rescues atg14Δ5.2 lethality. b, c, EADs bearing GFP-labelled atg14−/− clones (b) or atg14−/− clones in animals carrying a genomic atg14 (g-atg14) rescue construct (c), immunostained with anti-Ref(2)P antibody. Ref(2)P accumulates in cells deficient for autophagy. Images are representative of more than 20 discs for each genotype. d, EAD and adult eye morphology from animals with GFP-labelled control. e, f, atg13−/− (e) or atg14−/− (f) clones. g, Graph depicting volumes of control, atg13−/− and atg14−/− GFP-positive clones in relation to the volume of the total disc. Values depict mean ± s.e.m. of two independent pooled experiments. ctrl, n = 11 discs; atg13−/−, n = 7 discs; atg14−/−, n = 11 discs. *P ≤ 0.05, **P ≤ 0.01 from one-way ANOVA with Dunnett’s correction. Scale bars, 50 μm (b–f).
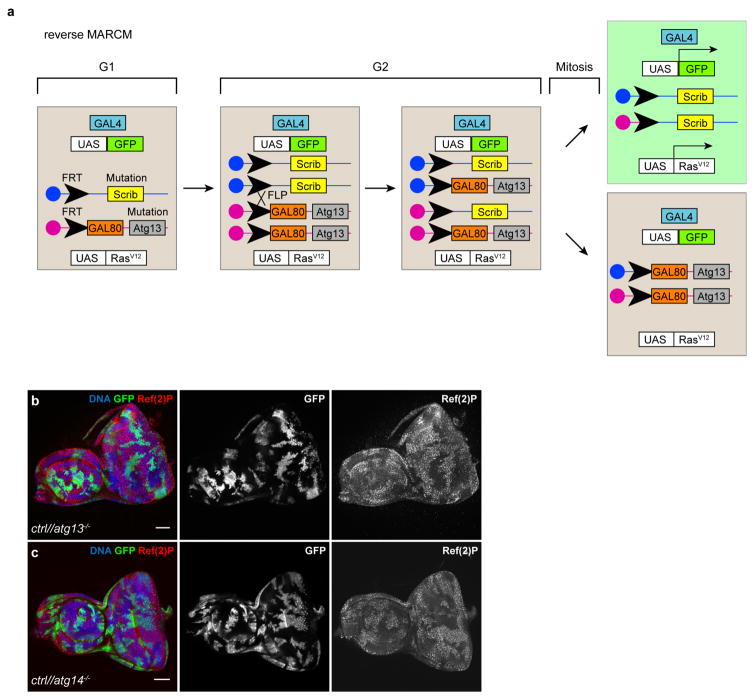
Extended Data Figure 4. Verification of reverse MARCM clonal technique for atg13 and atg14.
a, Cartoon depicting the genetic basis of the reverse MARCM clonal technique to induce labelled tumour cells confronted with autophagy-deficient neighbours. Experimental animals are heterozygous for atg13 and the tumour suppressor scrib on homologous sister chromatid arms. Mitotic (G2 phase) site-specific recombination at FLP recombination target sites (FRT) is induced between sister chromatids by transient tissue-specific expression of the dsDNA processing enzyme flipase. Severed chromosome arms can be stoichiometrically re-annealed with the sister chromatid, leading to simultaneous generation of cells carrying either two copies of scrib or atg13 loss-of-function alleles. Upon mitotic recombination, scrib−/− mutant cells simultaneously express GFP and oncogenic RasV12 under the control of an upstream activating sequence (UAS), driven by tissue-specific expression of the GAL4 yeast transcription factor. Non-recombined cells and atg13−/− cells do not express GFP or RasV12 as GAL4 activity is repressed by the presence of the yeast GAL4 repressor GAL80. b, c, Confocal images showing eye antennal discs with GFP-labelled control clones and reverse MARCM atg13−/− (b) or atg14−/− (c) clones detected by immunolabelling against the accumulating autophagy cargo protein Ref(2)P. Images are representative of more than 25 discs for each genotype. Scale bars, 50 μm (b, c).
Extended Data Figure 5. Local autophagy is required for tumour growth.
a, Invasion grading of indicated genotypes at day 8. n = 66 (RasV12scrib−/−//+), n = 55 (RasV12atg13−/−, scrib−/−//+), n = 92 (RasV12scrib−/−//atg13−/−), n = 114 (RasV12atg13−/−scrib−/−//atg13−/−), n = 59 (g-atg13RasV12scrib−/−//atg13−/−), n = 91 (g-atg13+RasV12atg13−/−scrib−/−//atg13−/−). b–e, Cartoon depicting cephalic complex with brain lobes (BL), EADs and VNC and epifluorescent images of tumour growth and invasion into VNC at day 8 (b, c) and day 10 (d, e). Lack of tumour growth and invasion of RasV12scrib−/− tumours in atg13−/− mutant animals is restored by one copy of a genomic atg13 rescue transgene at day 8, and more prominently at day 10. f, Quantification of tumour volumes at day 10. Values depict mean ± s.e.m. of two pooled experiments. n = 2 (RasV12atg13−/− scrib−/−//atg13−/−), n = 20 (g-atg13RasV12atg13−/−scrib−/−//atg13−/−). g, Confocal analysis of ey3.5-atg13-GFP expression pattern. Image is representative of eight discs from two independent experiments. h, Rescue of Ref(2)P accumulation in the eye-part of the EAD (blue arrow) of ey3.5-atg13+RasV12atg13−/−scrib−/−//atg13−/− animals, where the ey3.5-atg13 rescue construct is expressed, compared to the antennal part (yellow arrow). Image is representative of nine discs from two independent experiments. Scale bars, 50 μm (g, h). **P = 0.0086, ***P < 0.0001, ns, not significant by chi-squared test(a); *P = 0.019 by unpaired two-tailed t-test(f).
Extended Data Figure 6. Inhibition of autophagy reduces tumour proliferation, but does not increase cell death.
a–e, Overlayed flow cytometry histograms of dissociated EAD cells with cell-cycle phasing of tumour cell population (GFP+, green) and microenvironmental cell population (GFP-, brown). 10,000 GFP-positive cells per genotype were analysed. Histograms are representative of three independent experiments. Cells from discs with RasV12 tumours (a) and RasV12scrib−/− tumours (b) display increased cell cycle progression whereas RasV12atg13−/−scrib−/− tumours (c), RasV12scrib−/− tumour cells confronted with atg13−/− cells in the microenvironment (d) or in atg13 null animals (e) are 4ressed. f, Percentage of phosphorylated histone 3 positive mitotic cells within clones normalized to percentage of GFP-positive (tumour) tissue area quantified from single confocal image sections. Values depict mean ± s.e.m from three independent pooled experiments. n = 12 (RasV12ctrl//+, RasV12scrib−/−//+ and RasV12atg13−/−scrib−/−//atg13−/−); n = 15 (RasV12atg13−/−scrib−/−//+); or n = 10 discs (RasV12scrib−/−//atg13−/−)***P ≤ 0.001; ns, not significant from one-way ANOVA with Dunnett’s correction. g–k, Confocal images of tumorous discs with phosphorylated histone 3-labelled mitotic cells. RasV12 tumours (g), RasV12scrib−/− tumours (h) and RasV12atg13−/−scrib−/− tumours (i) display increased phosphorylated histone 3. RasV12scrib−/− tumour cells facing atg13−/− cells in the microenvironment (j) or in atg13 null animals (k), on the other hand, display fewer phosphorylated histone 3-positive foci. White arrow indicates phosphorylated histone 3-positive cells in the microenvironment population. Images are representative of more than 20 discs per genotype from three independent experiments. l–p, Confocal images of EAD of the indicated genotypes with EdU-labelled S-phase cells. White arrow indicates EdU-positive cells in the microenvironment population. Images are representative of six or more discs from two independent experiments. q–u, Cleaved caspase 3 staining (white arrows) is low in RasV12 tumours (q), prominent within the tumour cell population in discs carrying RasV12scrib−/− tumours (r), RasV12atg13−/−scrib−/− tumours(s), RasV12scrib−/− tumour cells confronted with atg13−/− cells (t) and RasV12scrib−/− tumours in atg13-deficient animals (u). (g–u).
Extended Data Figure 7. NAA responses.
a, Systemic autophagy grading upon tumour intrinsic inhibition of JNK signalling in the EAD. Values depict mean ± s.e.m. of three independent pooled experiments. n = 7 (RasV12scrib−/−) or 11 (>bskDNRasV12scrib−/−) animals. b–k, Representative confocal images, quantified in Extended Data Fig. 8k–m. NAA is downstream of Fos and Ets21c transcription factor activity (b). Expression of bskDN suppresses NAA (c). Clonal overexpression of yki is sufficient to trigger autophagy in neighbouring cells (d). Knockdown of yki suppresses NAA (e). Reduction of tumour growth by disrupted PI3K-I signalling does not affect NAA induction (f). ImpL2 is neither sufficient nor necessary for NAA (g, h). Upd3 cooperates with RasV12 for NAA induction (i).. Removal of JAK/STAT signalling in neighbouring tissue does not suppress NAA (j). Quantification of relative 3 × ChAtg8a-intensities of indicated genotypes (k). Data are mean ± s.e.m. from three independent pooled experiments. n = 38 (RasV12scrib−/−), n = 24 (RasV12egr−/−scrib−/−), 18 (RasV12scrib−/−, >bskDN), n = 17 (RasV12scrib−/−kay−/−), 29 (RasV12ets21cRNAiscrib−/−fosRNAi),n = 34 (RasV12domeDNscrib−/−),n = 5 (RasV12upd+ctrl) or n = 9 (ykiactctrl) discs. l, Relative 3× ChAt8ag intensities of indicated genotypes. Data are mean ± s.e.m. from three independent pooled experiments, n = 15 (RasV12dlgRNAi),n = 11 (RasV12 dlgRNAisdRNAi),n = 2 (RasV12dlgRNAibskDN), n = 10 (RasV12dlgRNAiykiRNAi), n = 7 (RasV12dlgRNAi ImpL2RNAi) or n = 5 (RasV12 dlgRNAi dp110DN) discs. m, Quantification of relative ChAtg8a intensities of indicated genotypes. Data are mean ± s.e.m. of three independent pooled experiments. n = 24 (RasV12ctrl),n = 20 (RasV12scrib−/−), n = 9 (ImpL2+RasV12ctrl), n = 12 (upd3RasV12ctrl) or 15 (RasV12scrib−/−//stat) discs. Scale bars, 50 μm (b–j). *P = 0.0127; ns, not significant by unpaired two-tailed t-test (a). *P ≤ 0.05, **P ≤ 0.01, ***P < 0.0001 by one-way ANOVA with Dunnett’s correction (k–m).
Extended Data Figure 8. Transformed cells display increased mitochondrial mass, ROS, glucose uptake and reduced reserve respiratory capacity.
a, Stitched electron microscopy overview image of sectioned RasV12 scrib−/− disc. Blue dots label nuclei of tumour cells, yellow dots those of neighbour cells. Light blue lines demarcate clone boundaries. Model to the upper right visualizing clone boundaries was reconstructed based on consecutive electron microscopy sections. Inset (black outline) is shown in a′, containing two more insets from either side of the clone boundary (blue and yellow, a″ and a‴, respectively). Red asterisks indicate damaged mitochondria, green asterisks healthy mitochondria. White arrows indicate breached mitochondrial membrane. b, Table summarizing quantification of mitochondrial mass and health in two independent areas on electron microscopy sections within and outside RasV12scrib−/− clone boundaries. c, Confocal images of EADs carrying RasV12scrib−/− tumours labelled with ATP5a, showing increased mitochondrial mass. Images are representative of 6 (RasV12ctrl) or 11 (RasV12scrib−/−) discs from three independent experiments. Scale bars, 50 μm. d, Representative MitoTracker intensity profile and quantification of GFP-positive and GFP-negative cells from dissociated RasV12scrib−/−//+ EADs. Data are mean ± s.e.m. from three independent experiments. e, Representative MitoSOX fluorescence intensity profile and quantification of GFP-positive and GFP-negative cells from dissociated RasV12scrib−/−//+ EAD. Data are mean ± s.e.m. from three independent experiments. f, Seahorse-derived measurements of ratios between maximal and basal respiration capacity in tumour cells (RasV12scrib−/−) and the microenvironment compared to wild-type cells. Data are mean ± s.e.m. from three (wild type), four (RasV12scrib−/−) and two (microenvironment) independent wells and are representative of three independent experiments. g, h, Knockdown of ND75 in the dorsal domain of the wing imaginal disc triggers NAA. Images are representative of n = 9 discs (ctrl and ND75RNAi) from three independent experiments. i, DHE staining of eye-antennal disc with Ykiact expressing cells that show tumorous growth and outcompete neighbouring wild type cells. n = 6 discs from two independent experiments. j, Ykiact −induced cell competition and growth does not change when cells are confronted with atg13−/−-deficient microenvironment. Graph shows GFP-positive tissue volumes normalized to disc volumes. Data are mean ± s.e.m. from three independent pooled experiments, n = 17 (ykiactctrl//+) or n = 12 (ykiactctrl//atg13−/−) discs. k, l, RasV12scrib−/− tumours display enhanced uptake of glucose. Images are representative of n = 17 (RasV12ctrl) or 6 (RasV12scrib−/−) discs from three independent experiments. Scale bars, 50 μm (c, g–h, i, k–l). ***P = 0.0017 (d) and *P = 0.039 from one-sample t-test(e). *P < 0.05, from one-way ANOVA with Dunnett’s correction (f). (j) ns, not significant (P = 0.137) from two-tailed unpaired t-test.
Extended Data Figure 9. Host autophagy requirement for tumour growth.
a, Quantification of tumour volumes upon slif knockdown. Data are mean ± s.e.m. from three independent pooled experiments. n = 15 (RasV12dlgRNAi) or 13 (RasV12dlgRNAi >slifanti) animals. b, Tumour growth of RasV12scrib−/− allografted tissue at 2 and 10 days post injection (DPI). c, Western blot analysis of autophagic flux in ovaries of host flies carrying RasV12scrib−/− transplants for 5 days. Data are mean ± s.e.m. of three independent experiments. d, SAR405 reduces allograft tumour volumes in host flies after 8 days. Data are mean ± s.e.m. of three independent pooled experiments. n = 36 (DMSO) or n = 50 (SAR405) animals. e, Day 10 RasV12 scrib−/− tumour allograft volumes from atg14Δ5.2/atg14EY14568 hosts with or without a genomic atg14 rescue transgene. Data are mean ± s.e.m. of three independent pooled experiments. n = 32 (g-atg14; atg14Δ5.2/atg14 EY14568 hosts) or n = 46 (atg14Δ5.2/atg14 EY14568 hosts) animals. f, Non-growing RasV12atg13−/−scrib−/−//atg13−/− tumours regrow more effectively when allografted into control hosts than into atg8-mutant hosts. Data are mean ± s.e.m. of three independent pooled experiments. n = 41 (ctrl hosts) or n = 23 (Δatg8a hosts) animals. ***P < 0.0001 from unpaired two-tailed t-test (a); ***P = 0.0073 from one-sample t-test (c); **P = 0.0036 (d); ***P < 0.0001 (e); and (f) ***P < 0.0005 from unpaired two-tailed t-test. ns, not significant.
Supplementary Material
Acknowledgments
We thank M. Smestad, E. Rønning, I. D. Rein, M. Bostad and T. Stokke at the flow cytometry core facility at the Radium Hospital for technical support; K. Liestøl for advice on statistics; T. Vaccari, H. Jasper, C. Gonzales, S. B. Thoresen, and the H. Stenmark laboratory for discussions; E. Baehrecke, T. Xu, T. Igaki, K. Basler, G. Halder, D. Bohmann, M. Vidal, M. Zeidler, T. P. Neufeld, I. Salecker, M. Uhlirova and T. Vaccari, Bloomington Stock Centre, the TRiP at Harvard Medical School (NIH/NIGMS R01-GM084947), VDRC, Pacman library project, and the Developmental Studies Hybridoma Bank for fly stocks and reagents; and H. Richardson and J. Manent for communication before publication. This work was supported in part by the Research Council of Norway through its Centres of Excellence funding scheme (179571) to H.S., by grants from the Norwegian Cancer Society (PK01-2009-0386) to T.E.R., (145517) to F.O.F., (71043-PR-2006-0320) and to T.J. A career stipend from The Southern and Eastern Regional Health Authority (2015016) is held by T.E.R., FRIBIO and FRIBIOMED programs of the Norwegian Research Council (196898, 214448) are held by T.J. and A.J. NIH RO1 GM090150 is held by D.B. EU FP7-People-2013-COFUND (n° 609020—Scientia Fellows), M.M.R. Momentum (LP2014-2) to G.J., Simon Fougner Hartmanns Foundation, for Seahorse instrument acquisition to T.A.
Footnotes
Supplementary Information is available in the online version of the paper.
Author Contributions N.S.K., H.S., D.B., T.J. and T.E.R. designed the research; N.S.K., R.K., F.O.F, A.J., S.W.S., M.M.R., K.O.S., T.A.T. and T.E.R., performed experiments and analysed the data; G.J. developed transgenic autophagy reporter animals; and N.S.K., H.S., D.B., and T.E.R. wrote the manuscript.
The authors declare no competing financial interests.
Readers are welcome to comment on the online version of the paper.
Reviewer Information Nature thanks T. Igaki, H. Zhang and the other anonymous reviewer(s) for their contribution to the peer review of this work.
References
- 1.Hanahan D, Coussens LM. Accessories to the crime: functions of cells recruited to the tumor microenvironment. Cancer Cell. 2012;21:309–322. doi: 10.1016/j.ccr.2012.02.022. [DOI] [PubMed] [Google Scholar]
- 2.Galluzzi L, et al. Autophagy in malignant transformation and cancer progression. EMBO J. 2015;34:856–880. doi: 10.15252/embj.201490784. [DOI] [PMC free article] [PubMed] [Google Scholar]
- 3.Pagliarini RA, Xu T. A genetic screen in Drosophila for metastatic behavior. Science. 2003;302:1227–1231. doi: 10.1126/science.1088474. [DOI] [PubMed] [Google Scholar]
- 4.Brumby AM, Richardson HE. scribble mutants cooperate with oncogenic Ras or Notch to cause neoplastic overgrowth in Drosophila. EMBO J. 2003;22:5769–5779. doi: 10.1093/emboj/cdg548. [DOI] [PMC free article] [PubMed] [Google Scholar]
- 5.Lee T, Luo L. Mosaic analysis with a repressible cell marker (MARCM) for Drosophila neural development. Trends Neurosci. 2001;24:251–254. doi: 10.1016/s0166-2236(00)01791-4. [DOI] [PubMed] [Google Scholar]
- 6.Denton D, et al. Relationship between growth arrest and autophagy in midgut programmed cell death in Drosophila. Cell Death Differ. 2012;19:1299–1307. doi: 10.1038/cdd.2012.43. [DOI] [PMC free article] [PubMed] [Google Scholar]
- 7.Uhlirova M, Bohmann D. JNK- and Fos-regulated Mmp1 expression cooperates with Ras to induce invasive tumors in Drosophila. EMBO J. 2006;25:5294–5304. doi: 10.1038/sj.emboj.7601401. [DOI] [PMC free article] [PubMed] [Google Scholar]
- 8.Kwon Y, et al. Systemic organ wasting induced by localized expression of the secreted insulin/IGF antagonist ImpL2. Dev Cell. 2015;33:36–46. doi: 10.1016/j.devcel.2015.02.012. [DOI] [PMC free article] [PubMed] [Google Scholar]
- 9.Figueroa-Clarevega A, Bilder D. Malignant Drosophila tumors interrupt insulin signaling to induce cachexia-like wasting. Dev Cell. 2015;33:47–55. doi: 10.1016/j.devcel.2015.03.001. [DOI] [PMC free article] [PubMed] [Google Scholar]
- 10.Zirin J, Nieuwenhuis J, Perrimon N. Role of autophagy in glycogen breakdown and its relevance to chloroquine myopathy. PLoS Biol. 2013;11:e1001708. doi: 10.1371/journal.pbio.1001708. [DOI] [PMC free article] [PubMed] [Google Scholar]
- 11.Pérez E, Das G, Bergmann A, Baehrecke EH. Autophagy regulates tissue overgrowth in a context-dependent manner. Oncogene. 2015;34:3369–3376. doi: 10.1038/onc.2014.285. [DOI] [PMC free article] [PubMed] [Google Scholar]
- 12.Karsli-Uzunbas G, et al. Autophagy is required for glucose homeostasis and lung tumor maintenance. Cancer Discov. 2014;4:914–927. doi: 10.1158/2159-8290.CD-14-0363. [DOI] [PMC free article] [PubMed] [Google Scholar]
- 13.Bazigou E, et al. Anterograde Jelly belly and Alk receptor tyrosine kinase signaling mediates retinal axon targeting in Drosophila. Cell. 2007;128:961–975. doi: 10.1016/j.cell.2007.02.024. [DOI] [PubMed] [Google Scholar]
- 14.Andersen DS, et al. The Drosophila TNF receptor Grindelwald couples loss of cell polarity and neoplastic growth. Nature. 2015;522:482–486. doi: 10.1038/nature14298. [DOI] [PubMed] [Google Scholar]
- 15.Willecke M, Toggweiler J, Basler K. Loss of PI3K blocks cell-cycle progression in a Drosophila tumor model. Oncogene. 2011;30:4067–4074. doi: 10.1038/onc.2011.125. [DOI] [PubMed] [Google Scholar]
- 16.Igaki T, Pagliarini RA, Xu T. Loss of cell polarity drives tumor growth and invasion through JNK activation in Drosophila. Curr Biol. 2006;16:1139–1146. doi: 10.1016/j.cub.2006.04.042. [DOI] [PubMed] [Google Scholar]
- 17.Cordero JB, et al. Oncogenic Ras diverts a host TNF tumor suppressor activity into tumor promoter. Dev Cell. 2010;18:999–1011. doi: 10.1016/j.devcel.2010.05.014. [DOI] [PMC free article] [PubMed] [Google Scholar]
- 18.Külshammer E, et al. Interplay among Drosophila transcription factors Ets21c, Fos and Ftz-F1 drives JNK-mediated tumor malignancy. Dis Model Mech. 2015;8:1279–1293. doi: 10.1242/dmm.020719. [DOI] [PMC free article] [PubMed] [Google Scholar]
- 19.Wu M, Pastor-Pareja JC, Xu T. Interaction between Ras(V12) and scribbled clones induces tumour growth and invasion. Nature. 2010;463:545–548. doi: 10.1038/nature08702. [DOI] [PMC free article] [PubMed] [Google Scholar]
- 20.Bosch JA, Tran NH, Hariharan IK. CoinFLP: a system for efficient mosaic screening and for visualizing clonal boundaries in Drosophila. Development. 2015;142:597–606. doi: 10.1242/dev.114603. [DOI] [PMC free article] [PubMed] [Google Scholar]
- 21.Owusu-Ansah E, Banerjee U. Reactive oxygen species prime Drosophila haematopoietic progenitors for differentiation. Nature. 2009;461:537–541. doi: 10.1038/nature08313. [DOI] [PMC free article] [PubMed] [Google Scholar]
- 22.Sousa CM, et al. Pancreatic stellate cells support tumour metabolism through autophagic alanine secretion. Nature. 2016;536:479–483. doi: 10.1038/nature19084. [DOI] [PMC free article] [PubMed] [Google Scholar]
- 23.Nowak K, Seisenbacher G, Hafen E, Stocker H. Nutrient restriction enhances the proliferative potential of cells lacking the tumor suppressor PTEN in mitotic tissues. eLife. 2013;2:e00380. doi: 10.7554/eLife.00380. [DOI] [PMC free article] [PubMed] [Google Scholar]
- 24.Rossi F, Gonzalez C. Studying tumor growth in Drosophila using the tissue allograft method. Nat Protocols. 2015;10:1525–1534. doi: 10.1038/nprot.2015.096. [DOI] [PubMed] [Google Scholar]
- 25.White E. The role for autophagy in cancer. J Clin Invest. 2015;125:42–46. doi: 10.1172/JCI73941. [DOI] [PMC free article] [PubMed] [Google Scholar]
- 26.Zeitler J, Hsu CP, Dionne H, Bilder D. Domains controlling cell polarity and proliferation in the Drosophila tumor suppressor Scribble. J Cell Biol. 2004;167:1137–1146. doi: 10.1083/jcb.200407158. [DOI] [PMC free article] [PubMed] [Google Scholar]
- 27.Igaki T, Pastor-Pareja JC, Aonuma H, Miura M, Xu T. Intrinsic tumor suppression and epithelial maintenance by endocytic activation of Eiger/TNF signaling in Drosophila. Dev Cell. 2009;16:458–465. doi: 10.1016/j.devcel.2009.01.002. [DOI] [PMC free article] [PubMed] [Google Scholar]
- 28.Ohsawa S, et al. Elimination of oncogenic neighbors by JNK-mediated engulfment in Drosophila. Dev Cell. 2011;20:315–328. doi: 10.1016/j.devcel.2011.02.007. [DOI] [PubMed] [Google Scholar]
- 29.Chang YY, Neufeld TP. An Atg1/Atg13 complex with multiple roles in TOR-mediated autophagy regulation. Mol Biol Cell. 2009;20:2004–2014. doi: 10.1091/mbc.E08-12-1250. [DOI] [PMC free article] [PubMed] [Google Scholar]
- 30.Honegger B, et al. Imp-L2, a putative homolog of vertebrate IGF-binding protein 7, counteracts insulin signaling in Drosophila and is essential for starvation resistance. J Biol. 2008;7:10. doi: 10.1186/jbiol72. [DOI] [PMC free article] [PubMed] [Google Scholar]
Associated Data
This section collects any data citations, data availability statements, or supplementary materials included in this article.
Supplementary Materials
Data Availability Statement
Source data for Figs 1d, h, 2f, j, k, 4b–c and Extended Data Figs 1b, 2a–b, 3g, 5a, f, 6f, 7k–m, 8d–f, j, 9a, c–f have been provided (statistical source data). All other data supporting the findings of this study are available from the corresponding author on request.


