

Abstract
Ion mobility-mass spectrometry (IM-MS) can provide orthogonal information, i.e., m/z and collision cross section (CCS), for the identification of drugs and drug metabolites. However, only a small number of CCS values are available for drugs, which limits the use of CCS as an identification parameter and the assessment of structure–function relationships of drugs using IM-MS. Here, we report the development of a rapid workflow for the measurement of CCS values of a large number of drug or drug-like molecules in nitrogen on the widely available traveling wave IM-MS (TWIM-MS) platform. Using a combination of small molecule and polypeptide CCS calibrants, we successfully determined the nitrogen CCS values of 1425 drug or drug-like molecules in the MicroSource Discovery Systems’ Spectrum Collection using flow injection analysis of 384-well plates. Software was developed to streamline data extraction, processing, and calibration. We found that the overall drug collection covers a wide CCS range for the same mass, suggesting a large structural diversity of these drugs. However, individual drug classes appear to occupy a narrow and unique space in the CCS–mass 2D spectrum, suggesting a tight structure–function relationship for each class of drugs with a specific target. We observed bimodal distributions for several antibiotic species due to multiple protomers, including the known fluoroquinolone protomers and the new finding of cephalosporin protomers. Lastly, we demonstrated the utility of the high-throughput method and drug CCS database by quickly and confidently confirming the active component in a pharmaceutical product.
Analytical techniques are critical for the pharmaceutical industry, both for the characterization of a drug and its formulation and for the elucidation of drug metabolism and disposition mechanisms. Currently, liquid chromatography (LC) coupled with UV/vis or mass spectrometry (MS) is the predominant technique used by the European and United States Pharmacopeia to characterize drug products.1,2 However, these techniques provide limited structural information on the drugs and have difficulty in resolving isobaric structural isomers if they cannot be resolved in the LC dimension. Nuclear magnetic resonance can provide detailed structural information, but it is particularly low throughput and requires large amounts of material. Orthogonal and high-throughput analysis is needed for rapid and confident identification of drug molecules from pharmaceutical formulations, biological matrixes, or counterfeits and for the study of drug metabolism and disposition.
Ion mobility spectrometry (IMS) is a rapid gas-phase separation technology based on the mobility of analyte ions in a neutral buffer gas3−7 and is orthogonal to conventional chromatographic separations that are mostly based on the differences in analyte polarity. The mobility of the ions is determined by the rotationally averaged projected area of the ion-neutral pair, or its collision-cross section (CCS) with the neutral gas, which in turn determines the drift time (td) of the ions through the gas-buffered region. When ion mobility (IM) is coupled with MS (IM-MS), a two-dimensional (2D) separation is achieved on the basis of the structure (as indicated by CCS) and mass-to-charge ratio (m/z). The CCS of an ion depends on its gas-phase packing efficiency. It has been found that different classes of biological molecules tend to occupy a narrow space in the CCS–mass 2D spectrum.7,8 Specifically, for the same mass, CCS values (or td) tend to increase in the order of oligonucleotides, carbohydrates, peptides, and lipids, which suggests that their gas-phase packing efficiencies decrease in the same order.7,8 Moreover, even subclasses of each group of molecules, such as those of lipids, can be differentiated based on their location in the 2D spectrum.8−12 Thus, IM-MS could be used to approximately classify an unknown ion based on its location in the CCS–mass 2D spectrum.
IMS has been commonly used to detect small organic molecules such as explosives and drugs in forensic and security applications, e.g., in airport security and international efforts against counterfeit drugs.13−15 In recent years, IM-MS has shown advantages in structurally characterizing drugs and their metabolites.16−21 For example, IM-MS was able to differentiate the diastereomers betamethasone and dexamethasone even though their CCS values differ by only 1 Å2.17 More recently, sites of glucuronidation of drugs were differentiated using IM-MS in combination with molecular modeling and theoretical CCS calculations.19,21 However, previous studies on drugs are all on a small scale, from a few to a few tens of compounds, which prevents the assembly of a useful CCS database for their identification and the assessment of the structure–function relationships using IM-MS.
CCS values can be directly measured using drift tube-ion mobility (DTIM) instruments following the Mason–Schamp equation.22 To obtain accurate CCS values, a series of measurements are normally needed while ramping the drift voltage from low to high,8,23 although a single field-strength measurement can be achieved with an estimated time outside the mobility cell (t0) through calibration. On the other hand, CCS measurements on traveling wave-ion mobility (TWIM) instruments require calibration of the relationship between CCS and td using a series of calibrants with known CCS values.23−26 Although this strategy is an indirect way of obtaining CCS, it has the advantage of higher throughput because only one measurement is needed for each technical replicate. On the basis of previous studies by others and us, calibrants with similar physical properties to the analytes would result in the highest accuracy in CCS values in TWIM analysis.24,26,27
In order to cover the mass range of commonly used drugs (from m/z 100 to 1500), we chose a series of drugs, drug-like molecules, and poly-dl-alanines (PolyAla) as calibrants for the measurement of drug CCSs. The CCS values of these calibrants were measured on a DTIM instrument with nitrogen as the drift gas. Using these calibrants, we sought to measure the nitrogen CCS values of 2000 compounds in the MicroSource Discovery Systems’ Spectrum Collection that contains 50% known drugs, 30% natural products, and 20% other bioactive components. We successfully determined the CCS values of 1425 of these compounds using flow injection analysis of 384-well plates. Software was developed to streamline data extraction, processing, and calibration. We found that the overall drug collection covers a wide CCS range for the same masses, suggesting a large structural diversity of the drugs. However, individual drug classes appear to occupy a narrow and unique space in the CCS–mass 2D spectrum, suggesting a tight structure–function relationship for each class of drugs.
Experimental Section
Materials
PolyAla, acetaminophen, and betaine hydrochloride were purchased from Sigma-Aldrich. The following compounds with purities ≥98% were ordered from Cayman Chemical: alprenolol hydrochloride, clozapine N-oxide, erythromycin, ondansetron hydrochloride, reserpine, vancomycin hydrochloride, and verapamil hydrochloride. A peptide with the sequence Ac-ETDYYRKG-NH2 (peptide K-8; catalog no. BP12-202) was purchased from New England Peptide, Inc. PolyAla was prepared at 100 μg/mL in 95% acetonitrile/5% water (Optima LC-MS, Fisher Scientific) with 0.1% formic acid (Sigma-Aldrich). A mixture of drug and drug-like compounds containing alprenolol (2 μM), clozapine N-oxide (2 μM), ondansetron (2 μM), reserpine (2 μM), verapamil (2 μM), Peptide K-8 (5 μM), betaine (10 μM), acetaminophen (10 μM), erythromycin (10 μM), and vancomycin (10 μM) was prepared in 1:1 acetonitrile/water with 0.1% formic acid. The MicroSource Discovery Systems, Inc. (MDSI) Spectrum Collection was purchased from the Quellos High Throughput Screening Core at the University of Washington. The collection of 2000 compounds (purity ≥95%) was plated into 384-well plates at 10 μM in acetonitrile and sealed with manually slit silicone mats (Axygen). A 300 mg capsule of clindamycin was purchased from Watson Pharmaceuticals (now Teva Pharmaceuticals). The contents of the capsule (approximately 600 mg total) was used to prepare a 1 mg/mL solution in 1:1 acetonitrile/water with 0.1% formic acid, which was diluted further to 1 ng/mL.
DTIM CCS Measurements
Erythromycin, peptide K-8 Ac-ETDYYRKG-NH2, and vancomycin were dissolved to 5 μM in 1:1 acetonitrile/water with 0.1% formic acid. Nitrogen DTIM CCS measurements of the drug standards and PolyAla (n = 2–21) were performed in positive mode using a modified Waters Synapt G2 HDMS (Wilmslow, United Kingdom) containing a radio frequency (RF) confining drift cell in place of the previous traveling wave cell.28 Measurements were performed using methods reported previously with nitrogen drift gas.28 Mobilities of ions measured using the RF-confining drift cell are indistinguishable from those using an electrostatic drift tube.24,28,29 The arrival-time distribution (ATD) for each ion was extracted and analyzed using software developed in the lab.23 The drift times were determined from the Gaussian function that has the smallest residual sum of squares with the experimental ATD. CCS values were determined from the slopes of plots of drift time versus reciprocal drift voltage.
TWIM CCS Measurements
IM-MS analysis was performed on a Waters Synapt G2-Si HDMS (Waters Corp., Milford, MA) equipped with an electrospray ionization (ESI) source using nitrogen as the drift gas. ESI conditions were as follows: capillary, +2.5 kV; sampling cone, 30 V; extraction cone, 5 V; source temperature, 120 °C; desolvation temperature, 250 °C; cone gas, 10 L/h; and desolvation gas, 800 L/h. Mass calibration was performed with sodium formate for the range m/z 50–1600. IM separations were performed with a traveling wave velocity of 600 m/s and height of 40 V. Flow-injection analysis (FIA) was performed with a Waters Acquity FTN UPLC connected to the ESI source of the IM-MS. Sample injections (10 μL) were made into a 0.4 mL/min flow of 50% water with 0.1% formic acid/50% acetonitrile with 0.1% formic acid. Data was acquired for 0.2 min with a 0.5 min scan time over m/z 50–2500, which resulted in approximately 16 scans across the analyte peak. Lock mass signal was not acquired as it was found to be incompatible with the high-throughput workflow and the time scale of the high-throughput analysis. Individual data files were acquired for each well of the 384-well plates, and all wells were analyzed in triplicates over the course of 2 months. PolyAla and the mixture of drug-like compounds were added into empty wells of each plate and were analyzed at the start, middle, and end of the analysis of each plate.
TWIM CCS Calibration
The nitrogen DT CCS values for PolyAla and the drug-like mix were used for calibration of TWIM drift times into CCS values as described previously (see Table S1 for CCS values).25,26,30 ATDs for PolyAla and drug-like CCS calibrants were manually extracted from the raw data using the exact mass of the protonated species and a mass window of 0.075 Da to account for mass drift over the long analysis times (approximately 6 h per plate). Gaussian fitting of ATDs was performed in GraphPad Prism 5, and the mean from the best-fit values was recorded as the drift time of the calibrant ion. Corrected PolyAla (n = 20) and drug-like mix (n = 9 compounds) drift times (t′d) and corrected DT CCS values (CCS′) were used to generate a calibration curve of the form CCS′ = A(t′d+t0)B, where A, t0, and B are fit parameters.25,26,30 Calibration errors of ±3% CCS and interday relative standard deviations ≤0.5% were considered acceptable.
Data Analysis
Waters .RAW data files were converted to text files using the CDCReader.exe included in UniDec.31 IM data was extracted into a separate text file and binned at 0.05 m/z. A novel Python program was developed to automate extraction of ATDs in a targeted manner from the IM text files, perform Gaussian fitting of the ATD, and generate and apply the CCS calibration curve (see Supporting Information). Briefly, the program read from an input file containing information on the m/z and CCS values of the calibrants along with directory paths to the data files, the calibration data file, and the report file. For each m/z data file combination specified in the input file, the program extracted its ATD with a mass window of 0.075 Da, performed a least-squares fit of a Gaussian function to the ATD, and then used the peak of the Gaussian-fit and instrumental parameters to calculate the drift time for the analyte. Extracted drift times and literature CCS values for the calibrants (PolyAla) were used to generate a CCS calibration function by performing a least-squares fit of the calibration curve to the corrected drift time vs literature CCS data.26 The resulting function was applied to the drift times of the other analytes to calculate their calibrated CCS. All analyte drift times, CCS calibration parameters, and calibrated CCS values were recorded in a single text file. Additionally, during execution the program generates separate image files (PNG) for each Gaussian fit ATD, as well as a plot of the CCS calibration with residuals from the fit to the calibration function for visual inspection. For the first replicate, masses corresponding to the protonated, sodiated, and water-loss ions were extracted for each data file. The image files were visually inspected to determine the presence of each adduct in the data, and the adduct with the largest intensity was used for ATD extraction in the subsequent replicates. For all replicates, the image files were inspected for ATD peak shape and intensity. ATDs with intensities ≤1 × 10³ and baseline peak widths ≥25 bins were rejected. ATDs with more than one peak were flagged and manually inspected to check that the same mass was observed in each peak of multimodal ATDs. If the masses were different, the extraction mass window was adjusted as needed to exclude the contaminate peak. At a later time, data was manually recalibrated with a CCS calibration curve based on both the PolyAla and drug mix CCS standards to improve the calibration results in the low m/z range.
Molecular Modeling and Computational CCS Calculation
Compound structure files were initially generated in Avogadro32 and then parametrized using the Prodrg server33 for use in the GROMACS34 molecular dynamics (MD) suite. Enhanced sampling MD simulations by GROMACS were carried out to generate unique starting structures. Briefly, a 1 ns high temperature (600 K) simulation was performed from which 100 structures were sampled at uniform intervals. The sampled structures were energy minimized with a steepest-descent algorithm and then used as the starting structures for individual low temperature (300 K) MD simulations. The trajectories from all low temperature simulations were concatenated, producing a single trajectory with 10 000 individual poses. The concatenated trajectory was analyzed with a clustering algorithm, and highly populated (>25%) clusters were used as seed structures for further analyses. Potential protomers of compounds were generated from the clustered structures and optimized with the MMFF94 force-field in Avogadro using a steepest-descent energy minimization algorithm. The protomers were then geometry optimized in Gaussian-0935 using B3LYP DFT with the 3-21G basis set. Further energy-minimized structures were then generated using the 6-31G+(d) basis set, and Mulliken partial atomic charges were used. Thermochemistry parameters, vibrational frequencies, and single point energies for the final optimized structures were calculated using the 6-31G+(d) basis set. Stability of the optimized structures was checked by inspecting the output files of the frequency calculations to ensure no imaginary vibrational modes were predicted. Theoretical CCS values in nitrogen were obtained from the final optimized structures using a trajectory method modified for use with N2 as the IM buffer gas.17
Results and Discussion
CCS Calibration Performance
Calibration of drift times using standards of known CCS is a rapid method for obtaining CCS values from both TWIM and DTIM platforms. A series of singly charged polyalanines (n = 2–21), PolyAla, were initially used for CCS calibration of 1425 out of the 2000 compounds in the MicroSource Discovery Systems, Inc. (MDSI) Spectrum Collection (Figure 1). The PolyAla (Figure 2A) ions have masses ranging from 161 to 1510 and CCSs of 136 to 379 Å2. Performance of the PolyAla CCS calibration was benchmarked against the mixture of drug-like compounds, which had masses ranging from 118 to 1448 and CCSs of 121 to 387 Å2. It was found that calibration with PolyAla alone lead to higher CCS errors (Table S1) for the drug-like compounds from m/z 100–600, whereas the combination of PolyAla and drug-like compounds for CCS calibration improved the CCS errors (Figure 2B) for the smaller drug-like compounds with the exception of alprenolol and erythromycin, but both numbers are within 1.5% of the DT CCS values. This improvement in CCS errors is attributed to the addition of a data point below m/z 160 and an increase in the density of data points from m/z 100 to 600 in the calibration curve. Calibration errors were less than 1.5% for the majority (≥95%) of the CCS calibrants. The greatest error was observed for reserpine, which averaged −2.8% error over the course of the analysis. Although the CCS error was large, the reproducibility of the reserpine CCS was high with a RSD of 0.5% and it was not excluded from the CCS calibration. Measurements of acetaminophen CCS (not shown in Figure 1A, m/z 152 and 130.4 Å2), however, had poor reproducibility (1.1% RSD) and errors that exceeded 1.5% at times, which led to its exclusion from the CCS calibrants. The optimized set of standards yielded CCS calibration curves with stable values for the A and B fit parameters over the course of the analysis (n = 21), with average values of 444.17 ± 3.84 and 0.513 ± 0.003, respectively. The t0 fit parameter had the greatest variability over the analysis, with an average value of −0.065 ± 0.034.
Figure 1.
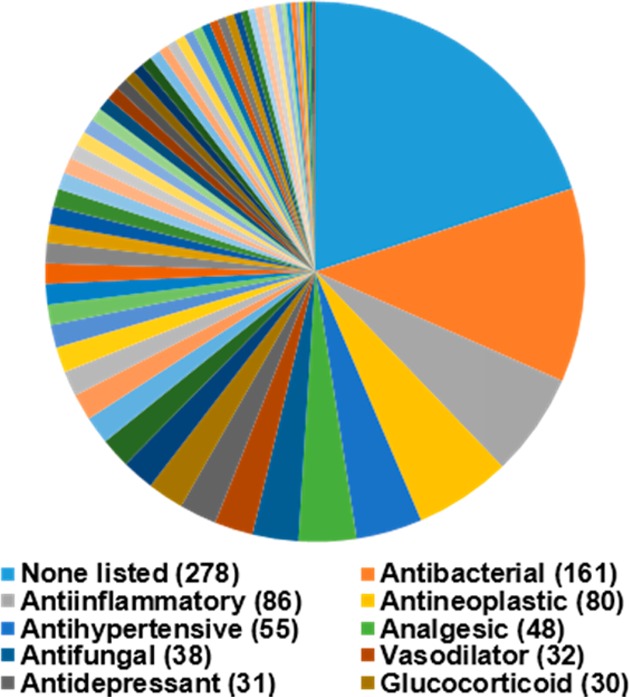
Summary of the bioactivities of the 1425 drug and drug-like compounds in the MicroSource Discovery Spectrum Collection, for which CCS values were measured in this study. The top 10 bioactivities and the number of compounds in each group are identified in the legend.
Figure 2.

(A) IM-MS conformational space plot showing the trends in CCS–mass for PolyAla and drug-like calibrants, which were obtained on a drift tube (DT) IM-MS with nitrogen as the drift gas. (B) Errors of calibrated CCS values for PolyAla and Drug-like CCS calibrants as a function of drift time. Calibration errors were determined as the percent error of the calibrated CCS relative to the DT CCS value. (C) IM-MS conformational space plot showing the 1440 nitrogen CCS values of the 1425 drugs from the Spectrum Collection. Data points represent the average of three measurements. The solid line represents a power curve fit to the CCS–mass trendline of drugs, which excluded compound that deviated significantly from the main band and multiply charged species. The dashed lines represent the ±10% bands from the power curve. (D) Histogram of the relative standard deviations (RSDs) of the triplicate CCS measurements of the Spectrum Collection.
High-Throughput CCS Measurements of Drug and Drug-like Compounds
The FIA-IM-MS and CCS calibration methods were used for the rapid CCS measurement of the 2000 compounds in the MDSI Spectrum Collection. The method had an approximate analysis time of 1 min per well, allowing up to four 384-well plates to be analyzed within a 24 h period. A total of 1440 CCS values (Figure 2C) representing 1425 unique compounds (71% coverage) were obtained from analysis of the MDSI Spectrum Collection as 16 of these drugs display two peaks, had two major adducts, or were mixtures for which we have reported a CCS value of each component (see Supporting Information for the entire dataset). The CCS values for the rest of the 560 drugs (summarized in Figure S1) were not successfully determined due to either low peak intensity (<1 × 10³ counts) or the peak being too wide (≥25 bins). Drugs such as inorganic complexes (e.g., cisplatin and carboplatin), drugs prepared as mixtures of multiple individual components (e.g., teicoplanin), and drugs with structures better suited for negative mode analysis (e.g., estradiol) were among the 560 drugs not determined in this analysis. CCS values were measured in triplicates and were highly reproducible, with the majority (≥95%) of CCS values having interday RSDs less than 0.5% (Figure 2D). The curves plotted in Figure 2C represent approximately ±10% from the center of the data (dashed lines) as determined by the power fit of the main trendline (solid line). Data points in Figure 2C are shown at 40% transparency to visualize the density in various regions of CCS–m/z space. The region within the ±10% lines from m/z 100 to 600 is mostly opaque as this area contains 95% of the measured CCS values. The greatest density of data points is found from m/z 200 to 400, which represents 61% of the measured CCS values. The spread of CCS values at any given m/z value can be visualized by the ±10% curves. For example, compounds with m/z 300–350 have CCS values ranging from 153 to 210 Å2. Although the majority of CCS values fall within ±10% threshold, several data points fall well outside the main trendline. The data points far above the +10% curve, such as gallamine triethiodide at 510.46 Da and 336.2 Å2, were observed as multiply charged (z ≥ 2) species. Notably, one additional data point, bacitracin at 1421 Da and 467 Å2 with a +3 charge, sits outside the CCS plot area. The compounds that lie below the −10% curve have unique chemical properties that influence the density of their gas-phase structure. In addition to the small molecule calibrants used in this study, CCS values of 31 compounds in this collection have been measured by DTIM previously by Zhou et al.,36 among which only four values differ by 3% or more from our measurements (Table S2). CCS values were obtained in N2 on the modified Synapt G2 HDMS with RF confining drift tube (RF-DTIM) for a subset of the compounds in the collection, including the four compounds that differed greatly from the DTIM CCS values of Zhou et al. (Table S3). We found that our calibrated CCS values are in good agreement with (between 0.2 and 2.6% differences) CCS values measured on the RF-DTIM platform, where our calibrant CCS values were originally measured. However, the RF-DTIM CCS values are systematically smaller than the DTIM values reported by Zhou et al. by 2–3% (Table S4). Recently, Alelyunas et al. determined the CCS values of 134 drugs using a similar approach of CCS calibration on a TWIM platform.37 The TWIM CCS values determined here differ by 0.7% on average against the CCS values determined by Alelyunas et al. (Table S5), with systematically larger differences (i.e., 2–4% different) for compounds greater than 800 Da, which may arise from differences between the CCS calibrants used (e.g., the range of m/z and CCS values of the calibrants or different calibrant and analyte backbone structures). These results suggest that there may be some inherent differences between CCS values measured on different DTIM platforms, as well as between TWIM using different CCS calibrants.
Structural Diversity of Drug and Drug-Like Compounds
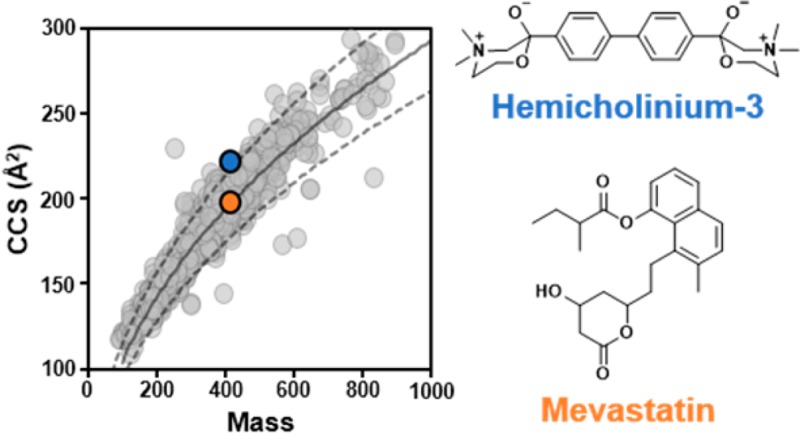
The range of CCS values observed in Figure 2C indicates a high degree of structural diversity among drug and drug-like compounds. Distinct trendlines are often observed in ion mobility data in instances where the compounds share specific structural characteristics.7,8 The structural and chemical properties of drugs are directly related to their bioactivities; thus, drugs with the same or similar bioactivities may show specific trends in their relationship between CCS and mass. Figure 3 examines the presence of unique structural trendlines based on the chemical properties and bioactivities of the 1425 drug and drug-like compounds. CCS values of lipid standards26 (blue, n = 48) and peptides8 (orange, n = 92) are plotted onto the 1440 CCS values in Figure 3A. The drug trendline deviates from the lipid trendline near 400 Da and from the peptide trendline at close to 600 Da. In the range of 400–800 Da, the drugs and peptides occupy similar conformation space. Above 800 Da, several drug compounds appear to fall onto the peptide or lipid trendlines, suggesting that these drugs have structural properties that are similar to those of peptides or lipids. We note that CCS values determined in this work were measured with nitrogen gas and, therefore, are systematically larger than those measured with helium gas due to differences in effective van der Waals radii, polarizabilities, and other factors.21,24,38
Figure 3.

IM-MS conformational space plots showing the regions occupied by (A) lipids and peptides; (B) subclasses of antibiotics; (C) compounds of various densities; and (D) corticosteroid and nonsteroidal anti-inflammatory drugs (NSAIDs). Structures shown: cephalexin is a cephalosporin antibiotic, benzalkonium C12 is an amphiphilic ammonium, clioquinol is an antifungal drug, ibuprofen is a common NSAID, and cortisone is a common corticosteroid.
The peptides with the largest masses and CCS values in Figure 3A appear to overlay onto several drug CCS values, suggesting that these drugs have peptide-like structures. Antibiotics are predominately natural products, and certain classes of antibiotics are derived from peptides, such as glycopeptides and lipopeptides. The correlation of CCS and mass for the various classes of antibiotics is evaluated in Figure 3B. The two cyclic polypeptide antibiotics, valinomycin and tyrothricin, fall near the peptide trendline shown in Figure 3A. Macrolides, which are cyclic polyketides, also appear to be similar in structure to peptides. In Figure 3B, the macrolides are grouped by the size of the polyketide ring: 14-, 15-, or 16-membered. The macrolides with 16-membered rings tended to have larger CCS values than those with 14- or 15-membered rings. Other subclasses of antibacterials shown in Figure 3B include penicillins and cephalosporins, both of which have a β-lactam core structure. The cephalosporins cover a wider range of masses and CCSs (350–650 Da, 180–240 Å2) than the penicillins (350–500 Da, 175–205 Å2). This is attributable to the greater diversity of cephalosporin structures, which can have various side chains on both sides of the core β-lactam structure. Penicillins, on the other hand, have only one variable side chain and therefore have a narrower range of structural diversity. The fluoroquinolones and tetracyclines also occupy relatively narrow regions of IM-MS space, whereas sulfonamides cover a wider range (250–400 Da, 145–195 Å2).
The lipid standards lie above the drug CCS trendline (Figure 3A), which is expected as lipids tend to have structural conformations with less gas-phase density than other molecules.7,8 This region of IM-mass space also contains many of the drug and drug-like compounds. The proximity of these data to the lipid trendline suggests that they share lipid-like structural features that decrease their gas-phase density. Figure 3C presents four types of compounds that demonstrate different gas-phase densities. Two of the four classes fall directly on or slightly above the +10% curve, which is indicative of lipid-like structures. These compounds are fat-soluble vitamins, including vitamins E and K, and topical anti-infective amphiphilic ammonium compounds, such as benzalkonium chlorides (Figure 3C). Like lipids, fat-soluble vitamins and the amphiphilic ammonium compounds have structures with long hydrophobic chains, which afford solubility in lipid-rich tissues. In contrast, water-soluble vitamins tend to have smaller CCS values even when compared against similar-mass, fat-soluble vitamins. For example, the CCS value of riboflavin 5-phosphate (457.1 Da, 197.2 Å2), a derivative of vitamin B2, is approximately 23 Å2 smaller than that of the synthetic vitamin K phytonadione (451.3 Da, 220.0 Å2). Figure 3C also highlights several compounds that deviate from the main trendline by up to 25%, such as clioquinol (305.9 Da, 138.2 Å2). These compounds were all found to contain two or more atoms of iodine, bromine, or chlorine and represent bioactivities such as thyroid hormones, disinfectants, and radiopaque agents. The presence of multiple halogen atoms (excluding fluorine) has a greater impact on the mass of the molecule than its size, leading to an overall increase in the molecule’s gas-phase density and a smaller CCS value than similar-mass compounds.
Figure 3D shows two major classes of anti-inflammatory drugs: nonsteroidal anti-inflammatory drugs (NSAIDs) and corticosteroids. While they mostly fall onto the main drug trendline and are separated from each class by mass, the structures did display large diversity within each class. For example, the corticosteroids fluocinonide and diflorasone diacetate have the same mass but a CCS difference of 20 Å2 (229.9 vs 209.5 Å2). Plots of additional classes of drugs are shown in the Supporting Information, including antifungal (P450 inhibitors), antihistamines, antiarrhythmic (Na channel blockers), vasolilators and bronchodilators (beta agonists, Ca channel blockers, and phosphodiesterase inhibitors), antihypertensives (agonists and blockers of alpha or beta adrenergic receptors), anticholinergics, antidiabetics (K channel blockers), etc. (Figures S2–S12).
Computational Studies of Bimodal Distribution of Some Drugs in the Gas Phase
One interesting observation of this data set is that several compounds displayed bimodal ATDs, yielding two major CCS values (Figures 4, S13, and S14–S22). This indicates a contribution from two distinct conformational or isomeric structures or the presence of protomers. Among the compounds displaying this behavior were cefpodoxime proxetil (Figure 4), a β-lactam cephalosporin antibiotic, and several compounds of the fluoroquinolone antibiotic class (Figure S13). The presence of fluoroquinolone protomers and the capability of IM-MS to resolve these protomers have been demonstrated previously by Kaufman et al., Lapthorn et al., and Stead et al., who found that the two major protomers observed in IM-MS separations using N2 had distinct fragmentation patterns in addition to unique drift times.39−41 Our own results on the postmobility fragmentation of ciprofloxacin protomers (Figures S23 and S24) is consistent with the fragmentation patterns reported by Stead et al.41 Postmobility fragmentation of cefpodoxime proxetil (Figures S25 and S26) also revealed distinct fragmentation patterns at the apex of each ATD peak. On the basis of these results, we evaluated the presence of protomers for cefpodoxime proxetil, which has not been studied previously, and determined the impact of protonation site on the gas-phase structures of cefpodoxime proxetil and the three fluoroquinolones (enoxacin, ciprofloxacin, and sarafloxacin) using MD modeling and theoretical CCS calculations following a protocol adapted from previous methods43 (see Experimental Section).
Figure 4.

(A) Conformation of cefpodoxime proxetil, obtained through molecular modeling, that had a theoretical CCS value 0.65% different than that of lower experimental CCS value; (B) bimodal ATD of cefpodoxime proxetil annotated with the experimental CCS values; (C) conformation of cefpodoxime proxetil, obtained through molecular modeling, that had a theoretical CCS value 0.97% different than that of the higher experiment CCS value.
For all three fluoroquinolones modeled (ciprofloxacin, enoxacin, and sarafloxacin), the low energy structures generated showed protonation on the terminal nitrogen of the piperazine ring regardless of substitution (i.e., cyclopropyl, ethyl, and benzyl, respectively) and matched the larger experimentally obtained CCS that corresponded to the major peak in the ATD (Figure S13). Although Lapthorn et al. sugggested that protomers at both the carboxylic carbonyl and the quinolone carbonyl contribute to the component with smaller CCS,40 our own Gaussian computation (DFT B3LYP/3-21G) results suggest that protonation at the carboxylic acid carbonyl rearranges to the quinolone carbonyl (as shown in Figure S23).
Two clustered structures were obtained for cefpodoxime proxetil, and four protomers were produced from each clustered structure. One protomer with protonation at the nitrogen atom of the thiazole ring was found with a theoretical CCS value that is within 0.5% of the smaller experimentally measured CCS (Figure 4A). This structure had the lowest energy relative to the other protomers optimized at the same basis. A protomer with the next lowest energy (approximately 15 kcal/mol higher), with protonation at the nitrogen atom of the β-lactam, displays a CCS value that is within 0.8% of the larger experimentally measured CCS value (Figure 4C). In a thermodynamically controlled reaction, the higher energy protomers are expected to have essentially no contribution to the structural ensemble at relevant temperatures. However, it has been demonstrated that under some circumstances, such as steric hindrance and different reaction environments (gas phase vs solution phase), the observed protomers produced by ESI may reflect kinetically controlled products instead of thermodynamically controlled products.44 Thus, although the protomer shown in Figure 4C was predicted to be thermodynamically disfavored, it may represent a product of a kinetically controlled process. The major structural difference observed between the two protomers is a rotation of the aminothiazole substituent relative to the β-lactam core from a more compact, downward-facing orientation in the smaller CCS structure to a more extended, upward-facing orientation in the larger CCS structure. Large differences in CCS values between different protomers of glucuronides were recently reported by Reading et al., which provides support to our results.21
Application of the IM-MS Method to Drug Products
The collection of CCS values for drug and drug-like compounds offers a means of identifying drug analytes from complex mixtures such as formulated drug products. The high-throughput FIA-IM-MS method was applied to the analysis of clindamycin in a 300 mg capsule. The Python script was used to obtain the drift time of clindamycin in the capsule sample, and the PolyAla + Drug CCS curve was applied to generate the CCS value of clindamycin. Figure 5 shows the ATDs for clindamycin (m/z 425.2) from the standard and from a 1 ng/mL solution of the clindamycin capsule with an estimated clindamycin concentration of 0.5 ng/mL (see Figure S27 for the 2D-IM-MS plot). The CCS value of clindamycin in the capsule was determined to be 201.0 Å2, which is 0.2% different from the CCS obtained from the analysis of the standard (200.6 Å2). Notably, these samples were analyzed several months apart and the CCS values were generated from different calibration curves. These results suggest that our library of drug CCS values may be a valuable resource of discriminating information in the confirmation of the active ingredient in a drug product.
Figure 5.
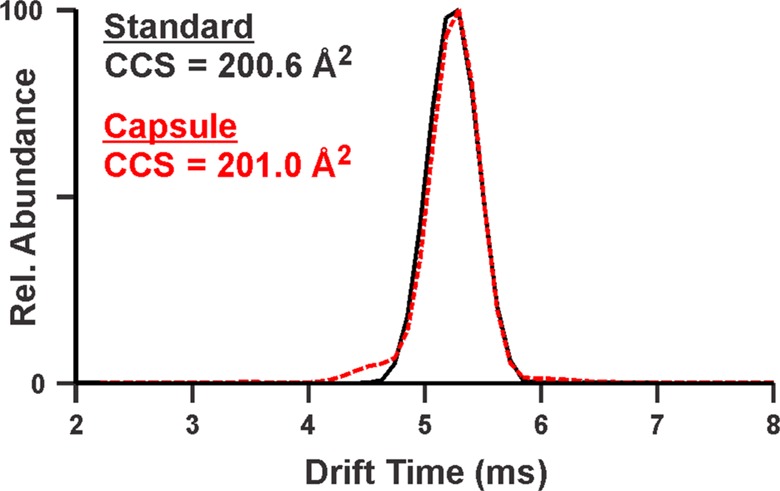
Comparison of the arrival time distribution (ATD) of the clindamycin standard in the Spectrum Collection (solid black line) and that of clindamycin from a 300 mg capsule prepared as a 1 ng/mL (approximately 0.5 ng/mL clindamycin) solution (dotted red line). The CCS values of clindamycin from the Spectrum Collection and the capsule are different by 0.2%.
Conclusions
High-throughput IM-MS measurements and a streamlined analysis workflow enabled the determination of CCS values for ions of 1425 unique drug or drug-like molecules (Figure 2C). These molecules have diverse bioactivities (Figure 1), span a broad range of masses (118–1448 Da), and yield ions with CCS values ranging from 121 to 387 Å2. We demonstrated the use of these CCS values for relating the structure and function of drugs (Figure 3), characterizing the multiple structures of protonated cefpodoxime proxetil (Figure 4) and identifying the bioactive molecule in a formulation (Figure 5). We anticipate that these results will be used (1) to improve the confidence in drug and drug metabolite identification, (2) to classify the potential bioactivities of new candidate molecules, based on their location in CCS–mass space, and (3) as benchmarks for the development of more general methods for calculating CCS values.
Acknowledgments
Financial support for this work was provided by a United States Pharmacopeia Global Fellowship (K.M.H.), National Institutes of Health grant R00 HD073270 (L.X.), startup funds to L.X. from the Department of Medicinal Chemistry, and the Drug Metabolism Transport and Pharmacogenetics Research Fund of the School of Pharmacy at the University of Washington (L.X.). Acknowledgement is also made to the Donors of the American Chemical Society Petroleum Research Fund (54437-DNI6 to M.F.B.) and Eli Lilly and Company (Young Investigator Award in Analytical Chemistry to M.F.B.) for their support of this research.
Supporting Information Available
The Supporting Information is available free of charge on the ACS Publications website at DOI: 10.1021/acs.analchem.7b01709.
The authors declare no competing financial interest.
Supplementary Material
References
- Gorog S. J. Pharm. Biomed. Anal. 2005, 36, 931. 10.1016/j.jpba.2004.06.025. [DOI] [PubMed] [Google Scholar]
- Siddiqui M. R.; AlOthman Z. A.; Rahman N. Arabian J. Chem. 2017, 10, S1409. 10.1016/j.arabjc.2013.04.016. [DOI] [Google Scholar]
- Clemmer D. E.; Hudgins R. R.; Jarrold M. F. J. Am. Chem. Soc. 1995, 117, 10141. 10.1021/ja00145a037. [DOI] [Google Scholar]
- von Helden G.; Wyttenbach T.; Bowers M. T. Science 1995, 267, 1483. 10.1126/science.267.5203.1483. [DOI] [PubMed] [Google Scholar]
- McLean J. A.; Ruotolo B. T.; Gillig K. J.; Russell D. H. Int. J. Mass Spectrom. 2005, 240, 301. 10.1016/j.ijms.2004.10.003. [DOI] [Google Scholar]
- Kanu A. B.; Dwivedi P.; Tam M.; Matz L.; Hill H. H. Jr. J. Mass Spectrom. 2008, 43, 1. 10.1002/jms.1383. [DOI] [PubMed] [Google Scholar]
- Fenn L. S.; Kliman M.; Mahsut A.; Zhao S. R.; McLean J. A. Anal. Bioanal. Chem. 2009, 394, 235. 10.1007/s00216-009-2666-3. [DOI] [PMC free article] [PubMed] [Google Scholar]
- May J. C.; Goodwin C. R.; Lareau N. M.; Leaptrot K. L.; Morris C. B.; Kurulugama R. T.; Mordehai A.; Klein C.; Barry W.; Darland E.; Overney G.; Imatani K.; Stafford G. C.; Fjeldsted J. C.; McLean J. A. Anal. Chem. 2014, 86, 2107. 10.1021/ac4038448. [DOI] [PMC free article] [PubMed] [Google Scholar]
- Paglia G.; Angel P.; Williams J. P.; Richardson K.; Olivos H. J.; Thompson J. W.; Menikarachchi L.; Lai S.; Walsh C.; Moseley A.; Plumb R. S.; Grant D. F.; Palsson B. O.; Langridge J.; Geromanos S.; Astarita G. Anal. Chem. 2015, 87, 1137. 10.1021/ac503715v. [DOI] [PMC free article] [PubMed] [Google Scholar]
- Jackson S. N.; Ugarov M.; Post J. D.; Egan T.; Langlais D.; Schultz J. A.; Woods A. S. J. Am. Soc. Mass Spectrom. 2008, 19, 1655. 10.1016/j.jasms.2008.07.005. [DOI] [PMC free article] [PubMed] [Google Scholar]
- Kyle J. E.; Zhang X.; Weitz K. K.; Monroe M. E.; Ibrahim Y. M.; Moore R. J.; Cha J.; Sun X.; Lovelace E. S.; Wagoner J.; Polyak S. J.; Metz T. O.; Dey S. K.; Smith R. D.; Burnum-Johnson K. E.; Baker E. S. Analyst 2016, 141, 1649. 10.1039/C5AN02062J. [DOI] [PMC free article] [PubMed] [Google Scholar]
- Hines K.; Herron J.; Xu L. J. Lipid Res. 2017, 58, 809. 10.1194/jlr.D074724. [DOI] [PMC free article] [PubMed] [Google Scholar]
- Wu C.; Siems W. F.; Hill H. H. Jr. Anal. Chem. 2000, 72, 396. 10.1021/ac9907235. [DOI] [PubMed] [Google Scholar]
- Ewing R. G.; Atkinson D. A.; Eiceman G. A.; Ewing G. J. Talanta 2001, 54, 515. 10.1016/S0039-9140(00)00565-8. [DOI] [PubMed] [Google Scholar]
- Verkouteren J. R.; Staymates J. L. Forensic Sci. Int. 2011, 206, 190. 10.1016/j.forsciint.2010.08.005. [DOI] [PubMed] [Google Scholar]
- Weston D. J.; Bateman R.; Wilson I. D.; Wood T. R.; Creaser C. S. Anal. Chem. 2005, 77, 7572. 10.1021/ac051277q. [DOI] [PubMed] [Google Scholar]
- Campuzano I.; Bush M. F.; Robinson C. V.; Beaumont C.; Richardson K.; Kim H.; Kim H. I. Anal. Chem. 2012, 84, 1026. 10.1021/ac202625t. [DOI] [PubMed] [Google Scholar]
- Roscioli K. M.; Tufariello J. A.; Zhang X.; Li S. X.; Goetz G. H.; Cheng G.; Siems W. F.; Hill H. H. Jr. Analyst 2014, 139, 1740. 10.1039/C3AN02113K. [DOI] [PubMed] [Google Scholar]
- Shimizu A.; Ohe T.; Chiba M. Drug Metab. Dispos. 2012, 40, 1456. 10.1124/dmd.112.045435. [DOI] [PubMed] [Google Scholar]
- Shimizu A.; Chiba M. Drug Metab. Dispos. 2013, 41, 1295. 10.1124/dmd.113.051953. [DOI] [PubMed] [Google Scholar]
- Reading E.; Munoz-Muriedas J.; Roberts A. D.; Dear G. J.; Robinson C. V.; Beaumont C. Anal. Chem. 2016, 88, 2273. 10.1021/acs.analchem.5b04068. [DOI] [PubMed] [Google Scholar]
- Mason E. A.; Schamp H. W. Jr Ann. Phys. 1958, 4, 233. 10.1016/0003-4916(58)90049-6. [DOI] [Google Scholar]
- Bush M. F.; Campuzano I. D.; Robinson C. V. Anal. Chem. 2012, 84, 7124. 10.1021/ac3014498. [DOI] [PubMed] [Google Scholar]
- Bush M. F.; Hall Z.; Giles K.; Hoyes J.; Robinson C. V.; Ruotolo B. T. Anal. Chem. 2010, 82, 9557. 10.1021/ac1022953. [DOI] [PubMed] [Google Scholar]
- Ruotolo B. T.; Benesch J. L.; Sandercock A. M.; Hyung S. J.; Robinson C. V. Nat. Protoc. 2008, 3, 1139. 10.1038/nprot.2008.78. [DOI] [PubMed] [Google Scholar]
- Hines K. M.; May J. C.; McLean J. A.; Xu L. Anal. Chem. 2016, 88, 7329. 10.1021/acs.analchem.6b01728. [DOI] [PMC free article] [PubMed] [Google Scholar]
- Ridenour W. B.; Kliman M.; McLean J. A.; Caprioli R. M. Anal. Chem. 2010, 82, 1881. 10.1021/ac9026115. [DOI] [PMC free article] [PubMed] [Google Scholar]
- Allen S. J.; Giles K.; Gilbert T.; Bush M. F. Analyst 2016, 141, 884. 10.1039/C5AN02107C. [DOI] [PubMed] [Google Scholar]
- Allen S. J.; Bush M. F. J. Am. Soc. Mass Spectrom. 2016, 27, 2054. 10.1007/s13361-016-1479-9. [DOI] [PubMed] [Google Scholar]
- Forsythe J. G.; Petrov A. S.; Walker C. A.; Allen S. J.; Pellissier J. S.; Bush M. F.; Hud N. V.; Fernandez F. M. Analyst 2015, 140, 6853. 10.1039/C5AN00946D. [DOI] [PubMed] [Google Scholar]
- Marty M. T.; Baldwin A. J.; Marklund E. G.; Hochberg G. K.; Benesch J. L.; Robinson C. V. Anal. Chem. 2015, 87, 4370. 10.1021/acs.analchem.5b00140. [DOI] [PMC free article] [PubMed] [Google Scholar]
- Hanwell M. D.; Curtis D. E.; Lonie D. C.; Vandermeersch T.; Zurek E.; Hutchison G. R. J. Cheminf. 2012, 4, 17. 10.1186/1758-2946-4-17. [DOI] [PMC free article] [PubMed] [Google Scholar]
- Schuttelkopf A. W.; van Aalten D. M. Acta Crystallogr., Sect. D: Biol. Crystallogr. 2004, 60, 1355. 10.1107/S0907444904011679. [DOI] [PubMed] [Google Scholar]
- Abraham M. J.; Gready J. E. J. Comput. Chem. 2011, 32, 2031. 10.1002/jcc.21773. [DOI] [PubMed] [Google Scholar]
- Frisch M. J.; Trucks G. W.; Schlegel H. B.; Scuseria G. E.; Robb M. A.; Cheeseman J. R.; et al. Gaussian 09, Revision A.02; Gaussian, Inc.: Wallingford, CT, 2016.
- Zhou Z.; Shen X.; Tu J.; Zhu Z. J. Anal. Chem. 2016, 88, 11084. 10.1021/acs.analchem.6b03091. [DOI] [PubMed] [Google Scholar]
- Alelyunas Y. W.; Smith K.; Cleland G.; Mortishire-Smith R.; Wrona M. D.. Waters Application Note 720005903EN; Waters: Milford, MA, 2017.
- Bleiholder C.; Johnson N. R.; Contreras S.; Wyttenbach T.; Bowers M. T. Anal. Chem. 2015, 87, 7196. 10.1021/acs.analchem.5b01429. [DOI] [PubMed] [Google Scholar]
- Kaufmann A.; Butcher P.; Maden K.; Widmer M.; Giles K.; Uria D. Rapid Commun. Mass Spectrom. 2009, 23, 985. 10.1002/rcm.3959. [DOI] [PubMed] [Google Scholar]
- Lapthorn C.; Dines T. J.; Chowdhry B. Z.; Perkins G. L.; Pullen F. S. Rapid Commun. Mass Spectrom. 2013, 27, 2399. 10.1002/rcm.6700. [DOI] [PubMed] [Google Scholar]
- Stead S.; Hird S.; McCullagh M.; McCall E.; Mejer T.; Berendsen B. In EuroResidue Conference 2016; Egmond aan Zee, The Netherlands, 2016. http://www.waters.com/webassets/cms/library/docs/2016euroresidue_stead_imsvdrs.pdf
- Forsythe J. G.; Stow S. M.; Nefzger H.; Kwiecien N. W.; May J. C.; McLean J. A.; Hercules D. M. Anal. Chem. 2014, 86, 4362. 10.1021/ac5001652. [DOI] [PMC free article] [PubMed] [Google Scholar]
- Joyce J. R.; Richards D. S. J. Am. Soc. Mass Spectrom. 2011, 22, 360. 10.1007/s13361-010-0037-0. [DOI] [PubMed] [Google Scholar]
Associated Data
This section collects any data citations, data availability statements, or supplementary materials included in this article.