 The confinement effect of h-BN shells helps to maintain active metallic Ni cores and strengthen the HOR processes occurring at h-BN/Ni interfaces.
Abstract
The development of low-cost and high-performance electrocatalysts remains a challenge for the hydrogen oxidation reaction (HOR) in alkaline membrane fuel cells. Here, we have reported novel Ni@h-BN core–shell nanocatalysts consisting of nickel nanoparticles encapsulated in few-layer h-BN shells. The Ni@h-BN catalysts exhibit an improved HOR performance compared with the bare Ni nanoparticles. In situ characterization experiments and density functional theory calculations indicate that the interactions of the O, H, and OH species with the Ni surface under the h-BN shell are weakened, which helps to maintain the active metallic Ni phase both in air and in the electrolyte and strengthen the HOR processes occurring at the h-BN/Ni interfaces. These results suggest a new route for designing high-performance non-noble metal electrocatalysts with encapsulating two-dimensional material overlayers for HOR reactions.
Introduction
Alkaline polymer electrolyte fuel cells (APEFCs) which employ an alkaline polymer as the primary electrolyte have received extensive interest.1–4 Compared with proton exchange membrane fuel cells (PEMFCs), APEFCs possess some advantages,5,6 such as the facile use of non-precious metal catalysts and alleviated corrosion of the metal components. However, kinetic processes of hydrogen oxidation reactions (HORs) occurring at the anodes of APEFCs are inherently slow in alkaline media compared with those in acid electrolytes.7,8 For example, platinum (Pt) is considered to be the best catalyst for this reaction, while its HOR activity is at least two orders of magnitude lower in alkaline media than in acid media. Accordingly, two main challenges need to be solved in APEFC technology. One is to develop high-performance non-noble metal catalysts which can replace platinum group metals. The other is to find an effective way to improve the HOR reaction kinetics in alkaline media.
Nickel (Ni) is considered as one of the most effective non-noble metals for the HOR and has been subjected to extensive research in the past few years.3,9–12 It has been found that Ni surfaces are easily oxidized and become less active for the HOR reaction. Therefore, effective ways to prevent the Ni surfaces from oxidation both in air and in electrolytes have to be explored.13 Lu et al. 3 attempted to decorate Ni nanoparticles (NPs) with CrOx, which suppressed surface oxidative passivation and retained the metallic Ni activity. Furthermore, it has been recognized that HOR activity is correlated with the hydrogen binding energy (HBE) on the catalyst surface according to the volcano curve.7,14,15 Hydrogen binds with Ni too strongly, which is located at the left side of the volcano curve. It is highly desirable to weaken the hydrogen adsorption on Ni such that the HBE can be shifted close to the apex and the optimum HOR activity can be achieved.16,17 For instance, Yan and co-workers12 have prepared a high-performance Ni catalyst supported on nitrogen doped carbon nanotubes, in which the nitrogen dopants modulate the d-orbitals of the surface Ni atoms and weaken the H adsorption on the top. Overall, an ideal Ni electrocatalyst for HORs in alkaline media should present weakened HBEs and a high resistance to surface oxidation.
Recently, the interface between metal surfaces and two-dimensional (2D) material overlayers, such as graphene and hexagonal boron nitride (h-BN), has been be considered as a nanoreactor.18–20 Small molecules such as CO, O2, and H2 intercalate the 2D overlayers and adsorb on the metal surfaces.19,21–26 In the confined nanospace, the adsorption strengths of many molecules on the metal surface have been weakened.27,28 Enhanced catalytic reactions such as CO oxidation were observed at graphene/Pt(111) and h-BN/Pt(111) interfaces due to the alleviated CO poisoning effect on the Pt surface under graphene and h-BN covers.29,30 Placing a 2D cover on a metal surface has been regarded as an efficient route to modulate the surface reactivity and enhance metal-catalyzed reactions.19,31 Inspired by the weakened adsorption effect under the 2D overlayers, the interaction of the H, O, and OH species on the Ni surfaces may be modulated by covering the Ni nanoparticles with h-BN shells as well.
In this work a simple synthesis strategy was developed to encapsulate Ni NPs with few-layer h-BN shells. We have found that the h-BN shells not only protect the Ni cores from oxidation in air and in the electrolyte but also weaken the hydrogen adsorption on the Ni surface. Accordingly, the Ni-catalyzed HOR reaction has been significantly improved by coverage with the h-BN shells. Our results demonstrate that nanocatalysts with ultrathin 2D material shells can present high activity and stability, which are significant for the design of highly efficient HOR electrocatalysts.
Results and discussion
A facile method was developed to prepare Ni@h-BN core–shell nanocatalysts. Firstly, a carbon support (Ketjen Black EC-600JD) was mixed with nickel nitrate (Ni(NO3)2) and boric acid (H3BO3) solutions, and the mixture was heated in an autoclave at 120 °C. The obtained product was then annealed in NH3 at 700 °C. For the preparation of the support-free catalysts, the carbon support was not added in the synthetic process. The molecular ratio of Ni to H3BO3 was varied from 3 : 1 to 1 : 1, and the corresponding samples were denoted as Ni3@(h-BN)1/C-700NH3, Ni1@(h-BN)1/C-700NH3, Ni3@(h-BN)1-700NH3, and Ni1@(h-BN)1-700NH3, respectively. For comparison, the carbon support was only impregnated with Ni(NO3)2 solution and then reduced in NH3 at 500 or 700 °C (Ni/C-500NH3 and Ni/C-700NH3).
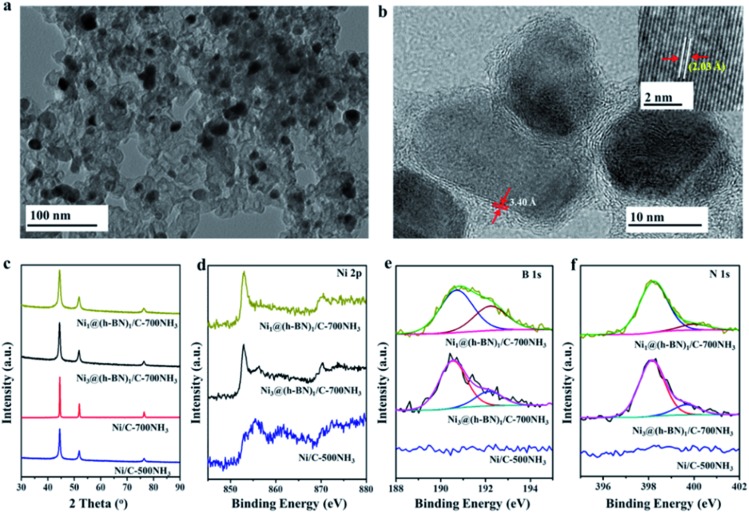
Transmission electron microscopy (TEM) images of the Ni@h-BN/C-700NH3 and Ni/C-500NH3 samples (Fig. 1a and S1†) show the uniform distribution of the Ni NPs with an average diameter between 10 and 15 nm. In the Ni@h-BN/C samples most NPs had been covered by graphitic overlayers, as revealed by high resolution TEM (HRTEM) (Fig. S2†). To avoid interference of the carbon support, the samples were calcinated in air at 550 °C for 2 h and then heated again in NH3 at 700 °C for 1 h, which could remove the support. HRTEM analysis (Fig. 1b) of the calcinated sample indicated that the metal NPs were encapsulated by defective and few-layer graphitic shells with a layer spacing of 3.40 Å, which is consistent with the (002) interplanar distance in the h-BN structure.32 The Ni cores exhibit a layer spacing around 2.03 Å, in agreement with the (111) plane of metallic Ni.33 The calcinated Ni1@(h-BN)1/C-700NH3 sample (Fig. S3†) contains similar core–shell nanostructures but with thicker h-BN overlayers. The Ni@h-BN nanostructures were also prepared using the same preparation procedure but without adding the carbon supports. The HRTEM images acquired from the support-free NPs confirm the formation of the Ni@h-BN core–shell nanostructures as well (Fig. S4†).
Fig. 1. (a) TEM image of the Ni3@(h-BN)1/C-700NH3 sample. (b) HRTEM image of the Ni3@(h-BN)1/C-700NH3 sample calcinated in air. The inset in (b) shows the lattice structure of the Ni particles. (c) XRD patterns of the Ni/C and Ni@h-BN/C samples treated in NH3 at 500 or 700 °C. XPS Ni 2p (d), B 1s (e), and N 1s (f) spectra of the Ni/C-500NH3, Ni3@(h-BN)1/C-700NH3, and Ni1@(h-BN)1/C-700NH3 samples.
X-ray diffraction (XRD) patterns (Fig. 1c) of the Ni/C-500NH3, Ni/C-700NH3, Ni3@(h-BN)1/C-700NH3, and Ni1@(h-BN)1/C-700NH3 samples all contain peaks from the metallic Ni phase. Using the Scherrer equation, the Ni particle sizes in the four samples were calculated to be 12.0, 38.1, 12.1, and 8.6 nm, respectively. Strong particle sintering takes place in the Ni/C-700NH3 sample, in which the Ni NPs grow at temperatures up to 700 °C. In contrast, in the Ni@h-BN/C-700NH3 samples the Ni NPs encapsulated with the h-BN shells have a similar or even smaller size compared with the Ni/C sample treated at a lower temperature (500 °C). TEM and XRD results indicate that the Ni NPs with the h-BN shells remain highly dispersed on the carbon support after the high temperature treatment in NH3.
The chemical state of the supported Ni NPs was investigated by X-ray photoelectron spectroscopy (XPS). The XPS Ni 2p3/2 spectrum (Fig. 1d) from the Ni/C-500NH3 sample has a main peak at 855.6 eV with a shoulder peak at 852.8 eV, which originate from the dominant surface nickel oxide phase with an underlying metallic Ni structure.33,34 This result is well expected since bare Ni surfaces are easily oxidized in air. The Ni 2p3/2 spectra recorded from the Ni3@(h-BN)1/C-700NH3 and Ni1@(h-BN)1/C-700NH3 samples have main peaks at 852.8 eV, which suggest that the Ni NPs encapsulated with the h-BN shells mainly maintain a metallic state. Meanwhile, the Ni1@(h-BN)1/C-700NH3 sample contains much less of the Ni oxide component than the Ni3@(h-BN)1/C-700NH3 sample because of the thicker h-BN shells in the former sample. All of the data suggest that the h-BN shells can effectively prevent the Ni NPs from oxidation in air.35
The XPS B 1s spectra (Fig. 1e) from the Ni@h-BN/C samples have main features at 190.6 eV which are from the B atoms in h-BN. In the corresponding N 1s spectra (Fig. 1f), the main features are located at 398.2 eV which are characteristic for h-BN as well.36,37 The B/N atomic ratios calculated from the B 1s feature (190.6 eV) and N 1s feature (398.2 eV) are around 1, confirming the formation of the h-BN structure in the Ni@h-BN/C samples. There are small features from B–O and N–H bonds at higher binding energy positions in the B 1s and N 1s spectra, which are due to defects in the h-BN layers or BOx species.38,39 In the Ni/C-500NH3 sample no B 1s signal and little N 1s signal were observed. It is known that h-BN structures present two strong characteristic absorption bands near 1398 and 771 cm–1 in infrared (IR) analysis,40,41 which have been observed in the IR spectra from the Ni3@(h-BN)1-700NH3 and Ni1@(h-BN)1-700NH3 samples (Fig. S5†). Overall, we conclude that the graphitic h-BN shells can be synthesized through the reaction between H3BO3 and NH3 at 700 °C.
In order to understand the formation mechanism of the h-BN structure, reactions of Ni(NO3)2 and H3BO3 with NH3 at 450 and 700 °C were investigated by XRD and IR (Fig. S6†) techniques. Both the nickel salt and H3BO3 are decomposed to the corresponding oxides (NiO and B2O3) at 450 °C. Metallic Ni formed upon heating in NH3 at 700 °C, and meanwhile B2O3 was transformed to h-BN, probably with the aid of the catalytic effect of the Ni surface.
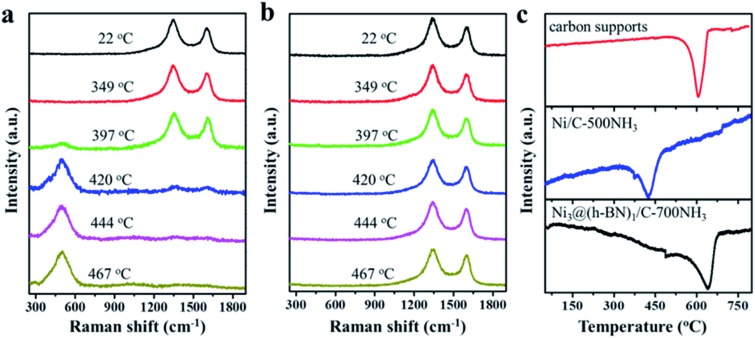
In situ Raman measurements were carried out to study the structural transformation of the Ni NPs in the Ni/C and Ni@h-BN/C samples upon oxidation treatment in air. Characteristic D and G bands of the carbon supports at 1350 and 1600 cm–1 are present in the Raman spectra from the Ni/C-500NH3 and Ni3@(h-BN)1/C-700NH3 samples.42 When the Ni/C-500NH3 sample was heated up to 397 °C a new peak at 510 cm–1 appeared which could be assigned to NiO (Fig. 2a).43,44 Meanwhile, the D and G bands were strongly weakened above 400 °C and disappeared completely up to 444 °C. In contrast, no NiO peaks were observed when annealing the Ni3@(h-BN)1/C-700NH3 sample up to 467 °C and the D and G bands kept their original intensity (Fig. 2b). In situ Raman measurements indicated that most Ni NPs covered by the h-BN shells kept their metallic phase at temperatures as high as 500 °C and the carbon supports were more stable than those in the Ni/C-500NH3 sample.
Fig. 2. In situ Raman spectra of the Ni/C-500NH3 (a) and Ni3@(h-BN)1/C-700NH3 (b) samples oxidized at the indicated temperatures in air. (c) TPO spectra of the carbon supports, and Ni/C-500NH3 and Ni3@(h-BN)1/C-700NH3 samples.
In carbon-supported metal catalysts the oxidation of the carbon supports can be facilitated by the catalytic role of the metal NPs.45–47 Such an effect may be blocked by the h-BN shells in the Ni@h-BN/C samples in which the carbon supports are physically separated from the Ni NPs and the burning of the carbon supports in air requires higher temperatures. In order to confirm this assertion, temperature programmed oxidation (TPO) experiments were performed over the pure carbon support, and Ni/C-500NH3 and Ni3@(h-BN)1/C-700NH3 samples. As shown in Fig. 2c the oxidation temperatures of the Ni3@(h-BN)1/C-700NH3 and pure carbon samples are similar (640 vs. 630 °C), suggesting that the encapsulated Ni NPs play almost no role in the support oxidation. However, the oxidation peak of the Ni/C-500NH3 sample is located at 426 °C and the oxidation reaction has been significantly enhanced by the bare Ni NPs. Based on the TEM, XRD, in situ Raman, and TPO data, we conclude that Ni@h-BN core–shell nanostructures consisting of Ni cores and h-BN shells have been well constructed and the Ni NPs with the h-BN shells present better resistance to oxidation and sintering at higher temperatures.
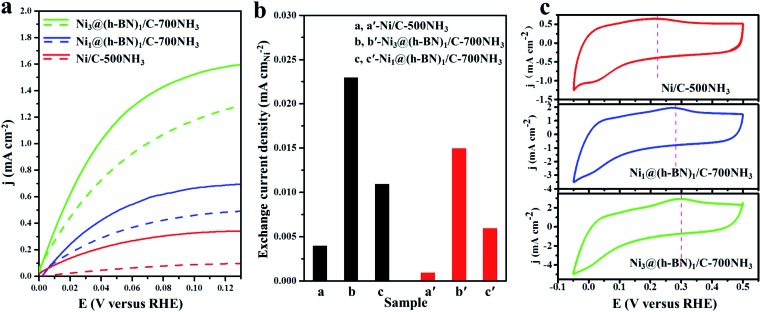
The HORs were carried out in H2-saturated 0.1 M NaOH solution with the rotation rate of 2500 revolutions per minute (rpm). Fig. 3a shows the HOR curves from the Ni/C-500NH3, Ni3@(h-BN)1/C-700NH3, and Ni1@(h-BN)1/C-700NH3 catalysts. The Ni3@(h-BN)1/C-700NH3 catalyst exhibits a much better performance than the Ni1@(h-BN)1/C-700NH3 and Ni/C-500NH3 samples. In the electrochemical reactions the relationship between the kinetic current density and the overpotential can be described by the Butler–Volmer equation:8
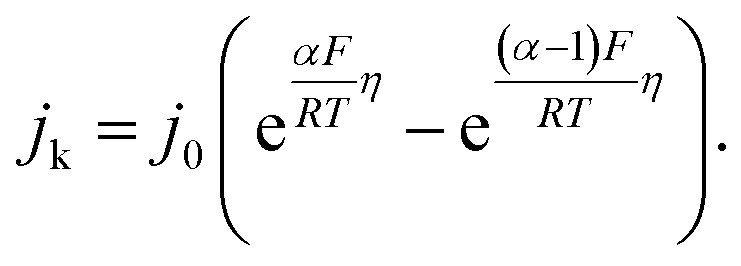
Fig. 3. (a) Polarization curves from the Ni/C-500NH3, Ni3@(h-BN)1/C-700NH3, and Ni1@(h-BN)1/C-700NH3 catalysts in H2-saturated 0.1 M NaOH solution at 5 mV s–1 with a rotation rate of 2500 rpm. All of the catalysts have a loading of 0.25 mgNi cm–2. The solid and dashed lines represent HOR activity data before and after the accelerated durability tests (ADTs), respectively. (b) Exchange current densities from the Ni/C-500NH3, Ni3@(h-BN)1/C-700NH3, and Ni1@(h-BN)1/C-700NH3 samples before (black) and after (red) the ADTs, respectively. (c) Cyclic voltammetry curves of the Ni/C-500NH3, Ni3@(h-BN)1/C-700NH3, and Ni1@(h-BN)1/C-700NH3 samples in N2-saturated 0.1 M NaOH solution at 20 mV s–1.
j
k is the kinetic current density, j
0 is the exchange current density, α is the transfer coefficient, F is the Faraday constant, R is the universal gas constant, T is the temperature, and η is the overpotential. When η is in the micro regime, the Butler–Volmer equation can be simplified to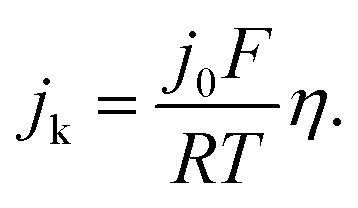
The exchange current can be obtained by the linear fitting of the polarization curve in the micro-polarization region (–10 to 10 mV). The Ni specific surface areas of the Ni3@(h-BN)1/C-700NH3, Ni1@(h-BN)1/C-700NH3, and Ni/C-500NH3 catalysts are 15.20, 13.20, and 15.34 m2 gNi –1, respectively, which were determined by a H2 chemisorption experiment (see ESI†). According to these data j 0 of the Ni3@(h-BN)1/C-700NH3 catalyst was calculated to be 0.023 mA cmNi –2, which is two times higher than that of the Ni1@(h-BN)1/C-700NH3 sample (0.011 mA cmNi –2) and around six times higher than that of the Ni/C-500NH3 sample (0.004 mA cmNi –2) (Fig. 3b). The exchange current density of the Ni3@(h-BN)1/C-700NH3 catalyst is comparable to that of a Ni/N-CNT catalyst (0.028 mA cmNi –2) which has been reported to be the most active non-noble metal catalyst for the HOR in 0.1 M KOH.12 The Ni1@(h-BN)1/C-700NH3 sample possesses thicker and more compact h-BN shells than the Ni3@(h-BN)1/C-700NH3 sample, and has a relatively lower HOR activity than the latter one. Therefore, the defects in the few-layer h-BN shells function as open channels for reactant diffusion onto the Ni surfaces under the h-BN shells, which is critical for the reactions.
Accelerated durability tests (ADTs) over the three catalysts have been conducted by scanning the potential from –0.05 to 0.50 V (vs. RHE, 100 mV s–1) for 10 000 cycles. Polarization curves of the Ni/C-500NH3, Ni3@(h-BN)1/C-700NH3, and Ni1@(h-BN)1/C-700NH3 catalysts after the ADTs are shown in Fig. 3a (dashed lines), in which the two Ni@h-BN/C catalysts still present quite high HOR activities. After the ADTs the j 0 values of the Ni3@(h-BN)1/C-700NH3 and Ni1@(h-BN)1/C-700NH3 catalysts were 0.015 and 0.006 mA cmNi –2, which were 65% and 54% of their initial j 0 values (Fig. 3b). In contrast, j 0 of the Ni/C-500NH3 sample was only 0.001 mA cmNi –2 after the ADTs, indicting the severe deactivation of the bare Ni NPs.
Cyclic voltammetry (CV) curves of the three catalysts are shown in Fig. 3c. The Ni oxidation peaks of the Ni3@(h-BN)1/C-700NH3, Ni1@(h-BN)1/C-700NH3, and Ni/C-500NH3 catalysts are located at 0.30, 0.28, and 0.22 V, respectively, which indicates that the h-BN shells can effectively improve the oxidation resistance of the Ni NPs under the HOR working conditions. The CV curves of the three catalysts before and after the ADTs (Fig. S7†) indicate that the h-BN shells prevent the aggregation and dissolution of the Ni NPs. Our XPS and CV results confirm that the h-BN shells in the Ni@h-BN/C catalysts not only help the Ni NPs to maintain their metallic state in air but also hinder their oxidation under HOR reaction conditions. For the HOR reactions in practical devices, more positive polarization would be applied in order to obtain a larger current. However, non-noble metal catalysts are easily oxidized at higher potentials, which results in strong deactivation.3 A catalyst with a higher oxidation potential is more practical.
In alkaline solutions the microscopic steps of the HOR follow the Tafel–Volmer or Heyrovsky–Volmer mechanisms:12Tafel step: H2 ⇆ 2HadHeyrovsky step: H2 + OH– ⇆ Had + e– + H2OVolmer step: Had + OH– ⇆ H2O + e–
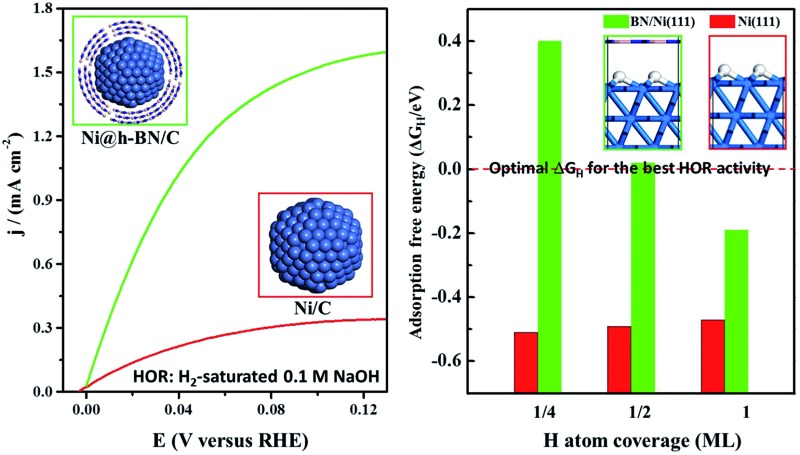
It has been demonstrated that interaction between the Ni surface and Had is too strong such that the Volmer process becomes the limiting step for the HOR in alkaline media.48 Any way of weakening the H adsorption on the Ni surface could promote this reaction. Herein, density functional theory (DFT) calculations were carried out to explore the hydrogen adsorption on the bare Ni(111) surface and at the h-BN/Ni(111) interface. The adsorption free energy of H atoms (ΔG H) is a widely accepted descriptor for the HOR activity on various catalytic materials, and is determined by the adsorption energy of the H atoms (ΔE H) using the relationship of ΔG H = ΔE H + 0.24 eV.14 The optimum activity can be achieved with ΔG H around zero (∼0 eV) to compromise the adsorption and desorption processes. As shown in Fig. 4a, ΔG H on the bare Ni(111) surface is around –0.5 eV, which is too strong for the reaction. The presence of the h-BN shell can significantly decrease ΔG H, which depends on the coverage of H atoms. In the case of a practical coverage of 1/2 of a monolayer (ML) ΔG H reaches the optimal value of ∼0 eV. The corresponding atomic structure diagrams of Had on h-BN/Ni(111) with different H atom coverages are shown in Fig. S8.† The calculations indicate that the HOR activity on the Ni surface can be improved by the h-BN shell, and confirm the experimental results.
Fig. 4. (a) Adsorption free energies of H atoms (ΔG H) on the Ni(111) (blue) and h-BN/Ni(111) (green) surfaces with H coverage at 1/4, 1/2, and 1 ML. The optimal value of ΔG H for the best HOR activity is shown by the red dashed line. (b) Adsorption energies of OH atoms (ΔE OH) on the Ni(111) (blue) and h-BN/Ni(111) (green) surfaces with OH coverage at 1/4, 1/2, and 1 ML. (c) Adsorption energies of O atoms (ΔE O) on the Ni(111) (blue) and h-BN/Ni(111) (green) surfaces with O coverage at 1/4, 1/2, and 1 ML.
Adsorption energies of OH (ΔE OH) and O atoms (ΔE O) on the Ni(111) and h-BN/Ni(111) surfaces are given in Fig. 4b and c. For all coverages, the h-BN overlayer weakens the adsorption of the OH groups and O atoms on the Ni surface (Fig. S9 and S10†), indicating that the h-BN cover can improve the resistance to oxidation of the Ni surface by OH groups and O atoms. Overall, the h-BN overlayer weakens the Ni–H, Ni–OH, and Ni–O interactions because of the confinement effect in the nanospace between the 2D material cover and metal surface.25,28 The weakened O, OH, and H adsorption helps to maintain the metallic Ni phase both in air and in the electrolyte environments, which enhances the HOR activity.
Conclusions
We reported a non-noble metal HOR catalyst which consists of nickel cores and ultrathin h-BN shells. In comparison with bare Ni NPs, the Ni NPs covered with few-layer h-BN shells exhibit high HOR activity in alkaline electrolytes. The exchange current density of the Ni3@(h-BN)1/C-700NH3 sample is six times higher than that of the Ni/C-500NH3 sample based on the similar Ni particle size. In situ characterization experiments and theoretical investigations revealed that the enhanced HOR activity is attributed to the confinement effect from the few-layer h-BN shells. Ni NPs under the h-BN overlayers possess appropriate Ni–O, Ni–OH, and Ni–H interaction strengths which are the critical factors for optimum HOR performance. Our results show that the Ni@h-BN core–shell catalysts are promising in APEFC technology.
Acknowledgments
This work was financially supported by the National Natural Science Foundation of China (No. 21373208, No. 21688102, No. 91545204, and No. 21621063), and Ministry of Science and Technology of China (No. 2016YFA0200200, No. 2013CB834603, and No. 2013CB933100), and the Strategic Priority Research Program of the Chinese Academy of Sciences (Grant No. XDB17020200).
Footnotes
References
- Bianchini C., Shen P. K. Chem. Rev. 2009;109:4183–4206. doi: 10.1021/cr9000995. [DOI] [PubMed] [Google Scholar]
- Gu S., Cai R., Luo T., Chen Z., Sun M., Liu Y., He G., Yan Y. Angew. Chem., Int. Ed. 2009;48:6499–6502. doi: 10.1002/anie.200806299. [DOI] [PubMed] [Google Scholar]
- Lu S., Pan J., Huang A., Zhuang L., Lu J. Proc. Natl. Acad. Sci. U. S. A. 2008;105:20611–20614. [Google Scholar]
- Varcoe J. R., Slade R. C. T. Fuel Cells. 2005;5:187–200. [Google Scholar]
- Pan J., Lu S., Li Y., Huang A., Zhuang L., Lu J. Adv. Funct. Mater. 2010;20:312–319. [Google Scholar]
- Wang Y.-J., Qiao J., Baker R., Zhang J. Chem. Soc. Rev. 2013;42:5768–5787. doi: 10.1039/c3cs60053j. [DOI] [PubMed] [Google Scholar]
- Durst J., Siebel A., Simon C., Hasche F., Herranz J., Gasteiger H. A. Energy Environ. Sci. 2014;7:2255–2260. [Google Scholar]
- Sheng W., Gasteiger H. A., Shao-Horn Y. J. Electrochem. Soc. 2010;157:B1529–B1536. [Google Scholar]
- Kenjo T. J. Electrochem. Soc. 1985;132:383–386. [Google Scholar]
- Mund K., Richter G., von Sturm F. J. Electrochem. Soc. 1977;124:1–6. [Google Scholar]
- Sheng W., Bivens A. P., Myint M., Zhuang Z., Forest R. V., Fang Q., Chen J. G., Yan Y. Energy Environ. Sci. 2014;7:1719–1724. [Google Scholar]
- Zhuang Z., Giles S. A., Zheng J., Jenness G. R., Caratzoulas S., Vlachos D. G., Yan Y. Nat. Commun. 2016;7:10141. doi: 10.1038/ncomms10141. [DOI] [PMC free article] [PubMed] [Google Scholar]
- Asazawa K., Yamada K., Tanaka H., Oka A., Taniguchi M., Kobayashi T. Angew. Chem., Int. Ed. 2007;46:8024–8027. doi: 10.1002/anie.200701334. [DOI] [PubMed] [Google Scholar]
- Nørskov J. K., Bligaard T., Logadottir A., Kitchin J. R., Chen J. G., Pandelov S., Stimming U. J. Electrochem. Soc. 2005;152:J23–J26. [Google Scholar]
- Skúlason E., Tripkovic V., Björketun M. E., Gudmundsdóttir S., Karlberg G., Rossmeisl J., Bligaard T., Jónsson H., Nørskov J. K. J. Phys. Chem. C. 2010;114:18182–18197. [Google Scholar]
- Tang M. H., Hahn C., Klobuchar A. J., Ng J. W. D., Wellendorff J., Bligaard T., Jaramillo T. F. Phys. Chem. Chem. Phys. 2014;16:19250–19257. doi: 10.1039/c4cp01385a. [DOI] [PubMed] [Google Scholar]
- Zhou Y., Chen W., Cui P., Zeng J., Lin Z., Kaxiras E., Zhang Z. Nano Lett. 2016;16:6058–6063. doi: 10.1021/acs.nanolett.6b02052. [DOI] [PubMed] [Google Scholar]
- Fu Q., Bao X. Chin. J. Catal. 2015;36:517–519. [Google Scholar]
- Fu Q., Bao X. Chem. Soc. Rev. 2017;46:1842–1874. doi: 10.1039/c6cs00424e. [DOI] [PubMed] [Google Scholar]
- Deng D., Novoselov K. S., Fu Q., Zheng N., Tian Z., Bao X. Nat. Nanotechnol. 2016;11:218–230. doi: 10.1038/nnano.2015.340. [DOI] [PubMed] [Google Scholar]
- Grånäs E., Andersen M., Arman M. A., Gerber T., Hammer B., Schnadt J., Andersen J. N., Michely T., Knudsen J. J. Phys. Chem. C. 2013;117:16438–16447. [Google Scholar]
- Jin L., Fu Q., Dong A., Ning Y., Wang Z., Bluhm H., Bao X. J. Phys. Chem. C. 2014;118:12391–12398. [Google Scholar]
- Larciprete R., Ulstrup S., Lacovig P., Dalmiglio M., Bianchi M., Mazzola F., Hornekær L., Orlando F., Baraldi A., Hofmann P., Lizzit S. ACS Nano. 2012;6:9551–9558. doi: 10.1021/nn302729j. [DOI] [PubMed] [Google Scholar]
- Sutter P., Sadowski J. T., Sutter E. A. J. Am. Chem. Soc. 2010;132:8175–8179. doi: 10.1021/ja102398n. [DOI] [PubMed] [Google Scholar]
- Wei M., Fu Q., Wu H., Dong A., Bao X. Top. Catal. 2016;59:543–549. [Google Scholar]
- Brugger T., Ma H., Iannuzzi M., Berner S., Winkler A., Hutter J., Osterwalder J., Greber T. Angew. Chem., Int. Ed. 2010;49:6120–6124. doi: 10.1002/anie.201001064. [DOI] [PubMed] [Google Scholar]
- Mu R., Fu Q., Jin L., Yu L., Fang G., Tan D., Bao X. Angew. Chem., Int. Ed. 2012;51:4856–4859. doi: 10.1002/anie.201200413. [DOI] [PubMed] [Google Scholar]
- Yang Y., Fu Q., Li H., Wei M., Xiao J., Wei W., Bao X. ACS Nano. 2015;9:11589–11598. doi: 10.1021/acsnano.5b05509. [DOI] [PubMed] [Google Scholar]
- Yao Y., Fu Q., Zhang Y. Y., Weng X., Li H., Chen M., Jin L., Dong A., Mu R., Jiang P., Liu L., Bluhm H., Liu Z., Zhang S. B., Bao X. Proc. Natl. Acad. Sci. U. S. A. 2014;111:17023–17028. doi: 10.1073/pnas.1416368111. [DOI] [PMC free article] [PubMed] [Google Scholar]
- Zhang Y., Weng X., Li H., Li H., Wei M., Xiao J., Liu Z., Chen M., Fu Q., Bao X. Nano Lett. 2015;15:3616–3623. doi: 10.1021/acs.nanolett.5b01205. [DOI] [PubMed] [Google Scholar]
- Li H., Xiao J., Fu Q., Bao X. Proc. Natl. Acad. Sci. U. S. A. 2017;114:5930–5934. doi: 10.1073/pnas.1701280114. [DOI] [PMC free article] [PubMed] [Google Scholar]
- Li J., Gao L. J. Mater. Chem. 2003;13:628–630. [Google Scholar]
- Fu T., Wang M., Cai W., Cui Y., Gao F., Peng L., Chen W., Ding W. ACS Catal. 2014;4:2536–2543. [Google Scholar]
- Biesinger M. C., Payne B. P., Grosvenor A. P., Lau L. W. M., Gerson A. R., Smart R. S. C. Appl. Surf. Sci. 2011;257:2717–2730. [Google Scholar]
- Li L. H., Cervenka J., Watanabe K., Taniguchi T., Chen Y. ACS Nano. 2014;8:1457–1462. doi: 10.1021/nn500059s. [DOI] [PubMed] [Google Scholar]
- Shi Y., Hamsen C., Jia X., Kim K. K., Reina A., Hofmann M., Hsu A. L., Zhang K., Li H., Juang Z.-Y., Dresselhaus M. S., Li L.-J., Kong J. Nano Lett. 2010;10:4134–4139. doi: 10.1021/nl1023707. [DOI] [PubMed] [Google Scholar]
- Zhang C., Fu L., Zhao S., Zhou Y., Peng H., Liu Z. Adv. Mater. 2014;26:1776–1781. doi: 10.1002/adma.201304301. [DOI] [PubMed] [Google Scholar]
- Das M., Basu A. K., Ghatak S., Joshi A. G. J. Eur. Ceram. Soc. 2009;29:2129–2134. [Google Scholar]
- Montero I., Galán L., Osòrio S. P., Martínez-Duart J. M., Perrière J. Surf. Interface Anal. 1994;21:809–813. [Google Scholar]
- Rozenberg A. S., Sinenko Y. A., Chukanov N. V. J. Mater. Sci. 1993;28:5675–5678. [Google Scholar]
- Wang L., Sun C., Xu L., Qian Y. Catal. Sci. Technol. 2011;1:1119–1123. [Google Scholar]
- Malard L. M., Pimenta M. A., Dresselhaus G., Dresselhaus M. S. Phys. Rep. 2009;473:51–87. [Google Scholar]
- Wang W., Liu Y., Xu C., Zheng C., Wang G. Chem. Phys. Lett. 2002;362:119–122. [Google Scholar]
- Zhou G., Wang D.-W., Yin L.-C., Li N., Li F., Cheng H.-M. ACS Nano. 2012;6:3214–3223. doi: 10.1021/nn300098m. [DOI] [PubMed] [Google Scholar]
- Limat M., Fóti G., Hugentobler M., Stephan R., Harbich W. Catal. Today. 2009;146:378–385. [Google Scholar]
- Deng D., Yu L., Chen X., Wang G., Jin L., Pan X., Deng J., Sun G., Bao X. Angew. Chem., Int. Ed. 2013;52:371–375. doi: 10.1002/anie.201204958. [DOI] [PubMed] [Google Scholar]
- Sun M., Fu Q., Gao L., Zheng Y., Li Y., Chen M., Bao X. Nano Res. 2017;10:1403–1412. [Google Scholar]
- Sheng W., Myint M., Chen J. G., Yan Y. Energy Environ. Sci. 2013;6:1509–1512. [Google Scholar]
Associated Data
This section collects any data citations, data availability statements, or supplementary materials included in this article.


