Abstract
Calcium (Ca2+) plays a central role in regulating many biological processes in the cell from muscle contraction to neurotransmitter release. The need for reliable fluorescent calcium indicator dyes is of vast importance for studying many aspects of cell biology as well as screening compounds using phenotypic high throughput assays. We have assessed two of the latest generation of calcium indicator dyes, FLIPR Calcium 6 and Cal-520 AM for studying calcium transients (CaTs) in induced pluripotent stem cell (iPSC) -derived human cardiomyocytes. FLIPR Calcium 6 and Cal-520 dyes both displayed robust CaTs with a high signal-to-noise ratio (SNR) and were non-toxic to the cells. The analysis showed that CaT amplitudes were stable between measurements, but CaT duration was more variable and tended to increase between reads. Two methods were compared for drug-screening hit-selection; difference in average (unstandardized) and standardized difference. The unstandardized difference was better for assessing CaT amplitude, whereas standardized difference was equal to or better for assessing CaT duration. In summary, FLIPR Calcium 6 and Cal-520 are suitable dyes for drug-screening using iPSC-derived human cardiomyocytes.
Introduction
Fluorescent dye indicators for intracellular calcium measurement are widely used in many fields of biology. The fluorescent calcium indicator dyes work by their ability to change their brightness when bound to calcium ions. Fura-2 was one of the first calcium indicators developed and has a large spectral shift upon binding to calcium that allows for the ability to ratiometrically measure intracellular calcium concentration 1. Newer calcium indicators have minimal spectral shift upon calcium binding but are much brighter and are used for measuring qualitative changes in calcium concentration. FLIPR dyes were developed as a no-wash calcium dye to minimize the number of steps and washing artifacts important for high throughput applications 2, 3. FLIPR dyes come with background quenching technology which may improve SNRs and decrease standard deviation and dye loading does not require detergent. Cal-520 AM is the latest generation of fluorescence indicators in the line of Fluo3-AM and Fluo4-AM which are dyes linked to non-polar acetoxymethyl (AM) esters that allow for efficient crossing of the cell membrane and are rapidly hydrolyzed by esterases inside the cell. AM conjugated dyes are reconstituted in DMSO and may be used with a low concentration detergent, such as 0.04% Pluronic F-127, to increase dye loading, which may be unphysiological.
Calcium is a robust second messenger for cell physiology including contraction of muscle cells. Contractility of muscle cells especially cardiomyocytes plays a critical role in analyzing compound-induced cardiotoxicity in the drug discovery industry. Over 30% of drug discovery programs are terminated due to the cardiac safety concerns 4. While current cardiac safety guidelines for in vitro cardiac safety assessments focus on detecting drug-induced changes in electrophysiology, resulting in drug-induced arrhythmia such as Torsade de Pointes (TdP), electrophysiology assessments have limited sensitivity to detect new emerging types of cardiotoxicity issues including those induced by kinase inhibitors for cancer drugs 5. Calcium ions play an important part in electrophysiology and regulate the activities of motor proteins in cardiac contraction, which is known as excitation-contraction coupling 6. The assessment of calcium concentration allows analysis of cardiotoxicity issues in both electrophysiology and contractility 7. In addition, iPSC-derived cardiomyocytes will play a critical role in screening compound-induced cardiac safety issues in the early stages of the drug discovery process to avoid expensive drug attritions in their later stages. Therefore, we assessed the sensitivity of two calcium indicator dyes by analysis of CaTs from iPSC-derived cardiomyocytes to determine the effects of well-known proarrhythmic cardio toxic compounds on CaTs in high-throughput (HTP) assay format. The work describes an approach to perform such assays and statistical analysis to improve the confidence of data obtained from the HTP assays as well as to select appropriate calcium indicator dyes for different projects based on assay needs.
Methods
Cardiomyocyte Differentiation and Seeding
Human iPSCs (Applied Stem Cell, Milpitas, CA) were cultured (37°C, 5%-CO2) on matrigel-coated 6-well plates in stem cell media and seeded into Matrigel-coated 24-well plates for differentiation. Cardiomyocytes were differentiated from human iPSCs following previously established methods 8. Beating cardiomyocytes were maintained in Advanced RPMI 1640 Medium (GIBCO-Thermo Fisher Scientific, Grand Island, NY) with media exchange every 2 days. Cardiomyocytes were harvested 15–20 days after differentiation and were seeded into black, clear-bottom 96-well plates (Corning, Corning NY) at 100,000 cells/well (312,500 cells/cm2).
Calcium Dye Loading and Detection
On the day before the assay, the medium in the 96-well plate was replaced with 100 μL Advanced RPMI 1640 Medium per well. On the day of the assay, the medium in the plate incubated with the cells overnight (conditioned medium) was removed and stored at 37°C and 5% CO2. FLIPR Calcium 6 dye (Molecular Devices, Sunnyvale, CA) was mixed at 1:1 dye to medium and the mixture was added to the wells of plate. Cal-520 AM (AAT Bioquest, Sunnyvale, CA) was solubilized in DMSO at 2mM and diluted 1:1000 in medium for a final concentration of 2 μM with the addition of 1:100 Powerload Concentrate, 100X (Thermo Fisher Scientific, Waltham, MA) and the mixture was added to the wells of the plate. Dye mixtures were incubated with the cells for 60 minutes in the incubator (37°C, 5%-CO2). The dye was removed from the plate and the wells were washed with warmed medium 1X. The conditioned medium (stored at 37°C, 5%-CO2) was added to the cells, and the 96-well plate was stored in the incubator for >30 minutes before the assay.
Fluorescence readings were attained on a FDSS/μCell (Hamamatsu, Japan) system with readings at ~110 data points/sec for 60 seconds. The FDSS/ μCell has a heated stage that is maintained at 37°C during recording. Fluorescence measurements were recorded and the plate was returned to the incubator for 10 minutes before the next recording. Two baseline measurements (T1, T2) were made prior to drug addition and a drug-treated measurement (T3).
Drug Preparation and Addition
Dofetilide (Sigma-Aldrich, St. Louis, MO) was solubilized in DMSO at a stock concentration of 20mM and E-4031 (Sigma-Aldrich, St. Louis, MO) was solubilized in deionized water at a stock concentration of 20mM. The stock concentrations of the drugs were diluted in medium to 10X the final concentration for the assay and added to a 96-well drug delivery plate. 0.1%-DMSO time-matched controls were used for the “0” drug condition to control for solvent changes. The drugs dilutions were delivered to the 96-well cell plate using a CyBi-SELMA semi-automated electronic pipetting device with a 96-channel head (Analytik-Jena, Jena, Germany).
Data Analysis
Each experimental condition in the plate had four replicates (n=4), and at least three similar experiments were performed. Data was analyzed with OscioSurf software (InvivoSciences, Inc., WI) designed to automatically detect number of periodic CaT peaks and analyze amplitude, peak-width duration changes, as well as perform ensemble average calculations of all the CaTs. Monte-Carlo simulation was processed in Microsoft Excel.
Results
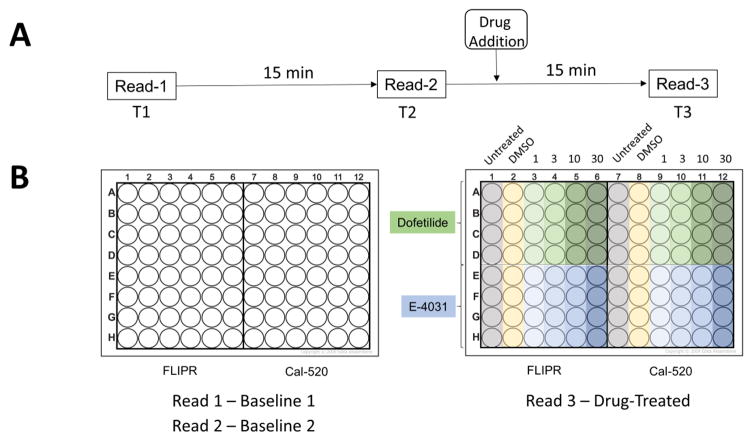
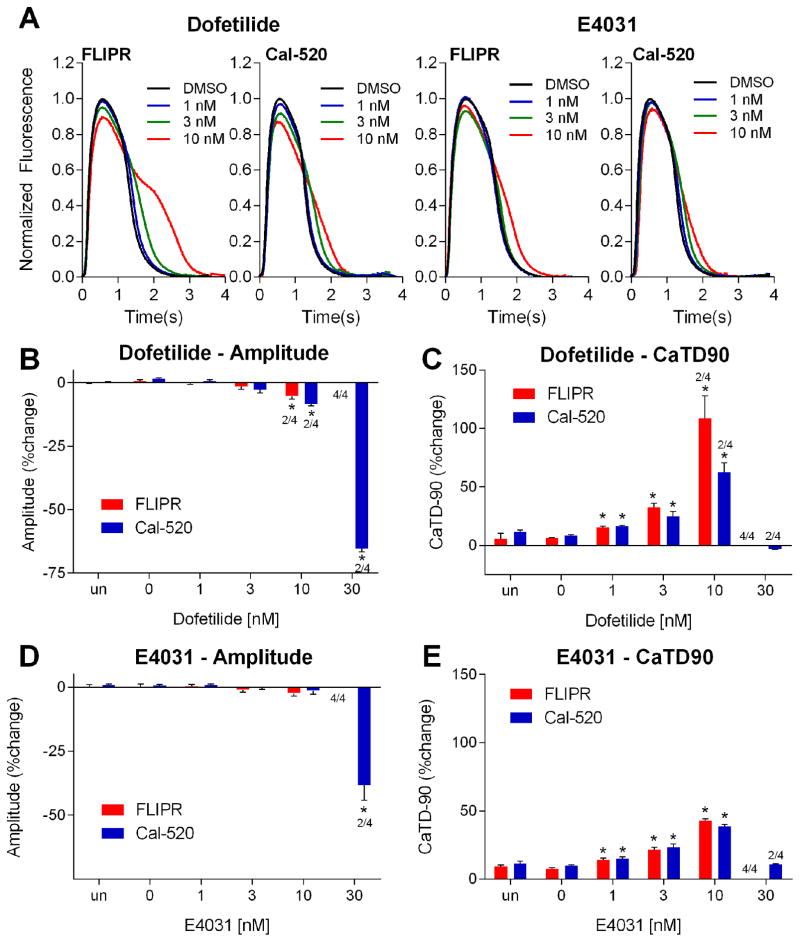
To assess the ability of FLIPR and Cal-520 calcium dyes to detect CaTs for drug-screens in iPSC-derived cardiomyocytes, we assayed cardiomyocytes that were seeded in 96-well plates and cultured for >7 days. One half (48 wells) of the 96-well plate was loaded with FLIPR dye and the other half (48 wells) were loaded with Cal-520 dye and treated with two class III antiarrhythmic drugs, Dofetilide and E-4031 (See Figure 1). They were chosen by their well-known effect of lengthening CaT-durations by blocking the rapid component of the delayed rectifier outward potassium current (IKr) which ultimately results in TdP and early-after depolarization (EAD) 9, 10. Ensemble averages of CaT traces (n = 8–10) after drug treatment showed increased duration with increasing drug concentrations (1nM – 10 nM) (Figure 2A) and EAD at the highest concentrations (10 – 30 nM) (See Figure S2). Dofetilide decreased CaT amplitudes significantly at higher concentrations (>3 nM) (Figure 2B). A similar decrease in amplitude was observed in analysis using E-4031 at >10 nM (Figure 2D). FLIPR was more sensitive than Cal-520 to detect elongation of CaT duration-90 (CaTD-90), especially those treated with dofetilide at 3 – 10 nM (Figure 2C, E).
Figure 1.
Experimental approach for the calcium assay and drug addition. A) Schematic sequence for the optical measurements (read 1,2,3) and drug addition. B) Plate map shows location of FLIPR and Cal-520 loaded wells in a single 96-well plate before and after adding varying concentrations of dofetilide and E-4031.
Figure 2.
Analysis of CaT profiles drug-treated iPSC-derived cardiomyocytes measured using FLIPR and Cal-520 calcium dye. FLIPR and Cal-520 loaded iPSC-derived cardiomyocytes treated with increasing concentrations of dofetilide and E4031 and analysis of (A) average traces, (B) and (D) amplitude, (C) and (E) CaT duration-90. Asterix (*) indicates a significant difference (P<0.05) from vehicle-treated groups by t-test analysis and a number above the bar indicates the fraction of the total number of wells where traces showed EAD and were not included in the analysis. Percent changes were computed by 100 X (Treated Read3-Pretreated Read2)/(Pretreated Read2) for each well. There was no significant difference between no treatment and vehicle treated groups.
To assess the sensitivities for detecting effects of compounds on amplitudes and durations of CaTs systematically for decision making, specifically with respect to optimal hit (or safety for toxicity) criteria, we analyzed the data using Monte-Carlo statistical simulation. Monte-Carlo bootstrapping was used to generate data sets from the extant untreated and solvent control data via resampling with replacement 11, 12. This was done for each metric (CaTD and Amplitude) and each dye (FLIPR and Cal-520). This approach was used primarily because it is free of a distribution assumption; while it is possible that standard statistical techniques could be applied to these data, possible skewness in the sampling distribution of values can be better accounted for using this approach (See Figure S1).
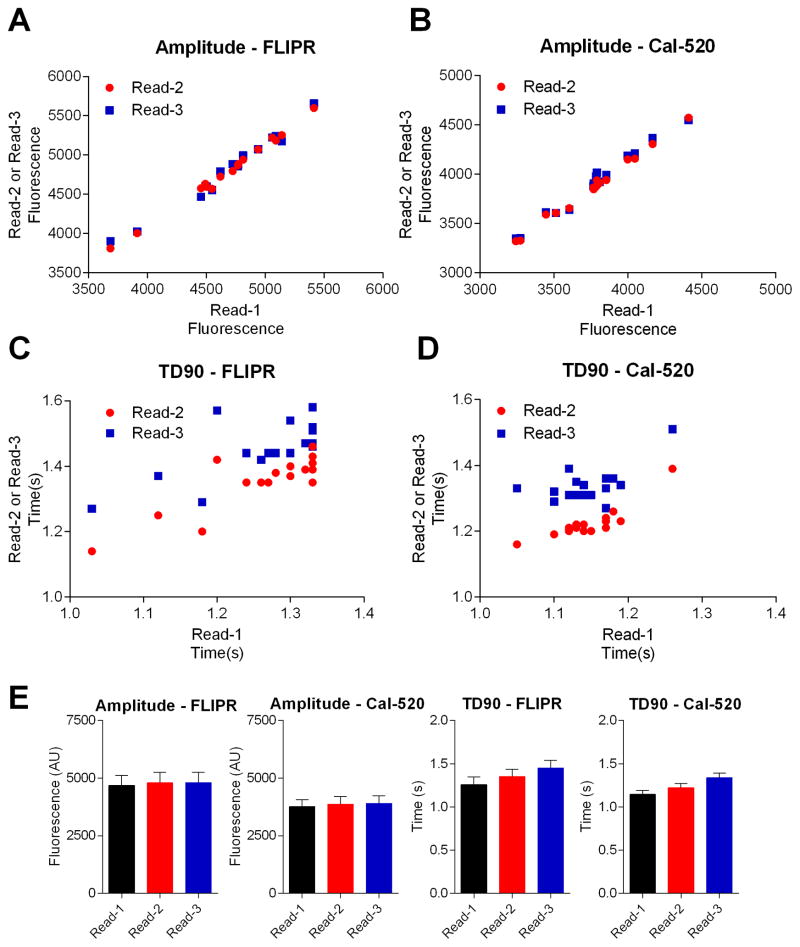
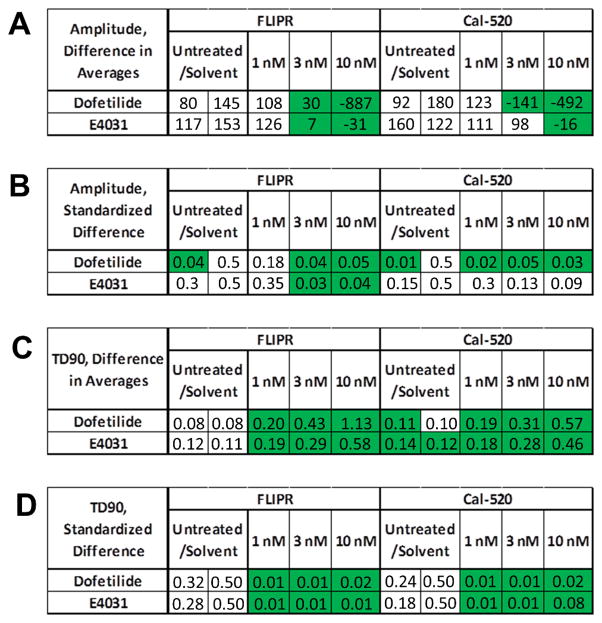
For amplitude, we noted a strong correspondence between the first untreated baseline measurement value and both the second baseline measurement and the post-treatment measurement of untreated wells (See Figure 3A–B), indicating that a comparison of post-treatment values could be done with the first pretreatment measurement without issues of additional temporal drift. Two methods were considered: Difference in average between two n=4 samples, and standardized difference (i.e., difference in average divided by pooled standard deviation). 10,000 pairs of n=4 data sets were generated using resampling with replacement of the first pretreatment measurement, and the resulting 10,000 metrics associated with these simulated data were calculated. Then, the 95th percentile of the set was determined, and compared to the actual value associated with treatment by dofetilide and E4031. The results, as shown in Figure 4A–B, indicate that a simple difference metric distinguished 3 – 10 nM of both compounds as hits, except for E4031 paired with Cal-520. There were no false positives. In contrast, using the standardized metric, while there was better demarcation for dofetilide at 1 nM with Cal-520, this method applied to Cal-520 was unable to detect as hits any E4031 values, and included dofetilide false positives. Thus, for amplitude simple differences in average appears to be a better method for determining screening hits with this approach.
Figure 3.
Stability of measurement reads from untreated/solvent treated control wells. A–D) The first untreated measurement (x-axis) was compared with the second untreated measurement (y-axis, red) and post-treatment measurement (y-axis, blue) of the untreated/solvent control wells for each dye and activity metric. E) Bar graphs corresponding to the data in (A–D).
Figure 4.
Results of Monte-Carlo hit-definition process, for each dye, compound, activity (amplitude and TD90) metric, and simulation (differences in averages and standardized differences) metric. Green indicates a hit; indicating potential well that are different from untreated/solvent control. Both compounds are specific inhibits of the delayed rectifier human ether-a-go-go-related gene (hERG) potassium channels, which is the rapid component of the delayed rectifier potassium current, known as IKr. The hERG inhibition is expected to elongate TD90 but does not have much effect on amplitude of calcium transients. The data representing the highest concentration of both compounds were excluded because of their irregular traces shown in Figure S2.
In contrast to amplitude, TD90 showed an increase by comparing the first baseline measurement and the second (see Figure 3C–D). Because of this, while we again considered the standardized and unstandardized metrics for TD90, we used the first pretreatment measurement as baseline for the second, and the second pretreatment measurement as baseline for the post-treatment measurement. Considering the roughly equally spaced time measurements, the underlying assumption here that the temporal drift of the numerical values is constant is appropriate. The results are shown in Figure 4C–D. For FLIPR, both methods performed equally well, differentiating both dofetilide and E4031 as hits even at the 1 nM dose. For Cal-520, the standardized method worked equally well, but the simple difference showed a strong false-positive problem. Thus, the standardized method appears to be the better approach for TD90, in contrast to amplitude.
Discussion
FLIPR Calcium 6 and Cal-520 AM are the latest generation of fluorescence calcium indicators currently on the market. FLIPR is designed as a no-wash dye with its quencher, but Cal-520 can also be used without washing. Additionally, both dyes retain fluorescence signal for several hours after a washing step. The fluorescence signal from FLIPR is larger after washing due to removal of the quencher. It may be favorable to use without the quencher in some cases, although accurate measurement of intracellular calcium levels may be better with the quencher on due to a reduction in non-specific fluorescence or auto-fluorescence 13. Cal-520 AM has the advantage of being widely used for many application such as detecting the activation of neurons and can be prepared at any concentration for the appropriate assay. Cal-520 AM does not have a fluorescence quencher; therefore some non-specific fluorescence may influence the measurements. In addition to Cal-520 AM, AM conjugated calcium indicators with different excitation and emission are available (Cal-590 AM, Cal-630 AM). While Cal-520 may have a similar affinity for calcium compared to previous generation dyes (Cal-520, Kd = 320nM; Fluo-3, Kd = 325nM; Fluo-4, Kd = 345nM) which can depend on testing conditions (i.e. temperature, medium), it has improved binding specificity for calcium ions, reduced autofluorescence, increased SNR, and has better localization to the cytosol. FLIPR Calcium 6 has a similar binding affinity to calcium (Kd = ~320nM) and also has improvements over previous generation indicators with a higher quantum yield, increased signal window, and is better retained inside the cell.
Dofetilide was reported to exhibit prolongation of the QTc interval at very low (3.4nM) total plasma concentrations 14. Results from this study indicate that FLIPR Calcium 6 and Cal-520 AM can detect elongation of CaTs with similar efficiency using human cardiomyocytes derived from iPSCs. However, our analysis detected elongations of CaT durations at 1nM of both compounds. This can originate from the inherent high sensitivity of human iPSC-derived cardiomyocytes to proarrhythmic compounds due to their immaturity 15. Nonetheless, the sensitivities and other differences between human iPSC derived cardiomyocytes and human hearts have been evaluated systematically and blindly 16. The iPSC derived cardiomyocytes used in this study are >15–20 days post-differentiation, and spontaneously beating. Researchers have shown that iPSC-derived cardiomyocytes that are >16 days post-differentiation start to segregate into cellular sub-types, and show pronounced sarcomeric structures 17. Young iPSC-derived cardiomyocytes show signs of maturation that can be increased by longer culturing and are still considered immature compared to adult heart cells, but nevertheless can be used in drug screening assays despite their limitations.
Cellular responses to two class III antiarrhythmic drugs, dofetilide and E-4031, were similar although increases in duration were slightly longer with FLIPR (Figure 2). These differences suggest that dyes for optical imaging may influence transient shape and is thus an important factor to consider when designing an assay for drug-screening. CaT amplitude was very stable across different measurements of the plate, in contrast to CaT duration which was highly dependent on the conditions of the plate (i.e. temperature, % CO2) and tended to increase during measurement, as also reported previously 18. This emphasizes the importance of maintaining the plate as closely as possible to incubation conditions during plate readings and designing an assay flow and analysis to avoid detecting false positives. For assessing drug-screening hit selection, Monte-Carlo simulation can be useful for determining the optimal hit criteria for analysis and accounting for non-normal distribution as well as sampling limitations 11, 12.
Conclusions
FLIPR Calcium 6 and Cal-520 AM are the latest and most advanced intracellular calcium indicators available. Both dyes are suitable dyes for detecting CaTs from iPSC-derived cardiomyocytes and reporting CaT shape and dynamics (amplitude, CaTD-90) with more than sufficient SNR. FLIPR Calcium 6 and Cal-520 AM are particularly well designed for high throughput applications and will greatly aid the development of cardiotoxicity assays for drug development. In summary, selection of optical reporter dye and analysis for hit-selection criteria are important factors for successful drug-screening.
Supplementary Material
Acknowledgments
This work has been supported in part by NIH grants, R43AG052220, R43AG109735, and R01HL109505.
Abbreviations
- AM
acetoxy methyl
- Ca2+
calcium
- CaT
calcium transient
- CaTD-90
calcium transient duration 90
- EAD
early-after depolarization
- FDSS
functional drug screening system
- FLIPR
fluorescence imaging plate reader
- HTP
high-throughput
- IKr
rapid component of the delayed rectifier potassium channel
- iPSC
induced pluripotent stem cell
- SNR
signal-to-noise ratio
- TdP
Torsade de Pointes
Footnotes
Conflict of interests
Research projects were conducted at the laboratory of InvivoSciences, Inc. that is a for-profit company.
References
- 1.Grynkiewicz G, Poenie M, Tsien RY. A new generation of Ca2+ indicators with greatly improved fluorescence properties. J Biol Chem. 1985 Mar 25;260(6):3440–3450. [PubMed] [Google Scholar]
- 2.Xin H, Wang Y, Todd MJ, Qi J, Minor LK. Evaluation of no-wash calcium assay kits: enabling tools for calcium mobilization. J Biomol Screen. 2007 Aug;12(5):705–714. doi: 10.1177/1087057107301522. [DOI] [PubMed] [Google Scholar]
- 3.Zhang Y, Kowal D, Kramer A, Dunlop J. Evaluation of FLIPR Calcium 3 Assay Kit--a new no-wash fluorescence calcium indicator reagent. J Biomol Screen. 2003 Oct;8(5):571–577. doi: 10.1177/1087057103257240. [DOI] [PubMed] [Google Scholar]
- 4.Vaduganathan M, Greene SJ, Ambrosy AP, Gheorghiade M, Butler J. The disconnect between phase II and phase III trials of drugs for heart failure. Nat Rev Cardiol. Feb;10(2):85–97. doi: 10.1038/nrcardio.2012.181. [DOI] [PubMed] [Google Scholar]
- 5.Albini A, Pennesi G, Donatelli F, Cammarota R, De Flora S, Noonan DM. Cardiotoxicity of anticancer drugs: the need for cardio-oncology and cardio-oncological prevention. J Natl Cancer Inst. Jan 6;102(1):14–25. doi: 10.1093/jnci/djp440. [DOI] [PMC free article] [PubMed] [Google Scholar]
- 6.Bers DM. Cardiac excitation-contraction coupling. Nature. 2002 Jan 10;415(6868):198–205. doi: 10.1038/415198a. [DOI] [PubMed] [Google Scholar]
- 7.Zeng H, Roman MI, Lis E, Lagrutta A, Sannajust F. Use of FDSS/muCell imaging platform for preclinical cardiac electrophysiology safety screening of compounds in human induced pluripotent stem cell-derived cardiomyocytes. J Pharmacol Toxicol Methods. Sep-Oct;81:217–222. doi: 10.1016/j.vascn.2016.05.009. [DOI] [PubMed] [Google Scholar]
- 8.Lian X, Hsiao C, Wilson G, et al. Robust cardiomyocyte differentiation from human pluripotent stem cells via temporal modulation of canonical Wnt signaling. Proc Natl Acad Sci U S A. Jul 3;109(27):E1848–1857. doi: 10.1073/pnas.1200250109. [DOI] [PMC free article] [PubMed] [Google Scholar]
- 9.Sanguinetti MC. Modulation of potassium channels by antiarrhythmic and antihypertensive drugs. Hypertension. 1992 Mar;19(3):228–236. doi: 10.1161/01.hyp.19.3.228. [DOI] [PubMed] [Google Scholar]
- 10.Redfern WS, Carlsson L, Davis AS, et al. Relationships between preclinical cardiac electrophysiology, clinical QT interval prolongation and torsade de pointes for a broad range of drugs: evidence for a provisional safety margin in drug development. Cardiovasc Res. 2003 Apr 1;58(1):32–45. doi: 10.1016/s0008-6363(02)00846-5. [DOI] [PubMed] [Google Scholar]
- 11.Ilouga PE, Hesterkamp T. On the prediction of statistical parameters in high-throughput screening using resampling techniques. J Biomol Screen. Jul;17(6):705–712. doi: 10.1177/1087057112441623. [DOI] [PubMed] [Google Scholar]
- 12.Tom E, Schulman KA. Mathematical models in decision analysis. Infect Control Hosp Epidemiol. 1997 Jan;18(1):65–73. doi: 10.1086/647503. [DOI] [PubMed] [Google Scholar]
- 13.Marshall IC, Boyfield I, McNulty S. Ratiometric Ca(2)+ measurements using the FlexStation(R) Scanning Fluorometer. Methods Mol Biol. 2005;312:119–124. [PubMed] [Google Scholar]
- 14.Gintant GA, Su Z, Martin RL, Cox BF. Utility of hERG Assays as Surrogate Markers of Delayed Cardiac Repolarization and QT Safety. Toxicologic Pathology. 2006 Jan 1;34(1):81–90. doi: 10.1080/01926230500431376. [DOI] [PubMed] [Google Scholar]
- 15.Robertson C, Tran DD, George SC. Concise Review: Maturation Phases of Human Pluripotent Stem Cell-Derived Cardiomyocytes. STEM CELLS. 2013;31(5):829–837. doi: 10.1002/stem.1331. [DOI] [PMC free article] [PubMed] [Google Scholar]
- 16.Gintant G, Sager PT, Stockbridge N. Evolution of strategies to improve preclinical cardiac safety testing. Nat Rev Drug Discov. 2016;15(7):457–471. doi: 10.1038/nrd.2015.34. 07//print. [DOI] [PubMed] [Google Scholar]
- 17.Dell’Era P, Benzoni P, Crescini E, et al. Cardiac disease modeling using induced pluripotent stem cell-derived human cardiomyocytes. World J Stem Cells. Mar 26;7(2):329–342. doi: 10.4252/wjsc.v7.i2.329. [DOI] [PMC free article] [PubMed] [Google Scholar]
- 18.Bedut S, Seminatore Nole C, Lamamy V, et al. High-throughput drug profiling with voltage and calcium-sensitive fluorescent probes in human iPSC-derived cardiomyocytes. American Journal of Physiology - Heart and Circulatory Physiology. 2016 doi: 10.1152/ajpheart.00793.2015. [DOI] [PubMed] [Google Scholar]
Associated Data
This section collects any data citations, data availability statements, or supplementary materials included in this article.


