MR imaging signal characteristics are significantly associated with tissue composition measurements derived at digital histopathologic analysis.
Abstract
Purpose
To correlate multiparametric magnetic resonance (MR) imaging and quantitative digital histopathologic analysis (DHA) of the prostate.
Materials and Methods
This retrospective study was approved by the local institutional review board and was HIPAA compliant. Forty patients (median age, 60 years; age range, 44–71 years) who underwent prostate MR imaging consisting of T2-weighted and diffusion-weighted (DW) MR imaging along with subsequent robot-assisted radical prostatectomy gave informed consent to be included. Whole-mount tissue specimens were obtained with a patient-specific mold, and DHA was performed to assess the lumen, epithelium, stroma, and epithelial nucleus. These DHA images were registered with MR images and were correlated on a per-voxel basis. The relationship between MR imaging and DHA was assessed by using a linear mixed-effects model and the Pearson correlation coefficient.
Results
T2-weighted MR imaging, apparent diffusion coefficient (ADC) of DW imaging, and high-b-value DW imaging were significantly related to specific DHA parameters (P < .01). For instance, lumen density (ie, the percentage area of tissue components) was associated with T2-weighted MR imaging (slope = 0.36 ± 0.05 [standard error], γ = 0.35), ADC (slope = 0.47 ± 0.05, γ = 0.50), and high-b-value DW imaging (slope = −0.44 ± 0.05, γ = −0.44). Differences between regions harboring benign tissue and those harboring malignant tissue were observed at MR imaging and DHA (P < .01). Gleason score was significantly associated with MR imaging and DHA parameters (P < .05). For example, it was positively related to high-b-value DW imaging (slope = 0.21 ± 0.16, γ = 0.18) and negatively related to lumen density (slope = −0.19 ± 0.18, γ = −0.35).
Conclusion
Overall, significant associations were observed between MR imaging and DHA, regardless of prostate anatomy.
© RSNA, 2017
Introduction
Multiparametric (MP) magnetic resonance (MR) imaging incorporating T2-weighted, diffusion-weighted (DW), and dynamic contrast material–enhanced sequences permits noninvasive visualization of suspicious lesions in the prostate and is capable of improving the detection and localization of clinically important cancers (1,2). However, there are limitations to MR imaging. For example, benign abnormalities, such as prostatitis, scarring, high-grade prostatic intraepithelial neoplasia, and hyperplasia, mimic the characteristics of prostate cancer on MR images and thus reduce specificity (3–6). Currently, prostate cancers are assigned a Gleason score representing the aggressiveness of the lesion. This assessment is qualitative and is subject to interobserver variation. Moreover, because the entire lesion is labeled with one Gleason score, this cannot fully account for tumor heterogeneity. Digital histopathology, however, enables reproducible and quantitative measurement of tissue microstructures on a voxel-by-voxel basis (7,8). For example, structural alterations of glands and cells (9,10), as well as number and size (or density) of cells and nuclei (9,11,12), are readily measured with computerized image-processing algorithms. These quantitative measures are useful not only in improving cancer diagnosis and prognosis but also in providing an index of tumor heterogeneity that is not possible with conventional Gleason scoring (9,10,12). Thus, digital histopathologic analysis (DHA) is well suited to correlation with MP MR imaging on a voxelwise basis once DHA is spatially coregistered to MR imaging.
The relationship between MR imaging and prostate histopathology has been previously investigated, and T2-weighted MR imaging has been shown to be related to tissue density (3,4,13). Apparent diffusion coefficient (ADC) of DW imaging is inversely related to nuclear density of cells (13–16). The density of cytoplasm, stroma, and lumen has also been correlated with T2-weighted, DW, and dynamic contrast-enhanced MR imaging (13). Moreover, T2-weighted MR imaging (16) and ADC (17) are inversely related to Gleason score. Tissue compositions (epithelium, stroma, and lumen) are related to Gleason score (18). However, these correlations are generally supervised by skilled pathologists and radiologists who identify specific regions of interest (ROIs), thereby introducing potential biases. Moreover, parameters such as tissue or cellular density are generally measured with simple color space conversion and thresholding, which are likely to be sensitive to staining variability and artifacts.
In this study, we investigated the relationship between MP MR imaging and DHA of the prostate in a systematic fashion. We used machine learning techniques to conduct DHA of the prostate (ie, measuring tissue compositions that are capable of characterizing tissues) (9,12). A customized specimen mold and image registration were adopted to spatially register DHA with MP MR imaging. The purpose of this study was to assess for possible correlations between MP MR imaging and DHA of the prostate.
Materials and Methods
Three authors (B.J.W., P.A.P., P.L.C.) have a cooperative research and development agreement with Philips Healthcare (Best, the Netherlands). Philips Healthcare holds intellectual property and has financial interests in the technology presented in this study.
Patient Population
This retrospective study was approved by the local institutional review board and was compliant with the Health Insurance Portability and Accountability Act. From August 2013 to December 2014, 316 patients underwent multiparametric MR imaging. Among these patients, 74 underwent robot-assisted radical prostatectomy. A total of 299 tissue block sections (four to eight sections per patient) from 48 patients were digitized and included in this study. All patients gave informed consent and had biopsy-proven adenocarcinoma of the prostate. Eight patients had been included in a previous study (19). This study extends the previous study by including 40 more patients and high-b-value DW imaging and by correlating DHA and MP MR imaging on a region and voxel basis and with respect to Gleason score.
MR Imaging Protocol
T2-weighted and DW MR imaging were performed with a 3-T MR imager (Achieva TX; Philips Healthcare) using a cardiac coil (In Vivo; Philips Healthcare, Gainesville, Fla) and an endorectal coil (BPX 30; Medrad, Indianola, Pa). T2-weighted MR imaging has a resolution of 0.27 × 0.27 mm. ADC maps were calculated with monoexponential fitting per voxel of DW images at various b values. High-b-value DW images were acquired with a b value of 2000 sec/mm2. T2-weighted and high-b-value DW MR imaging are normalized to reduce MR imaging signal inhomogeneity between MR imaging sections and patients per MR imaging section. See Appendix E1 (online) for details.
Tissue Specimen Preparation
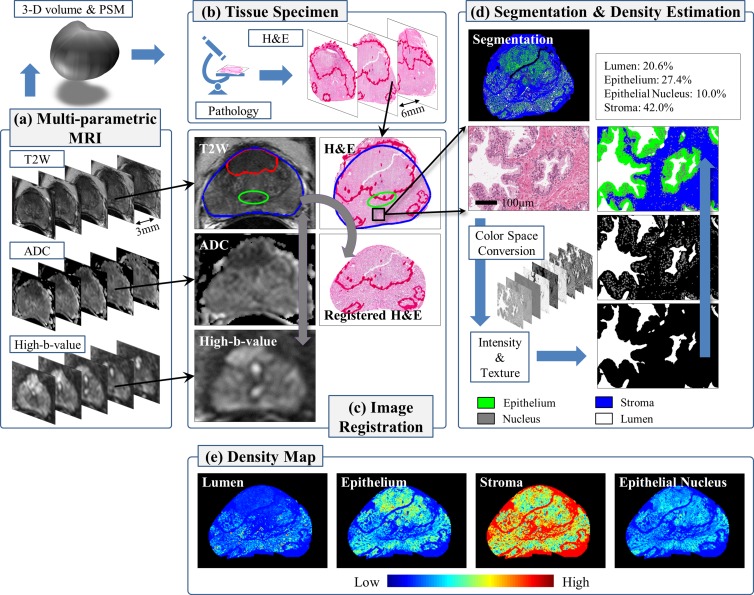
The patient-specific mold (PSM) was created from the presurgical MR images from each patient and by using three-dimensional computer-aided design software (Dassault Systems SolidWorks, Waltham, Mass) and a three-dimensional printer (Dimension Elite 3D Printer; Stratasys, Eden Prairie, Minn) (20). In the PSM, sectioning slots are positioned to match the location of the MR imaging sections (Fig 1). After prostatectomy, whole-mount tissue slices were cut in the mold and were stained with hematoxylin-eosin for histopathologic evaluation. Each tissue slice was digitized on a standard bright-field optical microscope (Aperio Technologies, Vista, Calif) at a magnification of ×20 (resolution of 0.504 × 0.504 μm). See Appendix E2 (online) for details.
Figure 1:
Multiparametric MR imaging and tissue specimen image processing. (a) Presurgical MR images are acquired and used to construct a three-dimensional (3-D) volume of the prostate and a PSM. (b) Whole-mount tissue specimens are cut in the mold and stained with hemotoxylin-eosin (H&E) for histopathologic evaluation. (c) Image registration is performed (T2-weighted MR images to DW images, MR images to digitized tissue specimen images). (d) Tissue specimen images are segmented into four tissue components. By using segmentation, the tissue component densities are estimated per MR imaging voxel and then (e) whole-density maps are computed.
Image Registration
The PSM helps orient the tissue specimen and maintain the shape of the prostate, but tissue preparation (eg, fixation) introduces deformation. The endorectal coil also deforms the prostate during MR imaging (absent in the specimen). In-house semiautomated registration software, implemented in OncoNav software (Center for Interventional Oncology, National Institutes of Health, Bethesda, Md), enables accurate registration based on the outer contours and internal fiducial structures within the prostate (Fig 1). The registration result is visually inspected to ensure that the overall shape and anatomic landmarks (urethra, ejaculatory ducts, benign prostatic hyperplasia nodules) at histology match the identified regions (peripheral zone [PZ], transition zone [TZ], and tumor). Also, ADC and high-b-value DW images undergo rigid registration with T2-weighted MR images using the MR imaging coordinate information (21). See Appendix E3 (online) for details.
Tissue Segmentation and Density Map
We convert each digitized specimen image into three different color forms: histogram equalization, HSV (H, hue; S, saturation; V, value), and La*b* (L, lightness; a*, between red-magenta and green; b*, between yellow and blue). Intensity and texture features are extracted at seven different scales and are integrated in a multiview boosting scheme to construct classifiers (lumen vs nonlumen, nuclei vs nonnuclei, and epithelium vs stroma). By using these classifiers, a tissue specimen image is segmented into lumen, nucleus, epithelium, and stroma in a cascaded fashion (Fig 1). A threshold value of 0.4–0.6 is used for classifier output, and the size and shape of segments are examined to identify and remove artifacts. See Appendix E4 (online) for details.
The density (ie, percentage area of tissue components [lumen, nuclei, epithelium, and stroma]) per voxel is estimated by drawing a window of 540 × 540 pixels (approximately equal to an MR imaging voxel) around the location and calculating the ratio of the size of the tissue component to the size of the window (Fig 1).
ROI Analysis
By using the PSM, tissue specimens are sliced at the same location as the MR imaging sections. For each MR imaging section and tissue specimen image pair, radiologists identify benign regions and tumors in the PZ and TZ based on prior biopsy results. Two radiologists (B.T., P.L.C.; 7 and 14 years of experience, respectively) identified tumors in consensus according to criteria described elsewhere (22–24). A third radiologist (S.S., 2 years of experience) contoured each tumor and benign region by following the same criteria. Two pathologists (M.M., V.M.; 27 and 2 years of experience, respectively) delineated tumor regions on the tissue specimen image and assigned a Gleason score (6) in consensus.
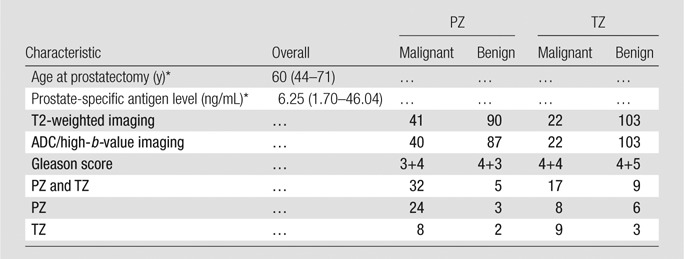
The PZ and TZ were divided into right and left sections (four ROIs per section), thereby avoiding the urethra and ejaculatory ducts. PZ, TZ, and tumor ROIs were transferred to the corresponding locations on the tissue specimen image (referred to as Tissue Specimen Preperation section) after image registration and were further adjusted to avoid any distortion or artifacts (cut, tear, etc) due to surgery or tissue preparation. Any ROI that contained more than 50% artifacts was discarded. PZ and TZ ROIs that included the tumor (identified by either radiologists or pathologists) were excluded. The tumor ROIs were included only when both radiologists and pathologists independently identified them (33% interobserver agreement). Patients who did not have corresponding benign PZ and TZ or tumor ROIs were excluded. In this manner, eight patients were excluded. A total of 256 ROIs from 128 tissue sections (40 patients) were selected. The characteristics of these patients are presented in Table 1.
Table 1.
Characteristics of Patient Cohort
Note.—Unless otherwise indicated, data are numbers of patients.
*Data are median, and data in parentheses are the range.
In region-based correlations, MR imaging signal intensities (normalized T2-weighted MR imaging and high-b-value DW imaging and ADC) and the four tissue component densities were averaged per ROI and compared. For voxel-based correlation analysis, the MR imaging signal intensities and the four tissue component densities were collected from all ROIs and compared. We also drew a w × w rectangular window (w = 1, 3, 5, or 7 mm) around each MR imaging voxel, averaged MR imaging signal intensities and the four tissue component densities within the window, and conducted the correlation analysis.
Statistical Analyses
Data analyses were performed by using R software (version 3.1.2; www.r-project.org). The relationship between MR imaging and tissue compositions was examined by using (a) linear mixed-effects models and adding the patient as a random factor to account for patient variability and (b) the Pearson correlation coefficient (γ). MR imaging signal intensity and tissue component density were normalized by z score transformation to standardize the slopes of the mixed-effects models. The significance of the slopes was tested against zero. Statistical significance of MR imaging signal intensity and tissue component density in discriminating different histopathologic areas was determined with the Wilcoxon rank-sum test. A significance level of .05 was used for statistical testing.
Results
MR Imaging Correlates with Tissue Component Density
MP MR images and digitized specimen images from 40 patients were registered and processed to generate tissue component density maps. We identified and examined 256 ROIs (cancer group, 41 PZ [Gleason score 3+4, n = 24; Gleason score 4+3, n = 3; Gleason score 4+4, n = 8; Gleason score 4+5, n = 6] and 22 TZ [Gleason score 3+4, n = 8; Gleason score 4+3, n = 2; Gleason score, 4+4, n = 9; Gleason score 4+5, n = 3] ROIs; benign group, 90 PZ and 103 TZ ROIs). One PZ cancer and three PZ benign ROIs were excluded because either ADC or high-b-value DW images were not available.
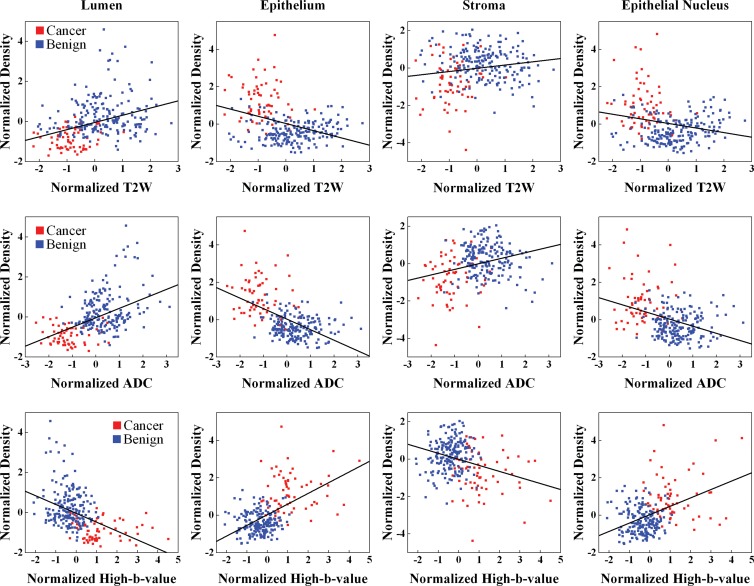
At region-based analysis fitting linear mixed-effects models for all ROIs (PZ and TZ ROIs), significant relationships between MR imaging and tissue components were observed (Table 2, Fig 2). Normalized T2-weighted MR imaging signal intensity and ADC were positively related to lumen and stroma density and were negatively related to epithelium and epithelial nucleus density (P < .01). Normalized high-b-value DW signal intensity was negatively related to lumen and stroma density and was positively related to epithelium and epithelial nucleus density (P < .01).
Table 2.
Relationship between MR Imaging and Tissue Component Density in Region-based Analysis
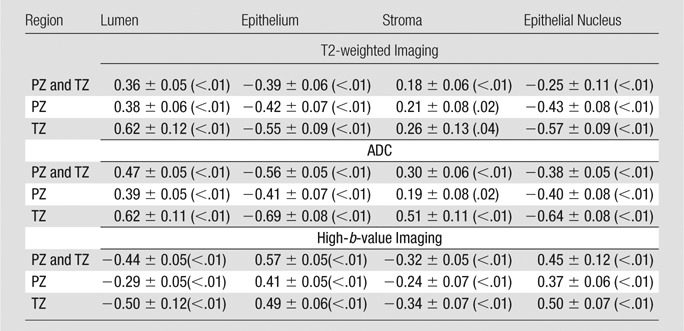
Note.—Data are slope ± standard error, with P value in parentheses.
Figure 2:
Graphs show MR imaging versus tissue component density in the whole prostate. Regression lines (black) are plotted for T2-weighted MR imaging (top row), ADC mapping (middle row), and high-b-value DW imaging (bottom row).
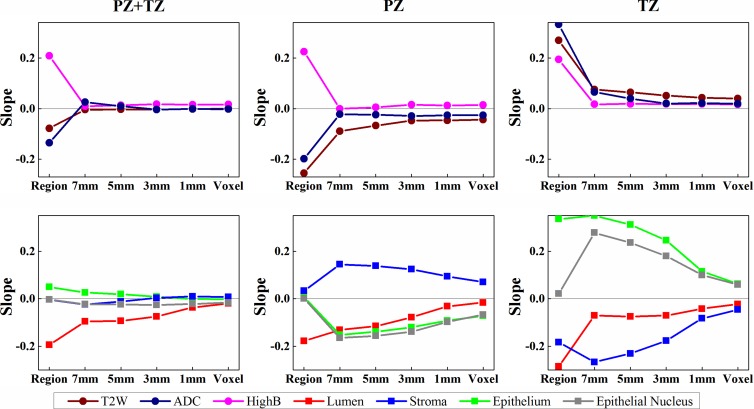
At voxel-based analysis comparing MR imaging and tissue component density, the correlative relationships were in accord with region-based analysis except for stroma. For example, normalized T2-weighted MR imaging signal intensity and stroma density were negatively related, whereas at region-based analysis there was a positive relationship with stroma density (Fig 3). When we averaged MR imaging signal intensity and tissue component density within a window around an MR imaging voxel, the same trends were observed. As window size increased, stronger correlations were observed (Fig 3; Figs E3, E4 [online]).
Figure 3:
Graphs show relationship between MR imaging and tissue component density in region- and voxel-based analysis. Slopes of the linear mixed-effects models are computed for the whole prostate. Region and voxel denote the slopes for region- and voxel-based analyses, respectively. Increasing the size of a window (1, 3, 5, or 7 mm) yields a stronger association. T2W = T2 weighted.
For both region- and voxel-based analyses, the sign of the slopes was consistent (except in the case of stroma) for both PZ and TZ ROIs (Table 2; Figs E1–E3 [online]) (ie, the relationship between MR imaging and tissue component densities was independent of anatomic regions). When calculating correlation coefficients for all ROIs together and for PZ and TZ ROIs alone, similar trends were found with both region- and voxel-based analyses (Fig E4 [online], Table E2 [online]).
MR Imaging and DHA Correlation Varied with Histopathologic Diagnosis
MR imaging and DHA results were substantially different for ROIs containing benign tissue and those containing malignant tissue. Normalized mean T2-weighted MR imaging signal intensity, ADC, and density of lumen and stroma were significantly lower in malignant ROIs (0.48 ± 0.14 [standard deviation], [1120 ± 260.10] × 10−6 mm2/sec, 0.08% ± 0.09, and 0.51% ± 0.26, respectively) than in benign ROIs (0.66 ± 0.22, [1676 ± 385.20] × 10−6 mm2/sec, 0.20% ± 0.25, and 0.65% ± 0.29, respectively) (P < .01). Conversely, cancer ROIs had significantly higher mean normalized high-b-value DW signal intensity and epithelium and epithelial nucleus density (0.98 ± 0.22, 0.42% ± 0.24, and 0.10% ± 0.06, respectively) than did benign ROIs (0.71 ± 0.20, 0.16% ± 0.16, and 0.05% ± 0.05, respectively) (P < .01). When we compared MR imaging and DHA per anatomic region, similar significant differences between cancer and benign ROIs were found for all parameters (Figs E5, E6 [online]).
MR imaging and DHA correlated with Gleason score (Table 3, Table E3 [online], Fig 4). When we considered all ROIs (PZ and TZ tumor ROIs), normalized T2-weighted MR imaging signal intensity and ADC were not significantly related to Gleason score (P > .05). Gleason score was positively related to high-b-value DW imaging (Table 3) (slope = 0.21, P = .02) and negatively related to lumen density (Table 3) (slope = −0.19, P = .04). However, no significant relationships were found for stroma, epithelium, or epithelial nucleus density (P > .05). When correlating MR imaging with Gleason score; however, there were regional differences. For instance, normalized T2-weighted MR imaging and ADC were negatively associated with Gleason score in the PZ but were positively associated with Gleason score in the TZ (Table 3) (slope for T2-weighted imaging, −0.26 vs 0.27; slope for ADC, −0.20 vs 0.33). Only normalized T2-weighted MR imaging was significantly correlated with Gleason score in the TZ (Table E3 [online]) (γ = 0.51, P = .02).
Table 3.
Gleason Score versus MR Imaging and Tissue Component Density

Note.—Data are slope ± standard error, with P value in parentheses.
Figure 4:
Graphs show relationship of Gleason score with MR imaging and tissue component density in region- and voxel-based analyses. Slopes of the linear mixed-effects models are computed for MR imaging (top row) and tissue composition (bottom row). Region and voxel denote the slopes for region- and voxel-based analyses, respectively. Increasing the size of a window (1, 3, 5, or 7 mm) yields a stronger association. T2-weighted MR imaging, ADC values, and the density of epithelium and epithelial nucleus show regional differences in association with the Gleason score.
On a per-voxel basis, association of normalized high-b-value DW signal intensity and lumen density with Gleason score was (mostly) consistent between the PZ and TZ (Fig 4). Normalized T2-weighted MR imaging signal intensity, ADC, and epithelium and epithelial nucleus density showed differing associations with Gleason score depending on whether the lesion was within the PZ or TZ. An increase in the size of the window drawn around an MR imaging voxel increased the magnitude of the slopes. Similar observations were shown in region- and voxel-based analyses by using the correlation coefficients (Fig E7, Table E3 [online]).
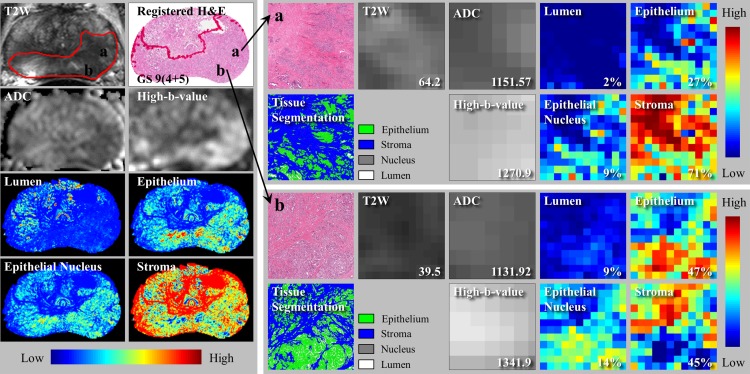
Our approach permitted a higher-resolution comparison of MR imaging and DHA. A good example is shown in Figure 5. The tumor was high risk (Gleason score, 9 [4+5]; prostate-specific antigen level, 46.04 ng/mL) and occupied much of the PZ. Although pathologists and radiologists identified one large tumor, it was possible to analyze the tumor for heterogeneity. Within the tumor, we observed higher epithelium density (27% vs 47%), lower T2-weighted signal intensity (64.2 msec vs 39.5 msec) and ADC (1151.57 × 10−6 mm2/sec vs 1131.92 × 10−6 mm2/sec), and higher normalized high-b-value DW signal intensity (1270.9 × 10−6 mm2/sec vs 1341.9 × 10−6 mm2/sec), which were consistent with a high-grade cancer.
Figure 5:
Local characteristics of MR imaging and tissue compositions. Left: Multiparametric MR images, tissue specimen images, and four-density maps. Right: Two local regions in a tumor. Different MR imaging signal intensities and tissue component densities are observed. Numbers and percentages (bottom right corner of small panels) denote MR imaging signal intensity and percentage area of tissue components, respectively.
Discussion
Our results are consistent with those of previous reports. However, previous studies mainly focused on the PZ and were based on region-to-region comparisons. Relatively large ROIs were selected; therefore, signal intensity and tissue component density were averaged over a relatively large area. Our study differs from previous studies in that it was not limited to a particular anatomic region. Benign and malignant regions in the PZ and TZ were analyzed. The relationships between MR imaging and DHA were retained for the whole prostate (PZ and TZ) and in each zone individually. This suggests that MR imaging signal characteristics and histologic components are associated with each other regardless of their anatomic location.
In the region-based analysis, the averaging effect of the larger ROI may have suppressed heterogeneity within a region and reduced distinctive MR imaging associations with specific tissue component density measurements. We anticipate that the higher-resolution comparison of MR imaging and DHA can be used to train computer-aided design systems that enable us to prospectively identify regions within the tumor that harbor high-grade disease. This will facilitate more appropriate cancer management and treatment by enabling us to better characterize tumor aggressiveness and reduce unnecessary or redundant biopsies.
Although PSM and image registration were optimized to maintain the shape of the prostate and to correct for deformation, registration errors still may have occurred. This may have significantly affected the voxel-based analysis. Averaging MR imaging signal intensities and tissue component densities within a window resulted in stronger correlations. The averaging effect may partially overcome errors in registration and localization. Naturally, as the window becomes larger, the chance of missing a small area with particularly aggressive features (eg, an infiltrative tumor may not be seen on MR images) and including heterogeneous regions increases. The 3–5-mm window may be optimal for reliably relating MR imaging to DHA while benefiting from the voxelwise correspondence of our approach. This observation may also be applicable to other computational methods that use MR imaging (eg, computer-aided design tools), in which a window is often drawn around an MR imaging voxel to compute imaging features (21,25).
The relationship between MR imaging and stroma density was inconsistent, especially for the TZ. Stroma is heterogeneous and composed of smooth muscle, collagen, fibroblasts, and other components. The composition and volume of the stromal extracellular matrix could vary depending on the tissue type or state; for example, stroma is much denser in the TZ than in the PZ. In particular, the size of the extracellular space influences the content and motion of water molecules, to which both T2-weighted MR imaging and DW are sensitive. Thus, the association between stroma and MR imaging should be further studied in regard to stromal subcomponents.
Gleason score was not strongly associated with MR imaging signal intensity or tissue composition. This finding is not unexpected because Gleason scoring is obtained at the microscopic scale, whereas MR imaging is obtained at the macroscopic scale. Gleason scoring is based on architectural alterations, not merely tissue compositions. Previous reports have been mixed; Gleason score was inversely related to T2-weighted MR imaging (16,18) and ADC (17) in the PZ in some studies. Other studies have shown weak correlation of ADC (14,15) and cellular density to Gleason score (15). We found differences in the association of Gleason score and MR imaging findings depending on tumor location, suggesting that the PZ and TZ should be analyzed separately with regard to Gleason score. T2-weighted MR imaging is the best method with which to characterize tumors in the TZ. This idea is also used in the recent Prostate Imaging Reporting and Data System, version 2, guidelines (24) in which T2-weighted MR imaging is the dominant sequence for TZ interpretation. Moreover, tissue compositions were significantly related to Gleason score. These observations suggest that both MR imaging and DHA offer potential in the prediction of clinically important cancers. DHA in particular is capable of being used to measure various tissue characteristics that are related to cancer progression (12). The strong association between MR imaging and tissue compositions, as shown in this study, implies that MR imaging could benefit from DHA, leading to an improved prognostic importance of MR imaging in prostate cancer. However, the relationship between DHA and MR imaging signal needs to be further investigated. In addition, correlation with texture characteristics, which has been shown to be effective in the diagnosis of cancers from MR images (25) and tissue specimens (10), may yield further insights into prostate cancer.
This study had several limitations. Image registration (T2-weighted to DW imaging and MR imaging to DHA) is subject to error and is undoubtedly a factor in reducing the strength of associations. The fragmented tissues or artifacts inside the prostate interfere with registration. We were not able to quantitatively assess registration accuracy due to the lack of ground truth. Anatomic landmarks (eg, urethra and benign prostatic hyperplasia nodule) may be used for this purpose (23,24,26); however, the exact corresponding positions are often difficult to establish. Also, only T2-weighted and DW sequences were considered in this study. Other MR imaging techniques, such as dynamic contrast-enhanced MR imaging or quantitative T2 maps, can be incorporated to extend our study. Only tumor ROIs identified by radiologists and pathologists were included in this study, potentially introducing biases to the correlation study. Additionally, the number of tumors with a Gleason score 4+3 or 4+5 pattern in the TZ was relatively small. Tumors with a Gleason score 3+3 pattern are missing. A larger study will overcome this limitation.
In conclusion, MR imaging signal characteristics are significantly associated with tissue composition measurements derived with DHA. The deeper understanding of the relationship between MR imaging and DHA and their relationship to cancer aggressiveness will permit detailed histologic and prognostic characterization of prostate cancer at MR imaging.
Advances in Knowledge
■ T2-weighted MR imaging and apparent diffusion coefficient (ADC) maps are positively related to lumen and stroma density (P < .01) and negatively related to epithelium and epithelial nucleus density (P < .01), whereas high-b-value diffusion-weighted (DW) MR imaging shows an inverse relationship with these digital histopathologic parameters (P < .01).
■ Both MR imaging signals (T2-weightd MR imaging, ADC maps, high-b-value DW imaging) and digital histopathologic parameters (lumen, epithelium, stroma, and epithelial nucleus) are significantly different between cancerous and benign regions in the peripheral zone (PZ) and transition zone (TZ).
■ Gleason score is significantly related to MR imaging signals and digital histopathologic parameters; there is a positive relationship with high-b-value DW imaging (P = .02) and a negative relationship with lumen density (P = .04) in the whole prostate and a positive relationship with T2-weighted MR imaging (P = .02) in the TZ.
Implications for Patient Care
■ Multiparametric MR imaging and quantitative digital histopathologic parameters (lumen and epithelium) can be used to assess the aggressiveness of prostate cancer.
■ The aggressiveness of tumors in the PZ can be assessed with T2-weighted and DW imaging, including ADC mapping and high-b-value DW imaging.
■ Tumors in the TZ can be better characterized with T2-weighted MR imaging than with DW imaging.
APPENDIX
SUPPLEMENTAL FIGURES
Received April 19, 2016; revision requested June 10; revision received January 19, 2017; accepted January 25; final version accepted March 8.
Supported by Intramural Research Program of the National Institutes of Health and the National Institutes of Health Center for Interventional Oncology (ZID BC011242-08).
Disclosures of Conflicts of Interest: J.T.K. disclosed no relevant relationships. S.S. disclosed no relevant relationships. S.X. disclosed no relevant relationships. B.T. disclosed no relevant relationships. P.L.C. Activities related to the present article: has a cooperative research development agreement with Philips and InVivo. Activities not related to the present article: holds multiple patents in the field of fusion imaging, with devices and systems for prostate fusion and navigation licensed to Philips and InVivo. Other relationships: disclosed no relevant relationships. P.A.P. Activities related to the present article: disclosed no relevant relationships. Activities not related to the present article: holds a patent related to prostate imaging. Other relationships: disclosed no relevant relationships. V.M. disclosed no relevant relationships. M.M. disclosed no relevant relationships. B.J.W. Activities related to the present article: has a cooperative research development agreement with Philips and InVivo. Activities not related to the present article: holds multiple patents in the field of fusion imaging, with devices and systems for prostate fusion and navigation licensed to Philips and InVivo. Other relationships: disclosed no relevant relationships.
Abbreviations:
- ADC
- apparent diffusion coefficient
- DHA
- digital histopathologic analysis
- DW
- diffusion weighted
- MP
- multiparametric
- PSM
- patient-specific mold
- PZ
- peripheral zone
- ROI
- region of interest
- TZ
- transition zone
References
- 1.Turkbey B, Mani H, Shah V, et al. Multiparametric 3T prostate magnetic resonance imaging to detect cancer: histopathological correlation using prostatectomy specimens processed in customized magnetic resonance imaging based molds. J Urol 2011;186(5):1818–1824. [DOI] [PMC free article] [PubMed] [Google Scholar]
- 2.Habchi H, Bratan F, Paye A, et al. Value of prostate multiparametric magnetic resonance imaging for predicting biopsy results in first or repeat biopsy. Clin Radiol 2014;69(3):e120–e128. [DOI] [PubMed] [Google Scholar]
- 3.Schiebler ML, Tomaszewski JE, Bezzi M, et al. Prostatic carcinoma and benign prostatic hyperplasia: correlation of high-resolution MR and histopathologic findings. Radiology 1989;172(1):131–137. [DOI] [PubMed] [Google Scholar]
- 4.Quint LE, Van Erp JS, Bland PH, et al. Prostate cancer: correlation of MR images with tissue optical density at pathologic examination. Radiology 1991;179(3):837–842. [DOI] [PubMed] [Google Scholar]
- 5.Hemmer J, Kreidler J. Flow cytometric DNA ploidy analysis of squamous cell carcinoma of the oral cavity. comparison with clinical staging and histologic grading. Cancer 1990;66(2):317–320. [DOI] [PubMed] [Google Scholar]
- 6.Epstein JI, Allsbrook WC, Jr, Amin MB, Egevad LL. Update on the Gleason grading system for prostate cancer: results of an international consensus conference of urologic pathologists. Adv Anat Pathol 2006;13(1):57–59. [DOI] [PubMed] [Google Scholar]
- 7.Madabhushi A. Digital pathology image analysis: opportunities and challenges. Imaging Med 2009;1(1):7–10. [DOI] [PMC free article] [PubMed] [Google Scholar]
- 8.Gurcan MN, Boucheron LE, Can A, Madabhushi A, Rajpoot NM, Yener B. Histopathological image analysis: a review. IEEE Rev Biomed Eng 2009;2:147–171. [DOI] [PMC free article] [PubMed] [Google Scholar]
- 9.Kwak JT, Hewitt SM, Sinha S, Bhargava R. Multimodal microscopy for automated histologic analysis of prostate cancer. BMC Cancer 2011;11:62. [DOI] [PMC free article] [PubMed] [Google Scholar]
- 10.Doyle S, Feldman MD, Shih N, Tomaszewski J, Madabhushi A. Cascaded discrimination of normal, abnormal, and confounder classes in histopathology: Gleason grading of prostate cancer. BMC Bioinformatics 2012;13:282. [DOI] [PMC free article] [PubMed] [Google Scholar]
- 11.Naik S, Doyle S, Feldman M, Tomaszewski J, Madabhushi A. Gland segmentation and computerized Gleason grading of prostate histology by integrating low-, high-level and domain specific information. In: Metaxas DN, Rittscher J, Lockett S, Sebastian TB, eds. Proceedings of 2nd Workshop on Microsopic Image Analysis with Applications in Biology, Piscataway, NJ, 2007. [Google Scholar]
- 12.Beck AH, Sangoi AR, Leung S, et al. Systematic analysis of breast cancer morphology uncovers stromal features associated with survival. Sci Transl Med 2011;3(108):108ra113. [DOI] [PubMed] [Google Scholar]
- 13.Langer DL, van der Kwast TH, Evans AJ, et al. Prostate tissue composition and MR measurements: investigating the relationships between ADC, T2, K(trans), v(e), and corresponding histologic features. Radiology 2010;255(2):485–494. [DOI] [PubMed] [Google Scholar]
- 14.Wang XZ, Wang B, Gao ZQ, et al. Diffusion-weighted imaging of prostate cancer: correlation between apparent diffusion coefficient values and tumor proliferation. J Magn Reson Imaging 2009;29(6):1360–1366. [DOI] [PubMed] [Google Scholar]
- 15.Zelhof B, Pickles M, Liney G, et al. Correlation of diffusion-weighted magnetic resonance data with cellularity in prostate cancer. BJU Int 2009;103(7):883–888. [DOI] [PubMed] [Google Scholar]
- 16.Gibbs P, Liney GP, Pickles MD, Zelhof B, Rodrigues G, Turnbull LW. Correlation of ADC and T2 measurements with cell density in prostate cancer at 3.0 Tesla. Invest Radiol 2009;44(9):572–576. [DOI] [PubMed] [Google Scholar]
- 17.Turkbey B, Shah VP, Pang Y, et al. Is apparent diffusion coefficient associated with clinical risk scores for prostate cancers that are visible on 3-T MR images? Radiology 2011;258(2):488–495. [DOI] [PMC free article] [PubMed] [Google Scholar]
- 18.Chatterjee A, Watson G, Myint E, Sved P, McEntee M, Bourne R. Changes in epithelium, stroma, and lumen space correlate more strongly with Gleason pattern and are stronger predictors of prostate ADC changes than cellularity metrics. Radiology 2015;277(3):751–762. [DOI] [PubMed] [Google Scholar]
- 19.Kwak JT, Sankineni S, Xu S, et al. Correlation of magnetic resonance imaging with digital histopathology in prostate. Int J CARS 2016;11(4):657–666. [DOI] [PMC free article] [PubMed] [Google Scholar]
- 20.Shah V, Pohida T, Turkbey B, et al. A method for correlating in vivo prostate magnetic resonance imaging and histopathology using individualized magnetic resonance-based molds. Rev Sci Instrum 2009;80(10):104301. [DOI] [PMC free article] [PubMed] [Google Scholar]
- 21.Liu P, Wang S, Turkbey B, et al. A prostate cancer computer-aided diagnosis system using multimodal magnetic resonance imaging and targeted biopsy labels. In: Novak CL, Aylward S, eds. Proceedings of SPIE: medical imaging 2013—computer-aided diagnosis. Vol 8670. Bellingham, Wash: International Society for Optics and Photonics, 2013; 86701G. [Google Scholar]
- 22.Heijmink SW, Fütterer JJ, Hambrock T, et al. Prostate cancer: body-array versus endorectal coil MR imaging at 3 T–comparison of image quality, localization, and staging performance. Radiology 2007;244(1):184–195. [DOI] [PubMed] [Google Scholar]
- 23.Turkbey B, Pinto PA, Mani H, et al. Prostate cancer: value of multiparametric MR imaging at 3 T for detection—histopathologic correlation. Radiology 2010;255(1):89–99. [DOI] [PMC free article] [PubMed] [Google Scholar]
- 24.Weinreb JC, Barentsz JO, Choyke PL, et al. PI-RADS Prostate Imaging: reporting and data system—2015, version 2. Eur Urol 2016;69(1):16–40. [DOI] [PMC free article] [PubMed] [Google Scholar]
- 25.Schulte EK. Standardization of biological dyes and stains: pitfalls and possibilities. Histochemistry 1991;95(4):319–328. [DOI] [PubMed] [Google Scholar]
- 26.Kalavagunta C, Zhou X, Schmechel SC, Metzger GJ. Registration of in vivo prostate MRI and pseudo-whole mount histology using Local Affine Transformations guided by Internal Structures (LATIS). J Magn Reson Imaging 2015;41(4):1104–1114. [DOI] [PMC free article] [PubMed] [Google Scholar]
Associated Data
This section collects any data citations, data availability statements, or supplementary materials included in this article.


