Although current 3D printing technology, when optimally used, enables creation of medical models with accuracies within the range of clinical imaging spatial resolutions, a thorough understanding of factors affecting the accuracy and reproducibility of these models and the techniques used to measure these parameters is required to ensure appropriate medical practice and establish future guidelines.
Abstract
Despite the rapid growth of three-dimensional (3D) printing applications in medicine, the accuracy and reproducibility of 3D printed medical models have not been thoroughly investigated. Although current technologies enable 3D models to be created with accuracy within the limits of clinical imaging spatial resolutions, this is not always achieved in practice. Inaccuracies are due to errors that occur during the imaging, segmentation, postprocessing, and 3D printing steps. Radiologists’ understanding of the factors that influence 3D printed model accuracy and the metrics used to measure this accuracy is key in directing appropriate practices and establishing reference standards and validation procedures. The authors review the various factors in each step of the 3D model printing process that contribute to model inaccuracy, including the intrinsic limitations of each printing technology. In addition, common sources of model inaccuracy are illustrated. Metrics involving comparisons of model dimensions and morphology that have been developed to quantify differences between 3D models also are described and illustrated. These metrics can be used to define the accuracy of a model, as compared with the reference standard, and to measure the variability of models created by different observers or using different workflows. The accuracies reported for specific indications of 3D printing are summarized, and potential guidelines for quality assurance and workflow assessment are discussed.
Online supplemental material is available for this article.
©RSNA, 2017
SA-CME LEARNING OBJECTIVES
After completing this journal-based SA-CME activity, participants will be able to:
■ Describe the limits of current 3D printing technologies in terms of accuracy and list factors affecting the accuracy and reproducibility of 3D printed medical models.
■ Apply various methods that can be used to measure the accuracy and reproducibility of 3D printed models.
■ Discuss the radiologist's role in ensuring accurate 3D printing workflows and models for clinical practice.
Introduction
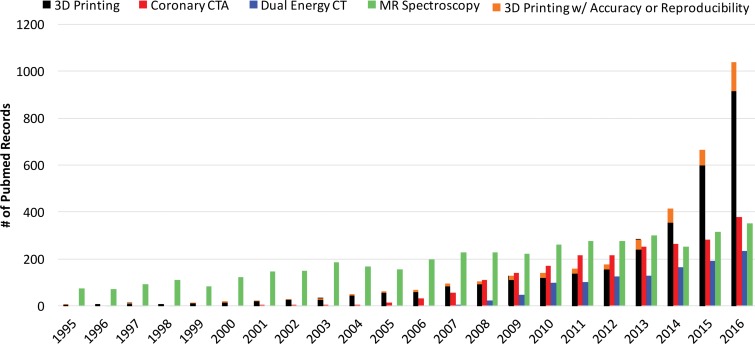
The rate of increase in published works on biomedical three-dimensional (3D) printing technologies has surpassed that of published works on some imaging modalities, such as dual-energy computed tomography (CT), coronary CT angiography, and even magnetic resonance (MR) spectroscopy (Fig 1), with a substantial effect on patient care. This trend is being driven by the reduced costs and increased awareness of and access to 3D printing software and hardware (1). Three-dimensional printing is currently being used to create anatomic models for surgical planning, for intraoperative navigation, to shape medical devices such as fixation plates and catheters prior to intervention, and to directly build patient-specific surgical instruments such as saw and drill guides (1–4). Published works on the 3D printing of patient-specific implants and prostheses also are emerging; a 3D printed mandible (5), pelvic bone prosthesis (6), and chest wall (7), as well as bioresorbable tracheobronchial splints (8), have been recently implanted. Three-dimensional printed craniofacial implants have a longer history (9), with specific processes having been U.S. Food and Drug Administration (FDA) approved since 2013 (10).
Figure 1.
Bar graph shows the number of publications cited in PubMed (https://www.ncbi.nlm.nih.gov/pubmed/) that contain reports on coronary CT angiography, dual-energy CT, MR spectroscopy, and 3D printing. Data for 2016 are based on results returned until the end of May 2016. Statistical data were collected by using the following searches: For all reports on 3D printing, ((3d printing[Title/Abstract]) OR (rapid prototyping[Title/Abstract]) OR (additive manufacturing[Title/Abstract])) AND (“xxxx/1/1”[Date - Publication]: “xxxx/12/31”[Date - Publication]). For all reports on coronary CT angiography (CTA), ((coronary ct[Title/Abstract]) OR (coronary cta[Title/Abstract])) AND (“xxxx/1/1”[Date - Publication]: “xxxx/12/31”[Date - Publication]). For all reports on dual-energy CT, (dual energy ct[Title/Abstract]) AND (“xxxx/1/1”[Date - Publication]: “xxxx/12/31”[Date - Publication]). For all reports on MR spectroscopy, ((mr spectroscopy[Title/Abstract]) OR (mri spectroscopy[Title/Abstract])) AND (“xxxx/1/1”[Date - Publication]: “xxxx/12/31”[Date - Publication]). For all reports on 3D printing mentioning accuracy or reproducibility, ((3d printing[Title/Abstract]) OR (rapid prototyping[Title/Abstract]) OR (additive manufacturing[Title/Abstract])) AND ((accuracy[Title/Abstract]) OR (reproducibility[Title/Abstract])) AND (“xxxx/1/1”[Date - Publication]: ”xxxx/12/31”[Date - Publication]). In the above search terms, “xxxx” denotes the corresponding year on the horizontal axis of the graph.
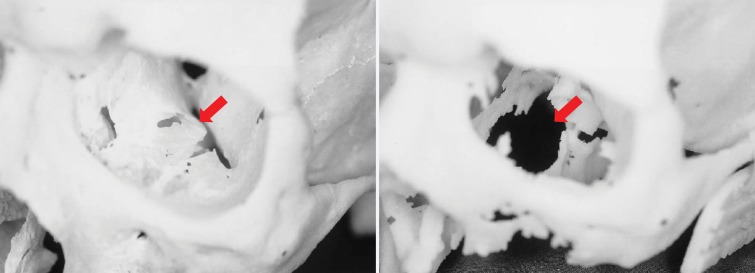
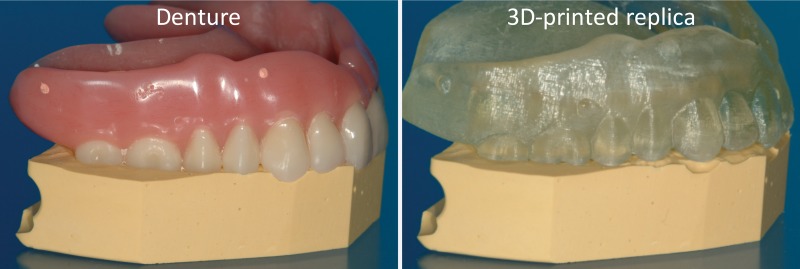
Studies to objectively assess the clinical utility, efficacy, and cost of 3D printing applications are now under way. Data from studies performed more than a decade ago suggested that a 20% reduction in operating room time was possible with use of 3D printed models for surgical planning (11). In a recent meta-analysis of data published in 158 articles (12), a reduction in operating room time was reported in 52 (33%) of the articles. An operating room time reduction in the order of 10%–20% can now be reasonably expected in diverse clinical scenarios (13–15). Data in the same meta-analysis (12) also indicate that unsatisfactory accuracy was the most reported drawback of 3D printing technology, as stated in 34 (22%) of the 158 articles. Prominent examples include preoperative skull models that contained incorrect or entirely missing anatomy, such as occluded or altered foramina, blurred sutures, and pseudodefects not present in the skull (16) (Fig 2); vascular models that did not include arteries that were visualized on the source CT angiogram (18) or that contained artificial fenestrations, occlusions, or aneurysms that were not present on the source images (19,20); and gross deformations of dental implant guide models (21) (Fig 3). An inaccurate 3D printed model of a patient’s anatomy can result in inappropriate treatment planning and thus can have severe consequences for the patient and clinician. Nonetheless, accuracy and/or reproducibility is currently mentioned in only a small number of articles on biomedical 3D printing (Fig 1). Accuracy and reproducibility are key elements that will have to be addressed by not only early research adopters but also practicing radiologists, who are increasingly being called on by their organizations to produce 3D printed models for patient care (22).
Figure 2.
Photographs of a cadaveric skull (left) and the corresponding 3D printed model (right) show a loss of detail in the orbital floors (arrows) and along the margins of a maxillary defect, where the bone is thin, on the 3D model. (Reprinted, with permission, from reference 17.)
Figure 3.
Left: Denture fitted on a stone platform. Right: The 3D printed model of the denture derived from cone-beam CT (0.4-mm section thickness) does not fit the platform. (Courtesy of Lambert J. Stumpel, DDS, San Francisco, Calif.)
From the surgeon’s perspective, accuracy can be defined on the basis of the surgical outcome. Within this context, the accuracy of patient-specific 3D printed surgical guides is supported by data in a number of recent studies. Schweizer et al (23) reported an average residual displacement of 7° for scaphoid fractures or nonunions reconstructed with use of 3D printed guides, as compared with an average displacement of 26° with use of a freehand approach, in 22 patients. Gan et al (24) reported a postoperative leg axis deviation of plus or minus 3° in 34 (97%) of 35 patients who underwent total knee arthroplasty performed with use of 3D printed guides, as compared with 27 (77%) of 35 patients in whom this procedure was performed with use of conventional instrumentation. Hu et al (25) reported that in 559 (96%) of 582 thoracic pedicle screw placements performed by using 3D printed guides, there was no perforation; this is in contrast to perforation-free rates of 50%–94% that are reported with the use of freehand or fluoroscopic guidance techniques.
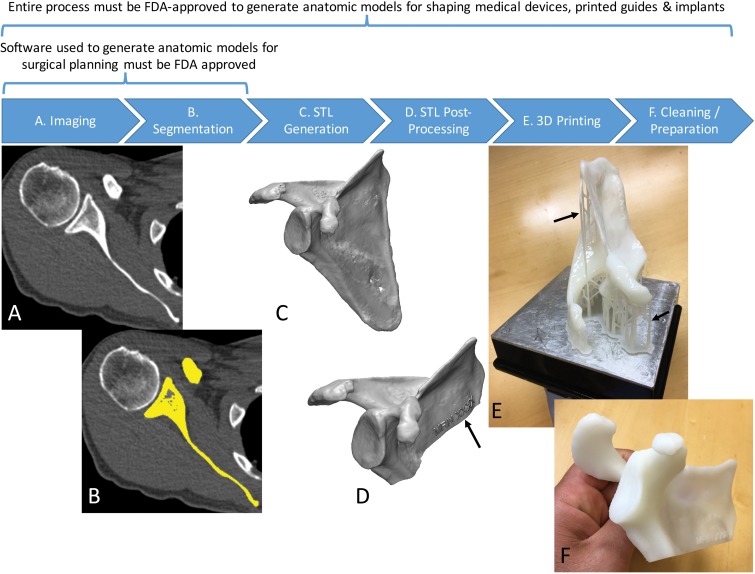
For the radiologist creating the 3D printed model, however, recognizing and subsequently studying the factors that affect accuracy and reproducibility will be necessary to guide the development of workflow protocols and reporting guidelines to establish and, if necessary, substantiate appropriate medical practice for creating 3D printed models. The accuracy and reproducibility of 3D printed models are affected by the sum of errors introduced in each step involved in the creation of the models from medical images (1) (Fig 4). These steps include imaging, tissue segmentation, and any subsequent postprocessing of the segmented tissues that are stored in the STL models by using computer-aided design software. Fabrication of the STL model by the 3D printer, and cleaning and postprocessing of the fabricated model are only the final steps of this process. Bulk and/or fine anatomic or geometric errors and distortions can be introduced at each step. Evidence to date, as described in the sections that follow, indicates that the entire process can be performed in a manner that limits inaccuracies to clinically acceptable levels. However, data in a number of publications indicate that this is not always achieved in practice.
Figure 4.
Process of 3D printing of tissue models. A, A scapula is imaged with non–contrast material–enhanced CT. B, The scapula (yellow) is then segmented from the CT image. C, A surface enclosing the segmented voxels—that is, the Standard Tessellation Language (STL) model—is created. D, The STL model is typically postprocessed—for example, to trim unnecessary portions and add identifiers (arrow). E, The designed model is then printed by using a 3D printer. F, Theprinted model is cleaned to remove support structures, such as the scaffold (arrows in E) generated by the stereolithography printer in this example.
The purpose of this article is thus twofold. The first purpose is to describe and illustrate those aspects of each step of the 3D biomedical model creation process that affect the accuracy and reproducibility of the models, and familiarize readers with the accuracy limits reported to date. The second goal is to describe metrics that can be used to assess the accuracy and reproducibility of the 3D model printing process. In the future, metrics such as those described herein will be useful for establishing specific guidelines for imaging, segmentation, and 3D printing applications. These metrics will also be useful for establishing workflows to produce accurate and reproducible models for individual clinical indications.
3D Printer Accuracy
Technology Primer
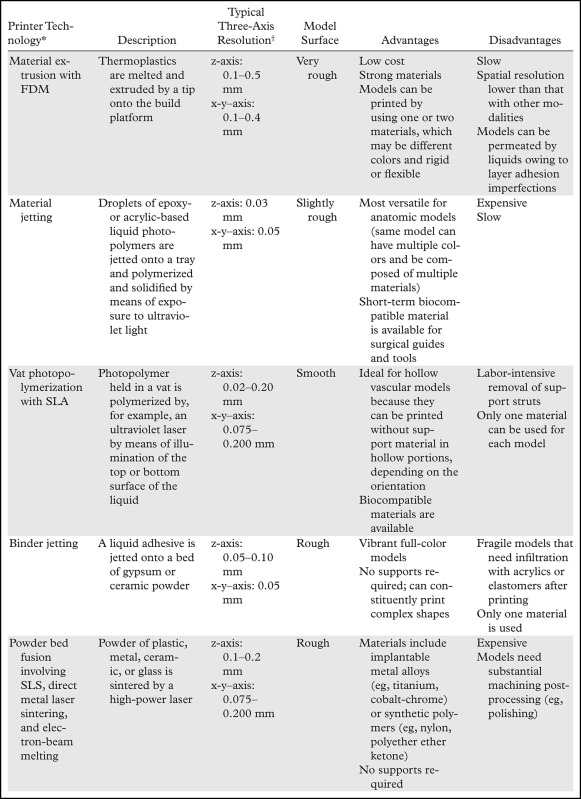
To introduce many of the relevant concepts, we begin with the final step of the process—when the 3D printer is used to fabricate the STL models. A number of widely different technologies are used for this purpose, and a thorough review of these technologies can be found in a previously published article (1). Briefly, with all 3D printing technologies, the 3D printer fabricates an STL model by additively layering material in the shape of successive cross sections of the model atop the previously printed layers. The technologies most often used in clinical settings are summarized in Table 1. The predominant technologies are FDM; SLA; material jetting and binder jetting, which are typically used to fabricate anatomic models; and powder bed fusion or SLS, which is typically used to fabricate implants, prostheses, and surgical guides.
Table 1:
Commonly Used Medical 3D Printing Technologies
*FDM = fused deposition modeling, SLA = stereolithography, SLS = selective laser sintering.
†The z-axis spatial resolution represents the layer thickness.
The resolutions of 3D printers most often described in the literature, which range from 0.05 to 0.30 mm (Table 1), usually refer to the print layer thickness only—that is, the z-axis resolution of the printer. Most 3D printers provide a fixed x-y resolution that is not as immediately clear. With SLA and SLS printers, the x-y resolution is determined according to the laser beam diameter, which is approximately 0.1–0.2 mm for most current systems. With FDM, it is possible to change the x-y–axis resolution by changing the tip of the material extruder, and extruders 0.1–0.4 mm in diameter are usually available. With binder and material jetting systems, the x-y resolution is fixed and most often expressed in dots per inch, similar to the resolution with ink jet document printers. Typical resolutions are in the 600-dpi or 0.05-mm range. Thus, in theory, the highest resolution with 3D printing modalities is roughly 0.05–0.10 mm in all three axes, which is higher than that of most clinical images. However, in general, features smaller than 0.3 mm cannot be printed successfully with most printing modalities (26), as the minimal feature size is based only partly on the resolution. For SLA and SLS machines, the minimal feature size is about 1.5 times the laser beam spot size (ie, x-y resolution). For material and binder jet printers, tolerances on the dimensions of the jetted droplets (Table 1) and droplet spread characteristics (in conjunction with material shrinkage) determine the minimal feature size, with manufacturer guidance indicating similar minimal feature sizes of 0.1–0.3 mm.
It is also notable that for all 3D printing modalities, or more appropriately stated, all “additive manufacturing” modalities, errors in the print layer dimension in particular can be additive. For example, one 3D printer manufacturer lists the dimensional accuracy of its systems as within 0.025–0.050 mm per 25.4 mm of the model size (27). Furthermore, long-term storage of models printed with acrylics and plastics (with FDM, SLA, and material jetting systems) is inadvisable, as most materials will exhibit warping or deformation that is often dependent on the model geometry (eg, sagging of the ribs) or will become brittle over time. Similarly, humid environments and contact with liquids for extended periods will cause most 3D printed material to swell and deform. Finally, care must be taken during the postprinting processing of models. For example, for hollow-vessel models, to minimize hydraulic resistance, we previously used sodium hydroxide solution to smooth the 3D printed vessel lumen, which is usually rough owing to printed model roughness (Table 1) (28). However, such treatments can inadvertently result in loss of model accuracy due to, for example, erosion and hence artificial enlargement of the vessel lumen.
Printer Accuracy and Reproducibility
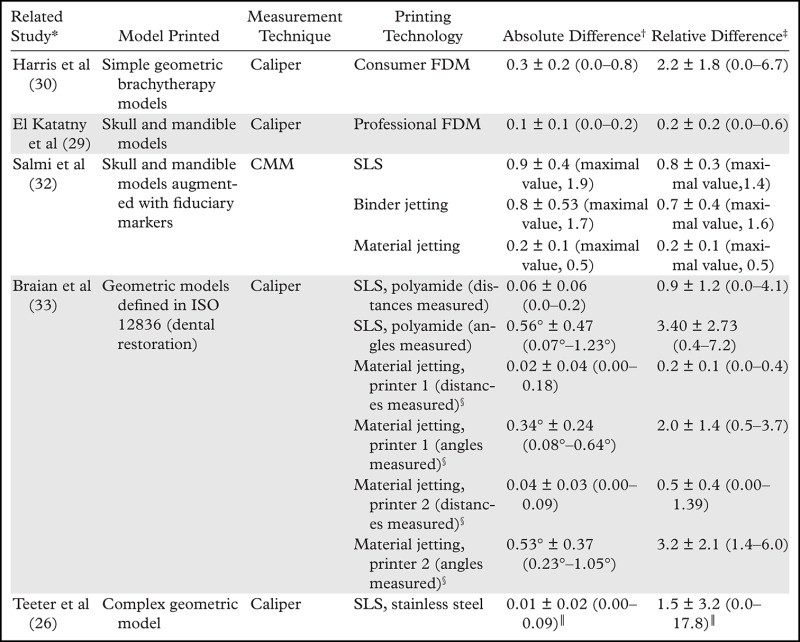
Resolution is the smallest measurement that a 3D printer can reproduce, and, as just described, 0.3 mm is the lowest feasible resolution for most printing modalities. Accuracy is, instead, the degree of agreement between the dimensions of the printed object and the dimensions intended for the designed model—that is, the STL file. The 3D printer resolutions described earlier appear to be sufficient to produce highly accurate models for biomedical applications. The data in a number of studies have confirmed this for both geometric (phantom) and anatomic models (26,29–32), with errors in agreement between the printed object and STL file dimensions smaller than 1 mm in general and typically smaller than 0.5 mm with current hardware (Table 2). Three-dimensional prints are also highly reproducible; Taft et al (34) noted an average interprint variability of less than 0.07 mm in all three dimensions of a skull model printed sevenfold with an SLA printer, with a maximal variation in fiduciary marker coordinates affixed on the model across prints of less than 0.15 mm on the x and y axes and less than 0.31 mm on the z axis. Thus, current results suggest that even in the print layer dimension, which is typically the least accurate (30,34), the accuracy and reproducibility of phantom and anatomic models printed with use of professional 3D printers are better than 1 mm and typically better than 0.5 mm, analogous to the spatial resolution of most clinical imaging modalities.
Table 2:
Reported Accuracies of Dimensions Measured on 3D Printed Models versus Design STL Models
Note.—CMM = coordinate measuring machine, ISO = International Organization for Standardization.
*Numbers in parentheses are corresponding reference numbers.
†Data are means ± standard deviations, cited in millimeters unless otherwise noted. Numbers in parentheses are ranges unless otherwise noted.
‡Data are mean percentages ± standard deviations. Numbers in parentheses are ranges unless otherwise noted.
§Printer 1 is the Objet 30 (Stratasys, Eden Prairie, Minn). Printer 2 is the ProJet MP 3510 (3D Systems, Littleton, Colo).
║Features smaller than 0.3 mm were excluded.
Potential Pitfalls
Most 3D printers offer a selectable z-axis resolution; with an SLA system, this is typically 0.025–0.200 mm, while with an FDM printer, it is 0.1–0.5 mm. For example, selecting a layer resolution of 0.5 mm, as compared with a resolution of 0.1 mm, in an FDM printer will enable an object to be printed in a much shorter time, but the fine bone structures (35) or small vessels (19) may not be adequately replicated. Nonetheless, a printer with the highest accuracy is not always necessary; the level of printer accuracy required is dependent on the clinical purpose, just as thinner sections are required for coronary CT angiography, as compared with abdominal CT. This reinforces the need for communication between the radiologist and both the clinical team and the requesting physician regarding the purpose and desired accuracy of the given model.
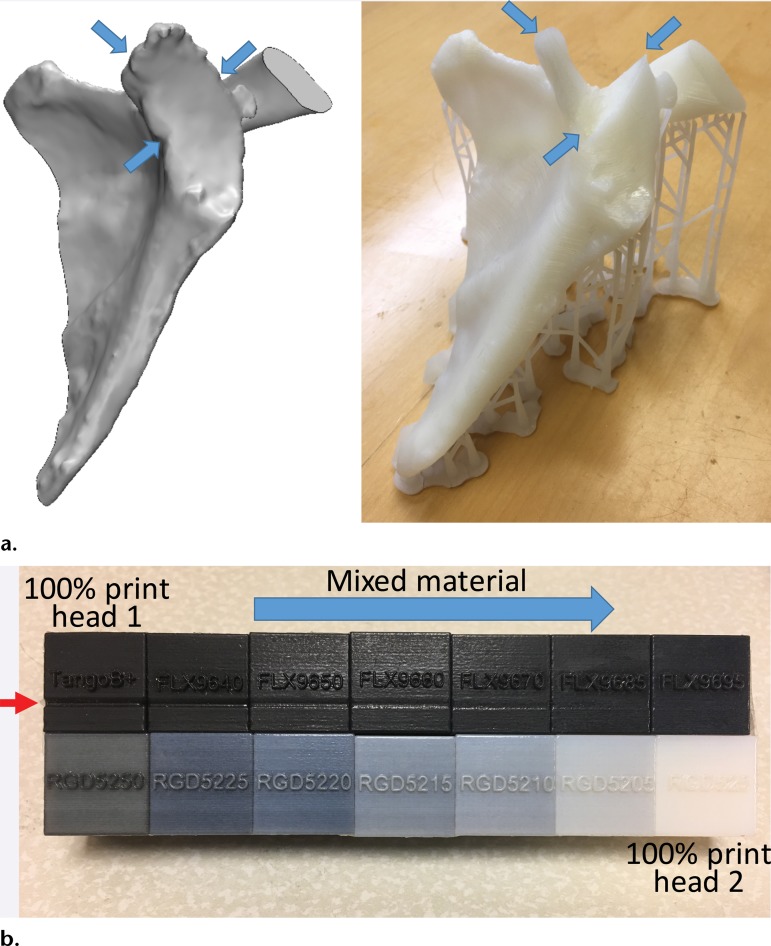
Another important aspect is that the underlying processes performed by 3D printers (eg, chemical reactions, heating, and cooling) can result in model-specific dimensional errors. For example, FDM printed models are susceptible to shrinkage and warping deformation during the thermoplastic cooling process. This can lead to bulk geometric inaccuracies in the portions of the model that are inadequately supported during the printing, such as the spinous process during the printing of a vertebral body. Using an FDM printer to print hollow models of small vessels is inadvisable, as this will almost certainly result in artificial occlusions (19), partly because the lumen may be only two to four printer resolution increments in size, while warping during cooling will almost certainly occur in the order of a few resolution increments. Similarly, SLA and material jetting photopolymers—those that yield flexible models in particular—shrink during polymerization (36), as do the adhesives used in binder jetting. “Bottom-up” SLA printers print each layer and subsequently detach and lift the printed layer from the vat base to print the next layer. The large mechanical stresses exerted on the model during detachment from the vat floor can lead to additive deformation and thus loss of dimensional accuracy. These stresses can also lead to a portion of a layer failing to adhere to the prior layer, resulting in grossly inaccurate features (Fig 5). This last example also illustrates how, with SLA or FDM printers, the chosen orientation in which the model will be printed can often affect the success of a printing project, with some trial and error required for judicious placement of the support structures (Fig 4, E and F). Because many such failures are related to the particular model being printed, models should at minimum always be visually inspected against the intended STL model after printing and postprocessing and before they are used for health care purposes (Fig 5).
Figure 5.
(a) STL model of the scapula (left) shows that the fabrication (right) created by using a bottom-up desktop SLA printer (Form 1+; Formlabs, Cambridge, Mass) does not include the glenoid cavity (arrows). Such failures occur owing to dirty optics or mechanical forces exerted on the model during printing. (b) Printing failure involving a material jetting printer with two print heads (Objet Connex 2; Stratasys), each loaded with one material. The black cube at the top far left corner was printed with 100% of material 1. The cube in the far right corner at the bottom was printed with 100% material 2, with the cubes between them printed with mixtures of the two materials in different proportions. Use of the 100% black material in a faulty print head led to a depression (red arrow) where the model height was 19.54 mm as opposed to the model design height of 20 mm. The model created with the fully white material measured 19.99 mm in height. The cubes containing increasing amounts of the material printed with the correctly functioning head have progressively less error.
Nonetheless, the chosen 3D printers account for many of the described process-related errors. For example, professional FDM printers print the model in a chamber with controlled temperatures, while material jetting printers allow time between the jetting of each layer of material to relieve internal stresses. An equivalent example familiar to the radiologist is that involving MR imaging equipment, which preshapes the magnetic field gradient amplifier waveforms and adjusts the shape of the field of view during image reconstruction to account for the magnetic field gradient offsets and nonlinearities that are inherent to individual imaging units [eg, gradient warping (37)]. Similarly, any active techniques (eg, involving hardware design) or passive techniques (eg, involving software) used by 3D printing equipment to control dimensional distortions can deviate from their optimal setting over time and necessitate regular recalibration. Thus, regular testing of a 3D printer’s accuracy and preventive maintenance recalibration are a necessary part of quality assurance protocols, similar to those used for imaging equipment.
Measuring Printer Accuracy
There are two requirements for metrics used to assess printer accuracy alone, independent of all other steps of the process of translating medical images to anatomic models. First, the dimensions of the model to be printed must be unambiguously known—that is, the reference standard must be the dimensions specified in the STL model rather than a physical object, such as a phantom or tissue, that must be imaged (and segmented) before a printed copy is produced. Second, an accurate process with high precision is required to measure the dimensions of the printed model for comparison with the intended dimensions of the STL model.
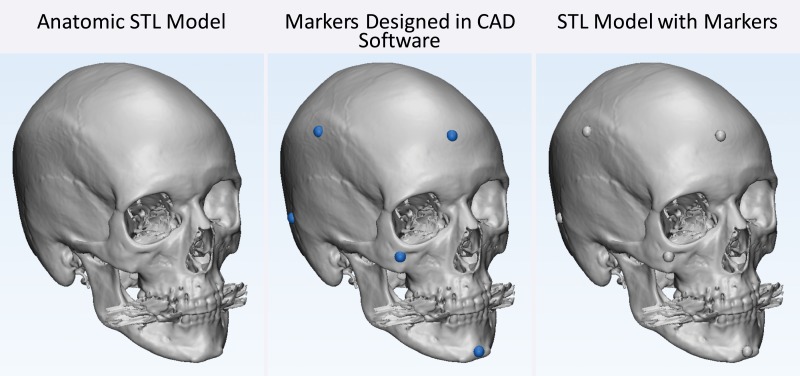
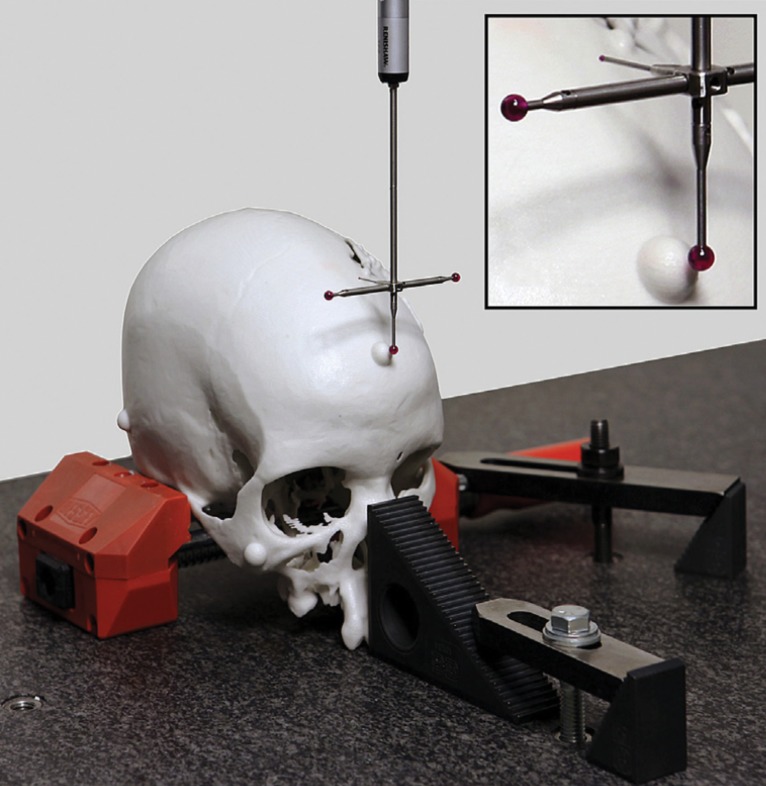
A number of approaches meet the first requirement. The first and simplest approach is to design STL models by using computer-aided design software with precisely specified dimensions and to compare these dimensions with those of the printed model (26,30,33). One such phantom that is relevant for medical 3D printing was recently described by Matsumoto et al (3); it contains line pairs to measure resolution and accuracy. Indication-specific phantoms also have been described; examples include molds containing internal catheter channels for brachytherapy (30) and lattice structures to test the accuracy of printed porous structures (26) used in implants to promote osseointegration (6). Phantoms are nonetheless limited in that they are less geometrically complex compared with the human anatomy. The second approach, to overcome this limitation, is to begin with an anatomic STL model, such as that of a skull, and compare the measurements of the STL model with those of the printed model. To avoid operator variability in identifying landmarks for measurements, an STL model can be augmented with fiduciary markers by using computer-aided design software (Fig 6). The designed marker locations and dimensions can then be compared with those in the printed model (32). With the two described approaches, there are limited options for accurately and precisely measuring the dimensions of the printed object. Manual measurements performed by using Vernier calipers are limited by operator variability, difficulty identifying landmarks precisely, and a potentially small number of measurements that are insufficient for full quantification of the anatomy. Automated coordinate-measuring machines (Fig 7) can be used to address some of these shortcomings; they offer better precision and programmable identification of landmarks to increase measurement accuracy (34). However, both manual and automated measurements are limited to external measurements, as calipers and probes cannot be easily inserted into closed-ended cavities such as the inside of a skull model or vessel lumen.
Figure 6.
Testing printer accuracy by using anatomic models. By using computer-aided design (CAD) software, a skull STL model (left) is augmented with fiduciary markers (blue spheres) (middle) to yield a new STL model (right). The locations of the markers on the printed model can be measured with, for example, calipers or automated coordinate-measuring machine systems and compared with the locations of the markers on the designed STL model.
Figure 7.
Automated coordinate-measuring machine used to measure selected locations on an object, such as those labeled with fiduciary markers on an anatomic model, with high accuracy and precision. (Reprinted, with permission, from reference 32.)
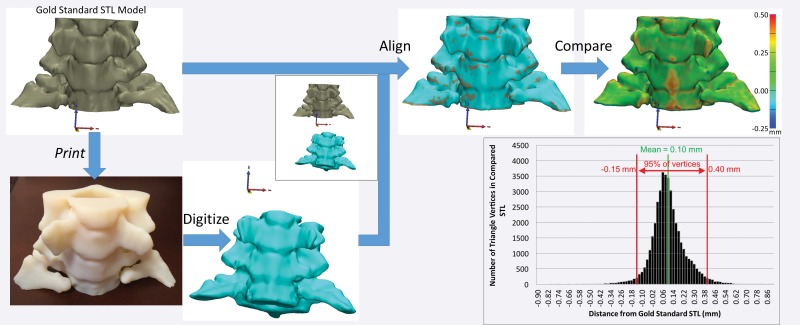
A third approach to measuring 3D printing accuracy that concurrently meets both requirements for testing printer accuracy is to print an anatomic model and then digitize it for direct comparison with the intended STL model. A printed model can be digitized, for example, by using laser or other optical [eg, structured light (38)] scanning, tomographic imaging such as CT or microscopic CT, and potentially even MR imaging (39). Although optical scanners are often preferred because they can have much higher precision (<0.01 mm) than CT and MR imaging units, they are limited to assessment of only the outer surface of a model. Appropriately calibrated CT and MR imaging systems have excellent dimensional accuracy (40,41) and can be used to digitize the entire volume of a printed model. In a recent study (39), the dimensions of a 3D printed model of the cervical vertebrae derived from in vivo CT images differed from the dimensions of the designed STL model by less than 0.2 mm when the model was digitized with CT and by less than 0.7 mm when it was digitized with MR imaging. The different accuracies of printed models based on the imaging modalities used to digitize them are not surprising given the lower spatial resolution—and hence lower precision for digitizing the printed model—with MR imaging, as compared with CT, and that magnetic susceptibility gradients between the model surface and surrounding air, for example, can result in MR imaging signal loss at voxels near the model surface. Thus, the imaging protocols used for this purpose should be tailored for high spatial resolution, with use of a field of view that tightly encompasses the model, a section thickness of 1 mm or less, a sharp reconstruction kernel for CT, and spin-echo sequences to minimize susceptibility artifacts at MR imaging (39). In the future, low–kilovolt-peak CT acquisitions to differentiate the multiple printing materials used to create complex models may be investigated.
Regardless of the method used to digitize a printed model, once it is digitized, it must first be aligned to the initial STL model for comparison (Fig 8). Free and commercial software is available for this purpose and includes CloudCompare (open-source software developed and maintained by the community) (42) and Materialise 3-matic (Materialise NV, Leuven, Belgium). Careful alignment is necessary, as suboptimal alignment can easily skew the results of the comparison. Once the alignment is completed, the STL surfaces are compared by calculating the minimal distance from points on the surface of one model (typically each vertex of the triangles that form the STL model) to points on the surface of the other model (Fig 8)—to fully characterize their difference. A process that we are developing to overcome the alignment requirement involves adding fiduciary markers—for example, spherical beads printed within the model—that do not alter the depicted anatomy. With multiple-material printers, markers can be printed with material that has mechanical properties similar to those of the remainder of the model (so that utility [eg, drilling or cutting properties] remains unaffected) but is separable in a given tomographic imaging modality—for example, it has different attenuation (at CT) or signal intensity (at MR imaging) values. Coordinates of the markers can be extracted by imaging the model with the given modality and compared with their intended locations (on the STL model) to quantify any dimensional inaccuracy. The conceptual example in Figure 9 involves the use of a Cartesian grid of small spheres, designed with computer-aided design software, that are inserted into the STL model of a cervical spine. The spheres can be printed in an off-white rigid MR imaging–visible material (39) that is similar in density (and hence not separable at CT) and rigidity to the white material used to print the remainder of the model. The resulting model can be used, for example, to simulate a CT-guided procedure as if the markers were not present (given the nearly equal density of the two materials), while an MR image can be used to determine whether there are any geometric distortions (non–Cartesian grid) or bulk errors (missing markers) in the model.
Figure 8.
Digitization and alignment of a 3D printed model. The original STL model is printed as a 3D object, which is subsequently digitized—by using CT in this example. After the original and digitized STL models are aligned, the distances between the vertices of one STL model—in this example, the digitized version—and the surface of the other model—in this example, the original STL version—can be calculated. The reference-standard STL model can be an arbitrary model to test printer accuracy or a digitized (eg, laser-scanned) model of a cadaveric specimen to establish the accuracy of the entire process, including the technique used to image the specimen and the segmentation technique used to create the model.
Figure 9.
Conceptual illustration of the use of internal fiduciary markers to establish the dimensional accuracy of a 3D printed model. A, A grid of markers—0.7-mm–diameter spheres with 7-mm spacing between them—covers, B, the extent of the model. C, Markers that fall within the solid part of the model and made of material that has similar mechanical properties but different radiodensity compared with the remainder of the model can be printed. An image of the model with different marker radiodensity compared with the radiodensity of the remainder of the model can be used to extract coordinates of the markers and compare these coordinates with locations on the designed grid to establish the dimensional accuracy of the model. Inset: All markers within the model can be seen because the model is plotted as a semitransparent object.
Implications of the Clinical Use of 3D Printers
A final important note regarding 3D printers as they pertain to clinical practice is that 3D printer equipment is not within the scope of regulatory (eg, FDA) review (43). Clinicians in a practice who print models for surgical planning and intraoperative orientation may use the information just described to develop a process that ensures that the printer will be regularly calibrated—for example, with use of a phantom (3)—and to ensure that individual models are sufficiently inspected before use. However, if the anatomic models are intended for diagnostic purposes or for preshaping medical devices such as fixation plates or catheters (4), or if a medical device (surgical guide or implant) is being directly 3D printed, then the entire process, including how the 3D printed model is produced, must be reviewed by the FDA (43).
Accuracy of the 3D Printing Process: From Imaging to Printing
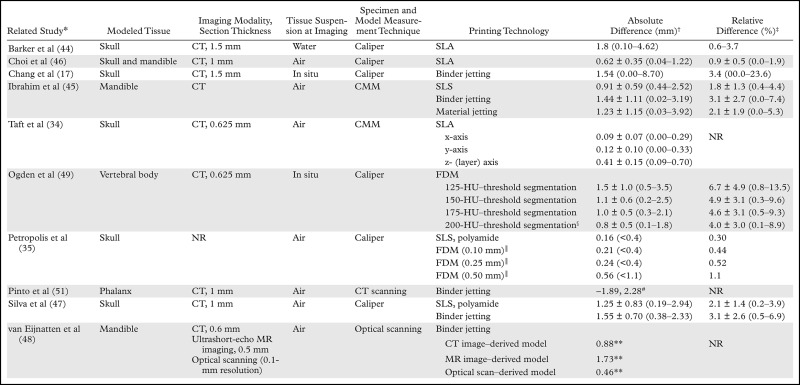
The accuracy of the entire 3D printing process, measured by comparing 3D models with patient anatomy, was investigated as early as 1994 when Barker et al (44) imaged a dry skull immersed in water with CT, segmented the bone from the resulting images, and then 3D printed it by using what were then state-of-the-art software and hardware. The average difference of 11 distances between anatomic landmarks measured on the cadaveric bone versus these 11 distances measured on the printed model with a caliper was 1.8 mm, with a difference range of 0.10–4.62 mm (0.6%–3.7%).
Accuracy of 3D Printed Model versus Cadaveric and Surgically Exposed Tissue
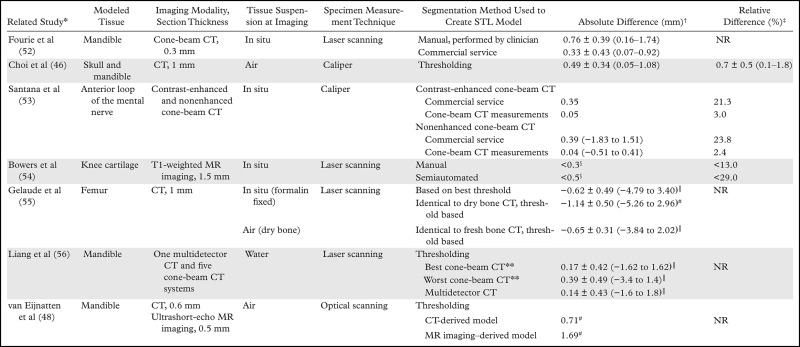
The basic methodology of comparing cadaveric specimens with 3D printed models (Fig 10) has since been applied to all major 3D printing technologies to assess the accuracy of 3D printing of not only the skull (17,34,35,46,47) but also the mandible (45,46,48), vertebral bodies (49), and pelvis (50) (Table 3). Comparisons of the bone versus the printed model (both digitized by using optical or CT scanning) also have been performed. These comparisons yielded similar results, with an average difference in dimensions across the entire outer surface of the bone (relative to the 3D model) of less than 1 mm; however, differences can be as high as 5–6 mm in portions of the model (Table 4) (48,51,52,55).
Figure 10.
Comparison of cadaveric versus 3D printed model measurements to assess the accuracy of 3D printing. A dry cadaveric mandible (left) and 3D printed model of the mandible (right) derived from CT imaging of the dry bone show that manual caliper measurements of anatomic landmarks on both the dry bone and the printed model can be used to establish the accuracy of the entire 3D printing process, including the imaging and segmentation steps (eg, with use of particular Hounsfield unit thresholds for segmentation). This accuracy will not apply to the printing of other, for example, less dense or thick bones because a different threshold may be required for the segmentation. (Reprinted, with permission, from reference 45.)
Table 3:
Reported Measurement Accuracies of 3D Printed Bone Models, as Compared with Cadaveric Specimens
Note.—CMM = coordinate measuring machine, NR = not reported.
*Numbers in parentheses are corresponding reference numbers.
†Absolute differences (cumulative imaging, segmentation, and printing errors) between measurements on the printed model and those on the cadaveric specimen, cited as mean values or means ± standard deviations, with ranges in parentheses, unless otherwise noted. Values reported from the Petropolis et al (35) study are mean values, with maximal values in parentheses.
‡Relative differences, cited as mean values or means ± standa rd deviations, with ranges in parentheses.
§Use of the 200-HU threshold resulted in optimal agreement between the printed model and cadaveric specimen.
║Numbers in parentheses are FDM printer layer heights (ie, z-axis resolutions).
#Minimal and maximal signed diffferences.
**Ninety-fifth percentile of signed (with positive and negative differences, as opposed to the absolute difference, considered) differences.
Table 4:
Reported Accuracies of STL Bone Models, as Compared with Cadaveric Specimens
*Numbers in parentheses are corresponding reference numbers.
†Absolute differences (imaging and segmentation errors) between the segmentation-generated STL model and cadaveric specimen, cited as mean values or means ± standard deviations, with ranges in parentheses, unless otherwise noted.
‡Mean relative differences (imaging and segmentation errors) between the segmentation-generated STL model and cadaveric specimen. Data from the Choi et al study (46) are the mean relative difference ± the standard deviation, with the range in parentheses. Data from the Bowers et al (54) study are maximal relative differences. NR = not reported.
§Approximate maximal absolute difference values.
║Average signed differences. Negative values indicate that the STL model was larger than the cadaveric specimen.
#Ninety-fifth percentile of signed (with positive and negative differences, as opposed to the absolute difference, considered) differences.
**Liang et al (56) used five cone-beam CT systems. The absolute difference values of the systems that demonstrated the best and worst accuracy are reported.
Imaging dry bone oversimplifies the process of 3D printing the human anatomy from medical images, as the inaccuracies introduced by segmentation to separate bone from adjacent tissues are not assessed. Models of bone created by using in situ CT imaging indicate that differences are 1.5 to two times greater than the differences encountered when the models are created by imaging dry bone (Appendix E1A). However, this finding cannot be generalized to most nonosseous applications that lack the benefit of the high contrast-to-noise ratio of bone at CT, which enables simple threshold-based segmentation (1). Because there is limited opportunity to access soft tissues surgically without deforming them, there is limited literature on the accuracy of 3D printed anatomy, as compared with pathologic specimens (14,53). Differences range from as little as 3.5% to as much as 23.8% of the tissue dimensions, with larger discrepancies observed for smaller (a few millimeters) tissues (Appendix E1A). In one such study performed by Santana et al (53), the difference between the cadaveric measurements and those performed on the CT images was an order of magnitude smaller than the difference between the cadaveric measurements and those performed on the STL models (2.4% versus 23.8%) (Table 3). These results emphasize the caveat that the segmentation of tissues depicted on images, which is necessary to yield the STL model for 3D printing, is a major contributor to inaccuracies that must be critically addressed in future research.
Accuracy of 3D Printed Model versus Radiologic Image Measurements
The results obtained in the Santana et al study (53) highlight the potential pitfalls associated with the large discordance between image interpretations performed by radiologists and the image processing steps required to generate a 3D printed model—namely, segmentation and STL postprocessing. This is perhaps the most relevant concern of radiology practice clinicians who use 3D printing. With the processes used, accurate segmentation and postprocessing need to be ensured so that the model reflects the radiologist’s image measurements and interpretations. Image measurements can be readily compared with model measurements (Fig 11), and a substantial body of work, reviewed in the following sections, involved comparisons between image interpretations and the resulting STL or printed models.
Figure 11.
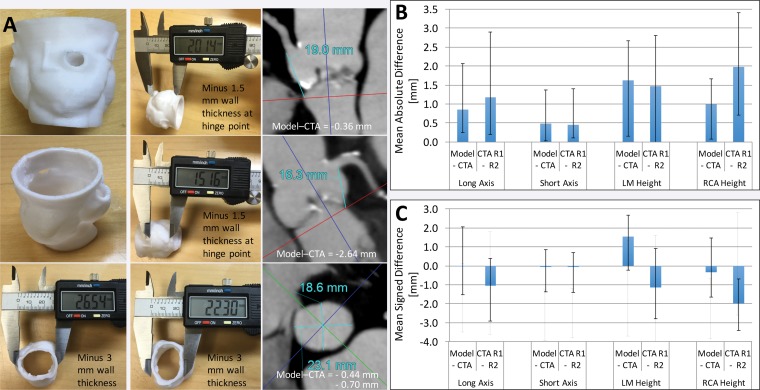
Printed 3D model versus image measurements of the aortic valve. A, Caliper measurements performed on a 3D printed model of the aortic valve and radiologist measurements performed on source CT angiograms (CTA) demonstrate individual differences in coronary artery heights and aortic annulus diameters between the model and angiograms. B, Graph data show that in 10 patients, mean absolute differences in these measurements were within the range of interobserver variability in CT angiographic measurements. C, Graph data show that the use of mean signed differences led to an overestimation of the accuracy of the 3D printing process, as the positive and negative differences for different patients canceled each other. Error bars indicate the maximal differences across the 10 patients. LM = left main coronary artery, RCA = right coronary artery, R1 = reader 1, R2 = reader 2.
Craniomaxillofacial and Orthopedic Imaging.—Although cadaveric study results have largely established the accuracy of 3D printed bone models, there have been few studies in which the dimensions of printed models were compared with those on source images, with the model compared with image measurements having accuracy similar to that of the model compared with pathologic specimens (57–59) (Appendix E1B). Comparisons of model measurements with image-based measurements are primarily useful for assessing the accuracy of models that are being used for their intended purpose—for example, for image-guided therapies (39) and registration to computer navigation systems for neurosurgical procedures (60).
Cardiac and Vascular Imaging.—After musculoskeletal imaging, cardiovascular imaging accounts for the second largest use of 3D printing (2). For cardiovascular models, comparison with the in situ anatomy is difficult and image measurements are the most pertinent because they are often considered the reference standard for guiding treatment plans and selecting device sizes. Imaging findings were compared with printed models in a considerably larger body of work (18,19,61–71) (Appendix E1C). Overall results indicate that the accuracy of 3D cardiovascular models, as compared with radiologists' image interpretations, is similar to that of osseous models, generally to within 1 mm, but tissue segmentation, the primary source of 3D printing error, can easily lead to larger discrepancies—4 mm or greater. This finding likely applies to 3D printing of most soft tissues.
Given that differences of this magnitude are sufficient to potentially result in the selection of a different prosthetic device size for implantation, absolute differences between model and image measurements, rather than the average signed differences most often reported in the literature, should be considered the values of merit when establishing the accuracy of a 3D printing workflow (Fig 11, Appendix E1C). With use of absolute differences, the negative errors (model underestimations of the true dimensions) causing cancellation of the positive errors (model overestimations of the true dimensions) can be avoided. It is also important to interpret differences in measurements performed on 3D models versus those performed on images within the context of the intra- and interobserver variability of radiologists’ image-based measurements (Fig 11). Within this context, the data in a number of studies support the clinically excellent accuracy of 3D printed cardiovascular models (Appendix E1C). For example, one study team (4) that used models to preshape microcatheters for internal carotid artery coiling procedures reported accurate alignment of the microcatheter tip with the long axis of the aneurysm, without intraprocedural modification being required, in all 10 involved patients. Particular attention should be given to confirm the fine anatomic details in the 3D printed models, as these may not always be accurately reproduced (18,19), partly owing to segmentation inaccuracies and partly owing to limitations of the 3D printer used, as described earlier.
Finally, similar to the accuracy of bone models in terms of their intended use, such as image-guided therapy, the accuracy of vascular models may depend on their capability to replicate functional characteristics that are relevant to a diagnostic or interventional procedure. There are 3D printing materials that can mimic the elastic properties of vessel wall tissue (63,64) and thus be leveraged to create 3D printed models that replicate, for example, in vivo echocardiographic flow measurements to within 5% (70). In addition, radiopaque 3D printing materials can be leveraged to create 3D printed models that replicate the in vivo anatomy depicted at angiography to within 1 mm (Appendix E1D).
Measuring Model Accuracy and Potential Pitfalls.—The described results establish that 3D printing of medical models of even soft tissues can, in theory, be accurate within the limits of human observer variability. However, in many cases, printed models can have clinically important inaccuracies—for example, within the context of device sizing. Recognizing potential sources of inaccuracy during the creation of 3D printable models before they are transferred to the printer is key to developing workflows and protocols that will yield accurate reproducible models. It is important to stress that this applies to even experienced imagers. In a study of seven mandibles (52) that were imaged in situ with cone-beam CT, the 3D models created by a clinician with use of FDA-approved software (SimPlant Ortho Pro; Materialise Dental, Leuven, Belgium) had twice the magnitude of difference from the optical scans of the dry bones compared with the models created by the company’s direct-to-surgeon modeling service (Table 4).
Imaging and Segmentation
One of the largest sources of inaccuracy is the step of segmenting the imaged tissues. This was illustrated in a study (72) of skull models generated from the same cone-beam CT dataset by clinicians at three institutions with experience in medical 3D printing. Despite the relative ease of identifying dense bone at CT, optical scanning of the three identically printed models revealed differences of up to considerably greater than 1 mm that were nonuniform—that is, there was no consistent over- or underestimation. The reproduction of fine anatomic structures in the orbits, maxillary sinus, and nasal cavity region was different among the models and unsatisfactory in all three of them.
Depending on the tissue of interest, imaging modality, and intrinsic contrast-to-noise ratio, segmentation techniques range from fully automated methods, with which errors can often be readily quantified and related to the segmentation parameters, to predominantly manual methods, whereby errors are difficult to detect and quantify. Even a simple technique such as automated threshold-based segmentation of bone on CT images can lead to small or large inaccuracies, depending on the selected threshold. When cubes made of a bone-equivalent–density material and imaged in water were segmented by using four attenuation thresholds between the attenuation of water (0 HU) and the average attenuation of the phantom material (1415 HU), the resultant printed models, as compared with the phantoms, were 0.8-mm larger ± 0.2 (mean ± standard deviation) with use of a 350-HU threshold to 1.0-mm smaller ± 0.7 with use of a 1380-HU threshold (73). This represented a total variation in the order of nearly two 1-mm-thick sections. Even with use of a very small range of attenuation thresholds (125–200 HU), the average difference in 3D model versus dry bone measurements of the vertebral body imaged in situ was 0.8 mm with one threshold and 1.5 mm with another threshold (49) (Table 3). The latter difference would likely complicate the fitting of, for example, a patient-specific cutting guide. The chosen imaging modality or protocol also affects accuracy—both directly, in terms of the achieved image contrast, and indirectly, in terms of segmentation. In one study (48), the models of dry mandibles created from CT images were more accurate (<0.9 mm for 95th percentile of measurements) than those created from ultrashort-echo MR images (<1.74 mm for 95th percentile of measurements) (Table 3).
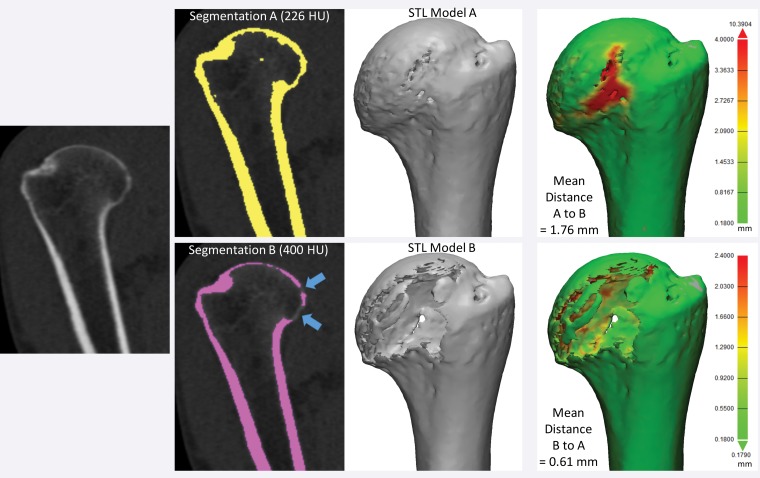
Figure 12 shows a humerus segmented from CT images by using two typically used thresholds: 226 HU for general CT bone segmentation and 400 HU, which is at the lower end of the range of attenuation values typically used for cortical bone segmentation (400–700 HU) (32,46). The two resultant models differ not only in dimension but also in shape, as part of the humeral head is missing with use of the higher threshold. Differences assessed by using STL distance measurements, even those determined with consideration of the entire model (as in Fig 8), do not encompass the morphologic difference between the models. At the most basic level, a comparison of dimensions will yield different results, depending on which models are compared with one another (Fig 12). The key problem in quantifying differences between tissue models derived from images is the difficulty in determining how to account for differences in their morphology and dimensions. This is the primary requirement for comparing the different segmentation methods and the different imaging modalities and protocols used to create a model of a given tissue.
Figure 12.
Humerus segmented from a CT image by using attenuation thresholds of 226 and 400 HU. The two resultant 3D models differ in shape, as the model segmented with the higher threshold is missing portions of the humeral head (blue arrows). Distance metrics (green models, far right) did not enable quantification of the difference between the two models; different average, minimal, and maximal distances were measured, depending on which model was being compared with another model.
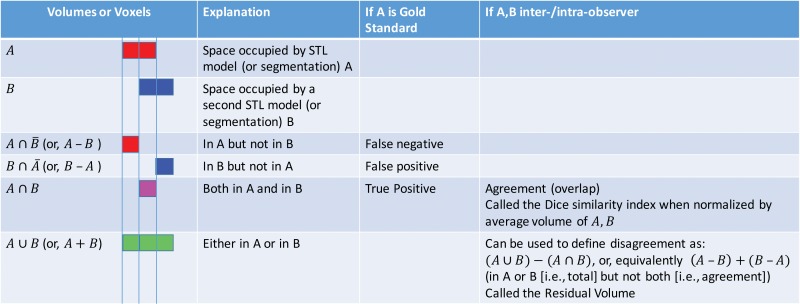
One solution to this problem originates in mathematical set theory. Segmented models of tissues can be considered subsets of 3D space—that is, the segmentation defines the subset of space believed to be occupied by the tissue. Mathematical set operations such as set intersection (A ∩ B) and set union (A ∪ B) can then be used on different models of a tissue, with each model then considered an individual subset of space, to quantify their differences and similarities. These and other operations relevant for 3D models are illustrated in Figure 13. They can be applied equally to discrete sets of image voxels that have been segmented (74) or applied directly to the volumes defined by the STL models generated from a segmentation (75). Use of the latter option enables a comparison of not only the segmentation methods but also the STL generation processes and any potential postprocessing steps performed, such as smoothing.
Figure 13.
Set theory operations that are useful for characterizing differences between models generated from images for 3D printing. The operations of volumes (or voxel collections) in set theory notation and shorthand (in parentheses), as well as visual color depictions of the volumes corresponding to the operations, are listed in the first (far left) column. For example, the volume of space (or voxels) belonging to model A is depicted in red, and that belonging to model B is depicted in blue.
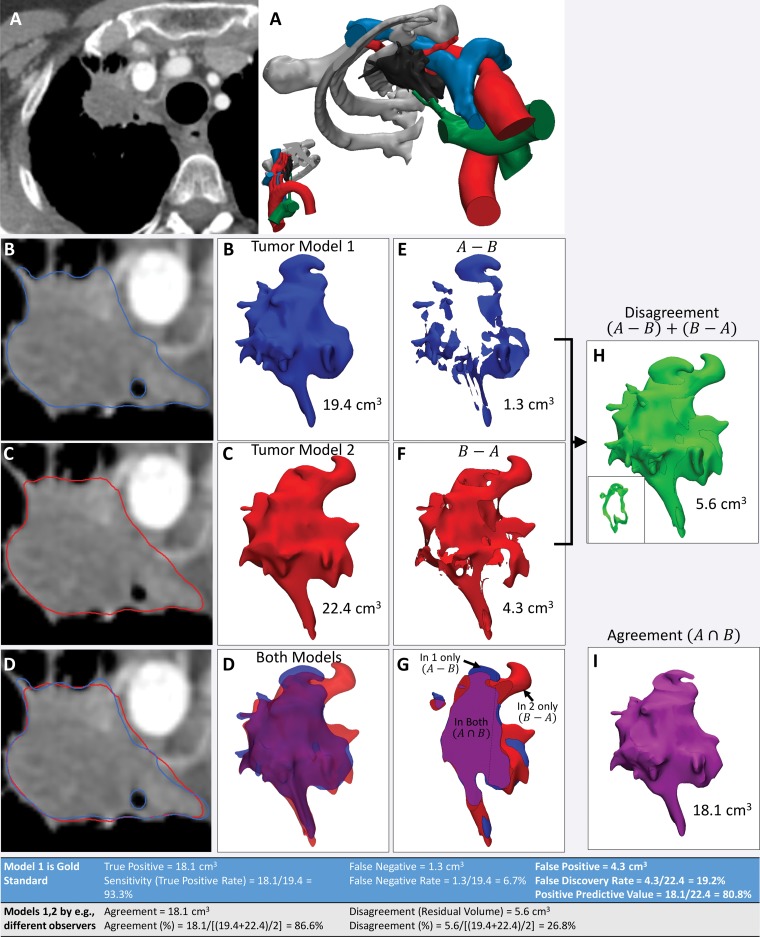
An example of the use of these operations on models of a lung apex tumor segmented from contrast-enhanced CT images by two observers is shown in Figure 14. This figure also shows how metrics such as agreement—that is, the volume occupied by both models (A ∩ B)—and disagreement—that is, the volume occupied by one but not both models, (A ∪ B) − (A ∩ B), are calculated from the results of these operations. When one model—for example, the model created by means of digitization of a cadaveric specimen or expert segmentation—is considered the reference standard, the parameters commonly used to characterize diagnostic accuracy can be derived from these operations. These parameters include (a) true-positive volume, which is the space thought to be occupied by the specified tissue according to the test model, as confirmed by using the reference-standard model; (b) false-positive volume, which is the space thought to be occupied by the specified tissue according to the test model but not according to the reference-standard model; and (c) false-negative volume, which is the space occupied by the specified tissue according to the reference-standard model but not believed to be part of the specified tissue according to the test model. It should be noted that defining a true-negative volume is not a straightforward process, as the volume of space that is negative for the presence of a tissue could be, for example, the entire imaging volume that is not occupied by the tissue in the reference-standard model or the entire organ containing the tissue, such as the liver in a model of a liver tumor. Because imaging coverages are arbitrary and a particular tissue within an organ (or organ in an image volume) is often a comparatively small portion of the whole organ—and similarly, an organ is often a small portion of the whole imaged volume—the true-negative rate will in most cases be arbitrary and lack clinical importance.
Figure 14.
Use of agreement and disagreement operations to compare different segmentation methods. A, Example assessment of similarities and differences in lung apex tumor models (right) derived from axial contrast-enhanced CT images (left). B, C, The tumor segmented by two independent readers (B and C, respectively) and seen on axial CT images (left) and 3D visualization models (right) is qualitatively different. D, Both models, seen superimposed on the axial CT image (left) and semitransparent 3D visualization models (right), are cut through the model in G. E, F, Morphologic operations are used to define differences quantitatively. For example, the model in, E, shows the tissue considered by one reader to be in the model, in disagreement with the interpretation of the second reader. The model in, F, shows the tissue considered by the second reader to be in the model, in disagreement with the interpretation of the first reader. H, I, Disagreement, H, and agreement, I, can be used to define diagnostic accuracy or reproducibility parameters (Table at bottom). The inset in, H, shows a section through the volume that it is empty where there is agreement.
The disagreement between two models, (A ∪ B) − (A ∩ B), termed the residual volume, is a particularly important metric, as it enables us to quantify differences between models created by using different workflows or parameters, including imaging and segmentation parameters. This is an important property of metrics used to assess 3D printed models, because radiologists involved in 3D printing are charged with the task of selecting an imaging technique with which the potential limitations, such as resolution, noise, and artifacts (eg, metal, motion), can be weighed against the accuracy and reproducibility of the tissue-segmenting process. For example, thin (eg, 0.5-mm) CT sections reconstructed with a bone kernel enable more accurate delineation of the bone, but noise can severely complicate segmentation (3). Here, a useful metric will enable one to answer two questions: (a) Does one imaging technique yield a model that is different from a model created by using an alternate imaging technique? and (b) Which of the two imaging techniques, if any, will reproducibly yield a sufficiently accurate model?
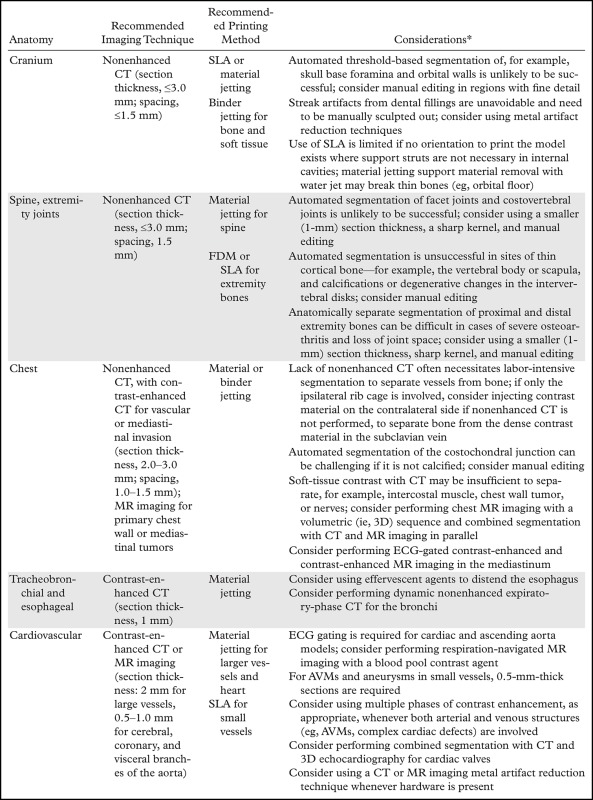
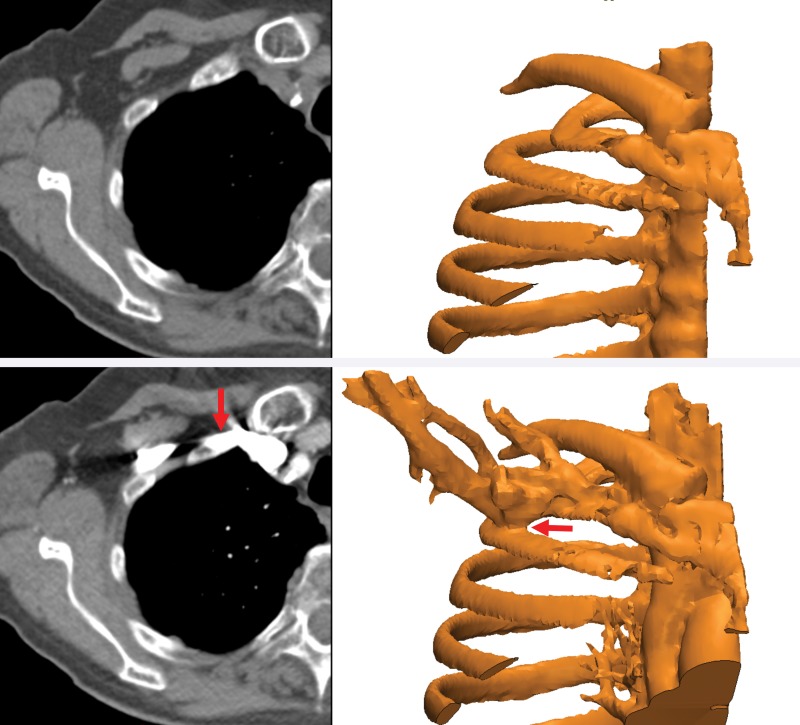
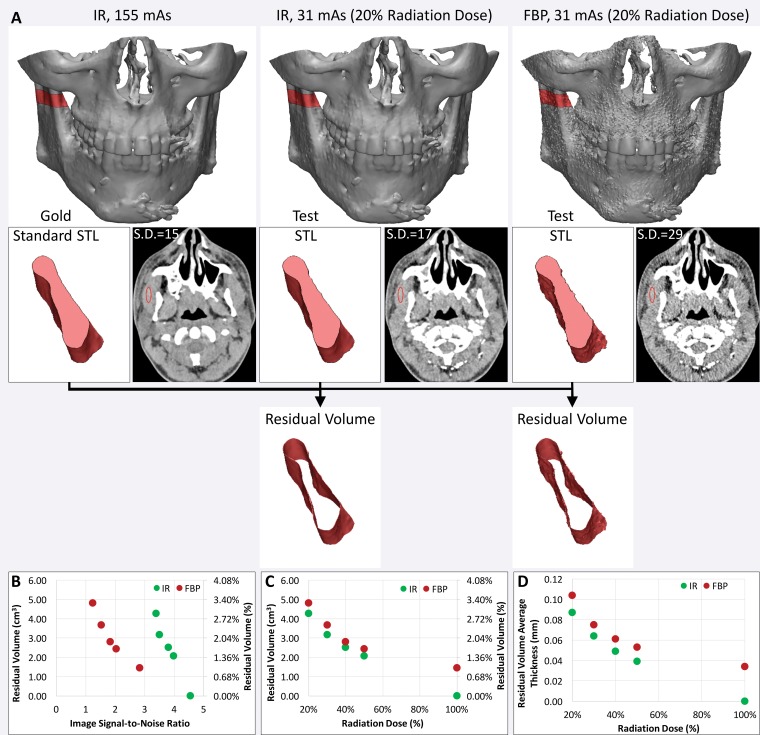
Such metrics will enable radiologists to systematically research ways to optimize imaging protocols and develop novel acquisition techniques to simplify accurate 3D printing. New techniques need to be developed and validated for many indications. These indications include delineating anatomy in the presence of metal artifact and enhancing tissue segmentation by leveraging multimodality imaging such as positron emission tomography combined with either CT or MR imaging. Many advancements will be based on radiologists’ knowledge and experience. An example is the use of effervescent agents with oral contrast material at CT, a technique typically used in fluoroscopy, to optimize the 3D printing of complex esophageal pathologic processes (76). Some of these considerations, gleaned from the 3D printing literature and our experience, are summarized in Table 5. Yet meticulous testing and systematic analysis will be required for other developments. For example, contrast material administration is necessary to maximize the vascular contrast-to-noise ratio at CT, but it hinders the accurate segmentation of bone and vasculature when they are in close proximity. One such example is that of high-density intravenously injected contrast material complicating segmentation of the ribs (Fig 15), or contrast-enhanced arteries complicating segmentation of the craniomaxillofacial bone. An additional nonenhanced CT acquisition would be ideal for creating a model that includes both bone and vasculature (77), but it is not indicated for clinical diagnostic purposes in most cases. Although the generation of virtual nonenhanced images and/or bone subtraction images from dual-energy CT is ideally suited for the creation of separate models of the bone and vasculature, it is not universally available. In one study (75), we used the residual volume to systematically assess a process for CT radiation dose reduction to accurately print bone. A reference-standard model was derived from CT images acquired at 155 mAs and reconstructed by using the manufacturer’s iterative reconstruction (IR) algorithm. The difference in residual volume between the reference-standard model and the STL models derived from CT images acquired with simulated 50%, 40%, 30%, and 20% radiation dose reductions and reconstructed with both IR and filtered back-projection reconstruction indicated that the maxillofacial bone can be successfully 3D printed from low–radiation-dose (31-mAs) IR images rather than higher-dose IR images, with only a small difference in dimensions (average bone thickness difference, <0.1 mm) (Fig 16). An unexpected finding of that study (75) was that the image signal-to-noise ratio was not necessarily a gauge of model accuracy, regardless of the reconstruction method used. The residual volumes with a given radiation dose were nearly equal for iterative and filtered back-projection reconstructions, despite the fact that the IR images had roughly twice the signal-to-noise ratio.
Table 5:
General Guidelines and Practical Considerations Regarding Imaging and Segmentation for Common 3D Printing Indications
*AVMs = arteriovenous malformations, ECG = electrocardiography.
Figure 15.
Segmentation complicated by contrast enhancement. Three-dimensional models of the ribs (right) were created from axial nonenhanced (top left) and contrast-enhanced (bottom left) CT images. The proximity of the subclavian vein, which is filled with high-density intravenously injected contrast material (bottom), precludes separation of the bone and vasculature (red arrows).
Figure 16.
Use of residual volume measurements to assess the CT radiation dose reduction process for 3D printing of bone. A, The residual volume is used to compare the effect of reducing the CT radiation dose with iterative reconstruction (IR) versus filtered back-projection (FBP) reconstruction for 3D printing of the maxillofacial bone. Top: The residual volume is the red shell around the bone on the reference-standard model derived from 155-mAs IR images (left), and on each test STL model derived from images acquired with a reduced radiation dose (middle and right). Bottom: A small portion of the mandible is shown in pink to aid in visualizing the residual volume. S.D. = standard deviation. B, C, Despite the higher signal-to-noise ratio of the IR images, B, calculated from the mean and standard deviation of the muscle attenuation (in Hounsfield units), the IR and FBP reconstruction performed quite similarly in terms of residual volume at all given reduced doses, C. D, The average thickness of the residual volume was calculated to quantify the average difference in the dimensions of the bone derived from each image dataset.
STL Model Generation and Postprocessing
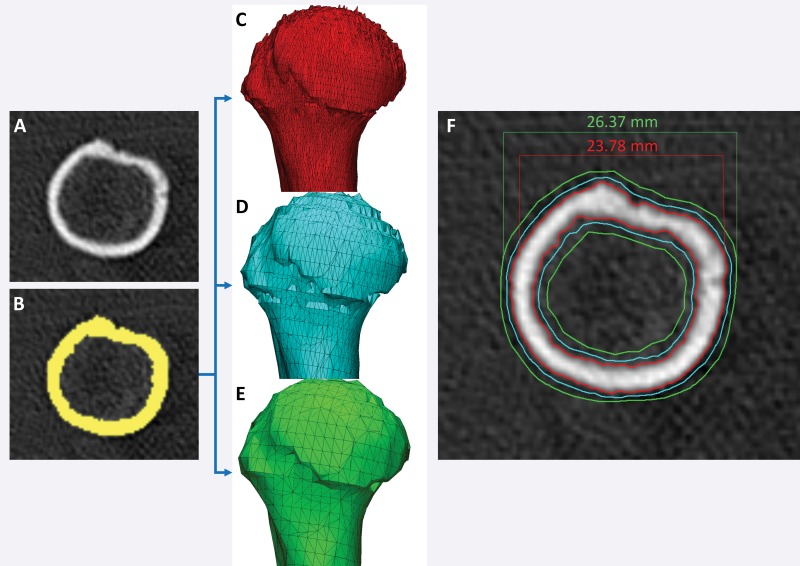
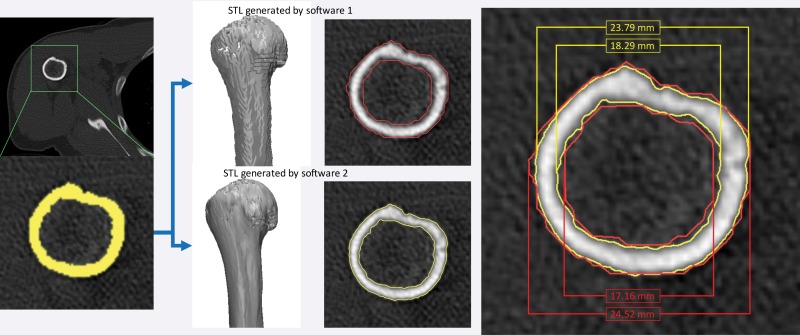
A factor that is often overlooked because it is unfamiliar to radiologists but that can adversely affect model accuracy is the algorithmic aspect of translating the segmented tissue into an STL model that a 3D printer recognizes. STL generation algorithms translate the collection of image voxels segmented to belong to a tissue into a surface composed of triangular patches that encloses those voxels. The 3D printer interprets STL models (not segmentations), fabricating them by laying material in the shape of cross sections of the STL model. STL generation algorithms are in the purview of computational geometry and should, in theory, be of little concern to the radiologist, much like the algorithms used to create maximum intensity projections or 3D volume renderings. However, because 3D printing technologies are not yet integrated into clinical software, they maintain engineering-oriented interfaces that provide access to a number of parameters that control their function and lay the burden of their appropriate selection on the imager. These parameters can adversely affect model accuracy to clinically relevant levels (Fig 17).
Figure 17.
Differences in models based on different parameters used to generate the STL model from a segmentation. A, B, Axial CT image of a humerus, A, segmented with a 400-HU attenuation threshold, B, yields three STL models created by using different setting options (optimal, C; medium, D; and low, E) with use of one software (Mimics 18.0; Materialise NV). C–F, Differences among the models are seen in terms of triangle counts, C–E, and are nearly 3 mm in size, F.
In a study of 15 femurs imaged in situ with CT, different STL generation algorithms yielded models with mean differences (compared with the dry bone) that ranged from 0.62 mm larger ± 0.49 (mean ± standard deviation) to as much as 3.1 mm larger ± 0.79 with use of a low-quality algorithm (55). Similar results have been reported for the lumbar vertebrae (49), with mean differences (compared with image-based measurements) ranging from 0.8 mm ± 0.3 to 2.6 mm ± 0.3 with different STL generation algorithms. To further complicate the process, the STL generation algorithms provided in different software produce different results from an identical segmentation, even when they are applied by using the provided default (eg, quality or resolution) parameters (Fig 18). With expertise, one can optimize the parameters of STL generation algorithms (eg, change the number of triangles in the STL model in Fig 17) and thus help to reduce the computation time for STL postprocessing manipulations such as hollowing (eg, to create a hollow vessel from a model of the contrast-enhanced blood pool). However, the parameters of the algorithm should not be altered to obtain a more pleasing result when creating a model—for example, to create a smoother model of bone from CT images reconstructed with a sharp bone kernel (Fig 17). In general, with current computer hardware, there is little reason to use a lower STL triangle count or quality setting than the maximal settings available, given the large potential inaccuracies that can be introduced. In every case, the resulting STL model should always be compared against the underlying images (eg, Figs 17, 18) to confirm fidelity.
Figure 18.
STL model generation algorithms provided in two software products (Mimics 18.0 and OsiriX [Pixmeo SARL, Bernex, Switzerland]). With both software products, axial CT images were loaded and identically segmented (yellow, lower left image) by using an attenuation threshold of 226 HU. The resulting STL models generated by using the default settings for each software differed by 0.73 mm for the external bone surface measurement and by 1.13 mm for the internal surface measurement.
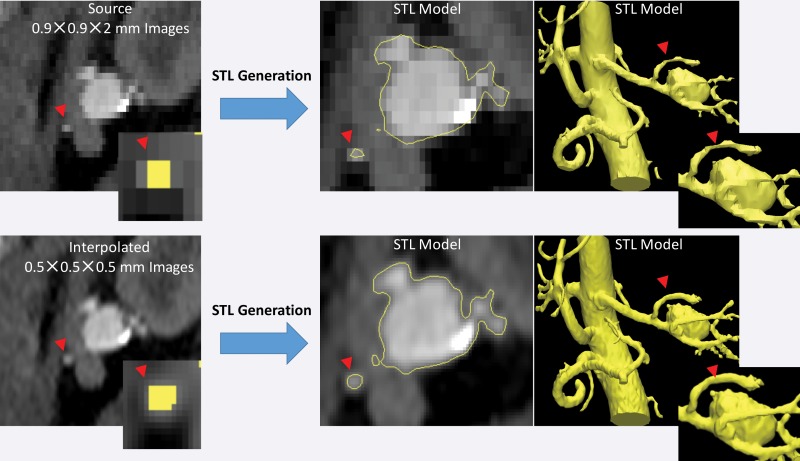
Another important aspect to recognize is that STL generation algorithms operate at the level of image voxels. Use of the techniques applied in these algorithms to produce a surface that encloses the segmented voxels can lead to undesirable results when the voxels are large (ie, when using lower–spatial-resolution images) or there is a large difference between the in-plane resolution and the section thickness (ie, “shoe box”–shaped voxels). When such voxels are segmented, the resulting STL models will contain blocky or flattened depicted tissues that do not correspond to the actual shape of the tissue, particularly in areas of thin bones and small vessels (Fig 19). Resampling a given set of images to a higher voxel count with use of simple linear interpolation without altering the underlying image information facilitates greater flexibility of the STL generation algorithm and in turn the generation of potentially more accurate results (Fig 19).
Figure 19.
STL models of a renal aneurysm derived from a CT angiogram. Top: The lumen on the STL model generated from a low–spatial-resolution CT angiogram is blocky and flattened for a small renal artery (arrowheads at top and bottom). The inset (far left) shows the segmented voxels for the artery in the yellow overlay. Bottom: The same CT angiogram interpolated to a higher voxel count (0.5-mm isotropic voxels) without alteration of the image information enables the STL generation algorithm to operate more optimally with identical thresholding segmentation and thus yields a more appropriate model of small arterial lumens.
Software Implications for Clinical Use
Unlike 3D printers, visualization software is within the scope of regulatory bodies (43). A number of FDA-cleared options are available and include 3D printing–specific software (eg, Mimics 18.0) and 3D visualization workstations that offer STL export (eg, Vitrea; Vital Images, Minnetonka, Minn). Lower-cost options, such as the FDA-cleared version of OsiriX (78), also exist. Free software such as 3D Slicer (Brigham and Women's Hospital, Boston, Mass) (79), which can also segment medical images and produce STL models, should be used with appropriately approved research study protocols only, rather than for routine daily clinical applications (80). It is unclear whether regulatory approval will be required for STL postprocessing software that is used, for example, to smooth and trim models, create hollow vessel models, and mirror the normal anatomy onto the side with a pathologic process. However, if patient-specific devices are being designed, this component will be part of the device production process and regulated as described earlier (43). One FDA-cleared STL postprocessing software solution is currently available (Materialise 3-matic).
Logistic Considerations
Portions of a model are often provided for use only as anatomic landmarks, for orientation; an example is a clavicle included in a model of a lung apex tumor. In these cases, the segmentation applied to create this landmark structure may not have been performed with the same diligence as that applied to create the remainder of the model. This should be clearly communicated to the end user—for example, by printing the clavicle in a color different from that of the remaining portions of the model. In addition, models ideally should be marked with patient identifiers to avoid mix-ups and with an identifier that indicates the side of the anatomy the given model represents.
Conclusion
Radiologists who create 3D printed models and clinical teams who use them are required to understand the various factors and pitfalls that can affect model accuracy and reproducibility. With use of existing 3D printing technologies and carefully validated workflows, each step of the process of printing 3D medical models can be performed with inaccuracies limited to less than typical imaging resolutions (<1 mm). However, in most cases, one or more of the steps involved in 3D printing is performed with limited accuracy and reproducibility; this is often due to inappropriate use of or overreliance on the underlying technologies. As illustrated in many of the examples described herein, use of validated or FDA-approved software does not guarantee model accuracy. The STL models designed to replicate each tissue should always be carefully reviewed against source images by the radiologist, and the printed model should always be inspected against the designed STL model before it is used clinically. Regular testing of printer accuracy and function with use of quality assurance phantoms is necessary. Those creating 3D models should initially validate the workflows to be used for clinical 3D printing, including the imaging protocols and techniques and the segmentation methods, against an appropriate reference standard by using the metrics described to test differences in dimension and morphology. Workflow modifications—for example, changes in imaging protocols or segmentation tools—can then be implemented in a stepwise fashion by using STL comparison metrics. A cache of cases with expertly developed STL models can be used with STL agreement and disagreement metrics to train and test the personnel involved in creating the models.
As more evidence accumulates in the literature and the use of 3D printing becomes more widespread, radiologists will need to be able to report their techniques and validate them by using appropriate accuracy and reproducibility metrics. This is a complex issue, with no single variable being representative of the comprehensive accuracy of 3D printed medical models for all indications. For those involved in clinical 3D printing, the metrics of 3D printed model accuracy described in this article can be used to establish and substantiate appropriate medical practice. Eventually, they will be used to enable the development of reporting guidelines. For those involved in clinical research, these metrics can be used to validate new and optimized imaging protocols and techniques that facilitate the faster, more accurate and reproducible segmentation that is necessary to effectively use 3D printing technologies in medical practice.
APPENDIX
Presented as an education exhibit at the 2015 RSNA Annual Meeting.
For this journal-based SA-CME activity, the author D.M. has provided disclosures (see “Disclosures of Conflicts of Interest”); all other authors, the editor, and the reviewers have disclosed no relevant relationships.
The views expressed in this article are those of the authors and do not necessarily reflect the official policy, position, or endorsement of the Department of the Navy or Army, Department of Defense, or the U.S. Government.
Supported by the National Institutes of Health and the National Institute of Biomedical Imaging and Bioengineering (EB015868).
Disclosures of Conflicts of Interest.— : D.M. Activities related to the present article: disclosed no relevant relationships. Activities not related to the present article: grants from Vital Images (a Toshiba Medical Systems Company) and Toshiba America Medical Systems. Other activities: disclosed no relevant relationships.
Abbreviations:
- FDA
- U.S. Food and Drug Administration
- FDM
- fused deposition modeling
- SLA
- stereolithography
- SLS
- selective laser sintering
- STL
- Standard Tessellation Language
- 3D
- three-dimensional
References
- 1.Mitsouras D, Liacouras P, Imanzadeh A, et al. Medical 3D printing for the radiologist. RadioGraphics 2015;35(7):1965–1988. [DOI] [PMC free article] [PubMed] [Google Scholar]
- 2.Giannopoulos AA, Steigner ML, George E, et al. Cardiothoracic applications of 3-dimensional printing. J Thorac Imaging 2016;31(5):253–272. [DOI] [PMC free article] [PubMed] [Google Scholar]
- 3.Matsumoto JS, Morris JM, Foley TA, et al. Three-dimensional physical modeling: applications and experience at Mayo Clinic. RadioGraphics 2015;35(7):1989–2006. [DOI] [PubMed] [Google Scholar]
- 4.Namba K, Higaki A, Kaneko N, Mashiko T, Nemoto S, Watanabe E. Microcatheter shaping for intracranial aneurysm coiling using the 3-dimensional printing rapid prototyping technology: preliminary result in the first 10 consecutive cases. World Neurosurg 2015;84(1):178–186. [DOI] [PubMed] [Google Scholar]
- 5.The world’s first 3D printed total jaw reconstruction . Xilloc website. http://www.xilloc.com/patients/stories/total-mandibular-implant/. Accessed September 20, 2016.
- 6.Wong KC, Kumta SM, Geel NV, Demol J. One-step reconstruction with a 3D-printed, biomechanically evaluated custom implant after complex pelvic tumor resection. Comput Aided Surg 2015;20(1):14–23. [DOI] [PubMed] [Google Scholar]
- 7.Aranda JL, Jiménez MF, Rodríguez M, Varela G. Tridimensional titanium-printed custom-made prosthesis for sternocostal reconstruction. Eur J Cardiothorac Surg 2015;48(4):e92–e94. [DOI] [PubMed] [Google Scholar]
- 8.Morrison RJ, Hollister SJ, Niedner MF, et al. Mitigation of tracheobronchomalacia with 3D-printed personalized medical devices in pediatric patients. Sci Transl Med 2015;7(285):285ra64. [DOI] [PMC free article] [PubMed] [Google Scholar]
- 9.Parthasarathy J. 3D modeling, custom implants and its future perspectives in craniofacial surgery. Ann Maxillofac Surg 2014;4(1):9–18. [DOI] [PMC free article] [PubMed] [Google Scholar]
- 10.Young BW. Major first!: FDA grants first 3D printed implant clearance. OPM in the News website. http://www.oxfordpm.com/major-first-fda-grants-first-3d-printed-implant-clearance. Accessed September 20, 2016. [Google Scholar]
- 11.Erickson DM, Chance D, Schmitt S, Mathis J. An opinion survey of reported benefits from the use of stereolithographic models. J Oral Maxillofac Surg 1999;57(9):1040–1043. [DOI] [PubMed] [Google Scholar]
- 12.Martelli N, Serrano C, van den Brink H, et al. Advantages and disadvantages of 3-dimensional printing in surgery: a systematic review. Surgery 2016;159(6):1485–1500. [DOI] [PubMed] [Google Scholar]
- 13.Liu YF, Xu LW, Zhu HY, Liu SS. Technical procedures for template-guided surgery for mandibular reconstruction based on digital design and manufacturing. Biomed Eng Online 2014;13:63. [DOI] [PMC free article] [PubMed] [Google Scholar]
- 14.Weinstock P, Prabhu SP, Flynn K, Orbach DB, Smith E. Optimizing cerebrovascular surgical and endovascular procedures in children via personalized 3D printing. J Neurosurg Pediatr doi: 10.3171/2015.3.PEDS14677. Published online July 31, 2015. [DOI] [PubMed]
- 15.Yang M, Li C, Li Y, et al. Application of 3D rapid prototyping technology in posterior corrective surgery for Lenke 1 adolescent idiopathic scoliosis patients. Medicine (Baltimore) 2015;94(8):e582. [DOI] [PMC free article] [PubMed] [Google Scholar]
- 16.Fasel JH, Beinemann J, Schaller K, Gailloud P. A critical inventory of preoperative skull replicas. Ann R Coll Surg Engl 2013;95(6):401–404. [DOI] [PMC free article] [PubMed] [Google Scholar]
- 17.Chang PS, Parker TH, Patrick CW, Jr, Miller MJ. The accuracy of stereolithography in planning craniofacial bone replacement. J Craniofac Surg 2003;14(2):164–170. [DOI] [PubMed] [Google Scholar]
- 18.Kondo K, Nemoto M, Masuda H, et al. Anatomical reproducibility of a head model molded by a three-dimensional printer. Neurol Med Chir (Tokyo) 2015;55(7):592–598. [DOI] [PMC free article] [PubMed] [Google Scholar]
- 19.Frölich AM, Spallek J, Brehmer L, et al. 3D printing of intracranial aneurysms using fused deposition modeling offers highly accurate replications. AJNR Am J Neuroradiol 2016;37(1):120–124. [DOI] [PMC free article] [PubMed] [Google Scholar]
- 20.Mathur M, Patil P, Bove A. The role of 3D printing in structural heart disease: all that glitters is not gold. JACC Cardiovasc Imaging 2015;8(8):987–988. [DOI] [PubMed] [Google Scholar]
- 21.Stumpel LJ. Deformation of stereolithographically produced surgical guides: an observational case series report. Clin Implant Dent Relat Res 2012;14(3):442–453. [DOI] [PubMed] [Google Scholar]
- 22.Russon M. 12 NHS hospitals using 3D-printed models to test implants before surgery. International Business Times website. http://www.ibtimes.co.uk/12-nhs-hospitals-using-3d-printed-models-test-implants-before-surgery-1462862. Published August 27, 2014. Accessed September 20, 2016. [Google Scholar]
- 23.Schweizer A, Mauler F, Vlachopoulos L, Nagy L, Fürnstahl P. Computer-assisted 3-dimensional reconstructions of scaphoid fractures and nonunions with and without the use of patient-specific guides: early clinical outcomes and postoperative assessments of reconstruction accuracy. J Hand Surg Am 2016;41(1):59–69. [DOI] [PubMed] [Google Scholar]
- 24.Gan Y, Ding J, Xu Y, Hou C. Accuracy and efficacy of osteotomy in total knee arthroplasty with patient-specific navigational template. Int J Clin Exp Med 2015;8(8): 12192–12201. [PMC free article] [PubMed] [Google Scholar]
- 25.Hu Y, Yuan ZS, Spiker WR, et al. A comparative study on the accuracy of pedicle screw placement assisted by personalized rapid prototyping template between pre- and post-operation in patients with relatively normal mid-upper thoracic spine. Eur Spine J 2016;25(6):1706–1715. [DOI] [PubMed] [Google Scholar]
- 26.Teeter MG, Kopacz AJ, Nikolov HN, Holdsworth DW. Metrology test object for dimensional verification in additive manufacturing of metals for biomedical applications. Proc Inst Mech Eng H 2015;229(1):20–27. [DOI] [PubMed] [Google Scholar]
- 27.3D Stereolithography Printers Tech Specs . 3D Systems website. https://www.3dsystems.com/sites/default/files/2017-05/3D-Systems_SLA_TECH_SPECS_USEN_2017.05.01_WEB.pdf. Accessed June 20, 2017.
- 28.O’Hara RP, Chand A, Vidilaya S, et al. Advanced 3D mesh manipulation in stereolithographic files and post-print processing for the manufacturing of patient-specific vascular flow phantoms. In: Zhang J, Cook TS, eds. Proceedings of SPIE: medical imaging 2016—PACS and imaging informatics: next generation and innovations. Vol 9789. Bellingham, Wash: International Society for Optics and Photonics, 2016; 978909. [DOI] [PMC free article] [PubMed] [Google Scholar]
- 29.El-Katatny I, Masood SH, Morsi YS. Error analysis of FDM fabricated medical replicas. Rapid Prototyp J 2010;16(1):36–43. [Google Scholar]
- 30.Harris BD, Nilsson S, Poole CM. A feasibility study for using ABS plastic and a low-cost 3D printer for patient-specific brachytherapy mould design. Australas Phys Eng Sci Med 2015;38(3):399–412. [DOI] [PubMed] [Google Scholar]
- 31.Ishida Y, Miyasaka T. Dimensional accuracy of dental casting patterns created by 3D printers. Dent Mater J 2016;35(2):250–256. [DOI] [PubMed] [Google Scholar]
- 32.Salmi M, Paloheimo KS, Tuomi J, Wolff J, Mäkitie A. Accuracy of medical models made by additive manufacturing (rapid manufacturing). J Craniomaxillofac Surg 2013;41(7):603–609. [DOI] [PubMed] [Google Scholar]
- 33.Braian M, Jimbo R, Wennerberg A. Production tolerance of additive manufactured polymeric objects for clinical applications. Dent Mater 2016;32(7):853–861. [DOI] [PubMed] [Google Scholar]
- 34.Taft RM, Kondor S, Grant GT. Accuracy of rapid prototype models for head and neck reconstruction. J Prosthet Dent 2011;106(6):399–408. [DOI] [PubMed] [Google Scholar]
- 35.Petropolis C, Kozan D, Sigurdson L. Accuracy of medical models made by consumer-grade fused deposition modelling printers. Plast Surg (Oakv) 2015;23(2):91–94. [DOI] [PMC free article] [PubMed] [Google Scholar]
- 36.Pang TH, Guertin MD, Nguyen HD. Accuracy of stereolithography parts: mechanism and modes of distortion for a “letter-H” diagnostic part. In: Proceedings of the Solid Freeform Fabrication Symposium, Austin, Texas, August 7–9, 1995; 170–180. [Google Scholar]
- 37.Doran SJ, Charles-Edwards L, Reinsberg SA, Leach MO. A complete distortion correction for MR images. I. Gradient warp correction. Phys Med Biol 2005;50(7):1343–1361. [DOI] [PubMed] [Google Scholar]
- 38.Martorelli M, Gerbino S, Giudice M, Ausiello P. A comparison between customized clear and removable orthodontic appliances manufactured using RP and CNC techniques. Dent Mater 2013;29(2):e1–e10. [DOI] [PubMed] [Google Scholar]
- 39.Mitsouras D, Lee TC, Liacouras P, et al. Three-dimensional printing of MRI-visible phantoms and MR image-guided therapy simulation. Magn Reson Med 2017;77(2):613–622. doi: 10.1002/mrm.26136. Published online February 11, 2016. [DOI] [PMC free article] [PubMed] [Google Scholar]
- 40.Engelke K, Libanati C, Liu Y, et al. Quantitative computed tomography (QCT) of the forearm using general purpose spiral whole-body CT scanners: accuracy, precision and comparison with dual-energy X-ray absorptiometry (DXA). Bone 2009;45(1):110–118. [DOI] [PubMed] [Google Scholar]
- 41.Whyms BJ, Vorperian HK, Gentry LR, Schimek EM, Bersu ET, Chung MK. The effect of computed tomographic scanner parameters and 3-dimensional volume rendering techniques on the accuracy of linear, angular, and volumetric measurements of the mandible. Oral Surg Oral Med Oral Pathol Oral Radiol 2013;115(5):682–691. [DOI] [PMC free article] [PubMed] [Google Scholar]
- 42.3D point cloud and mesh processing software open source project . CloudCompare website. http://www.danielgm.net/cc/. Accessed June 11, 2016.
- 43.Di Prima M, Coburn J, Hwang D, Kelly J, Khairuzzaman A, Ricles L. Additively manufactured medical products: the FDA perspective. 3D Print Med 2016;2(1). [DOI] [PMC free article] [PubMed] [Google Scholar]
- 44.Barker TM, Earwaker WJ, Lisle DA. Accuracy of stereolithographic models of human anatomy. Australas Radiol 1994;38(2):106–111. [DOI] [PubMed] [Google Scholar]
- 45.Ibrahim D, Broilo TL, Heitz C, et al. Dimensional error of selective laser sintering, three-dimensional printing and PolyJet models in the reproduction of mandibular anatomy. J Craniomaxillofac Surg 2009;37(3):167–173. [DOI] [PubMed] [Google Scholar]
- 46.Choi JY, Choi JH, Kim NK, et al. Analysis of errors in medical rapid prototyping models. Int J Oral Maxillofac Surg 2002;31(1):23–32. [DOI] [PubMed] [Google Scholar]
- 47.Silva DN, Gerhardt de Oliveira M, Meurer E, Meurer MI, Lopes da Silva JV, Santa-Bárbara A. Dimensional error in selective laser sintering and 3D-printing of models for craniomaxillary anatomy reconstruction. J Craniomaxillofac Surg 2008;36(8):443–449. [DOI] [PubMed] [Google Scholar]
- 48.van Eijnatten M, Rijkhorst EJ, Hofman M, Forouzanfar T, Wolff J. The accuracy of ultrashort echo time MRI sequences for medical additive manufacturing. Dentomaxillofac Radiol 2016;45(5):20150424. [DOI] [PMC free article] [PubMed] [Google Scholar]
- 49.Ogden KM, Aslan C, Ordway N, Diallo D, Tillapaugh-Fay G, Soman P. Factors affecting dimensional accuracy of 3-D printed anatomical structures derived from CT data. J Digit Imaging 2015;28(6):654–663. [DOI] [PMC free article] [PubMed] [Google Scholar]
- 50.Wu XB, Wang JQ, Zhao CP, et al. Printed three-dimensional anatomic templates for virtual preoperative planning before reconstruction of old pelvic injuries: initial results. Chin Med J (Engl) 2015;128(4):477–482. [DOI] [PMC free article] [PubMed] [Google Scholar]
- 51.Pinto JM, Arrieta C, Andia ME, et al. Sensitivity analysis of geometric errors in additive manufacturing medical models. Med Eng Phys 2015;37(3):328–334. [DOI] [PubMed] [Google Scholar]
- 52.Fourie Z, Damstra J, Schepers RH, Gerrits PO, Ren Y. Segmentation process significantly influences the accuracy of 3D surface models derived from cone beam computed tomography. Eur J Radiol 2012;81(4):e524–e530. [DOI] [PubMed] [Google Scholar]
- 53.Santana RR, Lozada J, Kleinman A, Al-Ardah A, Herford A, Chen JW. Accuracy of cone beam computerized tomography and a three-dimensional stereolithographic model in identifying the anterior loop of the mental nerve: a study on cadavers. J Oral Implantol 2012;38(6):668–676. [DOI] [PubMed] [Google Scholar]
- 54.Bowers ME, Trinh N, Tung GA, Crisco JJ, Kimia BB, Fleming BC. Quantitative MR imaging using “LiveWire” to measure tibiofemoral articular cartilage thickness. Osteoarthritis Cartilage 2008;16(10):1167–1173. [DOI] [PMC free article] [PubMed] [Google Scholar]
- 55.Gelaude F, Vander Sloten J, Lauwers B. Accuracy assessment of CT-based outer surface femur meshes. Comput Aided Surg 2008;13(4):188–199. [DOI] [PubMed] [Google Scholar]
- 56.Liang X, Lambrichts I, Sun Y, et al. A comparative evaluation of cone beam computed tomography (CBCT) and multi-slice CT (MSCT). II. On 3D model accuracy. Eur J Radiol 2010;75(2):270–274. [DOI] [PubMed] [Google Scholar]
- 57.Berry E, Brown JM, Connell M, et al. Preliminary experience with medical applications of rapid prototyping by selective laser sintering. Med Eng Phys 1997;19(1):90–96. [DOI] [PubMed] [Google Scholar]
- 58.Frühwald J, Schicho KA, Figl M, Benesch T, Watzinger F, Kainberger F. Accuracy of craniofacial measurements: computed tomography and three-dimensional computed tomography compared with stereolithographic models. J Craniofac Surg 2008;19(1):22–26. [DOI] [PubMed] [Google Scholar]
- 59.Wu AM, Shao ZX, Wang JS, et al. The accuracy of a method for printing three-dimensional spinal models. PLoS One 2015;10(4):e0124291. [DOI] [PMC free article] [PubMed] [Google Scholar]
- 60.Waran V, Devaraj P, Hari Chandran T, et al. Three-dimensional anatomical accuracy of cranial models created by rapid prototyping techniques validated using a neuronavigation station. J Clin Neurosci 2012;19(4):574–577. [DOI] [PubMed] [Google Scholar]
- 61.Ionita CN, Mokin M, Varble N, et al. Challenges and limitations of patient-specific vascular phantom fabrication using 3D Polyjet printing. Proc SPIE Int Soc Opt Eng 2014;9038:90380M. [DOI] [PMC free article] [PubMed] [Google Scholar]
- 62.Xu WH, Liu J, Li ML, Sun ZY, Chen J, Wu JH. 3D printing of intracranial artery stenosis based on the source images of magnetic resonance angiograph. Ann Transl Med 2014;2(8):74. [DOI] [PMC free article] [PubMed] [Google Scholar]
- 63.Biglino G, Verschueren P, Zegels R, Taylor AM, Schievano S. Rapid prototyping compliant arterial phantoms for in-vitro studies and device testing. J Cardiovasc Magn Reson 2013;15:2. [DOI] [PMC free article] [PubMed] [Google Scholar]
- 64.Baeck K, Lopes P, Biglino G, Capelli C, Verschueren P. State of the art in 3D printing of compliant cardiovascular models: HeartPrint—material characterization of HeartPrint models and comparison with arterial tissue properties. In: Proceedings of the 3rd Joint Workshop on New Technologies for Computer/Robot Assisted Surgery. Verona, Italy, September 11–13, 2013. [Google Scholar]
- 65.Ripley B, Kelil T, Cheezum MK, et al. 3D printing based on cardiac CT assists anatomic visualization prior to transcatheter aortic valve replacement. J Cardiovasc Comput Tomogr 2016;10(1):28–36. [DOI] [PMC free article] [PubMed] [Google Scholar]
- 66.Cai T, Ripley BA, Cheezum M, et al. Accuracy of 3D printed models of the aortic valve complex for transcatheter aortic valve replacement (TAVR) planning: comparison to computed tomographic angiography (CTA) [abstr]. In: Radiological Society of North America Scientific Assembly and Annual Meeting Program. Oak Brook, Ill: Radiological Society of North America, 2015; 281. [Google Scholar]
- 67.Anderson JR, Thompson WL, Alkattan AK, et al. Three-dimensional printing of anatomically accurate, patient specific intracranial aneurysm models. J Neurointerv Surg 2016;8(5):517–520. [DOI] [PubMed] [Google Scholar]
- 68.Håkansson A, Rantatalo M, Hansen T, Wanhainen A. Patient specific biomodel of the whole aorta: the importance of calcified plaque removal. Vasa 2011;40(6):453–459. [DOI] [PubMed] [Google Scholar]
- 69.Koleilat I, Jaeggli M, Ewing JA, Androes M, Simionescu DT, Eidt J. Interobserver variability in physician-modified endograft planning by comparison with a three-dimensional printed aortic model. J Vasc Surg 2016;64(6):1789–1796. [DOI] [PubMed] [Google Scholar]
- 70.Maragiannis D, Jackson MS, Igo SR, et al. Replicating patient-specific severe aortic valve stenosis with functional 3D modeling. Circ Cardiovasc Imaging 2015;8(10):e003626. [DOI] [PubMed] [Google Scholar]
- 71.Olivieri LJ, Krieger A, Loke YH, Nath DS, Kim PC, Sable CA. Three-dimensional printing of intracardiac defects from three-dimensional echocardiographic images: feasibility and relative accuracy. J Am Soc Echocardiogr 2015;28(4):392–397. [DOI] [PubMed] [Google Scholar]
- 72.Huotilainen E, Jaanimets R, Valášek J, et al. Inaccuracies in additive manufactured medical skull models caused by the DICOM to STL conversion process. J Craniomaxillofac Surg 2014;42(5):e259–e265. [DOI] [PubMed] [Google Scholar]
- 73.Naitoh M, Kubota Y, Katsumata A, Ohsaki C, Ariji E. Dimensional accuracy of a binder jet model produced from computerized tomography data for dental implants. J Oral Implantol 2006;32(6):273–276. [DOI] [PubMed] [Google Scholar]
- 74.Arrieta C, Uribe S, Ramos-Grez J, et al. Quantitative assessments of geometric errors for rapid prototyping in medical applications. Rapid Prototyp J 2012;18(6):431–442. [Google Scholar]
- 75.Cai T, Rybicki FJ, Giannopoulos A, et al. The residual STL volume as a metric to evaluate accuracy and reproducibility of anatomic models for 3D printing: application in the validation of 3D printable models of maxillofacial bone from reduced radiation dose CT images. 3D Print Med 2015;1(2). [DOI] [PMC free article] [PubMed] [Google Scholar]
- 76.Dickinson KJ, Matsumoto J, Cassivi SD, et al. Individualizing management of complex esophageal pathology using three-dimensional printed models. Ann Thorac Surg 2015;100(2):692–697. [DOI] [PubMed] [Google Scholar]
- 77.Soga S, Pomahac B, Wake N, et al. CT angiography for surgical planning in face transplantation candidates. AJNR Am J Neuroradiol 2013;34(10):1873–1881. [DOI] [PMC free article] [PubMed] [Google Scholar]
- 78.OsiriX: the world famous DICOM viewer . Osirix website. http://www.osirix-viewer.com/. Accessed June 12, 2016.
- 79.Slicer 4.6 released . 3D Slicer website. https://www.slicer.org/. Accessed June 12, 2016.
- 80.Cheng GZ, San Jose Estepar R, Folch E, Onieva J, Gangadharan S, Majid A. Three-dimensional printing and 3D slicer: powerful tools in understanding and treating structural lung disease. Chest 2016;149(5):1136–1142. [DOI] [PMC free article] [PubMed] [Google Scholar]
Associated Data
This section collects any data citations, data availability statements, or supplementary materials included in this article.


