

Abstract
Gastric adenocarcinoma (GA) is the third leading cause of cancer-related death worldwide, but no models exist to readily investigate distant metastases which are mainly responsible for mortality in this disease. Here we report the development of a genetically engineered mouse model of GA tumorigenesis based on KrasG12D expression plus inactivation of E-cadherin (Cdh1) and p53 in the gastric parietal cell lineage. Intestinal and diffuse gastric tumors arise rapidly in this model, which displays a median survival of 76 days. Tumors occur throughout the stomach with metastases documented in lymph nodes, lung and liver. Mice otherwise identical but retaining one wild-type Cdh1 allele exhibited longer survival with only 20% penetrance of invasive tumors and no apparent lung or liver metastases. Notably, increased RAS activity and downstream MAPK signaling was observed in stomachs only when E-cadherin was absent. This model offers a valuable tool to investigate GA subtypes where RAS/MAPK pathway activation and E-cadherin attenuation are common.
Keywords: Gastric Cancer, KRAS, p53, E-cadherin, β-catenin
INTRODUCTION
Each year there are one million cases of gastric cancer worldwide and over 700,000 deaths making it the fifth most common cancer and the third leading cause of cancer deaths (1). Gastric adenocarcinomas (GAs) comprise the majority of gastric cancers. Except in a few countries where there is endoscopic screening for GA, the majority of patients present with advanced or metastatic disease (2). Overall survival for patients with metastatic disease is 3–5 months with best supportive care. The response rate to multi-agent chemotherapy is 50% or greater, but nearly all patients develop chemotherapy resistance, and median survival is extended only to 9–11 months (3).
In 1965, Lauren described two distinct histological types of GAs: intestinal and diffuse (4). More recently, a third category referred to as “mixed-type” has been added to the Lauren classification to include neoplasms with both intestinal- and diffuse-type characteristics (5). The intestinal type exhibits components of glandular, solid, or intestinal architecture as well as tubular structures. The diffuse type demonstrates single cells or poorly cohesive cells infiltrating the gastric wall, and progressive disease can ultimately lead to linitis plastica (a.k.a. leather bottle stomach). The tumor suppressor p53 (TP53) is altered in about 50% of GAs, with these alterations more common in intestinal than diffuse tumors (6,7). The diffuse type is often characterized by loss of E-cadherin, encoded by the CDH1 gene, due to mutation or hypermethylation. A germline mutation in CDH1 leads to a lifetime risk of hereditary diffuse gastric cancer of over 80% (8).
Current animal models of GA have long latency periods and do not adequately recapitulate advanced disease because of the lack of disseminated metastatic disease or the presence of metastasis only to regional nodes (9). To further our understanding of the cellular and molecular mechanisms underlying GA progression and to develop new treatments for GA, there is a need for a better mouse model that more closely phenocopies advanced human GA.
A previously published mouse model of GA was generated by conditional deletion of E-cadherin (Cdh1) and p53 (Trp53) driven by ATP4B-Cre, expressed exclusively in the gastric parietal cell lineage, including pre-parietal cells. Invasive GA was detected in 25% of these mice at 9 months with 40% of mice developing metastasis to regional lymph nodes at one year (10). Molecular characterization of GA patient samples by TCGA network identified other mutations in these tumors including 60% of patient samples harboring alterations in the RTK/Ras signaling pathway. The EGFR family (EGFR, ERBB2, ERBB3 and ERBB4) was amplified or mutated in 44% of these cases and KRAS amplified or mutated in 6% or 11% of cases, respectively with the vast majority of KRAS mutations in codon 12 or 13 (6,7). Based on these data, we investigated the contribution of oncogenic Kras to the progression of GA. We generated a mouse model of GA driven by gastric parietal cell lineage-specific (Atp-4b-Cre) expression of oncogenic KRAS (LSL-KrasG12D) combined with loss of E-cadherin (Cdh1fl/fl), loss of p53 (Trp53fl/fl), and expression of a yellow fluorescent protein (YFP) reporter allele (Rosa26LSL-YFP) and refer to this model as triple conditional (Tcon) mice.
Expression of oncogenic Kras and loss of Trp53 in mice is sufficient for rapid tumorigenesis in most tissues as has been shown by mouse models of lung cancer (11), pancreatic ductal adenocarcinoma (12), squamous cell carcinoma (13), acute myeloid leukemia (14), and undifferentiated pleomorphic sarcoma (15,16). To determine if oncogenic Kras and Trp53 loss is sufficient for gastric tumorigenesis, we also generated mice with oncogenic Kras and loss of Trp53 but included one wild-type allele of E-cadherin and refer to this model as double conditional E-cadherin heterozygous mice (Dcon-E-cad het). Here we show that 100% of our Tcon mice develop mixed-type gastric tumors with a median survival of 76 days. Both intestinal and diffuse GA tumors are observed throughout the stomach as well as YFP+ metastases to nodes, lung, and liver. In contrast, mice with KrasG12D, p53 loss and a single copy of Cdh1 (Dcon-E-cad het) only 20% of mice developed invasive GA with median survival of these tumor bearing mice increased to 123 days with no gross lung or liver metastases. Our data show increased KRAS activity and MAPK signaling in stomach tumors isolated from Tcon mice as compared to stomachs isolated from Dcon-Ecad het mice.
MATERIALS AND METHODS
Animals
The University of Pennsylvania Animal Care and Use Committee approved all animal studies. Tcon mice were generated by cross breeding B6.FVB-Tg-Cdh1fl/f (N1) (17) (from The Jackson Laboratory, #005319), B6.129-Tg-LSL-KrasG12D(18);Trp53fl/fl (N10)(19) (from Dr. Tyler Jacks, MIT), and B6.129-Tg(Rosa26LSL-YFP) (20) (from Dr. Ben Stanger, University of Pennsylvania School of Medicine) conditional mutants with B6.129-Tg-Atp4b-Cre (21) transgenic mice (from the Gordon Laboratory, Washington University in St. Louis). For survival analysis, end point was reached at natural death or humane euthanasia at loss of 20% maximum body weight. To account for the mixed background, ten independent breeding pairs were utilized, each contributing two sibling pairs of Tcon and Dcon-Ecad het (Atp4b-Cre;Cdh1;Trp53;Rosa26LSL-YFP) mice. Ten of the Tcon mice from this cohort were analyzed for metastases. For analysis of gastric cancer progression, 5 Tcon and Tcon-Cre negative (Cdh1fl/fl; LSL-KrasG12D; Trp53fl/fl; Rosa26LSL-YFP) matched control mice were sacrificed at 3, 6, and 9 weeks. To account for mixed background, five independent sets of Tcon and Tcon-Cre negative control mice were used from five independent breeding pairs. Treatment of Tcon mice with a MEK inhibitor (PD0325901, APExBIO) was initiated in 4-week-old mice. The drug was administered ad libitum in the mouse chow (Purina 5010) at 7 mg/kg (incorporation by Research Diets Inc.). For Dcon-Ecad het mice, endpoint was reached at natural death or humane euthanasia at loss of 20% maximum body weight. Some animals required humane euthanasia for subcutaneous tumor burden > 2 cm3 and were censored in the survival analysis. To account for the mixed background, at least 10 independent breeding pairs were utilized in generating the cohorts.
Histology and Immunofluorescence
Tissues were dissected from indicated mice, fixed in 10% formalin in phosphate buffered saline (PBS), dehydrated, embedded in paraffin, sectioned at 5 um and stained with hematoxylin and eosin (H&E). For immunofluorescence, sections were de-waxed, rehydrated and antigen retrieval was performed in a 2100 Retriever (Aptum Biologics Ltd.) using Antigen Unmasking Solution (Vector Labs), and permeabilized with 0.2% Triton-X in PBS. Sections were incubated with non-mouse primary antibodies including: anti-GFP (#AB13970; 1:1000); E-cadherin (BD610181; 1:1000); β-catenin (CST8480; 1:100) in 10% goat serum and 1% bovine serum albumin in PBS overnight. When a mouse derived primary antibody was used, sections were washed, blocked with Streptavidin/Biotin Blocking Kit (Vector Labs), and hybridized to mouse primary antibody using the Mouse on Mouse (M.O.M.) Basic Kit (Vector Labs). Sections were washed then incubated with secondary antibodies including: anti-Chicken Alexa Fluor488 (A-11039); AlexaFluor555-conjugated Streptavidin (S-21381), anti-Rabbit Alexa Fluor 647 (A-21244) in 1% bovine serum albumin in PBS for 2 hours, and mounted with Fluor-Gel II with DAPI (Electron Microscopy Sciences). Bright field and epifluorescence images were acquired on a Leica DMI6000B microscope and processed using the LAS-AF software or a Zeiss Axio Imager.M2 microscope and processed using the ZEN2 software. Confocal images were acquired on a Leica TCS SP5 laser scanning confocal microscope and processed using the LAS-AF software.
Cell Line Derivation and Tumor Formation
Multiple tumors were harvested from independent mice (n=4–6) that had reached the humane end-point of 20% maximum body weight loss and minced under sterile conditions. Tissue pieces were digested in collagenase II (2.5 mg/mL, Worthington) and DNase (0.5 mg/mL, Worthington) in HBSS (Gibco) at 37°C for 45 minutes. Excess Fetal Bovine Serum (FBS, Hyclone) was added to quench enzymes and digested tissue was pelleted by centrifugation. Pellet was resuspended and plated in normal growth medium: Advanced DMEM (Cellgro) + 10% FBS + Penicillin/Streptomycin (Lonza) + L-glutamine (Gibco). Adherent cells were washed with phosphate buffered saline (PBS, Sigma) and medium replaced 24 hours later. Multiple gastric cancer cell lines from independent mice were sub-cultured for several passages prior to use. Gastric cancer cell lines were generated from gastric tumors harvested from 4 different Tcon transgenic mice and gastric cell lines generated from the stomachs of 3 different Dcon-E-cadherin heterozygous mice. Cell lines were generated from gastric tumors between November 8, 2014 and May 13, 2015 and were used for experiments between passages 3–8. Cell lines were tested for Mycoplasma via PCR using the Universal Mycoplasma Detection Kit (ATCC) after each cell line was established in culture. To generate flank tumors, gastric cancer cell lines were harvested with 0.25% Trypsin (Invitrogen), quenched with excess medium, washed with PBS, and injected subcutaneously in the flank at 5×10⁶ cells per 0.1 cc PBS per mouse. Tumors were measured every 2–3 days using digital calipers (Fisher) and tumor volume calculated as (0.5)*(width2)*(length). For experimental model of metastasis, one gastric cancer cell line was inoculated subcutaneously into the flanks and flank tumors were resected under sterile conditions when tumor volumes were approximately 500 mm3. Mice were euthanized and lung tissue analyzed for metastasis three weeks post resection.
RNA isolation
Glandular stomachs were dissected from indicated mice, homogenized using a gentleMACS Dissociator with M tubes (Miltenyi Biotec) in QIAzol Lysis Reagent (Qiagen), and RNA isolation performed using the RNeasy Microarray Tissue Mini Kit with optional DNase treatment (Qiagen) according to the manufacturers protocols. Quantification of total RNA was performed on a NanoDrop (Thermo Fisher Scientific).
Quantitative Real-Time Polymerase Chain Reaction (qPCR)
Complementary DNA (cDNA) was synthesized using the High Capacity cDNA Reverse Transcription Kit (Thermo Fisher Scientific) and qPCR was performed on a ViiA 7 Real-Time PCR System (Thermo Fisher Scientific) using SYBR Green PCR Master Mix (Thermo Fisher Scientific) according to the manufacturers direction. Amplifications were performed as technical quadruplicates and biological sextuplicates. Values were normalized to HPRT expression. Mouse gene-specific primers were selected from Primer Bank (22–24) and include the following: Hprt (5′-TCAGTCAACGGGGGACATAAA, 5′-GGGGCTGTACTGCTTAACCAG, 142 bp, ID#7305155a1); Myc (5′-ATGCCCCTCAACGTGAACTTC, 5′-CGCAACATAGGATGGAGAGCA, 228 bp, ID#27545183a1); Ccnd1 (5′-GCGTACCCTGACACCAATCTC, 5′-CTCCTCTTCGCACTTCTGCTC, 183 bp, ID#6680868a1); MMP7 (5′-CTGCCACTGTCCCAGGAAG, 5′-GGGAGAGTTTTCCAGTCATGG, 175 bp, ID#6754716a1); Axin2 (5′-TGACTCTCCTTCCAGATCCCA, 5′-TGCCCACACTAGGCTGACA, 105 bp, ID#31982733a1); Lef1 (5′-TGTTTATCCCATCACGGGTGG, 5′-CATGGAAGTGTCGCCTGACAG, 67 bp, ID#27735019a1); CD44v1 (5′-CACCATTGCCTCAACTGTGC, 5′-TTGTGGGCTCCTGAGTCTGA, 116 bp, ID#6491804a1).
Microarray Target Preparation and Hybridization
The UPENN Molecular Profiling Facility provided microarray services, including quality control tests of the total RNA samples by Agilent Bioanalyzer and Nanodrop spectrophotometry. All protocols were conducted as described in the Affymetrix WT Plus Reagent Kit Manual and the Affymetrix GeneChip Expression Analysis Technical Manual. Briefly, 250ng of total RNA was converted to first-strand cDNA using reverse transcriptase primed by poly(T) and random oligomers that incorporated the T7 promoter sequence. Second-strand cDNA synthesis was followed by in vitro transcription with T7 RNA polymerase for linear amplification of each transcript, and the resulting cRNA was converted to cDNA, fragmented, assessed by Bioanalyzer, and biotinylated by terminal transferase end labeling. Five and a half micrograms of labeled cDNA were added to Affymetrix hybridization cocktails, heated at 99°C for 5 min and hybridized for 16 h at 45°C to Mouse Transcriptome 1.0 ST GeneChips (Affymetrix Inc., Santa Clara CA) using the GeneChip Hybridization oven 645. The microarrays were then washed at low (6X SSPE) and high (100mM MES, 0.1M NaCl) stringency and stained with streptavidin-phycoerythrin. Fluorescence was amplified by adding biotinylated anti-streptavidin and an additional aliquot of streptavidin-phycoerythrin stain. A GeneChip 3000 7G scanner was used to collect fluorescence signal. Affymetrix Command Console and Expression Console were used to quantitate expression levels for targeted genes; default values provided by Affymetrix were applied to all analysis parameters. Microarry data have been deposited in the ArrayExpress database at EMBL-EBI (www.ebi.ac.uk/arrayexpress)under accession number E-MTAB-5833.
Principle Component Analysis and Hierarchical Clustering
Principle Component Analysis was performed using Expression Console Software (Affymetrix). The Penn Genomic Analysis Core Bioinformatics group performed unsupervised hierarchical clustering of Tcon and Dcon-Ecad het stomach tissue expression data using Partek Genomics Suite (Partek Inc).
Gene Set Overlap Analysis
The Penn Genomic Analysis Core Bioinformatics group determined differentially expressed genes using the Significance Analysis of Microarrays algorithm (25) with a FDR q-value cut-off of 5% and a fold-change cut-off of 2. Differentially expressed mouse genes were manually mapped to their human homologs using the HomoloGene database (http://www.ncbi.nlm.nih.gov/homologene) from the National Center for Biotechnology Information (NCBI)(26). Gene set overlaps were computed for gene lists using the Investigate Gene Sets function (http://software.broadinstitute.org/gsea/msigdb/annotate.jsp) on the Gene Set Enrichment Analysis page of the Broad Institute (27).
Western Blot
Glandular stomachs were dissected from indicated mice and homogenized using a gentleMACS Dissociator with M tubes (Miltenyi Biotec) in radioimmunoprecipitation assay buffer (RIPA, 50 mM Tris HCl pH 8, 150 mM NaCl, 1% Triton-X, 0.5% sodium deoxycholate and 0.1% SDS) with Complete Protease Inhibitor Cocktail Tablets (Roche 11697498001) and PhosSTOP (Roche 04906845001). Homogenates were incubated at 4°C for 30 minutes, centrifuged at 16,000xg at 4°C for 30 minutes, supernatants were collected and quantified using Pierce BCA Protein Assay Kit (ThermoFisher 23225). SDS-PAGE was performed using 20 ug protein per sample at 150V on 12% gels with transfer to nitrocellulose membranes performed at 110V for 2 hours using the Bio-Rad Mini Protean Tetra Cell and Mini Trans-Blot systems and reagents according to the manufactures instructions. Blots were blocked in 5% non-fat dry milk (LabScientific M-0841) or BSA (Sigma A7906) in TBS (Bio-Rad 161-0771) and incubated with primary antibody at 4°C overnight diluted in blocking buffer including: MEK1/2 (CST4694, 1:1000) and p-MEK1/2 (S217/221; CST9154, 1:1000).
After washing with TBS+0.1%Tween 20 (TBS-T, Bio-Rad 170-6531) blots were incubated with secondary antibody including: anti-rabbit IgG, HRP-linked (CST7074) and anti-mouse IgG, HRP-linked (CST7076) for 2 hours at room temperature in blocking buffer and then washed with TBS-T. Bands were visualized using self-prepared enhanced chemiluminescence reagent (100 mM Tris pH 8.6, 0.2 mM p-coumaric acid, 1.25 mM luminol, 2.6 mM) (28).
RAS Activity Assay
Activated Ras affinity precipitation assays were performed according to the manufacturer’s protocol. Briefly, 250 ug of cell lysates were incubated with 10 μl of Raf-1 RBD agarose beads (#14-278, Upstate, Millipore, Billerica, MA, USA) overnight at 4°C. After extensive washing of the agarose beads three times with washing buffer (RIPA buffer, 1 mM Na3VO4, 10 μg/mL leupeptin, 10 μg/mL aprotinin, and 25 mM NaF). SDS-PAGE of 12% was used to separate immunoprecipitation reactions and Western blotting was performed with a Ras antibody. Antibodies used include: E-cadherin (BD610181#14472), Ras (Cell signaling, #3965), pERK1/2 (Cell signaling, #9101), ERK2 (Santa Cruz, sc-154) and β-actin (Sigma, A5441).
Statistics
Statistical analyses (other than those previously described for microarray analysis) were performed in Prism 5 (GraphPad Software). Survival analysis p-values were calculated using the Log-rank (Mantel-Cox) test. All other p-values were calculated using the student’s t-test (unpaired, two-tailed).
RESULTS
Rapid development of mixed-type gastric adenocarcinoma
To investigate the contribution of oncogenic Kras combined with Cdh1 and Trp53 loss towards gastric tumorigenesis, we mated Atp4b-Cre transgenic mice with Cdh1fl/fl, Trp53fl/fl and LSL-KrasG12D mice. Mice were also mated onto a Rosa26LSL-YFP background to confirm YFP+ metastases with these mice referred to as triple conditional (Tcon) mice. Characterization of Tcon gastric cancer mice revealed a rapid course of disease resulting in a median survival of 76.5 days (range 64–91 days, SD 7.2) as compared to a 322-day median survival of control mice (referred to as KrasWT) with wild-type Kras, Cdh1 loss and Trp53 loss in the gastric parietal cell lineage (range 272–386 days, SD 32.8, Figure 1A). Disease progression correlates with weight loss as Tcon mice begin to lose weight around 60 days of age while KrasWT control mice with wild-type Kras, Cdh1 loss and Trp53 loss in the gastric parietal cell lineage only begin to lose weight around 300 days of age (Figure 1B). At necropsy, stomachs were dramatically enlarged with normal stomach replaced by tumor displaying linitis plastica (a.k.a. leather bottle stomach) with thickened, rigid, and whitened gastric walls (14) (Figure 1C). Histologically, the GAs that developed in these mice were mixed type tumors containing both diffuse and intestinal histology (Figure 1D). We examined the development of GA over time by analyzing stomachs of Tcon mice and Tcon Cre- controls at 3, 6, and 9 weeks of age. As expected, Cre- control stomachs displayed normal architecture at all time points (Figure 1E). Tcon mice had few or no identifiable gastric parietal cells by 3 weeks of age and demonstrated both high-grade dysplastic lesions and/or intramucosal carcinomas in 100% of mice. By six weeks of age, there was a dramatic increase in these lesions with invasive carcinomas in 40% mice while by nine weeks of age 100% of mice had invasive carcinomas.
Figure 1. Characterization of gastric adenocarcinoma in triple conditional mice (Atp4b-Cre;Cdh1fl/fl,Trp53fl/fl;KrasLSLG12D/+ or Tcon).
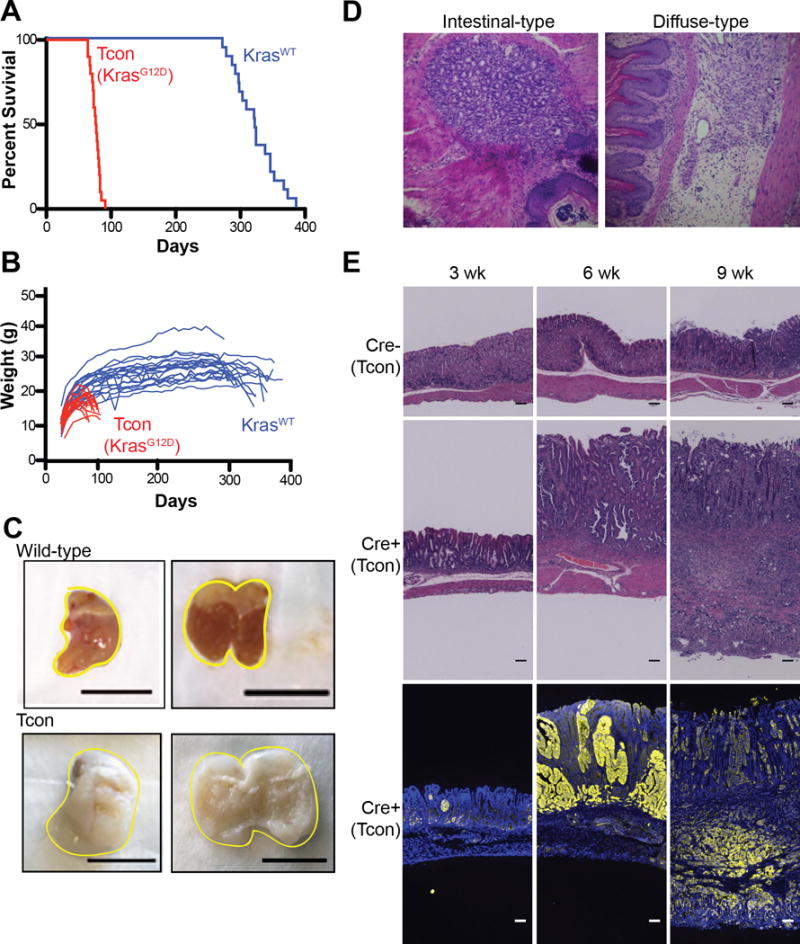
(A) Survival curve demonstrating 76.5 day median survival (n=20) of Tcon mice (red) compared to 322 day median survival (n=19) of double conditional mice (Atp4b-Cre;Cdh1fl/fl,Trp53fl/fl or KrasWT mice; blue). (B) Graph representing the weights of individual Tcon and Dcon mice in survival analysis over time. (C) Representative gross image of a wild-type stomach and a Tcon stomach (67 and 77 days of age, respectively, scale bar: 1 cm). (D) Representative images of intestinal-type and diffuse-type lesions found in Tcon mice. (E) Representative H&E and immunofluorescence (blue: DAPI, yellow: YFP) images of Tcon and Cre- control stomachs harvested from mice at 3, 6, and 9 weeks of age (scale bar: 1 mm).
Widespread metastasis in mice with GA
Ten mice were sacrificed at 64–83 days of age and analyzed for GA progression and metastasis (Figure 2). Upon gross examination of the abdomen, the stomachs were enlarged and YFP+ nodules were apparent within the perigastric fat in all mice examined indicating their identity as perigastric lymph node metastases. Gross examination of the thoracic cavity identified lesions in the mediastinal lymph nodes adjacent to the trachea in 50% of mice examined that were all YFP+ confirming that they were mediastinal lymph node metastases (Figure 2A–C). YFP+ lung metastases were identified in all mice while analysis of YFP expression in livers from Tcon mice identified micrometastatic lesions in 20% of mice (Figure 2C). We isolated six independent cell lines from six different Tcon mice and one metastatic lesion that were expanded in culture. All cell lines tested formed flank tumors in syngeneic wild-type C57BL/6 mice. Two of the gastric cancer-derived cell lines metastasized to the lung in an experimental model of spontaneous metastases (Figure 2D).
Figure 2. Tcon (Atp4b-Cre;Rosa26LSL-YFP;Cdh1fl/fl,Trp53fl/fl;KrasLSLG12D/+) mice have extensive metastases.
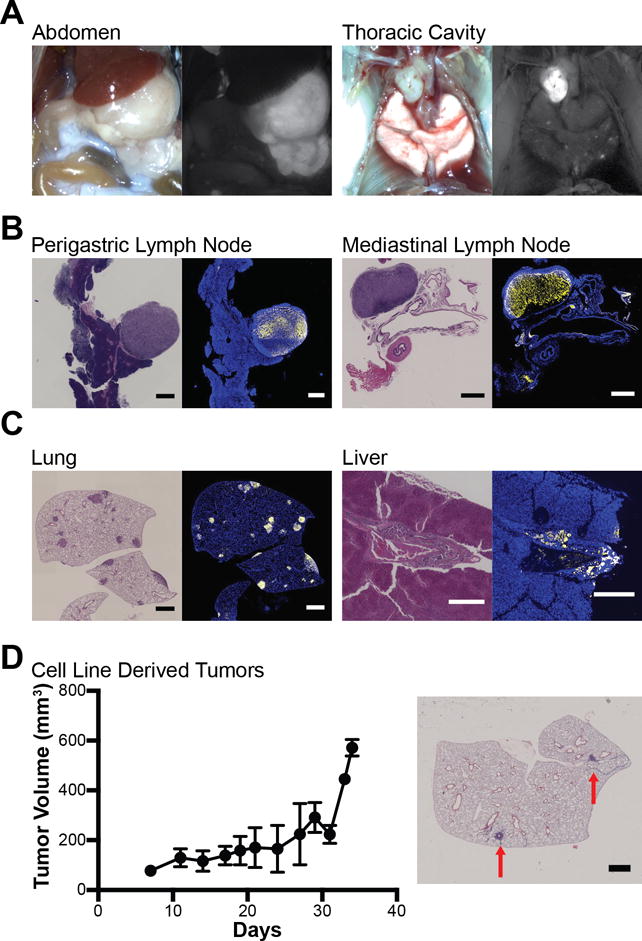
(A) Representative gross and fluorescence images of the abdomen and thoracic cavity of a Tcon mouse. (B and C) H&E and immunofluorescence (yellow: YFP; blue: DAPI) images of metastatic lesions found in Tcon mice. (C, left) Growth curve of subcutaneous (s.c.) flank tumors derived from a Tcon gastric tumor cell line (n=5). Data are presented as the mean tumor volume ± standard deviation. (D, right) H&E image of lung metastases (red arrows) after a Tcon gastric cancer cell line was injected subcutaneously in the flank followed by resection (n=3). Scale bars are all 1 mm except for the liver that is 0.5 mm.
Increased survival of mice with one copy of wild-type E-cadherin
Since KrasG12D and p53 loss are sufficient to drive tumorigenesis in most organs, we investigated whether E-cadherin status affected the growth and progression of GA in our Tcon mice. We generated Tcon mice with one wild-type allele of Cdh1 and refer to them as Dcon-Ecad heterozygous mice (Atp-4b-Cre;Cdh1fl/+;LSL-KrasG12D;Trp53fl/fl;Rosa26LSL-YFP). The presence of one wild-type Cdh1 allele dramatically increased survival (Figure 3A, p<0.0001) in comparison to Tcon mice with complete loss of E-cadherin. Of 37 Dcon-Ecad heterozygous mice, only 7 mice died of gastric tumors by 123 days. In comparison, a cohort of 20 Tcon mice all died by 91 days of age. The majority of Dcon-Ecad heterozygous mice did not undergo the significant weight loss that was observed in gastric cancer-bearing Tcon mice (Figure 3B).
Figure 3. Gastric cancer phenotype in double conditional mice with one copy of E-cadherin (Atp4b-Cre;Rosa26LSL-YFP;Cdh1fl/+,Trp53fl/fl;KrasLSLG12D/+ or Dcon-Ecad het mice).
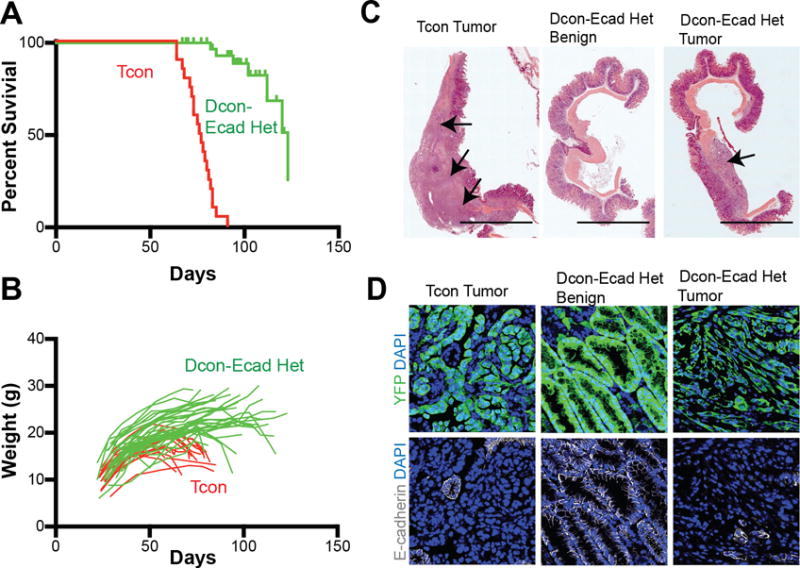
(A) Survival curve demonstrating 123 day median survival (n=27) of Dcon-Ecad het mice (green) compared to 76 day median survival (n=20) of Tcon (red) mice. (B) Graph representing the weights of individual mice in survival analysis over time. (C) Representative gross image of a Tcon stomach (80 days of age, scale bar: 1 cm) as compared to stomachs from Dcon-E-cad het mice without a tumor (77 days of age, benign) or a stomach with a tumor (108 days of age, tumor). Arrows denote tumors. (D) Representative immunofluorescence images of YFP (green) and E-cadherin (white) expression with DAPI (blue) in stomachs isolated from mice with the indicated genotypes.
Loss of wild-type E-cadherin expression leads to GA
Although stomachs isolated from Dcon-Ecad heterozygous mice between 67 and 123 days old are enlarged and hyperplastic, the majority do not harbor invasive tumors. Upon histologic analysis, only 2 of 11 Dcon-Ecad heterozygous mice had detectable stomach tumors. Histologically these tumors were mixed-type gastric tumors however, these tumors were more focal in nature, unlike the widespread gastric tumors identified in Tcon mice (Figure 3C). These data implicate the requirement of a secondary event for tumorigenesis to occur in the gastric parietal cell lineage cells of origin.
One explanation for the occasional stomach tumors observed in Dcon-Ecad heterozygous mice with one copy of wild-type Cdh1 could be due to the eventual loss of E-cadherin expression. Thus we examined E-cadherin expression by immunofluorescent staining in stomachs from Dcon-Ecad heterozygous mice with tumors or with hyperplastic lesions at 108 days of age as compared to stomach tumors harvested from Tcon mice at 68 days of age (Figure 3D.) As expected, E-cadherin protein was absent in recombined cells (YFP+) in Tcon stomach tumors but present in adjacent normal (YFP-negative) tissue. E-cadherin expression was detected in sections from Dcon-Ecad heterozygous stomachs that lacked invasive tumors (referred to as benign) and in normal tissue of tumor bearing-Dcon-Ecad heterozygous mice. However, in stomach tumors from Dcon-Ecad heterozygous mice, E-cadherin expression was absent or decreased in YFP+-tumor cells (Figure 3D) implicating loss of E-cadherin as a critical barrier for gastric tumorigenesis even with oncogenic KRAS expression and p53 loss.
Increased Ras activity and upregulation of Kras signaling in the absence of E-cadherin
To identify differences in gene expression between stomachs isolated from Tcon mice and Dcon-Ecad heterozygous mice, a cDNA microarray on glandular stomach tissue from 4 individual mice of each genotype was performed. Principal components analysis revealed two clusters: one that contained all 4 of the Tcon stomachs and another that contained 3 of the 4 Dcon-Ecad heterozygous mice. However, 1 of the 4 Dcon-Ecad heterozygous stomachs did not fall distinctly within either of these groups but was closer to the Tcon stomachs (Figure 4A). Unsupervised hierarchical clustering analysis indicates that the single outlier Dcon-Ecad heterozygous stomach sample clustered more closely to the Tcon stomach cluster rather than to the other 3 Dcon-Ecad heterozygous stomachs (Figure 4B). The frequency of invasive GA observed in Dcon-Ecad heterozygous mice occurred at a ratio of 1 in 5 mice. Since it was likely that this single mouse harbored a GA, microarray data from this outlier was removed from analysis. To determine differentially regulated pathways between the two genotypes, we performed gene set overlap analysis (27) on genes upregulated in the Tcon stomachs versus Dcon-Ecad heterozygous stomachs and a publicly available data set of transcription factor target gene sets. This analysis revealed that Receptor Tyrosine Kinase/KRAS driven gene sets were upregulated in stomachs harvested from Tcon mice. When comparing our gene set to the collection of cancer hallmark gene sets, the second most significant hit was for “Genes up-regulated by KRAS activation”. Further, significant overlap was found between our gene set and 9 EGFR/ERBB2/Kras regulated oncogenic signature gene sets (Table 1).
Figure 4. Increased KRAS signaling in gastric tumors from Tcon mice.
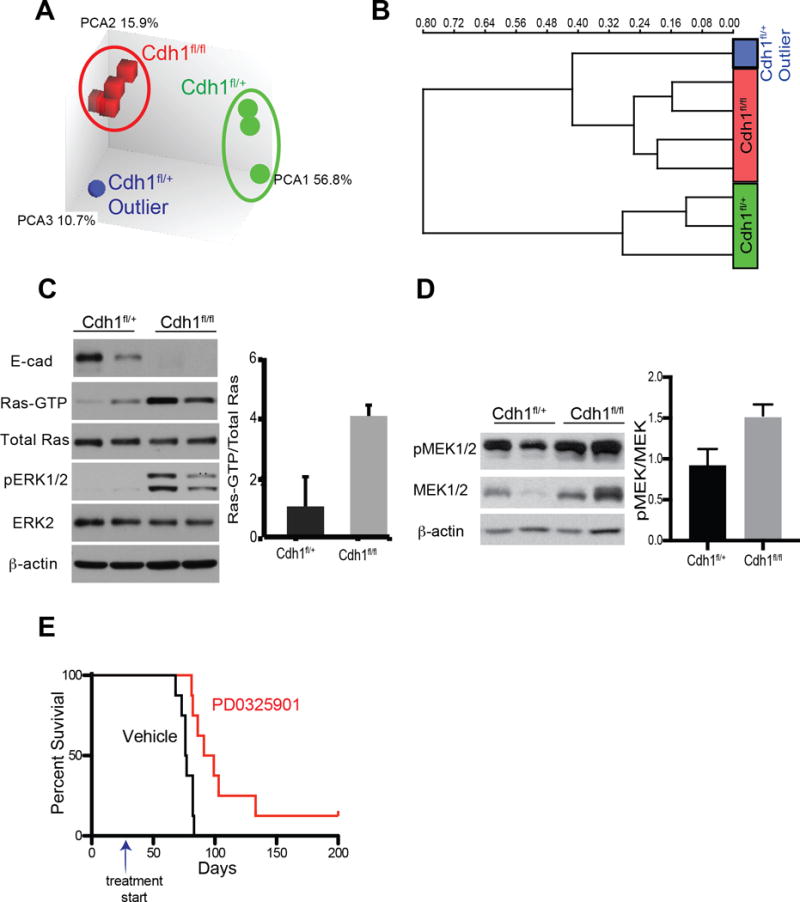
(A) Principal component analysis (PCA) and (B) unsupervised hierarchical clustering analysis of microarray data from Tcon (Cdh1fl/fl) and Dcon-Ecad heterozygous (het) stomachs (Cdh1fl/+). (C) Western blot analysis of RAS-GTP pulldown, total RAS, phopho-ERK, total ERK and β-actin in gastric cancer cell lines isolated from Tcon (Cdh1fl/fl) gastric tumors and from Dcon-Ecad het (Cdh1fl/+) tumors. Each lane is an independent gastric cancer cell line. Densitometric quantification of RAS-GTP relative to total RAS is shown on the right. (D) Western blot analysis of phospho-MEK and total MEK expression in stomach lysates from Tcon and Dcon-Ecad het (Cdh1fl/+) mice. Densitometric quantification of phospho-MEK levels relative to total MEK shown on the right. (E) Survival curve of Tcon mice treated with the MEK inhibitor PD0325901 or vehicle beginning at 4 weeks of age (indicated by arrow) demonstrating an increase in median survival of 96 days in the presence of the MEK inhibitor over vehicle (p=0.001, n=8).
Table 1.
Gene set overlap analysis comparing cancer hallmark gene sets and oncogenic signature gene sets to genes upregulated in Tcon versus Dcon-Ecad het stomachs.
| Name | Description | FDR q-value |
|---|---|---|
| Cancer Hallmark Gene Sets | ||
| HALLMARK_KRAS_SIGNALING_UP | Genes up-regulated by KRAS activation. | 3.36e−61 |
| Oncogenic Signature | ||
| KRAS.600_UP.V1_UP | Up-regulated in four lineages of epithelial cell lines over-expressing oncogenic KRAS | 1.47e−19 |
| KRAS.DF.V1_UP | Up-regulated in epithelial lung cancer cell lines over-expressing oncogenic KRAS | 9.39e−18 |
| KRAS.600.LUNG.BREAST_UP.V1_UP | Up-regulated in epithelial lung and breast cancer cell lines over-expressing oncogenic KRAS | 2.68e−17 |
| KRAS.LUNG.BREAST_UP.V1_UP | Up-regulated in epithelial lung and breast cancer cell lines over-expressing oncogenic KRAS | 2.55e−15 |
| KRAS.BREAST_UP.V1_UP | Up-regulated in epithelial breast cancer cell lines over-expressing oncogenic KRAS | 4.49e−11 |
| KRAS.LUNG_UP.V1_UP | Up-regulated in epithelial lung cancer cell lines over-expressing oncogenic KRAS | 1.34e−10 |
| KRAS.300_UP.V1_UP | Up-regulated in four lineages of epithelial cell lines over-expressing oncogenic KRAS | 8.06e−09 |
| KRAS.PROSTATE_UP.V1_UP | Up-regulated in epithelial prostate cancer cell lines over-expressing oncogenic KRAS | 2.75e−08 |
| KRAS.50_UP.V1_UP | Up-regulated in four lineages of epithelial cell lines over-expressing oncogenic KRAS | 2.78e−07 |
To confirm increased RAS signaling in gastric tumors from Tcon mice, we measured RAS activity in gastric tumor cell lines generated from gastric tumors from Tcon and Dcon-Ecad heterozygous mice. Utilizing a pull-down assay with the RAS binding domain of RAF which specifically binds the active GTP-bound form of RAS, we found higher RAS activity in gastric cancer cell lines derived from Tcon mice as compared to gastric cancer cell lines from Dcon-Ecad heterozygous mice (Figure 4C). Further, Tcon-derived gastric cancer cell lines also demonstrated increased expression of phospho-ERK as compared to gastric cancer cell lines from Dcon-Ecad heterozygous cell lines (Figure 4C). Next, we probed for MEK activation in stomach tissue harvested from Tcon and Dcon-Ecad heterozygous mice. Western blot analysis of phospho-MEK expression in stomach tumors demonstrated upregulation of phospho-MEK relative to total MEK in tumors from Tcon mice as compared to those from Dcon-Ecad mice (Figure 4D). To determine the contribution of increased MAPK signaling in the absence of E-cadherin towards gastric tumorigenesis, we treated Tcon mice starting at 4 weeks of age with the clinically approved MEK inhibitor, PD324901. Tcon mice had an increase in median survival of 18.5 days over treatment with vehicle alone (p=0.001, n=8) (Figure 4E). Collectively, these data implicate that oncogenic KRAS promotes gastric tumorigenesis and metastasis in our Tcon model. Given that both Tcon and Dcon-Ecad heterozygous stomachs express oncogenic KRAS, these data suggest that E-cadherin expression in gastric parietal cells may attenuate the activity of oncogenic KRAS in our model.
Upregulation of β-Catenin Targets in the Absence of E-cadherin
While E-cadherin has been identified as the genetic hit in Hereditary Diffuse Gastric Cancer, the exact mechanism by which loss of E-cadherin expression leads to GA is still not known. One mechanism that has been proposed to underlie E-cadherin’s tumor suppressive activity is sequestration of β-catenin at the adherens junction in the cadherin-catenin complex at the cell membrane. While loss of E-cadherin allows β-catenin to localize to the cytosol, this does not necessarily indicate β-catenin nuclear translocation and downstream transactivation of classical WNT pathway target genes. To test if the lack of E-cadherin altered the subcellular localization and/or activation of β-catenin, we co-immunostained stomachs from Tcon and Dcon-Ecad heterozygous mice with and without tumors for E-cadherin, β-catenin, and YFP expression (Figure 5A). Tcon stomachs had no E-cadherin expression in YFP+ tumor cells as expected and also lacked β-catenin localization at the membrane in YFP+ tumor cells but showed diffuse cytsolic β-catenin expression (Figure 5A). In contrast, non-tumor YFP− cells in Tcon stomachs serve as an internal control demonstrating both E-cadherin and β-catenin expression at the cell membrane (Figure 5A). Dcon-Ecad heterozygous stomachs without obvious tumors but expressing YFP+ cells throughout (referred to as benign) retained membranous expression of E-cadherin and β-catenin as indicated by immunostaining (Figure 5A). However, Dcon-Ecad heterozygous stomachs with YFP+ tumor cells and confirmed gastric tumors, displayed much less E-cadherin expression throughout the section as well as a loss of membrane localized β-catenin in YFP+ tumors cells lacking E-cadherin expression as indicated by immunostaining (Figure 5A).
Figure 5. Increased β-catenin activation in gastric tumors from Tcon mice.
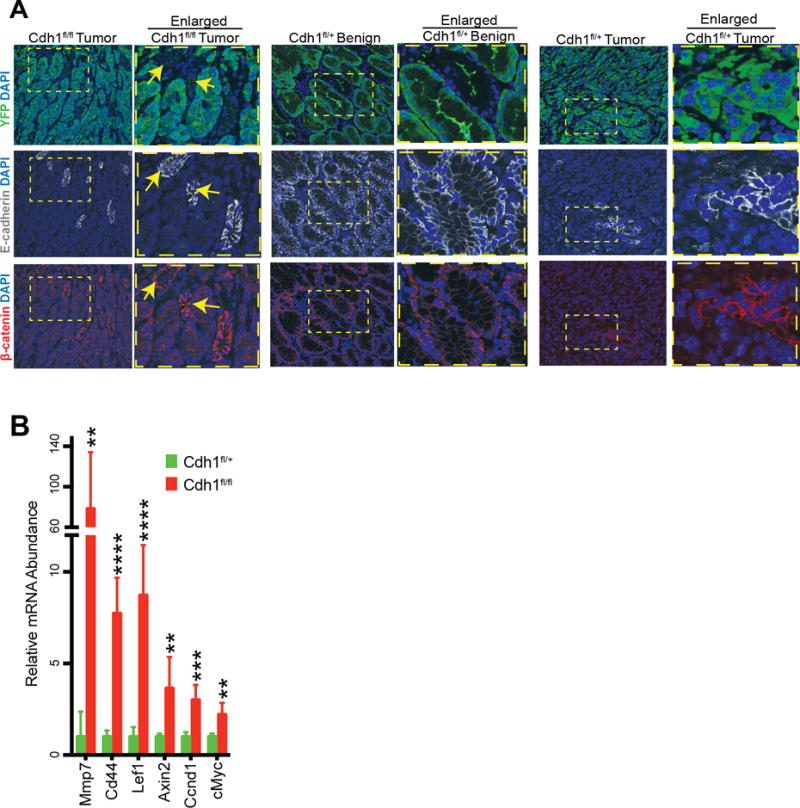
(A) Representative immunofluorescence images of YFP (green), E-cadherin (white), and β-catenin (red) expression with DAPI (blue) in stomachs isolated from mice with the indicated genotypes. Dotted yellow boxes indicate enlarged insets and arrows indicate non-tumor YFP- areas. (B) Expression of canonical β-catenin target genes in Tcon vs. Dcon-Ecad heterozygous (het) stomachs. Data are normalized to HPRT expression and displayed as mean fold change over Dcon-Ecad het stomachs + standard deviation (n=6).
Since β-catenin can be degraded in the cytoplasm, we performed gene set overlap analysis to further investigate whether loss of membrane localized β-catenin expression in stomach tumors from Tcon mice led to increased β-catenin activation. We compared genes upregulated in Tcon stomachs with tumors versus Dcon-Ecad heterozygous stomachs likely without tumors, to a publicly available data set of transcription factor target gene sets (Table 2). The first hit was a set of genes containing binding sites for the β-catenin binding partner LEF1, in their promoters. Further, when genes upregulated in Tcon versus Dcon-Ecad heterozygous stomachs were compared to oncogenic signature gene sets, the results contained several genes sets whose upregulation are due to the expression of LEF1, Wnt signaling, and β-catenin. Finally, to confirm increased β-catenin activation in stomach tumors from Tcon mice, we investigated the expression of several canonical WNT/β-catenin target genes including LEF1, CD44, Cyclin D1 and c-Myc, by qRT-PCR (Figure 5B). All genes were significantly upregulated in Tcon compared to Dcon-Ecad heterozygous stomach tissue. Collectively, these data are consistent with an up-regulation of β-catenin target genes in the absence of E-cadherin.
Table 2.
Gene set overlap analysis comparing transcription factor target gene sets and oncogenic signature gene sets to genes up-regulated in Tcon vs Dcon-Ecad het stomachs.
| Name | Description | FDR q-value |
|---|---|---|
| Transcription Factor Target Gene Sets | ||
| CTTTGT_V$LEF1_Q2 | Genes with promoter regions containing the LEF1 motif | 3.27 e−87 |
| CAGGTG_V$E12 Q6 | Genes with promoter regions containing the TCF3 motif | 1.44 e−58 |
| Oncogenic Signature Gene Sets | ||
| LEF1_UP.V1_UP | Upregulated in DLD1 cells over-expressing LEF1 | 2.86 e−19 |
| WNT_UP.V1_UP | Upregulated in C57MG cells over-expressing WNT1 | 1.42 e−8 |
| BCAT.100_UP.V1_UP | Upregulated in HEK293 cells expressing active CTNNB1 | 3.83 e−8 |
DISCUSSION
Given the high rate of mutation and amplification of the receptor tyrosine kinase (RTK)/Ras pathway in gastric cancer, we have generated a mouse model of GA that includes expression of oncogenic Kras. In our Tcon mouse model of GA, we combined oncogenic Kras expression with E-cadherin and p53 loss in the gastric parietal cell lineage to reveal a clinically relevant model of GA that progresses rapidly and metastasizes widely to lymph nodes, lung and liver. This work has demonstrated the importance of E-cadherin as a gatekeeper for primary gastric tumorigenesis as mice generated with oncogenic Kras, loss of Trp53 and one wild-type allele of Cdh1, referred to as Dcon-Ecad heterozygous mice, was sufficient to significantly inhibit tumor growth and progression and prolong overall survival. As of 123 days, only 20% of Dcon-Ecad heterozygous mice demonstrated gastric tumors with no metastases identified in distant organs. RAS activity was measured in gastric cancer cell lines generated from Tcon tumors and from Dcon-Ecad tumors by a RAF-RBD pulldown of RAS-GTP. Our data indicate a significant increase in RAS activity in gastric cancer cell lines lacking E-cadherin expression (from Tcon mice) as compared to gastric cancer cell lines expressing E-cadherin (from Dcon-Ecad heterozygous mice). Further, we show that phospho-ERK expression was significantly higher in the absence of E-cadherin supporting the notion E-cadherin may act as a gatekeeper to oncogenic Kras and Trp53 loss-driven gastric cancer. Gene expression analysis identified increased oncogenic KRAS signaling only in the absence of E-cadherin with increased phospho-MEK expression detected by Western blot only in gastric tumors isolated from Tcon mice and not from mice with expression of E-cadherin (Dcon-Ecad heterozygous mice).
Expression of oncogenic Kras and loss of Trp53 is sufficient to drive rapid development of lung cancer (11), pancreatic ductal adenocarcinoma (12), squamous cell carcinoma (13), acute myeloid leukemia (14), and undifferentiated pleomorphic sarcoma (15,16) in the mouse. However, in the gastric parietal cell lineage, despite the expression of oncogenic Kras and Trp53 loss, E-cadherin expression dramatically decreases tumorigenesis. These data implicate Cdh1 loss as necessary for oncogenic KRAS and P53 loss to promote tumorigenesis and metastases in these cells. Our microarray data show that gene sets upregulated by oncogenic Kras activity are overrepresented in genes upregulated in stomachs from Tcon versus Dcon-Ecad heterozygous mice. The increased phospho-MEK expression in stomach tumors from Tcon mice further confirms increased RAS activity. The levels of Kras mRNA were similar in the stomachs of both mouse models (data not shown) thus, one would expect similar levels of RAS activity in these two models. Our data suggest that the presence of E-cadherin attenuates oncogenic KRAS signaling and its effector pathways in the Dcon-Ecad heterozygous mouse model thus indicating that E-cadherin functions downstream of oncogenic KRAS.
The observed loss of E-cadherin expression in the 20% of gastric tumors that arise in Dcon-Ecad heterozygous mice suggests that E-cadherin is a gatekeeper to tumorigenesis in the gastric parietal cell lineage. Our data demonstrate that the presence of a wild-type Cdh1 allele in our model delays oncogenesis significantly and of the tumors that do form, the tumors show dramatic loss of E-cadherin expression. This concept of a gatekeeper in gastrointestinal tumors is not without precedent as loss of the Apc gene has also been shown to be necessary for colon carcinoma development even in the presence of oncogenic Kras and Trp53 loss in Lgr5+ colon cells. Additionally colon tumors were shown to regress upon re-expression of Apc (29). Further, it is intriguing that APC and E-cadherin functionality overlap in their regulation β-catenin (30, 31). Collectively our data support the hypothesis that canonical WNT signaling is necessary for oncogenic Kras and Trp53 loss-driven tumorigenesis in the gut. Similarly, Hayakawa et al., (32) have shown in Mist1+ gastric stem cells that oncogenic-Kras alone drives intestinal metaplasia but is insufficient to drive gastric adenocarcinoma development. When paired with APC loss intestinal-type gastric adenocarcinoma develops by 120 days (32). Both E-cadherin and APC share regulatory control of the canonical WNT signaling molecule β-catenin. Our data and published data on APC suggest that loss of either E-cadherin or APC lead to increased β-catenin signaling which may be crucial for mutant Kras and Trp53 loss-driven oncogenesis in both the gastric parietal cell lineage and in Lgr5+ colon stem cells. Thus regulation of β-catenin activation may be a critical node for tumorigenesis throughout the gut.
Whereas Hayakawa et al proposed Mist1+ stem cells as the cell of origin in both intestinal- and diffuse-type gastric cancer (32), our model and that of Shimada et al (10) suggest that the gastric parietal cell lineage, including both pre-parietal cells and mature parietal cells, may also act as a cell of origin for GA. Specifically, our model demonstrates that both intestinal- and diffuse-type lesion can arise from this, Atp4b+ lineage. It is possible that together these data suggest a Mist1+;Atp4b+ pre-parietal cell as the cell of origin in GA. The presence of Mist1+;Atp4b+ cells in the stomach remains to be investigated.
Both our Tcon and Dcon-Ecad heterozygous mouse models of GA offers the potential to investigate the molecular mechanisms driving gastric cancer via both E-cadherin and the RTK/Ras signaling axis. The Tcon mice may also serve as a useful model for testing new therapies targeting both primary gastric cancer and metastatic lesions. Both the rapid progression of gastric cancer and widespread metastases set the Tcon model apart from other available mouse models of gastric cancer. Further, our model represents the first mouse model of mixed-type GA and offers the only in vivo tool to investigate this GA sub-type.
Acknowledgments
The authors would like to thank Dr. Anil Rustgi and members of the Ryeom lab for helpful comments and suggestions.
Financial support:
NIDDK Center Grant P30-DK050306 (S.Ryeom)
The Garrett B. Smith Foundation (S.Ryeom)
NCI R01 CA 118374 (S.Ryeom)
MSKCC Functional Genomics Initiative Rapid Response Pilot Grant (S.S.Yoon)
NCI Cancer Center Support Grant P30 CA008748 (S.S.Yoon)
Footnotes
Conflict of Interest: The authors declare no potential conflicts of interest.
References
- 1.Ferlay J, Soerjomataram I, Ervik M, Dikshit R, Eser S, Mathers C, et al. Cancer Incid Mortal Worldw. Lyon, France: International Agency for Research on Cancer; 2013. GLOBOCAN 2012 v1.0 [Internet] (IARC CancerBase No. 11 [Internet]). 2013. Available from: http://globocan.iarc.fr. [Google Scholar]
- 2.Crew KD, Neugut AI. Epidemiology of gastric cancer. World J Gastroenterol [Internet] 2006 doi: 10.3748/wjg.v12.i3.354. [cited 2016 Jul 11]; 12:354. Available from: http://www.wjgnet.com/1007-9327/full/v12/i3/354.htm. [DOI] [PMC free article] [PubMed]
- 3.Wagner AD, Grothe W, Haerting J, Kleber G, Grothey A, Fleig WE. Chemotherapy in Advanced Gastric Cancer: A Systematic Review and Meta-Analysis Based on Aggregate Data. J Clin Oncol. 24:2903–9. doi: 10.1200/JCO.2005.05.0245. [DOI] [PubMed] [Google Scholar]
- 4.Lauren P. The Two Histological Main Types Of Gastric Carcinoma: Diffuse and So-Called Intestina-Type Carcinoma. An Attempt At A Histo-Clinical Classification. Acta Pathol Microbiol Scand [Internet] 1965 doi: 10.1111/apm.1965.64.1.31. [cited 2016 Jul 13]; 64:31–49. Available from: http://www.ncbi.nlm.nih.gov/pubmed/14320675. [DOI] [PubMed]
- 5.Lauwers GY. Epithelial Neoplasms of the Stomach. In: Odze RD, Goldblum JR, editors. Gastrointest Tract Endosc Tissue Process Tech Norm Histol [Internet] Third. Philadelphia, PA: Saunders/Elsevier; 2015. [cited 2016 Jul 13]. page 707–721.e5. Available from: https://www.clinicalkey.com/#!/content/book/3-s2.0-B978145570747800025X?scrollTo=%2523s0045. [Google Scholar]
- 6.Cerami E, Gao J, Dogrusoz U, Gross BE, Sumer SO, Aksoy BA, et al. Cancer Discov [Internet] American Association for Cancer Research; 2012. The cBio Cancer Genomics Portal: An Open Platform for Exploring Multidimensional Cancer Genomics Data. [cited 2016 Jul 11];2:401–4. Available from: http://cancerdiscovery.aacrjournals.org/cgi/doi/10.1158/2159-8290.CD-12-0095. [DOI] [PMC free article] [PubMed] [Google Scholar]
- 7.Bass AJ, Thorsson V, Shmulevich I, Reynolds SM, Miller M, Bernard B, et al. Nature [Internet] Nature Publishing Group; 2014. Comprehensive molecular characterization of gastric adenocarcinoma. [cited 2016 Jul 11];513:202–9. Available from: http://www.nature.com/doifinder/10.1038/nature13480. [DOI] [PMC free article] [PubMed] [Google Scholar]
- 8.Graziano F, Humar B, Guilford P. The role of the E-cadherin gene (CDH1) in diffuse gastric cancer susceptibility: From the laboratory to clinical practice. Ann Oncol. 2003:1705–13. doi: 10.1093/annonc/mdg486. [DOI] [PubMed] [Google Scholar]
- 9.Hayakawa Y, Fox J, Gonda T, Worthley D, Muthupalani S, Wang T. Cancers (Basel) [Internet] Multidisciplinary Digital Publishing Institute; 2013. Mouse Models of Gastric Cancer. [cited 2016 Jul 14];5:92–130. Available from: http://www.mdpi.com/2072-6694/5/1/92/ [DOI] [PMC free article] [PubMed] [Google Scholar]
- 10.Shimada S, Mimata A, Sekine M, Mogushi K, Akiyama Y, Fukamachi H, et al. Gut [Internet] BMJ Publishing Group Ltd and British Society of Gastroenterology; 2012. Synergistic tumour suppressor activity of E-cadherin and p53 in a conditional mouse model for metastatic diffuse-type gastric cancer. [cited 2016 Jul 11];61:344–53. Available from: http://www.ncbi.nlm.nih.gov/pubmed/21865403. [DOI] [PubMed] [Google Scholar]
- 11.Jackson EL, Olive KP, Tuveson DA, Bronson R, Crowley D, Brown M, et al. Cancer Res [Internet] American Association for Cancer Research; 2005. The differential effects of mutant p53 alleles on advanced murine lung cancer. [cited 2016 Jul 24];65:10280–8. Available from: http://www.ncbi.nlm.nih.gov/pubmed/16288016. [DOI] [PubMed] [Google Scholar]
- 12.Bardeesy N, Aguirre AJ, Chu GC, Cheng K-h, Lopez LV, Hezel AF, et al. Proc Natl Acad Sci [Internet] National Academy of Sciences; 2006. Both p16Ink4a and the p19Arf-p53 pathway constrain progression of pancreatic adenocarcinoma in the mouse. [cited 2016 Jul 24];103:5947–52. Available from: http://www.pnas.org/cgi/doi/10.1073/pnas.0601273103. [DOI] [PMC free article] [PubMed] [Google Scholar]
- 13.Caulin C, Nguyen T, Lang GA, Goepfert TM, Brinkley BR, Cai W-W, et al. J Clin Invest [Internet] American Society for Clinical Investigation; 2007. An inducible mouse model for skin cancer reveals distinct roles for gain- and loss-of-function p53 mutations. [cited 2016 Jul 24];117:1893–901. Available from: http://www.jci.org/cgi/doi/10.1172/JCI31721. [DOI] [PMC free article] [PubMed] [Google Scholar]
- 14.Zhao Z, Zuber J, Diaz-Flores E, Lintault L, Kogan SC, Shannon K, et al. Genes Dev [Internet] Cold Spring Harbor Laboratory Press; 2010. p53 loss promotes acute myeloid leukemia by enabling aberrant self-renewal. [cited 2016 Jul 24];24:1389–402. Available from: http://genesdev.cshlp.org/cgi/doi/10.1101/gad.1940710. [DOI] [PMC free article] [PubMed] [Google Scholar]
- 15.Kirsch DG, Dinulescu DM, Miller JB, Grimm J, Santiago PM, Young NP, et al. A spatially and temporally restricted mouse model of soft tissue sarcoma. Nat Med [Internet] 2007 doi: 10.1038/nm1602. [cited 2016 Jul 24];13:992–7. Available from: http://www.ncbi.nlm.nih.gov/pubmed/17676052. [DOI] [PubMed]
- 16.Mito JK, Riedel RF, Dodd L, Lahat G, Lazar AJ, Dodd RD, et al. Cross Species Genomic Analysis Identifies a Mouse Model as Undifferentiated Pleomorphic Sarcoma/Malignant Fibrous Histiocytoma. In: Aziz SA, editor. PLoS One [Internet] Public Library of Science; 2009. [cited 2016 Jul 24];4:e8075. Available from: http://dx.plos.org/10.1371/journal.pone.0008075. [DOI] [PMC free article] [PubMed] [Google Scholar]
- 17.Boussadia O, Kutsch S, Hierholzer A, Delmas V, Kemler R. E-cadherin is a survival factor for the lactating mouse mammary gland. Mech Dev. 2002;115:53–62. doi: 10.1016/s0925-4773(02)00090-4. [DOI] [PubMed] [Google Scholar]
- 18.Jackson EL, Willis N, Mercer K, Bronson RT, Crowley D, Montoya R, et al. Genes Dev [Internet] Cold Spring Harbor Laboratory Press; 2001. Analysis of lung tumor initiation and progression using conditional expression of oncogenic K-ras. [cited 2016 Jul 11];15:3243–8. Available from: http://www.ncbi.nlm.nih.gov/pubmed/11751630. [DOI] [PMC free article] [PubMed] [Google Scholar]
- 19.Marino S, Vooijs M, van der Gulden H, Jonkers J, Berns A. Genes Dev. Vol. 14. Cold Spring Harbor Laboratory Press; 2000. Induction of medulloblastomas in p53-null mutant mice by somatic inactivation of Rb in the external granular layer cells of the cerebellum; pp. 994–1004. [PMC free article] [PubMed] [Google Scholar]
- 20.Srinivas S, Watanabe T, Lin CS, William CM, Tanabe Y, Jessell TM, et al. BMC Dev Biol [Internet] BioMed Central; 2001. Cre reporter strains produced by targeted insertion of EYFP and ECFP into the ROSA26 locus. [cited 2016 Jul 18];1:4. Available from: http://www.ncbi.nlm.nih.gov/pubmed/11299042. [DOI] [PMC free article] [PubMed] [Google Scholar]
- 21.Syder AJ, Karam SM, Mills JC, Ippolito JE, Ansari HR, Farook V, et al. Proc Natl Acad Sci U S A [Internet] National Academy of Sciences; 2004. A transgenic mouse model of metastatic carcinoma involving transdifferentiation of a gastric epithelial lineage progenitor to a neuroendocrine phenotype. [cited 2016 Jul 14];101:4471–6. Available from: http://www.ncbi.nlm.nih.gov/pubmed/15070742. [DOI] [PMC free article] [PubMed] [Google Scholar]
- 22.Wang X, Seed B. Nucleic Acids Res [Internet] Oxford University Press; 2003. A PCR primer bank for quantitative gene expression analysis. [cited 2016 Aug 9];31:154e–154. Available from: http://nar.oxfordjournals.org/lookup/doi/10.1093/nar/gng154. [DOI] [PMC free article] [PubMed] [Google Scholar]
- 23.Spandidos A, Wang X, Wang H, Dragnev S, Thurber T, Seed B, et al. BMC Genomics [Internet] BioMed Central; 2008. A comprehensive collection of experimentally validated primers for Polymerase Chain Reaction quantitation of murine transcript abundance. [cited 2016 Aug 9];9:633. Available from: http://bmcgenomics.biomedcentral.com/articles/10.1186/1471-2164-9-633. [DOI] [PMC free article] [PubMed] [Google Scholar]
- 24.Spandidos A, Wang X, Wang H, Seed B. Nucleic Acids Res [Internet] Oxford University Press; 2010. PrimerBank: a resource of human and mouse PCR primer pairs for gene expression detection and quantification. [cited 2016 Aug 9];38:D792–9. Available from: http://www.ncbi.nlm.nih.gov/pubmed/19906719. [DOI] [PMC free article] [PubMed] [Google Scholar]
- 25.Tusher VG, Tibshirani R, Chu G. Proc Natl Acad Sci U S A [Internet] National Academy of Sciences; 2001. Significance analysis of microarrays applied to the ionizing radiation response. [cited 2016 Aug 29];98:5116–21. Available from: http://www.ncbi.nlm.nih.gov/pubmed/11309499. [DOI] [PMC free article] [PubMed] [Google Scholar]
- 26.Geer LY, Marchler-Bauer A, Geer RC, Han L, He J, He S, et al. Nucleic Acids Res [Internet] Oxford University Press; 2010. The NCBI BioSystems database. [cited 2016 Aug 9];38:D492–6. Available from: http://www.ncbi.nlm.nih.gov/pubmed/19854944. [DOI] [PMC free article] [PubMed] [Google Scholar]
- 27.Subramanian A, Tamayo P, Mootha VK, Mukherjee S, Ebert BL, Gillette MA, et al. Proc Natl Acad Sci [Internet] National Academy of Sciences; 2005. Gene set enrichment analysis: A knowledge-based approach for interpreting genome-wide expression profiles. [cited 2016 Jul 28];102:15545–50. Available from: http://www.pnas.org/cgi/doi/10.1073/pnas.0506580102. [DOI] [PMC free article] [PubMed] [Google Scholar]
- 28.Mruk DD, Cheng CY. Spermatogenesis [Internet] Landes Bioscience; 2011. Enhanced chemiluminescence (ECL) for routine immunoblotting: An inexpensive alternative to commercially available kits. [cited 2016 Aug 29];1:121–2. Available from: http://www.ncbi.nlm.nih.gov/pubmed/22319660. [DOI] [PMC free article] [PubMed] [Google Scholar]
- 29.Dow LE, O’Rourke KP, Simon J, Tschaharganeh DF, van Es JH, Clevers H, et al. Apc Restoration Promotes Cellular Differentiation and Reestablishes Crypt Homeostasis in Colorectal Cancer. Cell. 2015;161:1539–52. doi: 10.1016/j.cell.2015.05.033. [DOI] [PMC free article] [PubMed] [Google Scholar]
- 30.Mohammed Maryam K, Shao Connie, Wang Jing, Wei Qiang, Wang Xin, Collier Zachary, Tang Shengli, et al. Wnt/β-Catenin Signaling Plays an Ever-Expanding Role in Stem Cell Self-Renewal, Tumorigenesis and Cancer Chemoresistance. Genes & Diseases. 2016;3(1):11–40. doi: 10.1016/j.gendis.2015.12.004. NIH Public Access. [DOI] [PMC free article] [PubMed] [Google Scholar]
- 31.Liu Xin, Kent-Man Chu, Xin Liu, Kent-Man Chu. BioMed Research International. Vol. 2014. Hindawi Publishing Corporation; 2014. E-Cadherin and Gastric Cancer: Cause, Consequence, and Applications; p. 637308. [DOI] [PMC free article] [PubMed] [Google Scholar]
- 32.Hayakawa Y, Ariyama H, Stancikova J, Sakitani K, Asfaha S, Renz BW, et al. Mist1 Expressing Gastric Stem Cells Maintain the Normal and Neoplastic Gastric Epithelium and Are Supported by a Perivascular Stem Cell Niche. Cancer Cell. 2015;28:800–14. doi: 10.1016/j.ccell.2015.10.003. [DOI] [PMC free article] [PubMed] [Google Scholar]