

ABSTRACT
Laboratory rats are commonly used in life science research as a model for human biology and disease, but the composition and development of their gut microbiota during life is poorly understood. We determined the fecal microbiota composition of healthy Sprague Dawley laboratory rats from 3 weeks to 2 y of age, kept under controlled environmental and dietary conditions. Additionally, we determined fecal short-chain fatty acid profiles, and we compared the rat fecal microbiota with that of mice and humans. Gut microbiota and to a lesser extent SCFAs profiles separated rats into 3 different clusters according to age: before weaning, first year of life (12- to 26-week-old animals) and second year of life (52- to 104-week-old). A core of 46 bacterial species was present in all rats but its members' relative abundance progressively decreased with age. This was accompanied by an increase of microbiota α-diversity, likely due to the acquisition of environmental microorganisms during the lifespan. Contrastingly, the functional profile of the microbiota across animal species became more similar upon aging. Lastly, the microbiota of rats and mice were most similar to each other but at the same time the microbiota profile of rats was more similar to that of humans than was the microbiota profile of mice. These data offer an explanation as to why germ-free rats are more efficient recipients and retainers of human microbiota than mice. Furthermore, experimental design should take into account dynamic changes in the microbiota of model animals considering that their changing gut microbiota interacts with their physiology.
KEYWORDS: gut microbiota, human biologic model, lifespan evolution, Rat, Rattus norvegicus
Introduction
Higher animals are meta-organisms in which microbes roughly equal host cells.1 The mammalian gastrointestinal tract (GIT) is home to a large and complex microbial community with distinct compositions in different animal species related to their anatomic specificities and habitual diet (frugivorous, herbivorous, folivorous, carnivorous, omnivorous).2 Gut microbes encode important biologic functions that affect host gut homeostasis (eg host nutrient metabolism, development and maintenance of the gut mucosal barrier, immunomodulation, protection against pathogens, xenobiotic and drugs metabolism).3,4 Understanding of the composition of the human gut microbiota and its potential influence on health stems mainly from cohort studies. These studies were facilitated by recent advances in bioinformatics, metabolomics and sequencing technologies,5,6 but also informed by studying animal models.7 It is therefore important to develop a better understanding of gut microbiota in the laboratory animals routinely used in pre-clinical models for human microbiota studies.
Rats and mice are among the most frequently used laboratory animals in diverse fields of life sciences including the microbiome, because of their gross physiologic similarities to humans, as well as similarities regarding their GIT anatomy at the organ, tissue and cell level.8 However, differences such as expanded colon and cecum capacity and distribution of particular cell types (e.g. Paneth cells absent in the cecum and proximal colon) are also evident.8,9 Utilization of mice instead of rats as a laboratory model has several advantages including small animal size, relatively low housing costs and the availability of well-established transgenic mouse strains as models for various human diseases.10 Refinements of the model include Germ-Free (GF) animals and their use as recipients for microbiota transplantation. This so-called “humanization” of the rodent GIT with human gut microbiota11,12 has improved the applicability of mice as a model for human gut-related studies. However some limitations have been identified; e.g., upon humanization, the mouse microbiota may develop as a hybrid microbiota which is neither human- nor mouse-like.13 In contrast, the rat (Rattus norvegicus) has been reported to better sustain human-like fecal microbiota profiles.14-16 Among various rat lineages, the non-consanguine Sprague-Dawley rat is widely used as model of human biology in several life science arenas (e.g., nutrition, pharmacology, toxicology) but little is known about its gut microbiota especially its evolution during the lifespan of the animals. Brooks and colleagues16 reported only 2 microbial phyla in the gut microbiota of Wistar rats, with about 2 thirds of the 44 OTUs (96% sequence identity) detected being classified as Firmicutes, and the remainder as Bacteroidetes. Improved sequencing throughput has led to a deeper understanding of these gut microbes in rats (e.g., references13,15,17). However, data remains sparse, and to our knowledge, the relationship between age and microbiota composition has not yet been studied in rats, in contrast to the human gut ecosystem.18,19
We therefore studied the fecal microbiota of a common laboratory rat lineage, the Norwegian Sprague Dawley rat, in a cross-sectional study under controlled environmental and dietary conditions. We report here the fecal microbiota of healthy animals over their lifespan and we compare it to the microbiota profiles of mice and humans.
Results
Rat gut microbiota composition changes significantly with aging
We studied the fecal microbiota of rats kept under controlled environmental conditions from birth as a function of their chronological age. After weaning at 3 weeks of age, rats remained on a constant diet (breeding rat diet) till week 12, when they were fed with an aging rat diet onwards (see Methods section and Table S6 for feed composition). The microbiota was sampled at weeks 3, 12, 14, 26, 52, 78 and 104. Fecal profiling revealed large microbiota composition differences between rats grouped according to their age (Fig. 1A and B), reflected in hierarchical clustering based on the microbiota into 3 groups: Prior to weaning (PW), after weaning Y1 (12-week-old to 26-week-old animals) and Y2 (52-week-old to 104-week-old animals). The relative abundance of several individual bacterial taxa was differentially associated with the different age groups (Fig. 1C and Table 1, the proportions by age at various taxonomic levels are provided in Fig. S1 and Tables S1 and S2). These taxa were derived principally from the phylum Firmicutes and phylum Bacteroidetes at both extremities of life, while Verrucomicrobia (Akkermansia) accounts for a substantial proportion of the Y1 microbiota composition (Fig. 1C). The Firmicutes: Bacteroidetes ratio (F/B) was similar for both the Y1 and Y2 clusters (respectively 1.73 and 1.45) but was significantly lower in PW rats (0.56, p < 0.001). The pre-weaning microbiota composition was characterized by higher abundance of taxa including Bacteroides, Lactobacillus, Blautia, Clostridium XI and Klebsiella compared with Y1 and Y2, likely influenced by suckling which stopped at week 3. The microbiota of Y1-rats was discernible from PW and Y2 mainly based on the high relative abundance of Akkermansia spp., Clostridium XIVa spp, Lachnospiraceae, Alistipes spp and Odoribacter spp, among others. Bacteria differentially associated with Y2 were classified as Barnesiella, Clostridiales, Ruminococcaceae, Ruminococcus and Clostridium IV, among others (Table 1; see also Tables S1 and S2).
Figure 1.
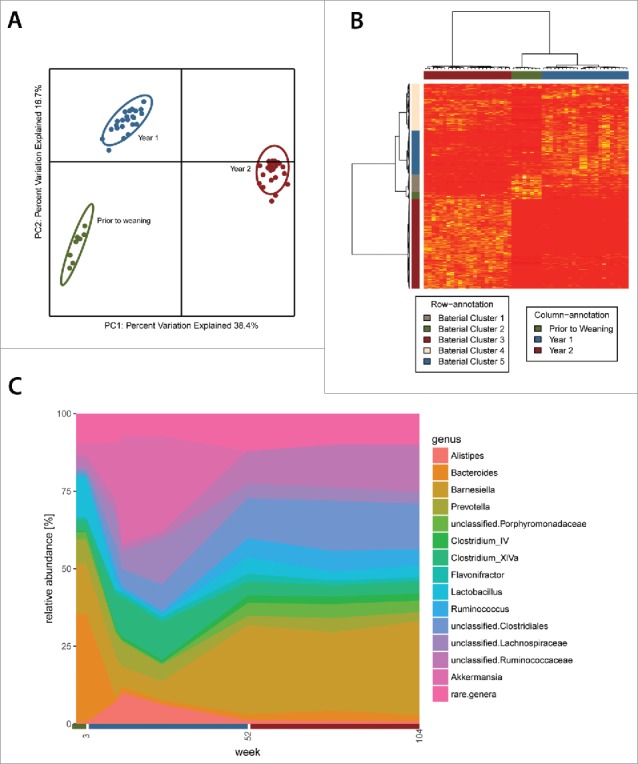
The composition of the fecal microbiota of rats is strongly associated with animal age. (A) Principal coordinates analysis (PCoA) of the unweighted UniFrac distance matrix and (B) hierarchical clustering separates rats into 3 groups according to age: 3 week old rats (Prior to weaning), 12 to 26 week old rats (Year 1) and 52 to 104 week old rats (Year 2). (C) Relative abundance of bacterial genera across the first 2-year lifespan of rats. Genera with an average relative abundance below 1% are grouped under “rare.genera” in the figure labeling.
Table 1.
Relative abundance of the 3 most abundant OTUs of each core.
| OTU ID | Mean PW (%) | Mean Year 1 (%) | Mean Year 2 (%) | Core | Genus |
|---|---|---|---|---|---|
| OTU0037 | 31.338 | 0.514 | 0.104 | Core | Bacteroides |
| OTU0047 | 7.710 | 7.120 | 3.464 | Core | Prevotella |
| OTU4360 | 2.134 | 14.005 | 0.069 | Core | Akkermansia |
| OTU0073 | 0.908 | 0.003 | 0.003 | Core PW | Klebsiella |
| OTU1371 | 0.691 | 0.011 | 0 | Core PW | Bacteroides |
| OTU1406 | 0.658 | 0.017 | 0.003 | Core PW | Barnesiella |
| OTU0067 | 0.005 | 5.738 | 0.031 | Core Y1 | Alistipes |
| OTU0132 | 0.009 | 1.677 | 0.071 | Core Y1 | Clostridium_XlVa |
| OTU5156 | 0.002 | 1.362 | 0.095 | Core Y1 | unclassified.Lachnospiraceae |
| OTU0075 | 0.002 | 0.001 | 12.873 | Core Y2 | Barnesiella |
| OTU0101 | 0.346 | 0.305 | 5.030 | Core Y2 | unclassified.Ruminococcaceae |
| OTU0218 | 0 | 0 | 3.222 | Core Y2 | Barnesiella |
| OTU0005 | 2.056 | 13.769 | 0.062 | Core Y1Y2 | Akkermansia |
| OTU0093 | 0.001 | 4.301 | 0.730 | Core Y1Y2 | Clostridium_XlVa |
| OTU0098 | 0.011 | 4.319 | 0.214 | Core Y1Y2 | unclassified.Lachnospiraceae |
| OTU0295 | 0.323 | 0.119 | 0.443 | Core PWY2 | Turicibacter |
| OTU0164 | 0.671 | 0.010 | 0.018 | Core PWY2 | Flavonifractor |
| OTU0006 | 0.115 | 0.018 | 0.469 | Core PWY2 | Roseburia |
| OTU0180 | 0.032 | 1.667 | 0.030 | Variable | Clostridium_XlVa |
| OTU0316 | 0 | 0 | 0.468 | Variable | Ruminococcus |
| OTU0593 | 0.143 | 0.245 | 0 | Variable | unclassified.Lachnospiraceae |
Dynamics of the gut microbial ecosystem
The microbiota compositional differences were also reflected in a progressive increase of the α-diversity determined by the Shannon effective number of species, ranging from 19.20 ± 8.62 in PW to 38.53 ± 14.70 for Y1 and 88.30 ± 22.38 for Y2 (Fig. 2A). Notwithstanding the dramatic variations in microbiota composition over the rat life-span, many OTUs were present in young as well as old animals (Fig. 2B). Comparing the core microbiota at different life stages (see Methods for details) highlights the dynamics of the gut microbial ecosystem. The youngest rats displayed the lowest species richness (180 OTUs per animal) across all analyzed life stages (Fig. 2C). Roughly one quarter of these OTUs (46 OTUs) were frequently present in most rats regardless of age, representing an age-independent core microbiota (labeled “Core” in Fig. 2B and C). Interestingly, this “Core” made up 83.7% of all reads in PW rats (Fig. 2C). Another quarter of the total OTUs (47 OTUs), comprising 9.7% of all reads, was only frequently present in PW (Labeled “Core PW” in Fig. 2B and C), indicating an adaptation to the gut ecosystem at this particular age/diet. The remainder of OTUs comprised the core microbiota of older animals as well as a set of rare taxa (combined abundance 1.3%) not commonly present in most rats regardless of age (“Variable”), possibly representing transient or subject-specific microbes. The richness increased to 321 OTUs and to 492 OTUs respectively in Y1 and Y2 animals. It was accompanied by a decrease of the abundance of the “Core” falling from 83.7% of all reads to 36.3% and 9.6% (red line in Fig. 2C). In Y1 animals, the “Core” was complemented by 52 OTUs only frequently present and abundant at this age (“Core Y1;” 14.7% of all reads) as well as 68 OTUs which were also frequently present and abundant in the oldest animals (“Core Y1Y2;" 39.9% of all reads). In Y2 animals a set of 172 OTUs comprised 65.8% of all reads and was only frequently present and abundant in this age group (“Core Y2”). On average 41.2% of the 492 OTUs (combined abundance 6.7%) of 2-year-old animals comprised OTUs present in only a subset of animals (“Variable”). It has previously been reported that methanogens become proportionally more abundant in the gut microbiota of rats with aging.20 Surprisingly, methanogenic archaea were either not detected or their abundance was below 0.05%. The recovered sequences belonged to the Methanobacteriales taxa Methanobrevibacter spp and Methanosphaera spp, as well as the recently discovered Methanomassiliicoccales, therefore showing a similar diversity to the one encountered in humans.21 The low prevalence and abundance was further confirmed by qPCR analyses (data not shown).
Figure 2.
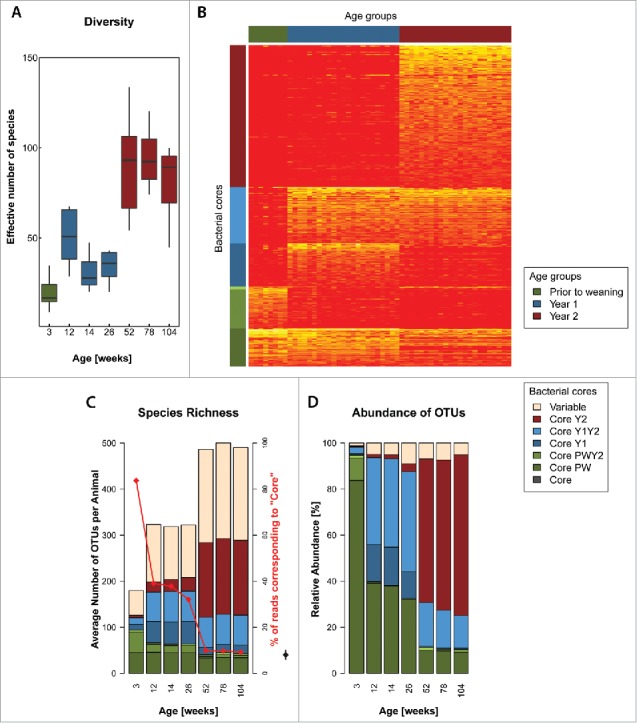
The phylogenetic diversity of the rat gut microbiota increases with age. (A) Fecal bacterial α-diversity across the lifespan of rats (Shannon effective number of species). (B) Heat-map of fecal bacterial OTU abundance shows the dynamics of the microbiota across the lifespan of rats. An age independent “Core” microbiota (see Materials and Methods) is supplemented with bacteria specific to the developmental stage of the rat (i.e., “Core PW,” “Core Y1” and “Core Y2”) and with bacteria incorporated into most animal's fecal microbiota as permanent members (i.e., “Core Y1Y2”). Bar graphs of Species richness (C) and relative OTU abundance (D) across the lifespan of rats and contributions of the different cores to these values. The increase in diversity is largely due to the “Variable” group of OTUs, i.e., OTUs which are only found in a subset of animals. Note the concomitant decrease in relative abundance (red line in panel C) but not presence of “Core” OTUs. The hinges of the boxes in the box-and-whisker plots represent the 25th to 75th percentile with the 50th percentile (median) drawn as the line inside the box. Whiskers extend to 1.5 times the interquartile range. All: Color coded as per legends to the right.
Fecal levels of short chain fatty acids correlate with age and gut microbiota composition
Fecal levels of short chain fatty acids (SCFAs) are associated with the composition of the human gut microbiota and of the diet.22 We thus measured fecal acetate, butyrate, propionate, caproate, heptanoate, isocaproate, isovalerate, isobutyrate and valerate levels and examined correlations with bacterial abundance. Although there is a degree of overlap, the overall profile of fecal SCFAs was significantly different between younger and older rats especially PW compared with Y2 (Fig. 3A). Fecal total SCFAs significantly increased with age (p < 0.001 for rats of year 2 against both PW and Y1 rats), mainly corresponding to an increase in levels of acetate, butyrate and propionate (Fig. 3B; Fig. S2). Other less abundant SCFAs did not change in concentration and because they were present in low levels, this had no net effect on total SCFA levels (Fig. S2). Furthermore, both several individual taxa (Table S3) and the sum of the abundance of the taxa that define bacterial clusters of Figure 1B significantly correlated with fecal levels of SCFAs (Fig. 3C).
Figure 3.
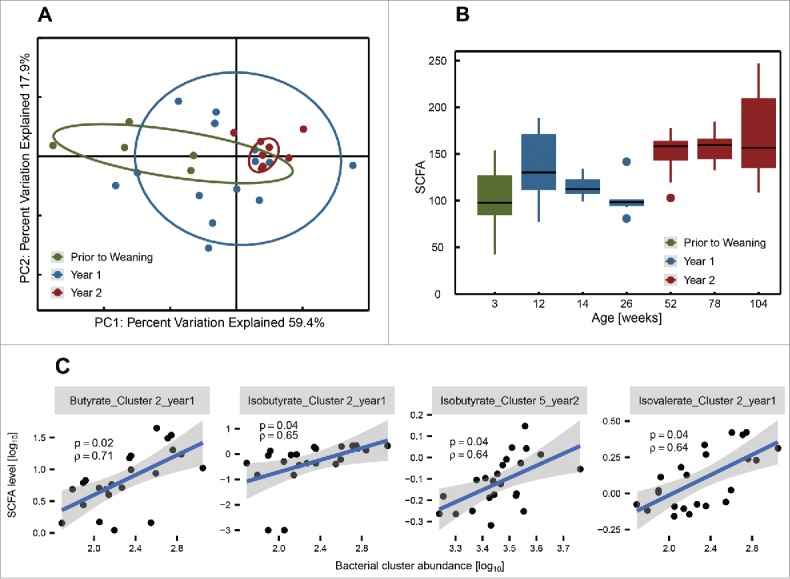
Fecal SCFA-levels in rats are associated with age and microbiota composition. (A) Principle coordinates analysis of the Spearman-rank distance and (B) boxplots of fecal SCFA levels reveal different SCFA profiles across the lifespan of the animals. Age groups and colors as in Figure 1. (C) The levels of several SCFAs were correlated with total abundance of bacterial clusters (Fig. 1B). The title of each panel indicates which SCFA was compared with which bacterial cluster and from which age group the samples were drawn. Blue lines indicate the linear regression model and shaded areas indicate the corresponding upper and lower confidence intervals. ρ = Spearman's rho. p = adjusted p-value (Benjamini-Hochberg). Only significant correlations shown. The hinges of the boxes in the box-and-whisker plots represent the 25th to 75th percentile with the 50th percentile (median) drawn as the line inside the box. Whiskers extend to 1.5 times the interquartile range.
Age is reflected in the predicted functional profile of the fecal microbiota
Prediction of the biochemical function of the microbiota was performed using PICRUSt software, which infers microbiota function based on genomes of reference organisms considering the relative abundance of genes involved in 256 KEGG pathways.23 The predicted functional profile of the microbiota was significantly different between rats of different age (Table S4). Interestingly, the collective distances between the PW samples and between Y1 samples on the PCoA (i.e. the areas defined by these groups) were considerably greater than Y2, indicating the acquisition of similar functional profiles over time (Fig. S3).
The experimentally determined fecal SCFA levels were corroborated by commensurate abundance of genes associated with propanoate metabolism, butanoate metabolism and fatty acid biosynthesis in the aging rat (Table S4). Moreover, the abundance of bacterial clusters 1 and 3 was significantly negatively and positively associated respectively with the predicted gene count for these SCFA pathways (Table S5). Also, predicted gene counts involved in methane metabolism were significantly different between PW and Y2 (P < 0.01) and between Y1 and Y2 (P < 0.001), with differences being non-significant between PW and Y1 (P > 0.05) (Table S4).
Interestingly, the predicted coding capacity of pathways for biogenesis of bacterial motility proteins, flagellar assembly and bacterial chemotaxis all gradually increased in relative abundance over time/age, indicating a general increase of microbial motility in the aging rat. Furthermore, genes encoding lipopolysaccharide biosynthesis became less abundant with aging of the rats, suggesting a net shift from gram-negative bacteria to gram-positive bacteria.
The abundance profiles of human core microbiota OTUs are more similar in rats than in mice
As rats are commonly used as a model of human biology, we were interested in comparing their fecal microbiota composition with that of humans and mice. We used data from 38 healthy elderly individuals (median age 68, 25th percentile 66 years, 75th percentile 70 years)24 and from a mouse microbiota study currently performed at the APC Microbiome Institute in Cork (14-week old mice). The sequencing library preparation method was identical for all investigated samples. However, there were differences in DNA extraction methodology and sequencing chemistry (Illumina's 2 × 250bp paired-end sequencing for human samples versus 2 × 300bp paired-end sequencing for rodent samples). The microbiota of the human samples was mainly comprised of Firmicutes, Bacteroidetes, Proteobacteria, Actinobacteria and Verrucomicrobia (Fig. S4), as also has been reported previously.25
Collectively, the gut microbiota of mice and rats was more similar to each other than to the gut microbiota of humans (Fig. 4A). Nonetheless, the overall abundance of the human core microbiota taxa (i.e., 62 OTUs from 23 bacterial genera present in at least 80% of human individuals) was higher in 1-year-old rats than in mice (Fig. 4B). This was also reflected in the average UniFrac distances between all pairwise human microbiota sample comparisons, vs. pairwise between human samples and animal samples (Fig. 4C), despite humans and rats share less OTUs than humans and mice (49 specific common OTUs vs 74, Venn-diagram inset Fig. 4A). In fact, some important members of the human gut microbiota, including Clostridium cluster XI, Akkermansia and some Lachnospiraceae were found at similar relative abundance in the faeces of rats, but not of mice (Fig. S5). However, it has to be noted that many individual human core-OTUs were either completely absent in rats (e.g., OTUs classified as Bifidobacterium, Collinsella, Blautia, Butyricicoccus, Gemmiger, Lachnospira and Lachnospiraceae, Oscillibacter, Ruminococcus) or displayed very low abundances in rats (e.g., OTUs classified as Anaerostipes, Bacteroides, Blautia, Coprococcus, Dorea, Faecalibacterium, Hespellia, Lachnospiraceae, Oscillibacter, Roseburia, Ruminococcus and Sporobacter).
Figure 4.
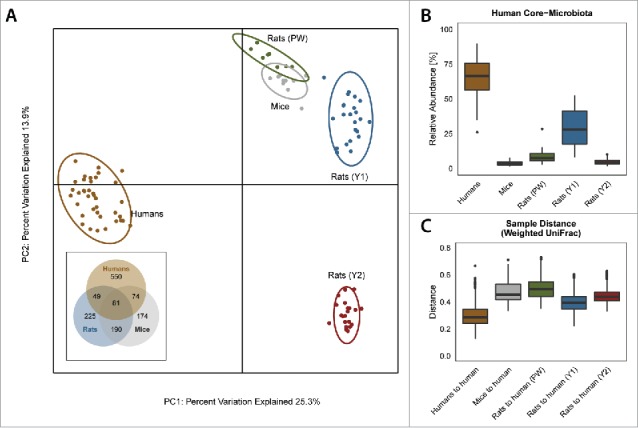
The fecal microbiota of 1 y old rats is more related to that of humans than it is to the microbiota of mice. (A) Unweighted UniFrac principal coordinate analysis. Fecal microbiota of rodents is more closely related to each other than to human fecal microbiota. Inset: Venn diagram of OTUs present inin faeces of humans, rats (only Y1) and micemice. (B) Box-plots of the relative abundance of human core bacterial OTUs (OTUs present in at least 80% of human individuals). More reads of these OTUs were found in the microbiota of up-to 1 y old animals (both PW and Y1) than in 14 week old C57Bl/6 mice. Except for comparison between “Mouse” and “Rat (Y2),” all p-values were below 0.05 (pairwise Wilcoxon test, adjusted after Benjamini-Hochberg). (C) Boxplots of the pairwise distance to human samples (weighted UniFrac). The distance was smallest for rats aged 12–26 weeks. All p-values below 0.05 (pairwise Wilcoxon test, adjusted after Benjamini-Hochberg). Age groups and colors for rats as in Figure 1. The hinges of the boxes in the box-and-whisker plots represent the 25th to 75th percentile with the 50th percentile (median) drawn as the line inside the box. Whiskers extend to 1.5 times the interquartile range.
Discussion
Rodents are among the most popular laboratory animals used in the life sciences, and mouse models are frequently used to investigate the impact of the microbiota on health and disease. The current study confirms that pairs of rodent species have a more similar gut microbiota than either does with human microbiota.2 Hampering the extrapolation of results from animal models to humans is the difference in microbiota composition of humans and mice, largely circumvented by humanization of gnotobiotic mice. However, humanized GF mice may still display a different microbiota to the human donor and health modulating bacteria often fail to colonize the mouse gut.26 These transplantation difficulties seem less problematic in rats in which most high-abundance human gut microbes were engrafted from donor feces to GF rat recipients, in contrast to GF mice.13 Results obtained here support the hypothesis of a closer similarity of human and rats to their gut microbial composition than that between humans and mice, which possibly accounts for the better engraftment of transplanted human microbiota into GF rats. This is illustrated by the presence of some genera (eg Anaerotruncus, Escherichia-Shigella, Oscillibacter, Ruminococcus) which were efficiently retained in rats after inoculation from a human donor but which were not retained by GF or AB-treated C57BL/6 mice.13 A recent comparison of the gut microbiota of mice and humans revealed 80 shared genera.27 This finding was confirmed (79 genera) by a meta-analysis8 while some genera were found specifically in humans and not in mice.27 Our study also indicates that most of these genera are not found in rats (Asteroleplasma, Mitsuokella, Megasphaera, Paraprevotella, Succinivibrio), but some were detected here like Sutterella and Phascolarctobacterium (mainly in Y2 rats) or Faecalibacterium (also mentioned in mice by8), and to a lesser extend Dialister (detected only once in an Y2 rat). Also, many individual human core-OTUs were either completely absent or displayed very low abundances in rats, but some genera were present either in some Y2 animals (Bifidobacterium and Gemmiger) or in all age-groups PW/Y1/Y2 (Blautia, Butyricicoccus, Oscillibacter, Ruminococcus). In addition, some important members of the human gut microbiota (Clostridium XI, Akkermansia and some Lachnospiraceae) displayed similar relative abundance in the feces of rats, but not of mice. Therefore, the in-house bred rats in this study naturally present a greater gut microbiota similarity to humans than to mice, varying during their lifespan.
With respect to the age-microbiota interaction, a limitation of the current study design was its cross-sectional nature, and we acknowledge that a longitudinal design, serially sampling tagged individual animals, would have yielded superior results. Nevertheless, our data provides evidence that colony (including the seed microbiota) was not a main contributor to the observed age-associated differences in microbiota composition. The source of the animals used in this study is a leading supplier of laboratory rodents in Europe and all breeding and housing was performed under optimized controlled conditions (filtered air, sterile diet, access restricted to dedicated technicians). Furthermore, animals were all born in the same environment (isolation chambers). So despite the fact that the animals were born on different days within a 2-year timeframe and were thus likely exposed to different maternal seed microbiotas, carefully controlling for external conditions including for the microbial environment appears to have accomplished introducing minimal bias. Supporting this contention, if, despite the careful setup, colony individualism had exerted a major effect on the microbiota, we would have been able to detect this effect during our analysis. However, when we analyzed data from 2 different colonies of rats during year 1 after weaning (12-week-, 14-week- and 26-week-old rats; samples from 12-week-old and 14-week-old rats came from the same colony) and from 3 different colonies during year 2 (52-,78- and 104-week-old rats), the samples from the different colonies clustered mainly by age (Fig. 1A) and not by colony. We thus conclude that we have detected a true age-effect and that possible effects of colony and/or seeding of the microbiota are secondary.
In-house breeding of Sprague Dawley rats was conducted under controlled dietary and environmental conditions, with no medication / antibiotics administered. The fecal microbiota profiles were determined from healthy rats ranging from their weaning to more than 700 d of life. This revealed changes across age with 3 main stages beginning at weaning with a low-diversity microbiota being progressively enriched, presumably by constant exposure to environmental microorganisms. This led to an increased diversity and a concomitant gradual diminution of the core microbiota abundance, decreasing from more than 80% of all reads in PW to less than 10% in Y2 (Fig. 2B). This finding points out the importance of an initial seed microbiota that will be kept during life and which may affect the acquisition of other microbes. Diet appears to be an important factor that shapes the microbiota as observed during the transition from PW to Y1. However, the diet change at week 12 had little effect as shown by a similar profile at weeks 12, 14 and 26. Furthermore, the fact that the Y2 microbiota composition separates from Y1 even though the diet was unchanged indicates that other factors have to be considered. This is particularly evident between 26 and 52 weeks after birth: The collective capacity of the microbiota to perform amino acid metabolism severely decreased between Y1 and Y2, as did the metabolism of cofactors and vitamins (Table S4). This was however not the case for biotin / Vit B7 in contrast to what has been reported to occur in a model of frailty in mice.28 This possibly reflects the absence of detectable frailty readouts in the aged rats in this study. Anyway, factors other than diet that shape the microbiota in older rats may include general physiologic modifications induced by aging, with Y2 corresponding to a new biologic stage in the life of rats. While the gut is likely exposed continuously to new microbes, some thrive only for a limited length of time, possibly fulfilling important temporary functional roles for gut homeostasis. However, others may become incorporated as permanent members of the microbiota when provided permissive ecological conditions, possibly at peculiar stage of rats' life independently of the diet. Our data also provide clues that the selection of particular microorganisms to which rats are exposed is driven by an adaptation of the gut microbiota to a more efficient energy-harvesting configuration to act upon accessible nutrients, illustrated by the acquisition of similar functional profiles over time. These microbial changes affect SCFA production which in turn likely affects the physiology of the rat. Importantly, among the functional microbial changes, the increase in motility genes observed in aging rats merits further attention in the context of aging related inflammation and metabolic disorders, recognizing that flagellin is a canonical TLR5 ligand,29 and that TLR5 has a surveillance role which when disturbed leads to obesity.30
In conclusion, the gut microbiota of healthy laboratory rats changes throughout the lifespan. However, they maintain a core microbiota and display an increased diversity that corresponds to the acquisition of more similar functional profiles across animals. Despite the absence of some genera found in humans, or the presence of specific ones shared with mice, fecal microbiota in cluster Y1 rats was more related to that of humans than mice. This likely accounts for the higher similarity to the initial human fecal inoculum achieved in gnotobiotic rats compared with mice.13,14 Overall, considering the metabolic behavior of the gut microbiota, the dynamics of the gut microbiota in rats should be taken into account when using rats for pre-clinical models e.g., for nutritional or toxicological studies.
Materials and methods
Study design and breeding conditions of animals
Animals (Rattus norvegicus Sprague-Dawley) were bred in Janvier Labs (Le Genest Saint Isle, France) with a certified management system for the breeding, purchase and delivery of rodents devoted to research and biomedical control. Only dedicated trained staff was handling animals in the controlled conditions of the laboratory equipped with appropriate ventilation and technical equipment. Animals were bred from birth to 12 weeks in a specific production unit and then transferred by aseptic methods to another unit. Only animals with no signs of disease at the moment of sampling (fecal pellets) were used. The health status of each animal colony was assessed by an independent laboratory using FELASA-based recommendations. Rats were randomly chosen from different cages for sampling of fecal pellets to avoid coprophagy-induced cross-contamination of samples.31 Rats had ad lib access to water (6–8ppm chlorinated, pH = 5) and food. Autoclaved food was composed of a complete feed for rats with 18% crude proteins (ssniff S8189-S105) from 3 weeks to 12, then replaced by a complete feed with 15% crude proteins (ssniff S8189-S085) (ssniff Spezialdiäten GmbH, Germany). Detailed composition of these feeds are given in Table S6. Rats were sampled at weeks 3 after birth (before weaning or PW), at weeks 12, 14 and 26 (referred as year 1 or Y1), and at weeks 52, 78 and 104 (Year 2 or Y2). The study was cross-sectional as rats of different ages were all sampled at the same date (+/− 2 days) with the exception of rats aged 12 and 14 weeks, which were randomly chosen from the same colony and which were sampled at the 2 time-points. The total number of samples/animals studied per time-point was as follows: Week 3: 8; Week 12: 8; Week 14: 8; Week 26: 7; Week 52: 8; Week 78: 7; Week 104: 8. To compare the microbiota of rats with the microbiota of laboratory mice and elderly humans we included sequencing data from 38 elderly healthy individuals24 and from 10 mice (14-week-old) of an ongoing study in the APC Microbiome Institute in the analysis. The sequencing data for these samples was available and all sequences were processed together as described in “Analysis of 16S amplicon sequencing data.”
Extraction of nucleic acids, 16S rRNA amplicon sequencing and qPCR analyses
DNA was extracted from 250 mg of frozen rat stool using the protocol of Yu and Morrison coupled with Qiagen DNA Stool Mini Kit (Qiagen, West Sussex, UK).32 DNA from 180–220 mg of mouse stool was extracted using Qiagen's QIAamp Fast DNA Stool mini kit. DNA quantifications were performed using NanoDrop ND-1000 spectrophotometer (NanoDrop Technologies, Wilmington, DE). Libraries for 16S rRNA amplicon sequencing of the V3 and V4 regions were prepared following the guidelines provided by Illumina (San Diego, USA; Part #15044223, Rev. B). In brief, 50 ng of extracted fecal DNA were subjected to a PCR with 25 cycles, followed by purification using Agencourt XP beads (Beckman Coulter, Takeley, UK). Then dual multiplexing barcodes were annealed to each amplicon and the reactions were purified again. Finally, amplicons were pooled to equimolar concentrations and sequenced on a MiSeq using 2*300 bp chemistry (Illumina, San Diego, USA). Sequence of the primers used were TCGTCGGCAGCGTCAGATGTGTATAAGAGACAGCCTACGGGNGGCWGCAG (V3, forward) and GTCTCGTGGGCTCGGAGATGTGTATAAGAGACAGGACTACHVGGGTATCTAATCC (V4, reverse). Detection of methanogens was performed by quantitative PCR using specific primers for Methanobrevibacter smithii, Methanosphaera stadtmanae and Methanomassiliicoccales. Primer sequences and annealing temperatures have been described previously for M. smithii and M. stadtmanae.33 Primers for Methanomassiliicoccales were GATTCTGAGACACGAATCCAGG and CGTCTTACCCAGCCCTTATTC (Ca. Methanomethylophilus alvus digestive cluster), used at an annealing temperature of 58°C. Reactions were performed using reactants (Brilliant III Ultra-Fast SYBR® Green QPCR, Agilent, Palo-Alto, CA, USA) and manufacturer instructions on the Mx-3005P qPCR apparatus (Agilent, Palo-Alto, CA, USA).
Analysis of 16S amplicon sequencing data
Analysis of 16S rRNA amplicon data was performed as described previously.24 Briefly, barcodes were reattached to the libraries, which were obtained as demultiplexed libraries per sample, adaptors were removed and paired-end sequencing reads were merged using FLASH.34 Merged sequences were then processed in QIIME35 and usearch36 to obtain an OTU table. Representative sequences were classified using mothur37 against the 16S rRNA reference of RDP, version 14. Additionally, an OTU-table was obtained using QIIMEs pick_closed_reference_otus.py and the green genes database version 13_5 for input into PICRUSt.38,23
Short chain fatty acids analysis
Fecal samples were weighed, diluted in 2 mL of sterile water and then centrifuged (8,000 × g, 10 min). 85 µl of 2-ethylbutyric acid (49 mM) and 20 µl of phosphotungstic acid (500 g.L−1) were added to the supernatant and samples were then incubated at 4°C overnight. Acetate, propionate, butyrate, isobutyrate, valerate, isovalerate, caproate, isocaproate and heptanoate were assayed using gas chromatography using 2-ethyl-butyrate as internal standard (HP 6890 series, column HP-INNOVAX 30 m × 250 μm × 0.25 μm, split ratio = 25:1, Agilent Technologies, Palo Alto, CA, USA).39 The concentration of SCFAs was normalized against the initial stool weight.
Statistical analysis
Statistical analysis was performed in R40 using appropriate methods including paired or non-paired t-test or Wilcoxon-tests and permutational multivariate analysis of variance using distance matrices (pMANOVA). Distance matrices were calculated using unweighted UniFrac, weighted UniFrac41 and Spearman-rank distance. Correction for multiple testing was performed using the method of Benjamini and Hochberg.42 Rat core-microbiota across different developmental stages was determined as follows. The “core” microbiota comprises all OTUs which were present in at least 80% of rats of each age group, i.e., present in 80% or more of prior-to-weaning rats, year-1 rats and year-2 rats. Similarly, the “core PW” comprises OTUs which were present in at least 80% of prior-to-weaning rats. Core Y1: OTUs present in at least 80% of 12-week-old to 26-week-old rats. Core Y2: OTUs present in at least 80% of 52-week-old to 104-week-old rats. Core PWY2 and Core Y1Y2 combinations of above (no OTUs in group Core PWY1). Variable: OTUs not in any of above categories. In the case where OTUs qualified for 2 groups the group containing more age-groups took precedence e.g., OTUs in Core Y1Y2 would also qualify for either Core Y1 or Core Y2, but membership of Core Y1Y2 took precedence.
Supplementary Material
Availability of materials and data
Rat microbiota sequencing data has been submitted to the European Nucleotide Archive (ENA) and is publicly available under the study number PRJEB21217 (http://www.ebi.ac.uk/ena/data/view/PRJEB21217).
Abbreviations
- F/B
Firmicutes vs Bacteroidetes ratio
- GF
germ-free
- GIT
Gastro-intestinal tract
- KEGG
Kyoto encyclopedia of genes and genomes
- LPS
lipopolysaccharides
- NGS
Next-generation sequencing
- OTU
operational taxonomic units
- PCoA
principal coordinates analysis
- pMANOVA
permutational multivariate analysis of variance
- PW
before weaning
- QIIME
quantitative insights into microbial ecology
- SCFAs
short-chain fatty acids
- TLR5
Toll-like receptor 5
- Y1
year one
- Y2
year two
Disclosure of potential conflicts of Interest
No potential conflicts of interest were disclosed.
Acknowledgments
We thank Janvier Labs (rodent research models and associated service) for breeding animals and providing fecal samples of rats, and especially Sylvie Bouilly and Eloise Delamaire for their valuable help and collaborations. We thank Amy Hesketh for her contribution to this study.
Funding
NG received a PhD scholar grant from the French “Ministère de l'Enseignement et de la Recherche.” WT received a PhD scholar grant from the Auvergne council. PPC received a post-doctoral fellowship from “Université d'Auvergne.” Work in PWOT's laboratory was supported by Science Foundation Ireland through a Center award to the APC Microbiome Institute (SFI/12/RC/2273).
References
- [1].Sender R, Fuchs S, Milo R. Revised Estimates for the Number of Human and Bacteria Cells in the Body. PLoS Biol 2016; 14(8):e1002533; PMID:27541692; https://doi.org/ 10.1371/journal.pbio.1002533 [DOI] [PMC free article] [PubMed] [Google Scholar]
- [2].Ley RE, Hamady M, Lozupone C, Turnbaugh PJ, Ramey RR, Bircher JS, Schlegel ML, Tucker TA, Schrenzel MD, Knight R, Gordon JI. Evolution of mammals and their gut microbes. Science 2008; 320:1647-51; https://doi.org/ 10.1126/science.1155725 [DOI] [PMC free article] [PubMed] [Google Scholar]
- [3].Sommer F, Bäckhed F. The gut microbiota–masters of host development and physiology. Nat Rev Microbiol 2013; 11:227-38; PMID:23435359; https://doi.org/ 10.1038/nrmicro2974 [DOI] [PubMed] [Google Scholar]
- [4].Rooks MG, Garrett WS. Gut microbiota, metabolites and host immunity. Nat Rev Immunol 2016; 16:341-52; https://doi.org/ 10.1038/nri.2016.42 [DOI] [PMC free article] [PubMed] [Google Scholar]
- [5].Franzosa EA, Hsu T, Sirota-Madi A, Shafquat A, Abu-Ali G, Morgan XC, Huttenhower C. Sequencing and beyond: integrating molecular ‘omics’ for microbial community profiling. Nat Rev Microbiol 2015; 13:360-72; https://doi.org/ 10.1038/nrmicro3451 [DOI] [PMC free article] [PubMed] [Google Scholar]
- [6].Mondot S, Lepage P. The human gut microbiome and its dysfunctions through the meta‐omics prism. Ann N Y Acad Sci 2016; 1372:9-19; PMID:26945826; https://doi.org/ 10.1111/nyas.13033 [DOI] [PubMed] [Google Scholar]
- [7].Kostic AD, Howitt MR, Garrett WS. Exploring host-microbiota interactions in animal models and humans. Genes Dev 2013; 27:701-18; PMID:23592793; https://doi.org/ 10.1101/gad.212522.112 [DOI] [PMC free article] [PubMed] [Google Scholar]
- [8].Nguyen TLA, Vieira-Silva S, Liston A, Raes J. How informative is the mouse for human gut microbiota research? Dis Model Mech 2015; 8:1-16; PMID:25561744; https://doi.org/ 10.1242/dmm.017400 [DOI] [PMC free article] [PubMed] [Google Scholar]
- [9].Treuting P M, Dintzis SM. Lower Gastrointestinal Tract In: Dintzis SM, Frevert CW, Liggitt HD, Montine KS, Treuting PM, editors. Comparative Anatomy and Histology – a Mouse and Human Atlas, 1st edn. Amsterdam (Netherlands): Elsevier; 2014. Chapter 12 [Google Scholar]
- [10].Vandamme TF. Use of rodents as models of human diseases. J Pharm Bioallied Sci 2014; 6:2; https://doi.org/ 10.4103/0975-7406.124301 [DOI] [PMC free article] [PubMed] [Google Scholar]
- [11].Turnbaugh PJ, Ridaura VK, Faith JJ, Rey FE, Knight R, Gordon JI. The effect of diet on the human gut microbiome: a metagenomic analysis in humanized gnotobiotic mice. Sci Transl Med 2009; 1:6ra14-6ra14; PMID:20368178; https://doi.org/ 10.1126/scitranslmed.3000322 [DOI] [PMC free article] [PubMed] [Google Scholar]
- [12].Hirayama K, Itoh K. Human flora-associated (HFA) animals as a model for studying the role of intestinal flora in human health and disease. Curr Issues Intest Microbiol 2005; 6:69-75 [PubMed] [Google Scholar]
- [13].Wos-Oxley M, Bleich A, Oxley AP, Kahl S, Janus LM, Smoczek A, Nahrstedt H, Pils MC, Taudien S, Platzer M, et al.. Comparative evaluation of establishing a human gut microbial community within rodent models. Gut Microbes 2012; 3:234-49; PMID:22572831; https://doi.org/ 10.4161/gmic.19934 [DOI] [PMC free article] [PubMed] [Google Scholar]
- [14].Alpert C, Sczesny S, Gruhl B, Blaut M. Long-term stability of the human gut microbiota in two different rat strains. Curr Issues Mol Biol 2008; 10:17-24; PMID:18525103 [PubMed] [Google Scholar]
- [15].Manichanh C, Reeder J, Gibert P, Varela E, Llopis M, Antolin M, Guigo R, Knight R, Guarner F. Reshaping the gut microbiome with bacterial transplantation and antibiotic intake. Genome Res 2010; 20(10):1411-19; PMID:20736229; https://doi.org/ 10.1101/gr.107987.110 [DOI] [PMC free article] [PubMed] [Google Scholar]
- [16].Brooks SP, McAllister M, Sandoz M, Kalmokoff ML. Culture-independent phylogenetic analysis of the faecal flora of the rat. Can J Microbiol 2003; 49:589-601; PMID:14663493; https://doi.org/ 10.1139/w03-075 [DOI] [PubMed] [Google Scholar]
- [17].Hamilton MK, Boudry G, Lemay DG, Raybould HE. Changes in intestinal barrier function and gut microbiota in high-fat diet-fed rats are dynamic and region dependent. Am J Physiol Gastrointest Liver Physiol 2015; 308:G840-51; https://doi.org/ 10.1152/ajpgi.00029.2015 [DOI] [PMC free article] [PubMed] [Google Scholar]
- [18].Rodríguez JM, Murphy K, Stanton C, Ross RP, Kober OI, Juge N, Avershina E, Rudi K, Narbad A, Jenmalm MC, et al.. The composition of the gut microbiota throughout life, with an emphasis on early life. Microb Ecol Health Dis 2015; 26:26050; PMID:25651996; https://doi.org/ 10.3402/mehd.v26.26050 [DOI] [PMC free article] [PubMed] [Google Scholar]
- [19].O'Toole PW, Jeffery IB. Gut microbiota and aging. Science 2015; 350:1214-15; https://doi.org/ 10.1126/science.aac8469 [DOI] [PubMed] [Google Scholar]
- [20].Maczulak AE, Wolin MJ, Miller TL. Increase in colonic methanogens and total anaerobes in aging rats. Appl Environ Microbiol 1989; 55:2468-73 [DOI] [PMC free article] [PubMed] [Google Scholar]
- [21].Gaci N, Borrel G, Tottey W, O'Toole PW, Brugère JF. Archaea and the human gut: new beginning of an old story. World J Gastroenterol 2014; 20:16062-78; PMID:25473158; https://doi.org/ 10.3748/wjg.v20.i43.16062 [DOI] [PMC free article] [PubMed] [Google Scholar]
- [22].Koh A, De Vadder F, Kovatcheva-Datchary P, Bäckhed F. From dietary fiber to host physiology: short-chain fatty acids as key bacterial metabolites. Cell 2016; 165:1332-45; https://doi.org/ 10.1016/j.cell.2016.05.041 [DOI] [PubMed] [Google Scholar]
- [23].Langille MG, Zaneveld J, Caporaso JG, McDonald D, Knights D, Reyes JA, Clemente JC, Burkepile DE, Vega Thurber RL, et al.. Predictive functional profiling of microbial communities using 16S rRNA marker gene sequences. Nat Biotechnol 2013; 31:814-21; PMID:23975157; https://doi.org/ 10.1038/nbt.2676 [DOI] [PMC free article] [PubMed] [Google Scholar]
- [24].Flemer B, Lynch DB, Brown JM, Jeffery IB, Ryan FJ, Claesson MJ, O'Riordain M, Shanahan F, O'Toole PW. Tumour-associated and non-tumour-associated microbiota in colorectal cancer. Gut 2016; 66(4):633-43; gutjnl-2015-309595. https://doi.org/ 10.1136/gutjnl-2015-309595 [DOI] [PMC free article] [PubMed] [Google Scholar]
- [25].Falony G, Joossens M, Vieira-Silva S, Wang J, Darzi Y, Faust K, Kurilshikov A, Bonder MJ, Valles-Colomer M, Vandeputte D, et al.. Population-level analysis of gut microbiome variation. Science 2016; 352(6285):560-4; PMID:27126039; https://doi.org/ 10.1126/science.aad3503 [DOI] [PubMed] [Google Scholar]
- [26].Silley P. Human flora‐associated rodents – does the data support the assumptions? Microbial Biotechnol 2009; 2:6-14; PMID:21261878; https://doi.org/ 10.1111/j.1751-7915.2008.00069.x [DOI] [PMC free article] [PubMed] [Google Scholar]
- [27].Krych L, Hansen CH, Hansen AK, van den Berg FW, Nielsen DS. Quantitatively different, yet qualitatively alike: a meta-analysis of the mouse core gut microbiome with a view towards the human gut microbiome. PLoS One 2013; 8:e62578; PMID:23658749; https://doi.org/ 10.1371/journal.pone.0062578 [DOI] [PMC free article] [PubMed] [Google Scholar]
- [28].Langille MG, Meehan CJ, Koenig JE, Dhanani AS, Rose RA, Howlett SE, Beiko RG. Microbial shifts in the aging mouse gut. Microbiome 2014; 2:1; https://doi.org/ 10.1186/s40168-014-0050-9 [DOI] [PMC free article] [PubMed] [Google Scholar]
- [29].Leifer CA, McConkey C, Li S, Chassaing B, Gewirtz AT, Ley RE. Linking genetic variation in human Toll-like receptor 5 genes to the gut microbiome's potential to cause inflammation. Immunol Lett 2014; 162:3-9; PMID:25284610; https://doi.org/ 10.1016/j.imlet.2014.07.017 [DOI] [PMC free article] [PubMed] [Google Scholar]
- [30].Chassaing B, Gewirtz AT. Has provoking microbiota aggression driven the obesity epidemic? Bioessays 2016; 38:122-8; PMID:26749135; https://doi.org/ 10.1002/bies.201500116 [DOI] [PubMed] [Google Scholar]
- [31].Soave O, Brand CD. Coprophagy in animals: a review. Cornell Vet 1991; 81:357-64 [PubMed] [Google Scholar]
- [32].Yu Z, Morrison M. Improved extraction of PCR-quality community DNA from digesta and fecal samples. Biotechniques 2004; 36:808-13 [DOI] [PubMed] [Google Scholar]
- [33].Mihajlovski A, Doré J, Levenez F, Alric M, Brugère JF. Molecular evaluation of the human gut methanogenic archaeal microbiota reveals an age‐associated increase of the diversity. Environ Microbiol Rep 2010; 2:272-80; PMID:23766078; https://doi.org/ 10.1111/j.1758-2229.2009.00116.x [DOI] [PubMed] [Google Scholar]
- [34].Magoč T, Salzberg SL. FLASH: fast length adjustment of short reads to improve genome assemblies. Bioinformatics 2011; 27:2957-63; PMID:21903629; https://doi.org/ 10.1093/bioinformatics/btr507 [DOI] [PMC free article] [PubMed] [Google Scholar]
- [35].Caporaso JG, Kuczynski J, Stombaugh J, Bittinger K, Bushman FD, Costello EK, Fierer N, Peña AG, Goodrich JK, Gordon JI, et al.. QIIME allows analysis of high-throughput community sequencing data. Nat Methods 2010; 7:335-6; PMID:20383131; https://doi.org/ 10.1038/nmeth.f.303 [DOI] [PMC free article] [PubMed] [Google Scholar]
- [36].Edgar RC. Search and clustering orders of magnitude faster than BLAST. Bioinformatics 2010; 26:2460-1; PMID:20709691; https://doi.org/ 10.1093/bioinformatics/btq461 [DOI] [PubMed] [Google Scholar]
- [37].Schloss PD, Westcott SL, Ryabin T, Hall JR, Hartmann M, Hollister EB, Lesniewski RA, Oakley BB, Parks DH, Robinson CJ, et al.. Introducing mothur: open-source, platform-independent, community-supported software for describing and comparing microbial communities. Appl Environ Microbiol 2009; 75:7537-41; PMID:19801464; https://doi.org/ 10.1128/AEM.01541-09 [DOI] [PMC free article] [PubMed] [Google Scholar]
- [38].DeSantis TZ, Hugenholtz P, Larsen N, Rojas M, Brodie EL, Keller K, Huber T, Dalevi D, Hu P, Andersen GL. Greengenes, a chimera-checked 16S rRNA gene database and workbench compatible with ARB. Appl Environ Microbiol 2006; 72:5069-72; PMID:16820507; https://doi.org/ 10.1128/AEM.03006-05 [DOI] [PMC free article] [PubMed] [Google Scholar]
- [39].Ounnas F, Privé F, Salen P, Gaci N, Tottey W, Calani L, Bresciani L, López-Gutiérrez N, Hazane-Puch F, Laporte F, et al.. Whole Rye Consumption Improves Blood and Liver n-3 Fatty Acid Profile and Gut Microbiota Composition in Rats. PLoS One. 2016; 11:e0148118; PMID:26862900; https://doi.org/ 10.1371/journal.pone.0148118 [DOI] [PMC free article] [PubMed] [Google Scholar]
- [40].Core Team R. R: A language and environment for statistical computing. Vienna, Austria: R Foundation for Statistical Computing; http://wwwR-projectorg/ [Google Scholar]
- [41].Lozupone C, Knight R. UniFrac: a new phylogenetic method for comparing microbial communities. Appl Environ Microbiol 2005; 71 :8228-35: https://doi.org/ 10.1128/AEM.71.12.8228-8235.2005 [DOI] [PMC free article] [PubMed] [Google Scholar]
- [42].Hochberg Y, Benjamini Y. More powerful procedures for multiple significance testing. Stat Med 1990; 9:811-8; PMID:2218183; https://doi.org/ 10.1002/sim.4780090710 [DOI] [PubMed] [Google Scholar]
Associated Data
This section collects any data citations, data availability statements, or supplementary materials included in this article.