Abstract
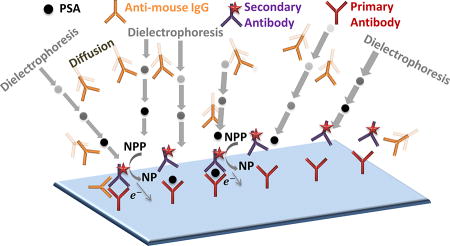
Proteomic biomarkers of interest to the early diagnosis of diseases and infections are present at trace levels versus interfering species. Hence, their selective enrichment is needed within bio-assays for speeding binding kinetics with receptors and for reducing signal interferences. While DC fields can separate biomolecules based on their electrokinetic mobilities, they are unable to selectively enrich biomarkers versus interfering species, which may possess like-charges. We present the utilization of AC electrokinetics to enable frequency-selective enrichment of nanocolloidal biomolecules, based on the characteristic time constant for polarization of their electrical double-layer, since surface conduction in their ion cloud depends on colloidal size, shape and surface charge. In this manner, using DC-offset AC fields, differences in frequency dispersion for negative dielectrophoresis are balanced against electrophoresis in a nanoslit channel to enable the selective enrichment of prostate specific antigen (PSA) versus anti-mouse immunoglobulin antibodies that cause signal interferences to immunoassays. Through coupling enrichment to capture by receptors on graphene-modified surfaces, we demonstrate the elimination of false positives caused by anti-mouse immunoglobulin antibodies to the PSA immunoassay.
Graphical abstract
Introduction
Biomolecular assays require the quantitative identification of trace levels of biomarkers within bio-fluids that also contain common interfering species, such as circulating antibodies, at million to billion-fold higher levels. Circulating human antibodies with receptor sites for animal proteins that arise upon exposure to particular antigens (so-called human anti-animal antibodies) have been recognized as a major source of interference to analyte detection using two-site or sandwich immunoassays1,2. Specifically for the case of immunoassays for prostate specific antigen (PSA), human anti-mouse antibodies (HAMA) of immunoglobulins (IgG) can cause false positives, leading to misdiagnosis and overtreatment of patients3,4. HAMA within serum can vary widely from µg/mL-g/mL levels, and can persist in blood for several months after antigen exposure. For the purpose of gauging post-operative cancer remission, PSA needs to be detected at sub-ng/mL levels5. Hence, the presence of PSA at nearly million to billion-fold lower levels than interfering HAMA species can lead to significant quantification errors, even at sub-1% interference levels. Current strategies to reduce interferences6 include assay redesign, introduction of chemical modifications to HAMA and suppressing the patient’s immune system. These approaches limit versatility of the immunoassay by requiring additional incubation steps and enhancing assay costs due to the need for additional reagents, while their effectiveness is limited by the wide variations in HAMA levels within typical patients. An alternate strategy is to cause rapid and selective enrichment of the biomarker versus the interfering species7, preferably within physiological media, to maintain its binding ability with receptors, without needing buffer changes that lead to dilution. Since antibody-based affinity methods that deplete the biomarker of interest cause only slow and mild levels of enrichment8; there is a need for complementary enrichment modalities.
Electrokinetic methods within nanochannels are commonly investigated for achieving highly enriched analyte plugs from dilute samples. Typically, a force balance under DC electrokinetics is coupled with the enhanced field arising from localized ion depletion in nanochannels to cause high degrees of biomarker enrichment9. However, due to the abrupt field profile, the trapped biomarkers are co-localized within a tightly confined region especially for molecules of like-charge, which limits the scope for selectivity based on spatially graded stacking. In this work, we additionally utilize the frequency-selective features of AC electrokinetics, since the electrical double-layer around the biomolecule exhibits a characteristic polarization dispersion due to surface conductance effects. Specifically, biomolecular size and shape alters the polarization time constant by determining the average distance required for surface conductance-induced polarization, while biomolecular zeta potential sharply influences the level of surface conductance to alter its polarization magnitude.
Selective translation of particles occurs by dielectrophoresis (DEP) due to the characteristic frequency response of dielectric permittivity of the particle versus the medium10,11,12,13, which has been applied towards enriching µm-scale colloids14,15. While DEP has recently been applied to the enrichment of nanoscale bio-colloids16, ss-DNA17,18,19, and proteins in physiological media17,20,21,22, its frequency-selective application towards biomarker enrichment for reducing assay interferences has not been reported. The frequency selectivity reported here draws on surface conduction effects in the electrical double-layer of sub-micron scale colloids23,24,25, wherein colloidal size and charge characteristically alter the time constant for polarization, thereby influencing its dispersion for positive dielectrophoresis (pDEP) in media of low conductivity. However, since we seek to selectively enrich and simultaneously bind proteomic biomolecules to receptors for enabling detection versus interfering species, we work within physiologically relevant media of high conductivity, wherein negative dielectrophoresis (nDEP) effects are highly significant. Hence, we focus instead on surface conduction-induced alterations to the nDEP dispersion. Using DC-offset AC fields, these nDEP differences at the characteristic frequency of interest are balanced versus electrophoresis within nanochannels26,27, to cause rapid and selective biomarker enrichment versus interfering species. Based on prior work on PSA enrichment for speeding immunoassays22, we enrich PSA with the necessary frequency-selectivity for reducing signal interferences on the immunoassay from circulating antibodies.
Results and discussion
Physical basis for selective enrichment
Polarized molecules are modeled as spherical colloids of radius ‘a’ (see ellipsoidal model in Supporting Information S3, wherein asymmetry in each direction is captured by axis lengths and respective de-polarization factors), within media of permittivity: εm, experiencing a time-averaged trapping force (FDEP) under an electric field (E) with a spatially varying gradient (∇E) given by:
| Eq. (1) |
Here, Ki(ω) is the frequency-dependent complex polarizability of the particle that depends on the complex permittivity of the medium (εm*) and effective permittivity of the particle ( ). The respective complex permittivities (ε*) are defined in terms of dielectric permittivity (ε) and conductivity (σ):
| Eq. (2) |
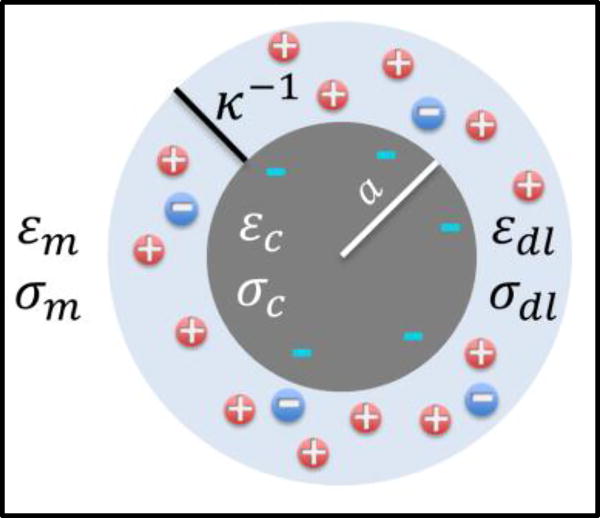
The effective complex permittivity of the colloid ( ) is computed using a simplified dielectric model, wherein it is represented by an insulating core (εcore & σcore) of radius: a, surrounded by a conductive ionic double-layer (εDL & σDL) of thickness: κ−1 and surface conductance: Ks, within media of relatively high conductivity (εm & σm), as per Fig. 1.
Figure 1.
Simplified dielectric model to compute effective permittivity ( ) of biomolecule is based on an insulating core (εc & σc) of radius: a, surrounded by a conductive ion cloud formed by the double-layer (εDL & σDL) of thickness: κ−1.
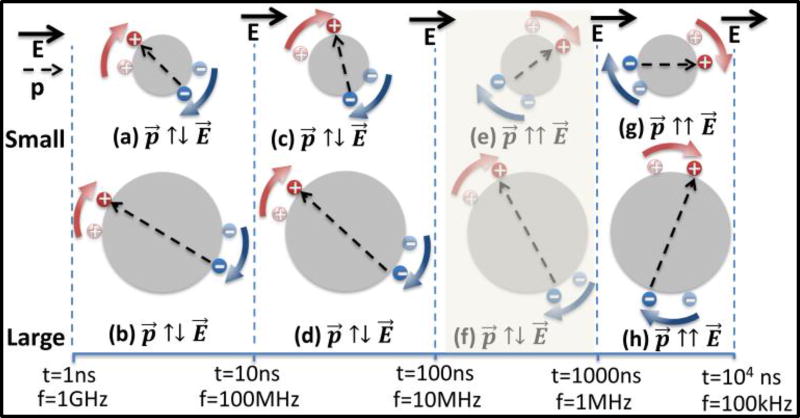
Based on Eq. (2), polarization of the composite nanocolloid (Ki(ω)) is determined at high frequencies (> 10 MHz) by the respective permittivity values: , whereas at lower frequencies (<10 MHz) it is determined by the respective conductivity values: . Due to the low net conductivity and permittivity levels of the colloid, we anticipate nDEP behavior or negative Ki(ω) values within conductive physiological media, since: and: . Hence, within the schematic of Fig. 2 that qualitatively describes the polarization dispersion versus colloid size, the nDEP behavior at high frequencies is represented (Fig 2a–2d) as medium-induced polarization anti-parallel to the applied field (p⃗ ↑↓ E⃗), which is independent of particle size. At lower frequencies, the net particle conductivity ( ) is chiefly determined by surface conductance (Ks) within the electrical double-layer of nanostructures, since Ks/a can greatly exceed the conductivity of the particle core (σc), as per simplification:
| Eq. (3) |
Figure 2.
(a–d) At high frequencies or early time periods, nanocolloids are polarized anti-parallel to the field (p⃗ ↑↓ E⃗), for small as well as large sized colloids. At lower frequencies (e–h), wherein sufficient time is available for surface conductance in the double-layer (red and blue arrows), the polarization on nanocolloids can be flipped parallel to the field (p⃗ ↑↑ E⃗). This time constant (τ) can differ for small versus large colloids (e vs. f) due to differences in average distance for surface conduction induced double-layer polarization.
As a result, the ion cloud around the particle can polarize parallel to the applied field (p⃗ ↑↑ E⃗), thereby causing pDEP. This is especially apparent within smaller sized nanostructures (Fig. 2e vs. 2f), wherein the pDEP bandwidth is greater.
The polarization dispersion can be computed using the simplified dielectric model in Fig. 1 (see ESI for ellipsoidal model), by expressing effective complex permittivity of the colloid ( ) in terms of dielectric properties of the insulating core and conducting double-layer, with ratio of external (core plus double layer) to internal (core) radius represented by ‘γ’.
| Eq. (4) |
As explained previously, the conductivity and permittivity of the core are insignificant versus the respective properties of the double layer. Hence, we focus on computing the dielectric properties of the double layer (εdl*):
| Eq. (5) |
For frequencies in the 0.1–100 MHz, it is reasonable to assume that εDL does not vary strongly with frequency, suggesting that the frequency variations arise chiefly due to σDL. As per Fig. 2, the effectiveness of surface conduction in the double-layer to flip the polarization direction on the net dipole (from: p⃗ ↑↓ E⃗ to p⃗ ↑↑ E⃗) depends on the ability of ions within the double layer to traverse the full distance around the particle surface within the half cycle of the electric field frequency. Consequently, surface conduction-induced flipping is highly effective at low frequencies (sufficient time for conduction) and at smaller colloidal size. The frequency dispersion of double layer conductivity is given by13:
| Eq. (6) |
The time constant (τ) required for surface conduction in the double-layer to flip the net polarization falls sharply (a2) with colloidal size, as given by13:
| Eq. (7) |
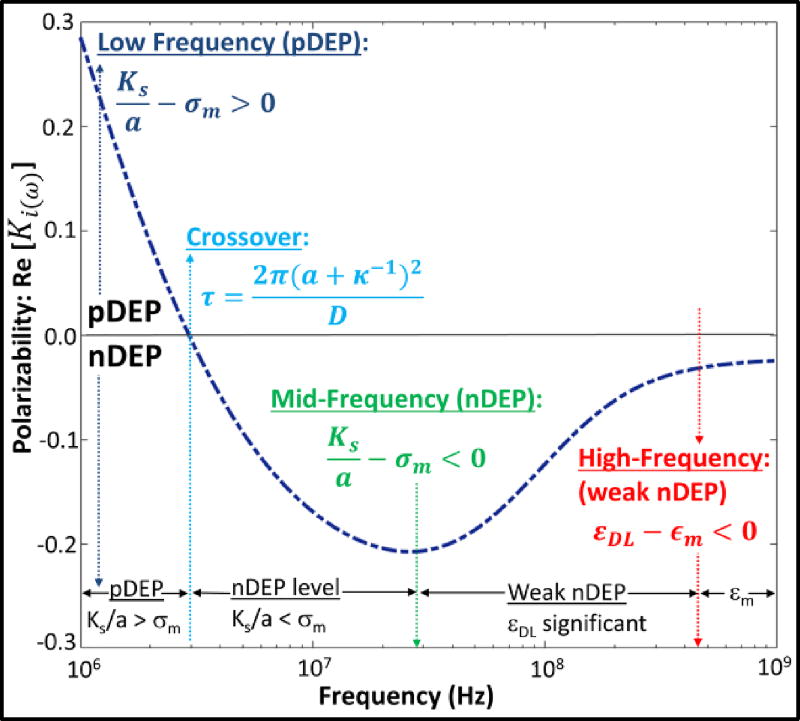
Here, D is the diffusion coefficient and κ−1 is the ionic strength-dependent length of the electrical double-layer. Hence, the polarization direction on smaller nanocolloids can be flipped to: p⃗ ↑↑ E⃗ (Fig. 2e) at earlier time periods versus on larger nanocolloids (Fig. 2f: p⃗ ↑↓ E⃗), due to the lower distance required for surface conductance-induced polarization of smaller particles. The simulated polarization dispersion (Fig. 3) shows pDEP at low frequencies, due to dominance of surface conduction; i.e. . With increasing frequency, the effectiveness of surface conduction drops, thereby lowering pDEP polarization versus frequency (Eq. (6)). Eventually, nDEP behavior is reached ( ), with the transition determined by the time constant for polarization (τ) in Eq. (7). At even higher frequencies wherein permittivity differences dominate the polarization behavior, the small difference in permittivity of the double-layer around the colloid (εDL) versus permittivity of the media (εm) causes weaker levels of nDEP than observed due to the respective conductivity differences in the mid-frequency range. Along similar lines, the net polarization dispersion also depends on colloidal shape11,28, due to directional alterations in the depolarization factor: Ai, where i = x, y, z; which is the ratio of the internal electric field induced by charges on the dielectric under external field to its net polarization. Simulations of polarization dispersion (Supporting Information: Fig. S2) show that deviations from spherical to ellipsoidal shape cause stronger polarization along the major axis to increase the pDEP level and bandwidth.
Fig. 3.
Computed polarization dispersion (Real [Ki(ω)]) shows pDEP at low frequencies due to high surface conduction in the double-layer, whereas less effective surface conduction at frequencies above the inverse time constant (τ) leads to nDEP, especially within media of high σm. At even higher frequencies, the small differences between εDL and εm lead to weak nDEP behaviour. (Simulation parameters29,30,31: σm=0.5 S/m, σm=75ε0, a = 1 nm, D=2×10⁻⁹ m2/s; Ks= 0.457 nS, κ−1= 1 nm, σcore=0.01 S/m, εcore=30ε0).
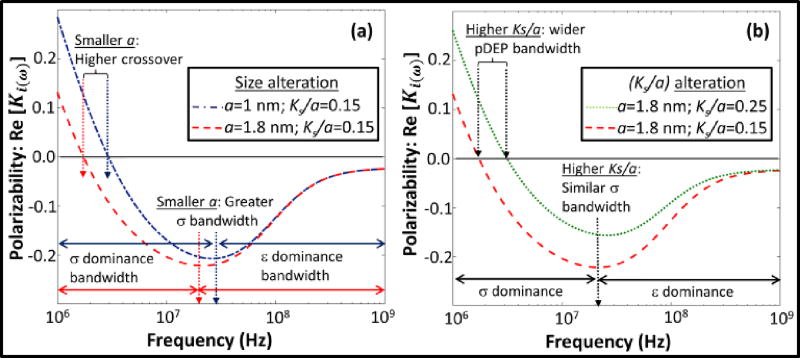
Variations to the polarization dispersion induced by alteration of colloidal size are shown in Fig. 4a, while those induced by surface conduction alterations for similar colloidal size, such as would occur for colloids of differing surface charge are computed in Fig. 4b. Smaller colloidal size significantly lowers the polarization time constant (τ) (Eq. (7)) due to its quadratic dependence on hydrodynamic radius (a), which can be observed as an upshifting in the crossover frequency. Also, due to the highly effective surface conduction within colloids of smaller size, the overall bandwidth of the region wherein conductivity effects dominate over permittivity effects is enhanced. This means that the εDL-driven weak nDEP behavior is pushed to higher frequencies for smaller colloids. On the other hand, surface charge of the colloid influences the net polarization dispersion due to the sharp hyperbolic cosine dependence of surface conductance (Ks) on its zeta potential (ξ)13. As a result, the higher surface conduction raises the pDEP level and its bandwidth, while inhibiting the nDEP level at higher frequencies (Fig. 4b). In summary, particle size and shape determine the polarization relaxation time constant (τ for: Fig. 2e vs. 2f), thereby modulating the frequency for onset of nDEP, whereas higher surface charge on the particle (i.e. higher Ks/a for same a value) inhibits the nDEP level.
Fig. 4.
Computed polarization dispersion for varying: (a) size; and (b) surface conduction represented as: Ks/a. (Simulation conditions similar to Fig. 3)
Influence of device geometry on force field
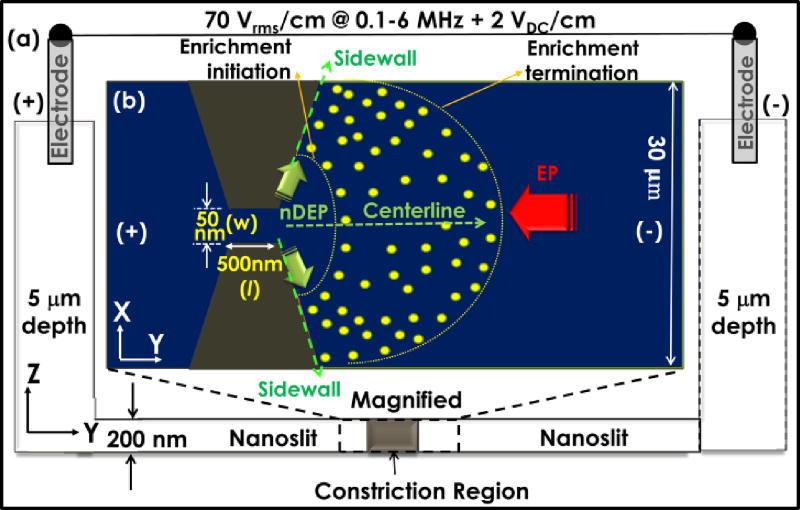
For electrokinetic enrichment of biomolecules, we use the device structure of Fig. 5. Under DC-offset AC field that is applied using electrodes in the reservoir; sharp field non-uniformities are initiated by lateral constrictions fabricated inside the nanoslit structure.
Fig. 5.
Negatively charged biomolecules enriched in the nanoslit at the cathodic interface of the constriction, with extent of trapping region wherein energy due to net force field (Eq. (8)) of nDEP (green arrows) versus electrophoresis (EP, red arrow) exceeds their thermal energy: (a) cross-sectional and (b) top-views.
Enrichment of biomolecules occurs under a force balance of nDEP versus electrophoresis (EP) per Eq. (8), in the trapping region where energy due to the net force field (Fnet) exceeds the thermal energy.
| Eq. (8) |
The enriched zone is broadened by diffusion. Hence, enrichment of negatively charged biomolecules occurs along the cathodic region away from the lateral constriction in the nanoslit. We choose to utilize enrichment under nDEP rather than that under pDEP, since the trapping region under DC-offset nDEP is sufficiently broad to enable its facile alignment to the sensor surface that is immobilized with receptors, for enabling target capture. Also, only weak pDEP occurs within the physiological media that is needed to capture target molecules. While FnDEP is given by Eq. (1), FEP is given by:
| Eq. (9) |
Here, μ is the electrophoretic mobility that is dependent on zeta potential (ξ) and viscosity (η). While colloidal size affects the respective magnitudes of FnDEP and FEP, the difference in enrichment levels between two molecules of differing sizes ( vs. ) is less strongly dependent on colloidal size and more strongly dependent on: (a) frequency-selectivity of FnDEP that arises from differences in polarization dispersion; and (b) differences in spatial profiles of FnDEP vs. FEP. Considering case (a), biomolecules can be enriched irrespective of their colloidal size differences, as long as an optimal frequency is chosen, wherein there are significant differences in their FnDEP level. Additionally, considering case (b), FnDEP is significant only in the immediate vicinity of lateral constriction due to its ∇E2 dependence, whereas FEP dominates elsewhere over the nanoslit due to its linear field dependence. As a result, the enrichment initiation boundary (Fig. 5) is determined by the FEP level and the enrichment termination boundary is determined by diffusion. Hence, biomolecules with lower FEP and higher diffusion can exhibit enrichment over a greater trapping zone away from the lateral constriction versus molecules of higher FEP. In the latter case, enrichment initiates closer to the constriction and is restricted to within a relatively narrow band, due to the exponential drop in FnDEP away from the constriction. In summary, enrichment selectivity arises due to differences in frequency dispersion of FnDEP, whereas the enrichment level depends on spatial profile of FnDEP vs. FEP, which determines extent of the biomolecular trapping region.
Effect of surface conduction on polarization time constant
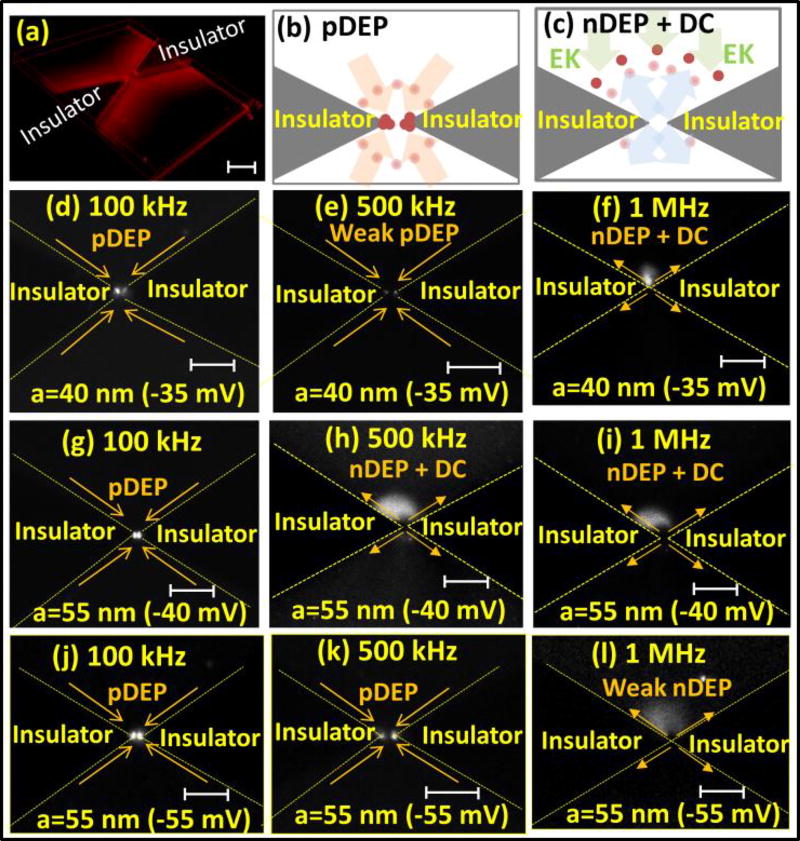
We validate the influence of colloidal size and surface charge on surface conduction in the double-layer by studying the polarization time constant of silica nanocolloids in 0.1× PBS (phosphate buffer saline) media (σm=0.1 S/m). Specifically, differing colloidal size and surface charge alters the surface conduction in the double-layer, thereby altering the crossover frequency from pDEP to nDEP, due to flipping of the net dipole. In this case, the device geometry shows lateral insulator constrictions of 1 µm gap (Fig. 6a), with the indicated positions for pDEP (Fig. 6b) and nDEP enrichment (Fig. 6c). At low frequencies (100 kHz), surface conduction in the double-layer has sufficient time to polarize the nanocolloid in the field direction, thereby exhibiting pDEP behavior for all types of nanocolloids (Fig. 6d, 6g & 6j). At higher frequencies (500 kHz), while smaller nanocolloids (a=40 nm) continue to exhibit polarization parallel to the field, as evident from the weak pDEP behavior, the surface conduction on larger nanocolloids (a=55 nm) is insufficient to induce polarization (nDEP in Fig. 6h & 6i). However, for similarly large nanocolloids (a=55 nm), but with a significantly higher zeta potential (ξ=−55 mV) that is created by carboxyl functional groups, the pDEP behavior continues to be apparent at 500 kHz. At 1 MHz, the insufficient time for surface conduction drives all of three nanocolloid-types to nDEP (Fig. 6f, 6i & 6l). However, the larger nanocolloid (a=55 nm) with the higher zeta potential (ξ=−55 mV) shows the weakest nDEP behavior of all three nanocolloid-types, consistent with the computed inhibition of nDEP levels with increasing surface conduction (Fig. 4b). Hence, the enhanced surface conduction that occurs on smaller colloids up-shifts the frequency for onset of nDEP, while higher surface charge on the colloid inhibits the level of nDEP.
Fig. 6.
(a) Lateral insulator constriction and schematic enrichment profile under: (b) pDEP; (c) nDEP (EK denotes DC-electrokinetics);. Frequency-dependent DEP after 20s for: (d, e & f) small (a=40 nm) versus (d, f & h) large (a=55 nm) colloids at ξ=−40 mV versus (j, k & l) ξ=−55 mV. Scale bar=4 µm and ξ potential in brackets.
Frequency-selective enrichment molecular biomarkers
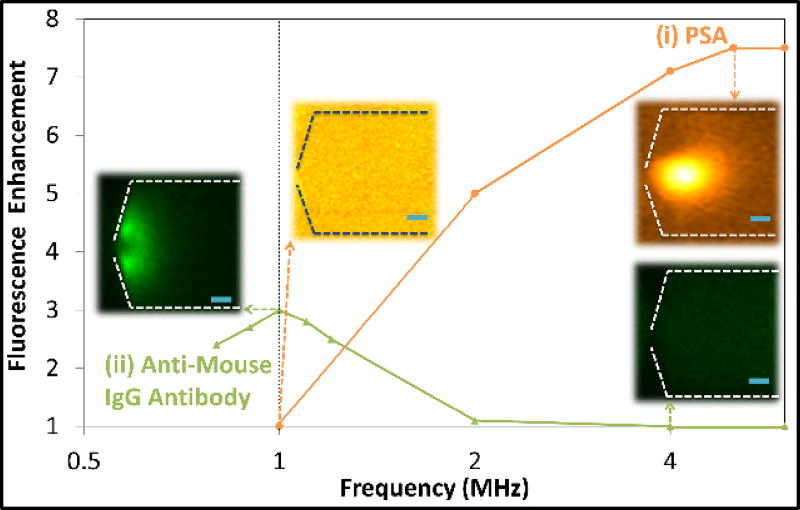
Next, we investigate the application of polarization dispersion characteristics towards enabling selective enrichment of biomarkers in PBS media, namely PSA (Fig. 7(i)) versus circulating antibodies of anti-mouse immunoglobulin (IgG) (Fig. 7(ii)), in the 0.8–6 MHz range. The fluorescence intensities for varying frequency conditions of nDEP induced electrokinetic trapping are determined by averaging the maximum intensities from 20 pixels across the image32 and normalizing these levels to those obtained under purely DC fields, where no perceptible rise in fluorescence is apparent. These IgG type antibodies interfere with analyte detection using sandwich immunoassays, by causing false positives. While the IgG antibody31 (~150 kDa) is significantly larger than free PSA (33 kDa), it is composed of various heavy (~50 kDa) and light (~25 kDa) peptide fragments that are comparable in size to serum PSA present within its free and bound forms (~90 kDa). Given these different forms of the biomolecules in the body, there is a need for enrichment methods other than size-based filtration. Additionally, we seek to enrich and detect the smaller molecule; i.e. PSA versus the larger interfering molecule (anti-mouse IgG), which is not easily accomplished by standard separation techniques. Figure 7 shows that PSA enrichment under nDEP requires AC-fields of 4–6 MHz, whereas anti-mouse IgG antibodies show only weak levels of enrichment in 0.8–1.2 MHz, with no enrichment beyond 2 MHz. At 5 MHz field (70 Vrms/cm plus 1.5 VDC/cm), while the fluorescence intensity of anti-mouse-IgG does not rise above background level, the respective intensity for PSA is enhanced ~7.5-fold. Based on linear rise of fluorescence intensity versus logarithm of biomarker concentration33,34, this suggests ~103-fold concentration enrichment in ~30 s, as validated previously22. The nDEP dispersion (Fig. 7) is consistent with the trend of polarization simulations (Fig. 4), suggesting that the time constant for surface conduction induced double-layer polarization is significantly higher for the larger anti-mouse IgG species versus smaller PSA molecules, thereby leading to nDEP onset at lower frequencies versus that for the case of smaller PSA molecules. This is also consistent with the observations in Fig. 6 showing that rapid double-layer polarization of smaller nanocolloids leads to nDEP behavior only at higher frequencies. Additionally, the open Y-shaped structure of IgG species31, with their highly charged groups likely enables significantly higher levels of surface charge versus that for the coiled structure of PSA. The high surface charge, on one hand, enhances surface conduction effects on IgG, thereby inhibiting the nDEP level, consistent with the simulations in Fig. 4b and the observations for the high zeta potential nanocolloids (Fig. 6l versus 6i). On the other hand, the high surface charge (ξ) leads to higher µEP and FEP (see Eq. 9) for the anti-mouse IgG species. Hence, FEP dominates over FnDEP in the force balance (Eq. 8) over much of the nanoslit length, thereby limiting IgG enrichment to the immediate vicinity of the constriction (Fig. 7(ii)), wherein FnDEP remains significant. With PSA molecules, while nDEP onset requires higher frequencies (few MHz) due to the lower double-layer polarization time-constant for smaller molecules (Eq. 7), the nDEP level is not inhibited. Furthermore, the lower surface charge and FEP on PSA enables enrichment over a wider region, as per the image of Fig. 7(i), since FnDEP is comparable to FEP over a greater region of the nanoslit. All of this explains the selective-enrichment of PSA in the 4–6 MHz range, wherein anti-mouse IgG is not enriched.
Figure 7.
Frequency-dependence of nDEP enrichment of PSA versus anti-mouse IgG in PBS media within the 0.8–6 MHz range in a nanoslit device with lateral constrictions (dashed line). Scale bar is 10 µm.
Eliminating false-positives on PSA immunoassay
Utilizing the selective enrichment characteristics of PSA versus anti-mouse IgG antibodies (field of: 70 Vrms/cm at 6 MHz offset by 1.5 VDC/cm), we couple PSA enrichment to immobilized receptors on graphene-modified surfaces to quantify immunoassay interferences due to false positive signals.
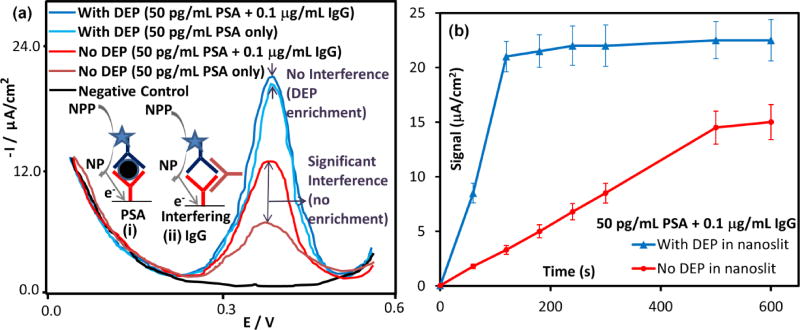
Electron transfer schematics are shown for the electrochemical detection platform of PSA (Figure 8a (i)) and for the pathway by which anti-mouse IgG antibody interferes with the sandwich immunoassay to cause false positives (Figure 8a (ii)). In the absence of nDEP enrichment inside the nanoslit device, a false positive signal due to immunoassay interference by anti-mouse IgG induced non-specific of binding is observed within a few minutes in the voltammograms (Fig. 8a), as well as within the binding kinetics plot that rises continuously without reaching steady-state levels (Fig. 8b). On the other hand, with nDEP enrichment inside the nanoslit device, no significant difference is observed between the immunoassay with just 50 pg/mL PSA versus that with an additional level (2×10⁴-fold higher levels) of interfering anti-mouse IgG antibodies. In contrast to the continuous signal rise over time (Fig. 8b) due to false-positives in the absence of nDEP enrichment, the respective kinetic plot in the presence of nDEP enrichment of PSA shows that the binding kinetics of PSA to the immobilized anti-PSA is significantly sped-up, while the near-flat steady-state signal after 2 minutes of binding confirms elimination of the IgG-induced interference on the immunoassay, even after 10 minutes.
Figure 8.
(a) Anti-mouse immunoglobulin (IgG) antibodies cause false positives to the PSA immunoassay, as per the electron transfer schematics shown in the inset: (i) vs. (ii) (assay details in reference22). In absence of nDEP enrichment in the nanoslit, signals from 50 pg/mL of PSA are ~2.5-fold higher in presence of 1 µg/mL IgG, whereas with nDEP enrichment, these false positives are insignificant. (b) Signal versus time plot shows that nDEP enrichment leads to rapid enhancement in binding kinetics of PSA, with near steady-state signals after 2 minutes, whereas in absence of enrichment, the signal level does not flatten out due to false positives.
Conclusions
AC electrokinetics with a DC offset field is used to enable frequency-selective enrichment of molecular biomarkers within physiological media, using nanoslit devices. Size and shape differences between biomolecules alter their time constant for surface conduction-induced double-layer polarization, thereby tuning the onset frequency for nDEP, whereas surface charge differences between biomolecules alter the opposing electrophoretic force field, thereby modulating enrichment levels. In this manner, we show the frequency-selective enrichment of PSA versus anti-mouse IgG antibodies in the 4–6 MHz range. By coupling enrichment to voltammetric detection using immobilized receptors on graphene-modified surfaces, we show that the false positives usually obtained with >104-fold higher levels of interfering anti-mouse IgG antibodies can be eliminated. Based on the rapid and selective biomarker enrichment characteristics of this AC electrokinetic methodology in conductive physiological media, we envision its application for biomarker discovery, protein crystallization and for speeding bio-assay kinetics and reducing assay interferences.
Experimental Methods
Details of the device geometry and operation are available in prior work22,26,35 and in Supporting Information †. Briefly, four reservoirs lead to a microchannel of 5 µm depth and several nanoslits of 200 nm depth, 30 µm width and 300 µm length. Within each nanoslit, a sharp lateral constriction is used to create spatial non-uniformities in the field. Experiments with biomarker enrichment were conducted in a supporting electrolyte of PBS (0.1 M, pH 7) of ~1.6 S/m conductivity, whereas this buffer was diluted ten-fold for enrichment studies with silica nanocolloids. Glassy carbon modified Pt electrodes were used to apply an AC field of 70 Vrms/cm in the 1–6 MHz range, with a 1.5 VDC/cm offset field to localize the nDEP enrichment. The data described herein is shown in the vicinity of the constriction region. Biomarkers were procured as follows: Alexa 488 labeled Goat anti-mouse IgG antibody (~150kDa) from Invitrogen / Thermo Fisher Scientific, Dylight 594 labeled Prostate Specific Antigen (~30 kDa) from Sigma Aldrich (St. Louis, MO). Fluorescently labeled silica nano-colloids (Sigma Aldrich; St. Louis, MO) were measured for size (dynamic light scattering and TEM) and zeta potential. The surface charge was altered by using carboxyl functionalization36. The nDEP enrichment was coupled to the PSA immunoassay immobilized on graphene and gold nanoparticle-modified working electrodes, alongside reference and counter electrodes for voltammetric detection. The PSA antibody immobilized on the detection electrode was orthogonally aligned to the nDEP enrichment region. The sandwich assay uses alkaline phosphatase (ALP) tagged to secondary PSA antibody for selective catalysis of α-naphthyl phosphate (NPP) to the electroactive α-naphthol (NP) product (see detection scheme in inset of Fig. 8a). Square-wave voltammetric (SWV) scans of α-NP were performed in PBS media by scanning from 0.1 to 0.4 VDC, using 100 Hz frequency; 4 mV step potential; and 25 mV AC amplitude. Standard deviations (±σ) were based on three different electrochemical measurements at each time point.
Supporting Information
† Supporting Information describes the experimental device (S1) and computation methodology for the polarization dispersions for spherical (S2) and ellipsoidal nanocolloids (S3).
Supplementary Material
Acknowledgments
We acknowledge support from US AFOSR AOARD #114083, NIH R21, UVA Cancer Center & NSF EAPSI Program.
Footnotes
Electronic Supplementary Information (ESI) available: See DOI: 10.1039/x0xx00000x
References
- 1.Kricka LJ. Human anti-animal antibody interferences in immunological assays. Clin Chem. 1999;45(7):942–956. [PubMed] [Google Scholar]
- 2.Hoofnagle AN, Wener MH. The fundamental flaws of immunoassays and potential solutions using tandem mass spectrometry. Journal of Immunological Methods. 2009;347(1–2):3–11. doi: 10.1016/j.jim.2009.06.003. [DOI] [PMC free article] [PubMed] [Google Scholar]
- 3.Park S, Wians FH, Jr, Cadeddu JA. Spurious prostate-specific antigen (PSA) recurrence after radical prostatectomy: Interference by human antimouse heterophile antibodies. International Journal of Urology. 2007;14(3):251–253. doi: 10.1111/j.1442-2042.2006.01648.x. [DOI] [PubMed] [Google Scholar]
- 4.Poyet C, Hof D, Sulser T, Müntener M. Artificial Prostate-Specific Antigen Persistence After Radical Prostatectomy. Journal of Clinical Oncology. 2012;30(5):e62–e63. doi: 10.1200/JCO.2011.38.2788. [DOI] [PubMed] [Google Scholar]
- 5.Gomella LG, Liu XLS, Trabulsi EJ, Kelly WK, Myers R, Showalter T, Dicker A, Wender R. Screening for prostate cancer: the current evidence and guidelines controversy. Can J Urol. 2011;18(5):5875–5883. [PubMed] [Google Scholar]
- 6.Levinson SS, Miller JJ. Towards a better understanding of heterophile (and the like) antibody interference with modem immunoassays. Clin Chim Acta. 2002;325(1–2):1–15. doi: 10.1016/s0009-8981(02)00275-9. [DOI] [PubMed] [Google Scholar]
- 7.Daniels JS, Pourmand N. Label-free impedance biosensors: Opportunities and challenges. Electroanal. 2007;19(12):1239–1257. doi: 10.1002/elan.200603855. [DOI] [PMC free article] [PubMed] [Google Scholar]
- 8.Polaskova V, Kapur A, Khan A, Molloy MP, Baker MS. High-abundance protein depletion: Comparison of methods for human plasma biomarker discovery. Electrophoresis. 2010;31(3):471–482. doi: 10.1002/elps.200900286. [DOI] [PubMed] [Google Scholar]
- 9.Kim SJ, Song YA, Han J. Nanofluidic concentration devices for biomolecules utilizing ion concentration polarization: theory, fabrication, and applications. Chem Soc Rev. 2010;39(3):912–922. doi: 10.1039/b822556g. [DOI] [PMC free article] [PubMed] [Google Scholar]
- 10.Pohl HA. The motion and precipitation of suspensoids in divergent electric fields. Applied Physics. 1951;22(7):869–871. [Google Scholar]
- 11.Jones TB. Electromechanics of particles. Cambridge University Press; Cambridge; New York: 1995. p. 265. [Google Scholar]
- 12.Pethig R. Review Article-Dielectrophoresis: Status of the theory, technology, and applications. Biomicrofluidics. 2010;4(2) doi: 10.1063/1.3456626. [DOI] [PMC free article] [PubMed] [Google Scholar]
- 13.Morgan H, Green NG. AC electrokinetics : colloids and nanoparticles. Research Studies Press; Institute of Physics Pub.; Distribution, North America, AIDC; Baldock, Hertfordshire, England; Philadelphia, Pa., Williston, VT: 2003. p. xvi.p. 324. [Google Scholar]
- 14.Madiyar FR, Bhana S, Swisher LZ, Culbertson CT, Huang X, Li J. Integration of a nanostructured dielectrophoretic device and a surface-enhanced Raman probe for highly sensitive rapid bacteria detection. Nanoscale. 2015;7(8):3726–3736. doi: 10.1039/c4nr07183b. [DOI] [PubMed] [Google Scholar]
- 15.Rohani A, Moore JH, Kashatus JA, Sesaki H, Kashatus DF, Swami NS. Label-free quantification of intracellular mitochondrial dynamics using dielectrophoresis. Anal Chem. 2017 doi: 10.1021/acs.analchem.6b04666. [DOI] [PMC free article] [PubMed] [Google Scholar]
- 16.Madiyar FR, Syed LU, Culbertson CT, Li J. Manipulation of bacteriophages with dielectrophoresis on carbon nanofiber nanoelectrode arrays. Electrophoresis. 2013;34(7):1123–1130. doi: 10.1002/elps.201200486. [DOI] [PMC free article] [PubMed] [Google Scholar]
- 17.Liao KT, Tsegaye M, Chaurey V, Chou CF, Swami NS. Nano-constriction device for rapid protein preconcentration in physiological media through a balance of electrokinetic forces. Electrophoresis. 2012;33(13):1958–1966. doi: 10.1002/elps.201100707. [DOI] [PubMed] [Google Scholar]
- 18.Swami N, Chou CF, Ramamurthy V, Chaurey V. Enhancing DNA hybridization kinetics through constriction-based dielectrophoresis. Lab Chip. 2009;9(22):3212–3220. doi: 10.1039/b910598k. [DOI] [PubMed] [Google Scholar]
- 19.Swami NS, Chou CF, Terberueggen R. Two-potential electrochemical probe for study of DNA immobilization. Langmuir : the ACS journal of surfaces and colloids. 2005;21(5):1937–41. doi: 10.1021/la0493767. [DOI] [PubMed] [Google Scholar]
- 20.Liao KT, Chou CF. Nanoscale molecular traps and dams for ultrafast protein enrichment in high-conductivity buffers. Journal of the American Chemical Society. 2012;134(21):8742–5. doi: 10.1021/ja3016523. [DOI] [PubMed] [Google Scholar]
- 21.Sanghavi BJ, Varhue W, Chavez JL, Chou CF, Swami NS. Electrokinetic Preconcentration and Detection of Neuropeptides at Patterned Graphene-Modified Electrodes in a Nanochannel. Anal Chem. 2014;86(9):4120–4125. doi: 10.1021/ac500155g. [DOI] [PubMed] [Google Scholar]
- 22.Sanghavi BJ, Varhue W, Rohani A, Liao K-T, Bazydlo LAL, Chou C-F, Swami NS. Ultrafast immunoassays by coupling dielectrophoretic biomarker enrichment in nanoslit channel with electrochemical detection on graphene. Lab Chip. 2015;15(24):4563–4570. doi: 10.1039/c5lc00840a. [DOI] [PubMed] [Google Scholar]
- 23.Hughes MP, Morgan H, Flynn MF. The dielectrophoretic behavior of submicron latex spheres: Influence of surface conductance. Journal of colloid and interface science. 1999;220(2):454–457. doi: 10.1006/jcis.1999.6542. [DOI] [PubMed] [Google Scholar]
- 24.Ermolina I, Morgan H. The electrokinetic properties of latex particles: comparison of electrophoresis and dielectrophoresis. Journal of Colloid and Interface Science. 2005;285(1):419–428. doi: 10.1016/j.jcis.2004.11.003. [DOI] [PubMed] [Google Scholar]
- 25.Basuray S, Chang H-C. Induced dipoles and dielectrophoresis of nanocolloids in electrolytes. Physical Review E. 2007;75(6):060501. doi: 10.1103/PhysRevE.75.060501. [DOI] [PubMed] [Google Scholar]
- 26.Rohani A, Varhue W, Liao KT, Chou CF, Swami NS. Nanoslit design for ion conductivity gradient enhanced dielectrophoresis for ultrafast biomarker enrichment in physiological media. Biomicrofluidics. 2016;10(3):033109. doi: 10.1063/1.4954933. [DOI] [PMC free article] [PubMed] [Google Scholar]
- 27.Sanghavi BJ, Moore JA, Chavez JL, Hagen JA, Kelley-Loughnane N, Chou CF, Swami NS. Aptamer-functionalized nanoparticles for surface immobilization-free electrochemical detection of cortisol in a microfluidic device. Biosensors & bioelectronics. 2016;78:244–52. doi: 10.1016/j.bios.2015.11.044. [DOI] [PubMed] [Google Scholar]
- 28.Fernandez RE, Rohani A, Farmehini V, Swami NS. Review: Microbial analysis in dielectrophoretic microfluidic systems. Analytica Chimica Acta. 2017 doi: 10.1016/j.aca.2017.02.024. https://doi.org/10.1016/j.aca.2017.02.024. [DOI] [PMC free article] [PubMed]
- 29.Stojek Z. Electroanalytical methods. Springer; 2010. The electrical double layer and its structure; pp. 3–9. [Google Scholar]
- 30.Pethig RR. Dielectrophoresis: Theory, Methodology and Biological Applications. John Wiley & Sons; 2017. [Google Scholar]
- 31.Sandin S, Öfverstedt L-G, Wikström A-C, Wrange Ö, Skoglund U. Structure and flexibility of individual immunoglobulin G molecules in solution. Structure. 2004;12(3):409–415. doi: 10.1016/j.str.2004.02.011. [DOI] [PubMed] [Google Scholar]
- 32.Rohani A, Varhue W, Su Y-H, Swami NS. Quantifying spatio-temporal dynamics of biomarker pre-concentration and depletion in microfluidic systems by intensity threshold analysis. Biomicrofluidics. 2014;8(5):052009. doi: 10.1063/1.4897283. [DOI] [PMC free article] [PubMed] [Google Scholar]
- 33.Yue G, Ye H, Huang X, Ye W, Qiu S, Qiu B, Lin Z, Chen G. Quantification of DNA through a fluorescence biosensor based on click chemistry. Analyst. 2014;139(22):5669–5673. doi: 10.1039/c4an01438c. [DOI] [PubMed] [Google Scholar]
- 34.Bakewell D, Morgan H. Quantifying dielectrophoretic collections of sub-micron particles on microelectrodes. Measurement Science and Technology. 2003;15(1):254. [Google Scholar]
- 35.Fernandez RE, Sanghavi BJ, Farmehini V, Chávez JL, Hagen J, Kelley-Loughnane N, Chou C-F, Swami NS. Aptamer-functionalized graphene-gold nanocomposites for label-free detection of dielectrophoretic-enriched neuropeptide Y. Electrochemistry Communications. 2016;72:144–147. [Google Scholar]
- 36.An Y, Chen M, Xue Q, Liu W. Preparation and self-assembly of carboxylic acid-functionalized silica. Journal of Colloid and Interface Science. 2007;311(2):507–513. doi: 10.1016/j.jcis.2007.02.084. [DOI] [PubMed] [Google Scholar]
Associated Data
This section collects any data citations, data availability statements, or supplementary materials included in this article.


