

SUMMARY
Replication-transcription collisions shape genomes, influence evolution, and promote genetic diseases. Although unclear why, head-on transcription (lagging strand genes) is especially disruptive to replication and promotes genomic instability. Here, we find that head-on collisions promote R-loop formation in Bacillus subtilis. We show that pervasive R-loop formation at head-on collision regions completely blocks replication, elevates mutagenesis, and inhibits gene expression. Accordingly, the activity of the R-loop processing enzyme RNase HIII at collision regions is crucial for stress survival in B. subtilis, as many stress response genes are head-on to replication. Remarkably, without RNase HIII, the ability of the intracellular pathogen Listeria monocytogenes to infect and replicate in hosts is weakened significantly, most likely because many virulence genes are head-on to replication. We conclude that the detrimental effects of head-on collisions stem primarily from excessive R-loop formation and that the resolution of these structures is critical for bacterial stress survival and pathogenesis.
In Brief
Head-on replication-transcription collisions lead to pervasive R-loop formation, which must be resolved for bacterial stress survival and pathogenesis.
INTRODUCTION
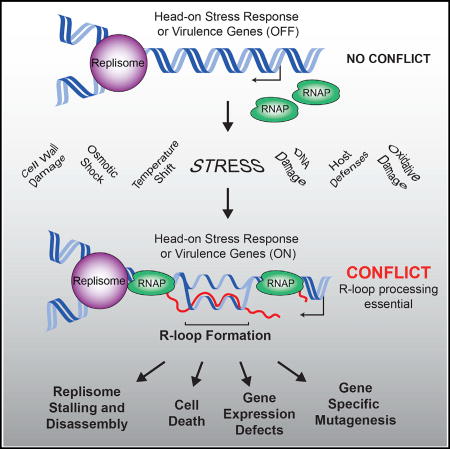
DNA replication and transcription function simultaneously on the same DNA template, leading to conflicts between the two machineries that disrupt DNA replication and lead to genomic instability. Depending on the coding strand of a given gene, the transcription machinery either moves head-on (lagging strand genes) or co-directionally (leading strand genes) with respect to the movement of the replication machinery (the replisome). The two types of encounters have different outcomes. Highly transcribed co-directional genes stall replication and lead to restart (Merrikh et al., 2011). Furthermore, if cells lack RNA polymerase (RNAP) anti-backtracking factors, co-directional conflicts can lead to breaks in the DNA (Dutta et al., 2011). However, many lines of evidence have shown that head-on conflicts are much more detrimental to both DNA replication and genomic stability (French, 1992; Boubakri et al., 2010; Liu and Alberts, 1995; Merrikh et al., 2015; Million-Weaver et al., 2015a, 2015b; Paul et al., 2013; Pomerantz and O’Donnell, 2008; Srivatsan et al., 2010).
Bacterial genomes have evolved organizational structures that minimize head-on collisions; the majority of genes, especially highly transcribed and essential genes, are expressed co-directionally (Rocha and Danchin, 2003a, 2003b). This co-orientation bias has been attributed to both increased replication efficiency as well as decreased mutagenesis of essential genes (Paul et al., 2013). However, though co-orientation bias is a universal phenomenon, all bacteria possess some head-on genes, many of which are highly conserved. Careful analysis of gene-expression data suggests that many stress-response and virulence genes are head-on. These genes are highly induced during critical times in bacterial life such as during stress exposure and/or pathogenesis when replication is active (Camejo et al., 2009; Mostertz et al., 2004; Nicolas et al., 2012; Paul et al., 2013; Scortti et al., 2007; Brill et al., 2011; Cao et al., 2005; Guariglia-Oropeza and Helmann, 2011). Therefore, head-on conflicts are likely prevalent in nature, and thus, identification of both the mechanisms responsible for their detrimental effects and the strategies cells use to resolve these potentially lethal events is important for our understanding of basic cellular functions. Yet, there are still many open questions in the field regarding gene orientation-specific replication-transcription conflicts, including the downstream physiological consequences.
During transcription and replication, the movement of each machine along the template DNA causes over-winding of the two DNA strands ahead (Wu et al., 1988). When the two machines meet head-on, positive supercoil formation should be additive in the DNA region between them (García-Muse and Aguilera, 2016; Mirkin and Mirkin, 2005). This change in topology may directly or indirectly promote the formation of R-loops, structures containing DNA:RNA hybrids and displaced single-stranded DNA (Drolet et al., 1994; Masse and Drolet, 1999; Thomas et al., 1976; Aguilera and García-Muse, 2012). R-loops can lead to genomic instability and replication stalling (Gan et al., 2011; Lin and Pasero, 2012); therefore, it is possible that rather than the classical model that RNAP physically blocks replication, the negative outcomes of head-on conflicts are due to pervasive R-loop formation.
The resolution of R-loops depends on the activity of highly conserved endonucleases known as RNases H, which cleave the RNA strand of DNA:RNA hybrids. There are two major types of RNases H, which are found across species: type 1 and type 2 (Ohtani et al., 1999a). Type 1 RNases H include RNase HI, which cleaves the RNA strand of long DNA:RNA hybrids. Type 2 RNases H include RNase HII and HIII. Prokaryotic RNase HII removes single ribonucleotides that have been misincorporated into DNA (Haruki et al., 2002). RNase HIII is categorized as a type 2 RNase H due to homology to RNase HII, but its activity is more similar to RNase HI (Ohtani et al., 1999b). In the Grampositive model bacterium Bacillus subtilis (B. subtilis) and most of its close relatives including important pathogens such as Listeria monocytogenes (L. monocytogenes) there are functional (or putative) RNase HII and HIII enzymes, encoded by the genes rnhB and rnhC, respectively (Bigot et al., 2009; Itaya et al., 1999; Ohtani et al., 1999b). B. subtilis encodes two genes, ypeP and ypdQ, that are annotated to be in the RNase HI family of enzymes, though it is unclear whether these genes encode functional RNase HI enzymes (Fukushima et al., 2007; Itaya et al., 1999; Itaya et al., 1999; Ohtani et al., 1999b). If gene orientation impacts R-loop formation, RNases H may play important roles in the resolution of head-on replication-transcription conflicts; however, this model has not been addressed.
In both eukaryotic and prokaryotic systems, it is unclear whether and how R-loops relate to conflicts and whether gene orientation exacerbates R-loop formation. Although many studies in eukaryotes have explored the impact of R-loops on genomic instability, DNA replication, and gene regulation, none have investigated the relevance of gene orientation and/or replication-transcription conflicts in this context (Aguilera and García-Muse, 2012; Costantino and Koshland, 2015; Santos-Pereira and Aguilera, 2015; Chang and Stirling, 2017; García-Muse and Aguilera, 2016). Even less is known in prokaryotic systems: aside from potential roles in CRISPR immunity, and origin-independent replication restart, not much is known about how R-loops impact genomic instability and DNA replication, especially in the context of gene orientation and/or conflicts (Ivančić-Baće et al., 2012; Jore et al., 2011; Kogoma, 1997; Maduike et al., 2014; Rutkauskas et al., 2015). Hence, questions regarding R-loops, conflicts, and their relationship to each other remain unknown.
Here, we demonstrate that replication-transcription conflicts promote the formation of DNA:RNA hybrids in a gene orientation- dependent manner in B. subtilis and that RNase HIII is essential for survival of head-on conflicts. Furthermore, we find that conflict-induced R-loops completely block replication and compromise the expression of specifically head-on genes. Our experiments show that over-expression of RNase HIII abrogates conflict-induced mutagenesis, indicating that R-loop formation is responsible for the increased mutagenesis of head-on genes. Importantly, we demonstrate that R-loop processing at head-on conflict regions by RNase HIII is essential for stress survival. The physiological relevance of this mechanism extends to pathogenesis: we show that without RNase HIII, L. monocytogenes cannot efficiently survive stresses and is significantly impaired for infection and replication in eukaryotic hosts, most likely due to the large number of head-on genes induced (and, by extension, increased head-on conflicts) under these conditions. In summary, our work shows that (1) gene orientation significantly impacts R-loop formation upon conflicts with replication, explaining why head-on conflicts are more detrimental than co-directional conflicts, and (2) R-loop resolution is critical for stress survival and pathogenesis in bacteria.
RESULTS
Head-On Transcription Promotes R-Loop Formation
We hypothesized that replication-transcription conflicts increase R-loop formation, specifically when they occur in the head-on orientation. To test this model, we directly measured the amount of DNA:RNA hybrids at a chromosomally encoded identical gene, oriented either head-on or co-directionally with respect to DNA replication, in B. subtilis. We utilized engineered, site-specific, inducible conflicts for these experiments. The engineered conflict systems consist of reporter genes (lacZ and luxABCDE) placed under the control of the Pspank(hy) promoter, which is induced by IPTG (isopropyl β-D-1-thiogalactopyranoside) (Figure 1A). These systems allow for the isolation of specifically gene-orientation effects as the gene sequence, expression levels, and the chromosomal location where the conflict is induced are identical for the two constructs being compared.
Figure 1. DNA:RNA Hybrids Are Prevalent at Head-On Genes, Related to Figure S1.

(A) Schematic of reporter constructs in either the co-directional (CD) or head-on (HO) orientation. specR, spectinomycin resistance gene.
(B and C) DRIP-qPCR analysis of either wild-type (WT) cells or cells lacking rnhC carrying the lacZ reporters (B) or the luxABCDE reporters (C). CD, co-directional (black bars); HO, head-on (gray bars). Values are the means and SEM of at least two independent experiments.
To measure the amount of DNA:RNA hybrids at the engineered conflict loci, we used DNA:RNA hybrid immunoprecipitations (DRIPs) followed by qPCRs (García-Rubio et al., 2015). To measure the relative enrichment of hybrids at these engineered conflict regions, we quantified the amount of DNA:RNA hybrids in the DRIPs for either the head-on- or the co-directionally oriented lacZ or luxABCDE constructs and normalized the signal to a control locus (yhaX) on the chromosome. We found that more hybrids are formed when either of the constructs are expressed in the head-on compared to the co-directional orientation (Figures 1B and 1C). The relative DRIP signal for the head-on-oriented genes was roughly 2- to 3-fold higher than co-directionally oriented genes (Figures 1B and 1C). These results demonstrate that transcription in the head-on orientation increases the amount of DNA:RNA hybrid formation, strongly suggesting that head-on conflicts lead to pervasive R-loop formation.
The Absence of RNase HIII Unveils Pervasive R-Loop Formation at Head-On Genes
In B. subtilis, the gene rnhC codes for RNase HIII, which was shown to digest the RNA in long stretches of DNA:RNA hybrids or R-loops in vitro (Itaya et al., 1999; Ohtani et al., 1999b). If R-loops are processed in vivo by RNase HIII and the DRIP signal we detected was indeed a measurement of R-loops, then in an rnhC knockout strain, the DRIP signal should increase. Furthermore, if head-on conflicts lead to pervasive R-loop formation, then without rnhC, this increase should be more pronounced for the head-on oriented genes.
To address these questions, we measured the abundance of DNA:RNA hybrids in cells lacking rnhC. We found that without rnhC, more DNA:RNA hybrids form at the region harboring either the lacZ or the luxABCDE constructs, specifically when they are oriented head-on to replication (about 4-fold) (Figures 1B and 1C). Furthermore, the signal was more pronounced at the 3′ versus 5′ end of the head-on reporters, which is the conflict point—where the two machineries meet for the first time (Figures S1A and S1B). The changes in the signal we detected are not due to modulation of the yhaX signal, as the enrichment of this control locus in the DRIPs was unchanged in the absence of rnhC (Figure S1C). These findings suggest that expression in the head-on orientation promotes excessive R-loop formation and that RNase HIII activity is needed to resolve these structures.
Pervasive R-Loop Formation at Head-On Genes Completely Blocks Replication
We wondered whether R-loops exacerbate head-on conflicts by blocking DNA replication specifically in the head-on orientation. To address this model, we measured replication stalling in the presence or absence of rnhC via (1) chromatin immunoprecipitations (ChIPs) of the replicative helicase DnaC, (2) 2D gel electrophoresis assays (2D gels), and (3) marker-frequency assays (DNA copy measurement through deep sequencing).
In the ChIP experiments, the relative association of the replicative helicase (DnaC) with conflict regions compared to control loci was measured as previously described (Merrikh et al., 2011; Million-Weaver et al., 2015a). Replisome proteins, such as DnaC, are not expected to preferentially associate with any given locus unless there is replication slow-down. Similar to our prior findings, we detected a roughly 2- to 3-fold increase in association of DnaC with the head-on compared to the co-directionally oriented reporter constructs (Figures 2A and 2B). In the absence of rnhC, DnaC association increased only with the head-on (but not the co-directional) genes (Figures 2A and 2B). This strongly suggests that R-loop formation is specifically problematic for DNA replication at head-on transcribed regions.
Figure 2. Stable R-Loops that Form at Head-On Genes Block Replication.

(A and B) ChIP-qPCR analysis of either WT or ΔrnhC cells carrying the lacZ reporters (A) or luxABCDE reporters (B). CD, co-directional (black bars); HO, head-on (gray bars). Data represent the means and SEM of at least three independent experiments.
(C and D) 2D gel electrophoresis analysis cells with the head-on reporter gene lacZ (C) or luxABCDE (D). Top: DNA isolated from wild-type cells; middle: ΔrnhC; bottom: cartoon of the digested fragment and where the corresponding probe is located (red line).
(E and F) Marker-frequency analysis of either WT or ΔrnhC cells carrying the lacZ reporter (E) or the luxABCDE reporter (F). The x axis indicates chromosomal location, and the y axis is the abundance of reads relative to the total number of reads in the sequencing library. Right: 42 kb portion of the genome surrounding the reporter constructs. The colored bars on the x axis indicate the reporter genes.
We obtained similar results when we assessed replication stalling using 2D gels, which allow for direct analysis of replication intermediates trapped at a given chromosomal locus (Friedman and Brewer, 1995). As we previously reported, replication intermediates are only detected within the engineered conflict regions at high transcription levels and in particular in the head-on orientation (Merrikh et al., 2015). Consistent with the DnaC ChIP results, without rnhC, the Y-arc intensity for the head-on-oriented Pspank(hy)-lacZ region increases dramatically (Figure 2C). We also analyzed strains expressing the Pspank(hy)-luxABCDE reporter using 2D gels. As expected, the arc of the ~6 kb PstI fragment of luxABCDE ran differently from that of the ~3 kb lacZ fragment (Friedman and Brewer, 1995) but still shows increased accumulation of replication fork intermediates in cells lacking RNase HIII (Figure 2D). These data demonstrate that replication fork progression through head-on transcribed regions is hindered due to R-loop formation.
To determine whether any replication forks progress beyond the conflict region, we used deep sequencing to quantify and map the relative abundance of all genomic loci in strains where transcription of Pspank(hy)-lacZ or Pspank(hy)-luxABCDE were induced. The frequency of mapped reads can be used as a proxy for DNA copy number–a direct measure of replisome progression. Strikingly, we found that, without RNase HIII, there is a relatively sharp drop in DNA copy number, spanning 10–20 kb upstream of the head-on conflict region, which lasts throughout the remainder of that arm of the chromosome (Figures 2E and 2F). In contrast, there was no drop in marker frequency without rnhC when the lacZ or luxABCDE reporters were transcribed in the co-directional orientation. We note that there was an increased signal surrounding the origin in the rnhC knockout strain containing head-on (but not co-directional) lacZ or luxABCDE, which could be indicative of some increased replication initiation. Our results indicate that if not resolved, R-loop formation at specifically head-on-oriented genes can completely block replication and subsequent replication restart.
Pervasive R-loop Formation Caused by Head-On Replication-Transcription Conflicts Is Lethal
The observed replication stop at the head-on conflict region suggested that strong transcription of a head-on gene would be lethal in the absence of rnhC. We examined the impact of knocking out rnhC on survival of cells containing the head-on- versus co-directionally oriented Pspank(hy)-lacZ and Pspank(hy)-luxABCDE constructs. rnhC knockouts have a relatively mild growth defect as the colony size for these mutants is generally smaller than that for wild-type (Figure 3). In the absence of induction (no IPTG), cells containing the reporters in either orientation did not have any additional growth defects, regardless of whether the strain did or did not contain rnhC (Figure 3). Induction of either the lacZ or the luxABCDE operon did not produce survival defects in wild-type cells. Remarkably, however, without rnhC, cells containing the head-on- but not the co-directionally oriented reporters showed severe growth defects that were dependent on expression levels (Figures 3A and 3B). At full induction (1 mM IPTG), we were unable to detect any growth for cells containing specifically the head-on-oriented constructs (Figures 3A and 3B). We were able to fully complement these defects when we expressed rnhC using its endogenous promoter from an ectopic locus (lacA) (Figures 3A and 3B). The reproducibility of these results with two completely different genes controls for potential artifacts of toxic protein production from these reporter genes. Using this rnhC complementation construct, we generated an active-site mutant of rnhC, where the glutamic acid at position 234 was mutated to an alanine. In vitro, this mutation reduces RNase HIII activity by about 80% (Chon et al., 2006). In this mutant background, the strain expressing lacZ in the head-on orientation had a 1–2 log survival deficiency, indicating that RNase HIII activity is required for R-loop processing at conflict regions (Figure S2). In contrast to RNase HIII, neither RNase HII, nor the putative RNases HI, YpeP and YpdQ, produced survival defects when challenged with head-on conflicts (Figure S3). The essentiality of RNase HIII depends on both gene orientation and transcription, strongly suggesting that unprocessed R-loops generated by head-on replication-transcription conflicts are lethal.
Figure 3. Unresolved R-Loops at Head-On Genes Cause Cell Death, Related to Figures S2 and S3.

(A and B) Survival assays for either WT, ΔrnhC, or ΔrnhC cells with rnhC expressed at an ectopic locus (ΔrnhC rnhC+) carrying the reporter gene lacZ (A) or luxABCDE (B). Top: Representative plates; bottom: quantification. CD, co-directional (black bars); HO, head-on (gray bars). Values are the means and SD in colony forming units per mL (CFU/mL) of at least four independent experiments.
(C and D) Survival assays for either WT cells or ΔrnhC cells carrying the reporter gene lacZ (C) or luxABCDE (D). Top: Representative plates; bottom: quantification. CD, co-directional (black bars); HO, head-on (gray bars). Values are the means and SD in colony forming units per mL (CFU/mL) of at least four independent experiments.
To determine whether R-loops form as a result of head-on replication-transcription conflicts, we transiently expressed lacZ or luxABCDE in the two orientations, either during active replication (exponentially growing cells) or in the absence of replication (cells in stationary phase). Upon transient induction of the reporters by IPTG, we spotted the cells onto plates lacking IPTG. We did not detect any decrease in viability regardless of the orientation of the constructs or the growth status in wild-type cells (Figures 3C and 3D). However, in rnhC mutants, there was a 1–2-log decrease in colony-forming units per mL (CFUs/mL) but only when transcription was induced in actively replicating cells and only when the reporter was expressed in the head-on orientation (Figures 3C and 3D). In contrast, in non-replicating cells, this orientation-specific viability defect was not observed, strongly suggesting that active replication is required for orientation-specific R-loop toxicity (Figures 3C and 3D). Based on these results, we conclude that the lethality of head-on transcription stems from pervasive R-loop formation caused by head-on replication-transcription conflicts.
Increased Mutagenesis of Head-On Genes Is Due to R-Loop Formation
We previously demonstrated that transcription of head-on genes leads to an elevated mutation rate when compared to co-directional genes (Million-Weaver et al., 2015a; Paul et al., 2013). Importantly, this mutation-rate increase depends on the Mfd-dependent transcription-coupled nucleotide excision repair (TC-NER) pathway (Million-Weaver et al., 2015a). Mfd recognizes stalled RNAPs and liberates them from DNA whilst recruiting repair proteins that excise the lesion or obstacle responsible for the stalling event (Ganesan et al., 2012). Given that pervasive R-loops form at head-on conflict regions, which can stall RNAPs, we wondered whether R-loops were responsible for increased mutation rates at head-on genes. To address this hypothesis, we measured mutation rates and performed fluctuation tests using a previously characterized reporter consisting of an inactivated histidine biosynthesis gene (hisC952) (Million-Weaver et al., 2015a; Paul et al., 2013) and an rnhC overexpression construct integrated at the thrC locus. In wild-type cells, the mutation rate of the hisC reporter is higher in the head-on compared to the co-directional orientation (Million-Weaver et al., 2015a; Paul et al., 2013; Figure 4A). Strikingly, in cells with increased ability to resolve R-loops (rnhC overexpression strains), the mutation rates of the head-on-oriented gene decreased to the same level as that oriented co-directionally to replication (Figure 4A). Luria-Delbrück fluctuation analyses for all strains indicate that mutations occurred during exponential growth, i.e., during active replication (Figure 4B). We could not perform these experiments in an rnhC knockout background given that, as shown above, expression of genes in the head-on orientation is lethal when cells lack RNase HIII. These data indicate that the increased mutation rates of head-on genes stem from excess R-loop formation resulting from replication-transcription conflicts.
Figure 4. Overexpression of rnhC Reduces Mutation Rates of Genes in the Head-On Orientation.

(A) Mutation rates calculated from measuring the reversion of the hisC952 allele in either WT cells or cells overexpressing rnhC (OE rnhC). CD, co-directional (black bars); HO, head-on (gray bars). The y axis indicates the mutation rate (mutations per 108 cells per generation) as calculated from the Sandri-Sarkar Maximum Likelihood Estimator Method. Bars indicate the rate and 95% confidence interval calculated from at least 47 independent replicates.
(B) Fluctuation analyses of data in (A) by the Luria-Delbrück method (described in Foster 2006), where Pr is the probability of at least r mutants and r is the number of mutants. Slope of −1 indicates fluctuation.
R-Loop Formation at Head-On but Not Co-directional Genes Leads to Gene-Expression Defects
R-loops have been associated with impaired RNAP movement and gene-expression defects (Santos-Pereira and Aguilera, 2015; Skourti-Stathaki and Proudfoot, 2014). Whether gene orientation or replication impact these detrimental outcomes of R-loops is unknown. Given that R-loops are more prevalent and/or stable in the head-on orientation, we anticipated that specifically head-on but not co-directional gene expression would suffer without RNase HIII. To test this hypothesis, we measured the abundance of lacZ or luxABCDE mRNA using qRT-PCRs in cells with and without RNase HIII. When rnhC was absent, expression of the head-on- (but not co-directionally) oriented genes decreased significantly (Figures 5A and 5B). This expression defect was recapitulated when we measured protein abundance for the lacZ reporter using classic beta-galactosidase measurements (Figure S4). The defects we detected were fully complemented: in strains where rnhC was expressed from an ectopic locus, there was no difference in mRNA levels of the reporter in either orientation (Figures 5A and 5B).
Figure 5. R-Loops Disrupt Head-On Gene Expression, Related to Figure S4.

(A–C) qRT-PCR analysis from log phase cultures of either WT, ΔrnhC, ΔrnhC cells with rnhC expressed at an ectopic locus (ΔrnhC rnhC+) carrying the reporter gene lacZ (A) or luxABCDE (B). (C) Cells were induced and harvested in stationary phase. CD, co-directional (black bars); HO, head-on (gray bars). Data represent the means and SEM of at least three independent experiments. n.s., not significant. *p < 0.05.
To determine whether the decrease in mRNA levels of the head-on reporter genes depended on active DNA replication, we repeated these experiments in both growing and non-growing cells. The head-on constructs were induced significantly with IPTG addition. However, the observed gene-expression defect without rnhC was no longer detectable in non-growing cells (Figure 5C). These data strongly suggest that R-loop formation is specifically problematic in the head-on orientation and that this problem is due to encounters between the replication and transcription machineries.
Efficient Expression of Head-On Stress-Response Genes Requires R-Loop Resolution
Many stress-response genes (including osmotic, oxidative, and cell-wall stresses) are encoded in the head-on orientation in bacteria (Table S1; Mostertz et al., 2004; Nicolas et al., 2012; Paul et al., 2013). We predicted that upon exposure to stress, the increased expression of head-on stress-response genes will generate a significant number of severe conflicts and lead to pervasive R-loop formation at these regions. If these structures are not resolved by RNase HIII, they should compromise expression of these key genes, threatening survival. To test this model, we identified changes in global transcription profiles during stress exposure in either wild-type or ΔrnhC. Specifically, we chose to test the effects of osmotic stress because this condition induces many head-on genes (>100 genes [Table S1]). Briefly, we added NaCl for 30 min to growing cells, extracted total RNA, and then conducted RNA sequencing (RNA-seq). To determine transcript abundance before and after treatment, the resulting sequences were mapped to chromosomal loci and quantified. We calculated transcriptional induction in either the wild-type or rnhC mutant cells by dividing the average (over two biological replicates) transcript abundance before and after treatment. We then refined our data sets such that subsequent analyses only included genes that (a) were induced 2-fold or more in the wild-type strain and (b) were not repressed in ΔrnhC strain (i.e., genes with an induction value of ≥ 1.0 in the ΔrnhC strain). We calculated the change in transcriptional induction attributable to the loss of rnhC by dividing the fold induction in the rnhC mutant by the fold induction for the same genes in the wild-type strain. After ordering the data by descending overall induction (in the wild-type strain), we observed that the induction of the most highly expressed head-on (but not co-directional) genes was significantly reduced in the ΔrnhC strain (Figures 6A and S5A). The magnitude of this effect was greatest in genes experiencing the highest levels of induction in the wild-type strain and was diminished in genes with a lower induction level. This is consistent with the hypothesis that conflict severity, and by extension the need for RNase HIII-mediated R-loop resolution, increases with higher transcription levels.
Figure 6. Resolution of R-Loops at Head-On Genes Is Required for Survival of Stress, Related to Figure S5.

(A) Global transcriptional analysis of genes upregulated during osmotic stress. CD, co-directional (black bars); HO, head-on (gray bars). Values are means and SEM. *p < 0.05.
(B) qRT-PCR analysis of head-on osmotic stress-response genes in either WT (black bars) or ΔrnhC (gray bars) cells. The y axis indicates the fold induction of the indicated gene. Values are means and SEM of at least two independent experiments.
(C) Representative plot of global analysis of DRIP-seq results in either WT or ΔrnhC cells during salt stress. Data represent the average normalized signal across all salt-response genes (including 100 bp upstream, 5′ UTR and 150 bp downstream, 3′ UTR) in each category (head-on and co-directional). Lines indicate the mean, and the shaded region indicates the standard error.
(D) Representative plates from chronic survival assays of either WT or ΔrnhC cells exposed to stressors.
(E) Quantification of WT (black bars) or ΔrnhC cells (gray bars) acutely treated with stressors. Values are the mean and SD of at least two independent experiments.
To confirm the results of our global transcriptome analysis with osmotic stress and to examine the impact of other stressors (cell-wall [lysozyme] and oxidative stress [paraquot]) on head-on gene expression, we performed qRT-PCR experiments. We analyzed both head-on (lysozyme, sigV and dltA; paraquat, katA and aphC; NaCl, proH and ysnF) and co-directional candidate genes (lysozyme, ddl and murF; paraquat, ykuP and dhbB; NaCl, katE and yjgC) previously shown to be induced by the corresponding stress for each condition. We found that in actively replicating cells that lack rnhC, head-on- but not co-directionally oriented genes have a lower expression level (Figures 6B, S5B, and S5C). In non-growing cells, there was no difference in head-on gene expression between the wild-type and ΔrnhC strains. Notably, during growth arrest, stress-response genes were still induced as expected. This indicates that the lack of expression-level differences between the ΔrnhC and wild-type strains is not due to reduced susceptibility of non-growing cells to the stressors. We did not observe an expression defect in the qPCR experiments for any of the co-directionally oriented genes when rnhC was absent (Figures S5B and S5C). These results need not apply to every gene: we only analyzed four genes in each condition, and not all head-on genes showed reduced expression in the rnhC mutant in the RNA-seq data set. Overall, the qRT-PCR results are consistent with both the reporter experiments presented above and the RNA-seq data, suggesting that pervasive R-loop formation is likely a general consequence of head-on gene transcription during replication.
R-Loops Form Pervasively in Head-On Stress-Response Genes
To directly assess whether R-loops preferentially form at endogenous head-on genes, we carried out DRIP-seq analyses in cells experiencing osmotic stress. We performed DRIP-seq from cells after NaCl treatment and compared the enrichment of genomic loci in the DRIPs to the input DNA. We averaged the DRIP signal across groups of head-on and co-directional genes that were of similar length (>900 bp) and expression levels (as determined by our osmotic stress RNA-seq experiments). We included 100 bp upstream of each coding sequence to detect potential R-loops forming near the promoter. Similarly, we included 150 bp downstream of each coding sequence because previous studies have shown that 3′ UTRs in bacteria are distributed 50–200 bp downstream of genes and that R-loops have been detected in 3′ UTRs in yeast (Ruiz de los Mozos et al., 2013; Wahba et al., 2016). We found that in wild-type cells, there was slightly higher DRIP signal at the 5′ of head-on genes compared to co-directional genes, suggesting that R-loops accumulate in a gene-orientation-dependent manner even in the presence of RNase HIII (Figure 6C). In cells lacking RNase HIII, the DRIP signal at the 5′ end of the genes increased. Additionally, we detected a very pronounced peak just past the 3′ of the open reading frame of head-on (but not co-directional) genes in cells lacking RNase HIII (Figure 6C). This is consistent with the DRIP-qPCR results from the reporter constructs presented above. These data directly demonstrate that R-loops form preferentially at head-on stress-response genes and are most prevalent at the initial point of the conflict (the 3′ end of head-on genes).
Efficient Survival of Stresses Requires Resolution of R-Loops at Head-On Conflict Regions
Given that head-on transcription can lead to gene-expression defects and replication stalling and that exposure to stresses induced many head-on genes, conflict-induced R-loop processing should be essential for stress survival. We chronically exposed cells to various stresses and performed viability assays. We compared wild-type to rnhC mutant cells and found that, indeed, efficient survival of all three stresses examined requires rnhC (Figure 6D). Without rnhC, chronic exposure to different stresses decreased viability as measured by CFUs/mL by one to three orders of magnitude. Furthermore, the cell-survival defect observed for the rnhC mutants depends on active replication. When we acutely treated both growing and non-growing wild-type cells with the various stressors, we found an overall growth defect. When actively replicating cells were treated with stresses, those lacking rnhC were significantly more sensitive than wild-type to the corresponding stress (Figures 6E and S5D). Non-replicating cells lacking rnhC did not show any survival defect upon treatment. Taken together, these results strongly suggest that resolution of R-loops formed as a result of head-on replication-transcription conflicts is essential for efficient survival of exogenous stresses.
R-Loop Resolution Is Critical for L. monocytogenes Stress Survival and Pathogenesis
Many virulence genes are encoded head-on to replication and induced during infection (see data for L. monocytogenes in Table S2), suggesting that unresolved R-loops at head-on conflict regions could interfere with the ability of pathogenic bacteria to survive within host cells. To test this model, we utilized the food-borne intracellular bacterial pathogen L. monocytogenes. Given the relatedness of L. monocytogenes and B. subtilis and the high level of sequence identity between their respective RNase HIII proteins, we anticipated that the function of the enzyme is conserved. We therefore generated ΔrnhC L. monocytogenes strains and characterized growth, stress survival, and virulence through a variety of metrics. First, we tested the ability of the ΔrnhC L. monocytogenes to survive osmotic stress. Consistent with our observations in B. subtilis, we found that the L. monocytogenes rnhC mutant was highly sensitive to NaCl, with a roughly 4-log decrease in CFU/mL counts upon treatment (Figure 7A). This revealed a conserved role for RNase HIII in tolerance of osmotic stress, a particularly relevant phenotype for L. monocytogenes, which is capable of transmitting illness following colonization of high-salt foods, including processed meats and cheeses.
Figure 7. The Intracellular Pathogen Listeria monocytogenes Requires RNase HIII for Stress Tolerance and Pathogenesis, Related to Figure S6.

(A) Representative plates from WT or ΔrnhC L. monocytogenes from chronic salt-exposure survival assays.
(B) Growth curve of iBMDM cells infected with WT or ΔrnhC L. monocytogenes. Values are the mean and SD of three biological replicates.
(C) Plaque assays from TIB73 hepatocytes infected with WT and ΔrnhC L. monocytogenes. n > 30 for each strain. Data are representative of two independent experiments. Values are the mean SD of biological replicates.
(D) Survival assays from mice infected with WT or ΔrnhC L. monocytogenes. Values are CFU/organ. Solid lines indicate the median. hpi, hours post infection. *p < 0.05, **p < 0.01, ***p < 0.001.
We next sought to characterize the effects of RNase HIII on bacterial virulence. To successfully colonize a host, L. monocytogenes must enter cells through a primary endocytic or phagosomal vacuole and escape into the cytosol using the pore-forming toxin listeriolysin O (LLO). Subsequently, L. monocytogenes cells proliferate in the cytoplasmic space and spread to neighboring cells through actin-based motility. To assess cellular entry and intracellular replication, we infected IFN-γ-activated, immortalized bone-marrow-derived macrophages (iBMDMs) and enumerated CFUs out to 12 hr post infection (hpi). At 0.5 hr, bacterial burdens were equivalent, establishing similar capacity to enter host cells (Figures 7B and S6A). At 2 hpi, the ΔrnhC L. monocytogenes exhibited a 50% reduction in CFUs relative to wild-type bacteria. This is characteristic of a defect in the primary vacuole, likely a consequence of increased sensitivity to the antimicrobial stressors present in the phagosome (low-pH, oxidative, and nitrosative stress) or deficiency in phagosomal escape via LLO production. From 2 to 8 hpi, both strains exhibited exponential growth, with doubling times of 80 and 57 min for the ΔrnhC and wild-type strains, respectively. Finally, the overall magnitude of replication in the macrophages was significantly diminished in the ΔrnhC strain, with greater than 90% reduction in the final bacterial burdens at 12 hr. We also performed 72 hr plaque assays in murine hepatocytes. In addition to assessing similar aspects of cellular growth as macrophage growth curves, this infection model also monitors cell-to-cell spread. We found that the ΔrnhC mutant is severely defective in plaque formation, with a 65% decrease in plaque size compared to wild-type L. monocytogenes (Figure 7C). These findings cannot be solely attributable to the slightly increased doubling time of ΔrnhC L. monocytogenes (Figure S6B), as previous studies have reported L. monocytogenes mutants that exhibit >2-fold increase in doubling time but can reach wild-type levels of bacterial burdens by 8 hr and exhibit a more modest 40% reduction in plaque area (Sureka et al., 2014).
Defective plaque formation is highly predictive of attenuated virulence in vivo. To test this prediction, we measured in vivo virulence using a murine model of acute listeriosis. Compared to wild-type cells, L. monocytogenes lacking RNase HIII exhibited a 2-log and 3-log decrease in bacterial burdens in the liver and spleen, respectively (Figure 7D). Taken together, these data establish that proper RNase HIII functionality is crucial for L. monocytogenes survival and proliferation within the host, likely affecting both phagosomal and cytoplasmic stages of its intracellular life cycle.
DISCUSSION
Our data suggest that both gene orientation and DNA replication significantly impact R-loop formation. We find that at the exact points where replication and transcription should encounter each other head-on (3′ of lagging strand genes), R-loops form pervasively. If not resolved by RNase HIII, these R-loops can hinder gene expression, completely stall replication, and eventually result in cell death. Based on our results, we propose a model in which R-loops form during head-on collisions between the replication and transcription machineries. As the replisome approaches a head-on transcription unit, RNAPs begin to stall, either due to increased positive supercoiling or a direct collision with the replisome. Transcripts generated by the stalled RNAPs then invade the DNA duplex, which would presumably be open due to active transcription (and potentially hypernegative supercoiling). Once formed, resolution of these R-loops would require RNase HIII activity. If left unresolved, R-loops block replication either directly or by stabilizing RNAPs, which could then act as a barrier to replication.
The question of why head-on conflicts are more detrimental than co-directional conflicts has been long standing. Our data strongly suggest that a key difference between head-on and co-directional replication-transcription conflicts is the local alteration in nucleic-acid structures, mainly, pervasive R-loop formation. There are physical differences between the events that occur at head-on and co-directional conflict regions. For example, the topology of the DNA at the conflict region is likely altered due to positive supercoiling generated in front of both RNAP and the replisome. The results of our marker-frequency experiments indicate that replication stalling extends 10–20 kb downstream of the conflict point, which is consistent with increases in topological stress. Addressing how and to what extent topological changes might influence the severity of head-on collisions and/or R-loop formation requires further study.
Our results show that in vivo, the replication fork can be completely blocked by R-loops and/or RNAPs stabilized by RNA:DNA hybrids. This was initially surprising given that prior studies have indicated that R-loops serve as primers for replication restart (Kogoma, 1997; Maduike et al., 2014; von Meyenburg et al., 1987; Pomerantz and O’Donnell, 2008). However, prior studies observed R-loop-mediated restart at co-directional rRNA genes. Productive R-loop-mediated restart may therefore be directional and does not occur if the R-loops form at head-on genes. Some potential explanations for this include: (1) since the replicative helicase encircles the lagging strand, it is unable to translocate across R-loops at head-on genes, and (2) R-loops may mask the DNA substrates recognized by the replication-restart protein PriA such as D-loop or stalled fork structures (Liu and Marians, 1999). A small increase in signal far downstream of the head-on conflict was observed in the replication profiles of rnhC mutants, which could represent a small subpopulation of cells undergoing R-loop-mediated replication restart.
Given that all organisms contain head-on genes, experience conflicts, and possess RNase H enzymes, conflict-induced R-loop formation is likely a universal problem across species. We find that there is a correlation between the existence of specifically RNase HIII and gene-orientation bias: bacteria with a high bias toward co-orientation of genes, such as B. subtilis, contain RNase HIII (Figure S7). This suggests that perhaps in organisms without such a strong bias, such as E. coli, R-loops are not as detrimental or that redundant R-loop-processing mechanisms exist. Indeed, in E. coli, rDNA inversions are not as disruptive to growth as in B. subtilis (Boubakri et al., 2010; Zhang et al., 2014). However, R-loops must be problematic to some degree even in low-bias organisms such as E. coli given that modulating RNase HI levels can impact survival defects associated with rDNA inversions (Boubakri et al., 2010; Zhang et al., 2014). Interestingly, accessory helicases have been implicated in R-loop processing and conflict resolution across species (Boubakri et al., 2010; Merrikh et al., 2015; Matson, 1989; Boulé and Zakian, 2007; Chib et al., 2016), but in the case of head-on genes, our data suggest that they are not sufficient to clear the R-loops. Perhaps this is the reason for the presence of RNase HIII in organisms with higher co-orientation biases.
Resolution of R-loop formation in response to various stresses is likely required for bacteria to sustain life in nature. R-loop formation at head-on genes therefore is a dangerous problem, and, although not always identified as “essential” in the laboratory, RNase H enzymes are most likely required for life under the diverse environmental settings in the wild. This phenomenon is especially relevant for pathogenic bacteria, such as L. monocytogenes, to sustain their dynamic lifestyles. L. monocytogenes is an opportunistic pathogen that transitions from a saprophytic environmental lifestyle to infection of mammalian hosts. This transition requires significant cellular transcriptional reprogramming, resulting in the upregulation of key virulence and stress-response genes, many of which are oriented head-on to replication. Similar to L. monocytogenes, many other pathogens go through analogous environmental changes where a cacophony of head-on gene transcription is likely to be induced. Therefore, we predict that head-on conflicts are prevalent and that their resolution is essential during host-cell invasion.
These findings resurrect a question we posed previously: if expression of head-on genes has the potential to hinder gene expression and to block replication via R-loop formation, and if cells need elaborate mechanisms to survive these problems, why do head-on genes exist in this orientation? This paradox can be explained in light of evolution. In our previous work, we demonstrated that genes in the head-on orientation accumulate mutations faster over evolutionary time scales (Paul et al., 2013). Increased mutagenesis promotes the chances of obtaining both deleterious as well as beneficial, adaptive mutations. Therefore, as we previously suggested, gene orientation may facilitate a spatially and temporally controlled evolutionary mechanism that allows cells to explore genetic diversity under selective conditions, specifically in genes oriented head-on to replication (Merrikh, 2017). In the present study, we unveil specific conditions (stresses and host invasion) where this replication-dependent, targeted mutagenesis mechanism is activated. Beneficial mutations in these critical genes could increase stress tolerance or, in the case of pathogens, increase virulence. Such benefits might outweigh the detrimental effects of head-on conflicts. The potential for accelerated evolution of specific genes then becomes an attractive model that offers an elegant explanation for the retention of key stress response and virulence genes in this potentially life-threatening orientation.
STAR★METHODS
Detailed methods are provided in the online version of this paper and include the following:
CONTACT FOR REAGENT AND RESOUCE SHARING
EXPERIMENTAL MODEL AND SUBJECT DETAILS
- METHOD DETAILS
-
◦Strain constructions
-
◦Plasmid constructions
-
◦Viability assays - chronic treatments
-
◦Viability assays - acute treatments
-
◦DNA:RNA hybrid immunoprecipitation assays
-
◦Chromatin immunoprecipitation assays
-
◦Quantitative PCRs
-
◦RNA extraction and cDNA preparation
-
◦RNA-Seq
-
◦DRIP-Seq
-
◦Marker frequency
-
◦2-dimensional (2D) gel electrophoresis
-
◦Mutation rates
-
◦β-galactosidase activity
-
◦Listeria growth curves
-
◦Listeria chronic stress assays
-
◦Listeria tissue culture infections
-
◦Mouse infections
-
◦
QUANTIFICATION AND STATISICAL ANALYSIS
DATA AND SOFTWARE AVAILABILITY
STAR⋆METHODS
KEY RESOURCES TABLE
| REAGENT or RESOURCE | SOURCE | IDENTIFIER |
|---|---|---|
| Antibodies | ||
| S9.6 DNA:RNA Hybrid antibody | Millipore | MABE1095 |
| S9.6 DNA:RNA Hybrid antibody | Kerafast | ENH001 |
| DnaC Antibody | (Smits et al., 2010) | N/A |
| Chemicals, Peptides, and Recombinant Proteins | ||
| EcoRV-HF | NEB | R3195 |
| PstI-HF | NEB | R3140 |
| HindIII-HF | NEB | R3104 |
| DpnI | Thermo | FD1703 |
| XhoI | Thermo | FD0694 |
| EcoRI | Thermo | FD0274 |
| HindIII | Thermo | FD0504 |
| EagI | Thermo | FD0334 |
| NheI | Thermo | FD0974 |
| SphI | Thermo | FD0604 |
| DNase I | Thermo | 89836 |
| Proteinase K | Qiagen | 19133 |
| Protein A Sepharose beads | GE Healthcare | 17-0780-01 |
| Sephadex G-50 | GE | 17004201 |
| SeaKem LE agarose | Thermo | 50002 |
| Recombinant Human IFN-Gamma | PeproTech | 300-02 |
| Critical Commercial Assays | ||
| Ovation Complete Prokaryotic RNA-Seq kit | Nugen | 0326 |
| Nextera XT DNA Library Preparation Kit | Illumina | (FC-131-1024) |
| Deposited Data | ||
| All fastq files and descriptions uploaded to Sequence Read Archive | NCBI SRA | Bioproject: SUB2307064 |
| Experimental Models: Cell Lines | ||
| Immortalized bone marrow macrophages | (Sureka et al., 2014) | N/A |
| TIB73 murine hepatocytes | (Sureka et al., 2014) | N/A |
| Experimental Models: Organisms/Strains | ||
| B. subtilis trpC2 pheA1 | (Brehm et al., 1973) | HM1 |
| B. subtilis hisC952, metB5, leuC427, SPβsens, xin−1, amyE::Pspank(hy)-hisC952 (HO) specR | (Paul et al., 2013) | HM419 |
| B. subtilis hisC952, metB5, leuC427, SPβsens, xin−1, amyE::Pspank(hy)-hisC952 (CD) specR | (Paul et al., 2013) | HM420 |
| B. subtilis trpC2 rnhB::mls | Bacillus Stock Center | HM710 |
| B. subtilis trpC2 rnhC::mls | Bacillus Stock Center | HM711 |
| B. subtilis amyE::Pspank(hy)-lacZ (HO) specR, trpC2 pheA1 | This study | HM1300 |
| B. subtilis amyE::Pspank(hy)-lacZ (CD) specR, trpC2 pheA1 | This study | HM1416 |
| B. subtilis trpC2 ypeP::mls | Bacillus Stock Center | HM1907 |
| B. subtilis trpC2 ypdQ::mls | Bacillus Stock Center | HM1908 |
| B. subtilis rnhB::mls amyE::Pspank(hy)-lacZ (HO) specR, trpC2 pheA1 | This study | HM2041 |
| B. subtilis rnhB::mls amyE::Pspank(hy)-lacZ (CD) specR, trpC2 pheA1 | This study | HM2042 |
| B. subtilis rnhC::mls amyE::Pspank(hy)-lacZ (HO) specR, trpC2 pheA1 | This study | HM2043 |
| B. subtilis rnhC::mls amyE::Pspank(hy)-lacZ (CD) specR, trpC2 pheA1 | This study | HM2044 |
| B. subtilis amyE::Pspank(hy)-luxABCDE (HO) specR, trpC2 pheA1 | This study | HM2195 |
| B. subtilis amyE::Pspank(hy)-luxABCDE (CD) specR, trpC2 pheA1 | This study | HM2197 |
| B. subtilis amyE::Pspank(hy)-hisC952 (HO) hisC952, metB5, leuC427, xin-1, SPβsens thrC::Pspank(hy)-rnhC | This study | HM2482 |
| B. subtilis amyE::Pspank(hy)-hisC952 (CD) hisC952, metB5, leuC427, xin-1, SPβsens thrC::Pspank(hy)-rnhC | This study | HM2483 |
| B. subtilis rnhC::mls trpC2 pheA1 | This study | HM2655 |
| B. subtilis rnhC::mls amyE::Pspank(hy)-lacZ (HO) specR lacA::PrnhC-rnhC tetR, trpC2 pheA1 | This study | HM2656 |
| B. subtilis rnhC::mls amyE::Pspank(hy)-lacZ (CD) specR lacA::PrnhC-rnhC tetR, trpC2 pheA1 | This study | HM2657 |
| B. subtilis rnhC::mls amyE::Pspank(hy)-luxABCDE (HO) specR, trpC2 pheA1 | This study | HM2658 |
| B. subtilis rnhC::mls amyE::Pspank(hy)-luxABCDE (CD) specR, trpC2 pheA1 | This study | HM2659 |
| B. subtilis rnhC::mls amyE::Pspank(hy)-luxABCDE (HO) specR, lacA::PrnhC-rnhC tetR trpC2 pheA1 | This study | HM2706 |
| B. subtilis rnhC::mls amyE::Pspank(hy)-luxABCDE (CD) specR, lacA::PrnhC-rnhC tetR trpC2 pheA1 | This study | HM2707 |
| B. subtilis ypeP::mls amyE::Pspank(hy)-lacZ (HO) specR, trpC2 pheA1 | This study | HM2781 |
| B. subtilis ypeP::mls amyE::Pspank(hy)-lacZ (CD) specR, trpC2 pheA1 | This study | HM2782 |
| B. subtilis ypdQ::mls amyE::Pspank(hy)-lacZ (HO) specR, trpC2 pheA1 | This study | HM2783 |
| B. subtilis ypdQ::mls amyE::Pspank(hy)-lacZ (CD) specR, trpC2 pheA1 | This study | HM2784 |
| B. subtilis rnhC::mls amyE::Pspank(hy)-lacZ (HO) specR lacA::PrnhC-rnhC(E234A) tetR, trpC2 pheA1 | This study | HM3208 |
| B. subtilis rnhC::mls amyE::Pspank(hy)-lacZ (CD) specR lacA::PrnhC-rnhC(E234A) tetR, trpC2 pheA1 | This study | HM3209 |
| Listeria monocytogenes 10403S strepR | Gift from Dr. Joshua Woodward | HM3274 |
| Listeria monocytogenes 10403S ΔrnhC strepR | This study | HM3275 |
| Mouse: C57BL/6J | Jackson Laboratory | 000664 |
| Recombinant DNA | ||
| pDR111 | Gift from Dr. David Rudner | pDR111 |
| pCAL838 | Guérout-Fleury, Gene. 1996 | pCAL838 |
| pAH60 | Gift from Dr. Richard Losick | pAH60 |
| pMMB752 | Gift from Dr. Alan Grossman | pMMB752 |
| pKSV7 | Gift from Dr. Joshua Woodward | pKSV7 |
| pHM64 | This study | pHM64 |
| pHM170 | This study | pHM170 |
| pHM181 | This study | pHM181 |
| pHM271 | This study | pHM271 |
| pHM321 | This study | pHM321 |
| pHM506 | This study | pHM506 |
| pHM568 | This study | pHM568 |
| Sequence-Based Reagents | ||
| Primer sequences provided in Table S3 | N/A | N/A |
| Software and Algorithms | ||
| SAMtools | Li et al. 2009 | N/A |
| Bowtie 2 | Langmead and Salzberg, 2012 | N/A |
| Prism 7 | Graphpad | N/A |
| DeepTools | Ramírez et al., 2014 | N/A |
| CLC Genomics Workbench | N/A | N/A |
| ImageJ | N/A | N/A |
| Other | ||
| GeneJET PCR Purification Kit | Thermo | K0701 |
| iTaq Universal SYBR Green master mix | Bio-Rad | 1725121 |
| iScript Supermix | Bio-Rad | 1708840 |
| GeneJET RNA Purification Kit | Thermo | K0731 |
| GeneJET Genomic DNA purification Kit | Thermo | K0722 |
CONTACT FOR REAGENT AND RESOUCE SHARING
Further information and requests for resources and reagents should be directed to Lead Contact, Houra Merrikh (merrikhuw.edu).
EXPERIMENTAL MODEL AND SUBJECT DETAILS
All B. subtilis strains were constructed in the HM1 (JH642) (Brehm et al., 1973) Bacillus subtilis background. B. subtilis genomic DNA was using a commercially available kit (Thermo) and used to transformed into HM1 (and its derivatives with reporter constructs, see strain constructions for details) as per standard protocol (Cutting and Harwood, 1990). Strains were streaked on LB agar plates and supplemented with antibiotics where appropriate. Precultures were inoculated from single colonies into 2 or 5 mL of LB broth and incubated at 37° C with shaking (260 RPM). All Listeria monocytogenes cultures were grown in Brain Heart Infusion (BHI) media prior to infections (with antibiotics added where appropriate). Precultures were used to inoculate experimental cultures which were grown and treated as indicated for each different experiment in the Method Details section.
E. coli DH5α was used to propagate recombinant DNA vectors. Transformations were done using heat shock of competent E. coli. E. coli cultures were grown at 37° C with shaking (260 RPM) in LB supplemented with 50 µg/mL carbenecillin where appropriate. All plasmid vectors were purified using a commercially available plasmid extraction kit (Thermo).
METHOD DETAILS
Strain constructions
HM1300. Plasmid pHM170 was used to transform HM1. Transformants were selected on LB+Spec agar plates.
HM1416. Plasmid pHM181 was used to transform HM1. Transformants were selected on LB+Spec agar plates.
HM2041. Purified genomic DNA from HM710 was used to transform HM1300. Transformants were selected on LB+MLS agar plates. Transformants were verified by PCR using primers HM501/502.
HM2042. Purified genomic DNA from HM710 was used to transform HM1416. Transformants were selected on LB+MLS agar plates. Transformants were verified by PCR using primers HM501/502.
HM2043. Purfied genomic DNA from HM711 was used to transform HM1300. Transformants were selected on LB+MLS agar plates. Transformants were verified by PCR using primers HM505/508.
HM2043. Purfied genomic DNA from HM711 was used to transform HM1416. Transformants were selected on LB+MLS agar plates. Transformants were verified by PCR using primers HM505/508.
HM2195. Plasmid pAH60 was used to transform HM1. Transformants were selected on LB+Spec agar plates.
HM2197. Plasmid pHM321 was used to transform HM1. Transformants were selected on LB+Spec agar plates.
HM2482. Purified genomic DNA from HM711 was used to transform HM419. Transformants were selected on LB+MLS plates. Transformants were confirmed using PCR.
HM2483. Purified genomic DNA from HM711 was used to transform HM420. Transformants were selected on LB+MLS plates. Transformants were confirmed using PCR.
HM2655. Purified genomic DNA from HM711 was used to transform HM1. Transformants were selected on LB+MLS agar plates. Transformants were verified by PCR using primers HM505/508.
HM2656. Plasmid pHM271 was used to transform HM2043. Transformants were selected on LB+Tet agar plates. Transformants were verified by PCR using primers HM659/660.
HM2657. Plasmid pHM271 was used to transform HM2044. Transformants were selected on LB+Tet agar plates. Transformants were verified by PCR using primers HM659/660.
HM2658. Purfied genomic DNA from HM711 was used to transform HM2195. Transformants were selected on LB+MLS agar plates. Transformants were verified by PCR using primers HM505/508.
HM2659. Purfied genomic DNA from HM711 was used to transform HM2197. Transformants were selected on LB+MLS agar plates. Transformants were verified by PCR using primers HM505/508.
HM2706. Plasmid pHM271 was used to transform HM2658. Transformants were selected on LB+Tet agar plates. Transformants were verified by PCR using primers HM659/660.
HM2707. Plasmid pHM271 was used to transform HM2659. Transformants were selected on LB+Tet agar plates. Transformants were verified by PCR using primers HM659/660.
HM2781. Purified genomic DNA from HM1907 was used to transform HM1300. Transformants were selected on LB+MLS agar plates. Transformants were verified by PCR using primers HM3596/3597.
HM2782. Purified genomic DNA from HM1907 was used to transform HM1416. Transformants were selected on LB+MLS agar plates. Transformants were verified by PCR using primers HM3596/3597.
HM2783. Purified genomic DNA from HM1908 was used to transform HM1300. Transformants were selected on LB+MLS agar plates. Transformants were verified by PCR using primers HM3598/3599.
HM2784. Purified genomic DNA from HM1908 was used to transform HM1416. Transformants were selected on LB+MLS agar plates. Transformants were verified by PCR using primers HM3598/3599.
HM3208. Plasmid pHM506 was used to transform HM2043. Transformants were selected on LB+Tet agar plates. Transformants were verified by PCR using primers HM659/660.
HM3209. Plasmid pHM506 was used to transform HM2044. Transformants were selected on LB+Tet agar plates. Transformants were verified by PCR using primers HM659/660.
HM3275. E. coli SM10 harboring pHM568 was mated with L. monocytogenes 1043S at 30° C on BHI agar plates for 5 hours. The plate was flooded with 1× Spizizen’s Salts buffer (15 mM ammonium sulfate, 80 mM dibasic potassium phosphate, 44 mM monobasic potassium phosphate, 3.4 mM trisodium citrate, and 0.8 mM magnesium sulfate) and plated on BHI agar plates supplemented with streptomycin (200 µg/mL) and chloramphenicol (10 µg/mL). Plates were incubated at 30° C for 48 hrs. Resulting colonies were picked and streaked on new BHI plates containing streptomycin and chloramphenicol and incubated at 30° C overnight. Single colonies were used to inoculate tubes containing 2 mL BHI broth with chloramphenicol and these were incubated in a 42° C shaking water bath overnight. Overnight growth was used to inoculate a new 2 mL tube and the process was repeated. This overnight growth was then struck on a BHI plate containing streptomycin and chloramphenicol and incubated overnight at 42° C. Single colonies were used to inoculate tubes containing 2 mL of BHI broth and were incubated in a shaking water bath at 30° C. Cells were passaged every 6 hours into new tubes containing BHI broth. After 5 passages cells were diluted and plated for single colonies on BHI agar plates. Colonies were patched onto BHI plates with and without chloramphenicol. Chloramphenicol susceptible colonies were screen by colony PCR using primers HM4140/4141. PCR products were sequenced to verify.
Plasmid constructions
pHM64: The rnhC gene was amplified using primers HM464/HM517 and purified using a PCR purification kit (Thermo). The plasmid pCAL838 was linearized with NheI and HindIII and gel purified using a PCR purification kit (Thermo). These two fragments were assembled using Gibson assembly at 50° C for 1 hour. The assembly was used to transform E. coli DH5α. Resulting colonies were screened using primers HM1259/1260. Inserts were confirmed by DNA sequencing.
pHM170: The lacZ gene from pKG1 (Million-Weaver et al., 2015a) was amplified by PCR using primers HM1463 and HM1464. This PCR amplicon was digested with HindIII and SphI (Thermo) restriction enzymes and ligated into HindIII and SphI digested pDR111. The ligation reaction was subsequently transformed into E. coli DH5α and the construct was confirmed by PCR and DNA sequencing (Genewiz). The plasmid was subsequently purified and transformed into competent HM1 to generate strain HM1300.
pHM181: The lacZ gene from pHM170 was amplified by PCR with primers HM2120 and HM2121. The PCR amplicon was digested with SphI and EcoRI and ligated into SphI and EcoRI digested pDR111. The ligation reaction was subsequently transformed into E. coli DH5α and the construct was confirmed by PCR and DNA sequencing (Genewiz). The plasmid was subsequently purified and transformed into competent HM1 to generate strain HM1416.
pHM321: The lux operon was amplified by PCR from pAH60 (Ferguson et al., 2007) using primers HM2747 and HM2748. The PCR amplicon was digested with EagI and NheI and ligated into pDR111 that was digested with EagI and NheI. The ligation reaction was subsequently transformed into E. coli DH5α and the construct was confirmed by PCR and DNA sequencing (Genewiz). The plasmid was subsequently purified and transformed into competent HM1 to generate strain HM2197.
pHM271: The lacA::PrnhC-rnhC complementation construct was built by amplification of the native rnhC locus, including the native rnhC promoter (PrnhC) and terminator, with primers HM2406/2407, tagged with EcoRI and XhoI restriction sites. The rnhC PCR amplicon was digested with EcoRI and XhoI (Thermo) and ligated into the EcoRI and XhoI sites of pMMB752. The resulting vector, pHM271 (lacA::PrnhC-rnhC) was subsequently transformed into E. coli DH5α and verified by DNA sequencing using primers HM659/HM660. before transformation into competent B. subtilis. Integration at lacA was confirmed by colony PCR.
pHM506: pHM271 was used as template in quickchange PCR reaction using Phusion polymerase and primers HM3314/HM3315. The resulting PCR product (full length circular plasmid with single nucleotide change) was treated with DpnI to degrade the template plasmid. This reaction was subsequently used to transform E. coli DH5α. The construct was verified by DNA sequencing using primers HM659/HM660. Integration at lacA was confirmed by colony PCR.
pHM568: Primers HM4066/4067 were used to PCR amplify a 1000 bp sequence upstream of rnhC in Listeria monocytogenes. Primers HM4068/4069 were used to PCR amplify a 1000 bp sequence downstream of rnhC in Listeria monocytogenes. These amplicons were PCR purified and fused in a SOE PCR reaction and the full length 2000 bp product was amplified using primers HM4066/4069. The full length product was digested with BamHI and EcoRI and ligated into BamHI/EcoRI digested pKSV7. The ligation reaction was used to transform E. coli DH5α. Resulting colonies were screened with primers HM3937/HM3938 and the insert was verified with DNA sequencing. The resulting plasmid was used to transform E. coli SM10. Transformants were verified by colony PCR.
Viability assays - chronic treatments
Strains were struck on LB plates supplemented with the appropriate antibiotic from freezer stocks and incubated overnight at 37° C. Single colonies were used to inoculate 2 mL LB cultures in glass tubes. The cultures were grown at 37° C with shaking (260 RPM) to OD600 = 0.5–1.0. Precultures were adjusted to OD 0.3 and then serially diluted in 1× Spizizen’s Salts. 5ul of each dilution was plated onto LB plates and incubated at 30° C overnight. For survival assays with reporter strains, LB plates were either supplemented or not with various concentrations of IPTG (1mM, 0.1mM) For viability assays of cells chronically treated with stressors, plates were supplemented with various concentrations of lysozyme (50ug/mL), salt (700 mM), and paraquat (70 µM). Plates were imaged with a BioRad Gel Doc XR+ Molecular Imager and colonies were enumerated.
Viability assays - acute treatments
For viability assays of cells acutely treated with stressors in exponential phase, wild-type and ΔrnhC strains were grown until OD600 0.5 at 37°C and back-diluted to OD600 0.05 in LB. For acute transcription from Pspank(hy) reporters, cells were backdiluted in LB supplemented with or lacking 1mM IPTG and subsequently grown at 30°C for 2–3 generations (2 hours). For cells treated with stressors, cells were backdiluted in LB and subsequently grown at 30°C for 2–3 generations prior to the addition of the following stresses: 1.5M NaCl for 60 minutes, 1.2mM paraquat for 90 minutes, or 5µg/ml of lysozyme for 20 minutes. Cells were harvested and washed 2× with LB. After washing, samples were normalized to OD 0.3 based on the OD of the non-treated control. Cells were serially diluted and plated on LB lacking any stressor for CFU enumeration.
For viability assays of cells acutely treated with stressors in the absence of replication (stationary phase), wild-type and ΔrnhC strains were grown to OD600 of approximately 0.5 at 37°C and back-diluted to OD600 0.05. Cells were subsequently grown at 30°C until cells reached stationary growth. Strains were subsequently subjected to the following stress conditions: 2M NaCl for 60 minutes, 2mM Paraquat for 90 minutes, or 50 µg/ml of lysozyme for 20 minutes. For reporter strains, cells were treated with 100mM IPTG for 1 hour. Cells were harvested and washed 2× with LB. After washing, samples were normalized from the non-stress control to OD .3 and serial dilutions were plated for CFU enumeration.
DNA:RNA hybrid immunoprecipitation assays
DNA:RNA hybrid immunoprecipitation assays (DRIPs) were performed as described (García-Rubio et al., 2015) with some modifications. Precultures were diluted to OD600 of 0.05 in LB and grown at 32° C with shaking. At OD600 ~0.1, cultures were induced with 1 mM IPTG (final concentration) and grown until the culture was at OD600 = 0.3. Cells were pelleted by centrifugation and washed twice with cold PBS. Cell pellets were resuspended in spheroplast buffer (1 M sorbitol, 2 mM Tris-HCl pH 8.0, 100 mM EDTA, 0.1% β-mercapto-ethanol 0.25 mg/mL lysozyme) and incubated at 37° C for 10 minutes. Spheroplasts were collected by centrifugation at 5k RPM for 10 minutes. The supernatent was removed and pellets were washed with 1 mL of cold PBS without resuspension. Spheroplasts were then resuspended in solution I (0.8 mM GuHCl, 30 mM Tris-HCl pH 8.0, 30 mM EDTA, 5% Tween 20, 0.5% Triton X-100). Lysates were treated with RNase A (Thermo) for 30 min at 37° C and then treated with Proteinase K for 2 hours at 50° C. Lysates were then purified with chloroform-isoamyl alcohol (24:1). The aqueous phase was then moved to a new tube and 800 µL of isopropyl alcohol was added to precipitate the DNA. DNA was spooled on a Pasteur pipet and washed twice with 70% ethanol. The spooled DNA was allowed to dry at 37° C. After drying, DNA was resuspended in TE pH 8.0 and treated with HindIII overnight at 37° C. Digested chromosomal DNA was then purified over a sephadex G-50 column and brought to final volume of 125 µL. For the DRIP-Seq experiments, total nucleic acids were purified from cells treated with 1.2 M NaCl (30 min) using a DNA column purification kit (Thermo). The kit was used according to manufacturer’s guidelines, excluding the RNase A treatment. Nucleic acids were eluted from the column using TE pH 8.0 and subsequently digested overnight with HindIII at 37° C. After digestion, nucleic acids were purified via ethanol precipitation and pellets were resuspended in 125 µL TE pH8.0. 20 µL was then removed kept as INPUT. TE was then added to the remaining sample to a final volume of 450 µL and 51 µL of 10× Binding buffer (100 mM NaPO4 pH 7.0, 1.4 M NaCl, 0.5% Triton X-100) was added. S9.6 antibody (10 µL) (Millipore or Kerafast) was added and samples were incubated overnight at 4° C with gentle rotation. After incubation with the antibody, 40 µL of 50% Protein A sepharose beads (GE) were added and IPs were incubated at 4° C for 2 hours with gentle rotation. Beads were then pelleted by centrifugation at 2000 RPM for 1 minute. The supernatant was removed and the beads were washed 3× with 1mL of 1× Binding buffer. After the washes, 120 µL of elution buffer of elution buffer II (10 mM Tris pH 8.0, 1 mM EDTA, 0.67% SDS) and 7 µL Proteinase K (Qiagen) was added. For the INPUT samples, 27 µL of TE pH 8 and 3 µL Proteinase K was added. All samples were incubated at 55° C for 45 minutes. Beads were then pelleted by centrifugation at 7000 RPMs for 1 minute and the supernatant moved to a new tube. DNA was purified using a PCR purification kit (Thermo) and analyzed using qPCR. Relative enrichment of the reporter loci was calculated as the DRIP/input of the locus of interest divided by the DRIP/input at the control locus yhaX.
Chromatin immunoprecipitation assays
Precultures were diluted to OD600 of 0.05 in LB and grown at 32° C with shaking. At OD600 ~0.1, cultures were induced with 1 mM IPTG (final concentration) and grown until the culture was at OD600 = 0.3 and processed as described (Merrikh et al., 2011). Briefly, cultures were crosslinked with 1% formeldahyde for 20 minutes and subsequently quenched with 0.5 M glycine. Cell pellets were collected by centrifugation and washed once with cold phosphate buffered saline (PBS). Cell pellets were resuspended with 1.5 mL of Solution A (10 mM Tris–HCl pH 8.0, 20% w/v sucrose, 50 mM NaCl, 10 mM EDTA, 10 mg/ml lysozyme, 1 mM AEBSF) and incubated at 37° C for 30 min. After incubation, 1.5 mL of 2× IP buffer (100 mM Tris pH 7.0, 10 mM EDTA, 20% triton x-100, 300 mM NaCl and 1 mM AEBSF) was added and lysates were incubated on ice for 30 minutes. Lysates were then sonicated 4 times at 30% amplitude for 10 seconds of sonication and 10 seconds of rest. Lysates were pelleted by centrifugation at 8000 RPMs for 15 minutes at 4° C. Each IP was done with 1 mL of cell lysate and 40 µL was taken out prior to addition of the antibody as an input control. IPs were performed using rabbit polyclonal antibodies against DnaC (Smits et al., 2010). IPs were rotated overnight at 4° C. After incubation with the antibody, 30 µL of 50% Protein A sepharose beads (GE) were added and IPs were incubated at RT for one hour with gentle rotation. Beads were then pelleted by centrifugation at 2000 RPM for 1 minute. The supernatant was removed and the beads were washed 6× with 1 mL of 1× IP buffer. An addition wash was done with 1 mL of TE pH 8.0. After the washes, 100 µL of elution buffer I (50 mM Tris pH 8.0, 10 mM EDTA, 1% SDS) was added and beads were incubated at 65° C for 10 minutes. Beads were pelleted by centrifugation at 5000 RPMs for 1 minute. The supernatant was removed, saved and 150 µL of elution buffer II (10 mM Tris pH 8.0, 1 mM EDTA, 0.67% SDS) was added. Beads were then pelleted by centrifugation at 7000 RPMs for 1 minute and the supernatant was combined with the first elution. The combined eluates were then de-crosslinked by incubation at 65° C for overnight. The eluates were then treated with proteinase K (0.4 mg/mL) at 37° C for 2 hours. DNA was then extracted with a GeneJet PCR purification Kit (Thermo) according to the manufacturer’s instructions.
Quantitative PCRs
Quantitative PCRs (qPCRs) were performed using iTaq Universal SYBR Green master mix (Bio-Rad) and the CFX96 Touch Real-Time PCR system (Bio-Rad). For ChIPs and DRIPs, data were normalized to gene copy number by the ratios of total input to IP samples. Relative enrichment was determined by the ratio of gene copy number for lacZ (3’ primers HM910/911, 5’ primers HM1807/1808) or lux (3’ primers HM2803/2804, 5’ primers HM2799/2800) to yhaX (primers HM192/193). Relative expression was calculated as the ratio of copy number of the gene of interest (Reporter genes: lacZ primers HM188/189, luxA primers HM2799/2800, luxE primers HM2803/2804; Lysozyme response genes: sigV primers HM1766/1767, dltA primers HM1778/1779, ddl primers HM3385/3386, murF primers HM3387/3388; Oxidative stress response genes: katA primers HM3354/3355, ahpC primers HM3356/3357, ykuP primers HM3420/3421, dhbB primers HM3422/3423; Salt stress response genes: proH, primers HM3152/3153, ysnF primers HM3482/3483, katE primers HM2348/2349, yjgC primers HM3418/3419) to the housekeeping gene dnaK (primers HM770/771). Statistical analysis was done using a Student’s t-test in Prism 7.02 software package.
RNA extraction and cDNA preparation
For assays with transcriptional reporters, cells were grown in LB to mid-exponential phase and backdiluted to OD600 0.05 into LB either supplemented with or without 1 mM IPTG. For exponential phase experiments, cells were grown for 1 hour at 37°C (3 generations) prior to harvesting. For stationary phase (replication off) experiments, cells were grown to stationary phase for 3.5 hours at 37°C. Stationary cultures were treated with IPTG in a concentration equal to 50 mM IPTG per 1 OD600 per mL of culture for one hour prior to harvesting. For assays with stress agents performed in exponential phase, mid-exponential cultures were back diluted to OD600 0.05 in LB and grown for 1 hour at 37°C (3 generations). Cultures were split and either treated or not with 0.5 µg/mL lysozyme, 0.83 M NaCl, or 0.4 mM paraquat for 10 minutes prior to harvesting. For stationary phase (replication off) experiments, cells were grown to stationary phase for 3.5 hours at 37°C. Stationary cultures were either treated or not with 10 µg/mL lysozyme for 10 minutes, 1 M NaCl for 30 minutes, or 2 mM paraquat for 120 minutes. 2–4mL of culture was harvested by addition to an equal volume of ice-cold methanol followed by centrifugation at 4,000×g for 5 minutes. Cells were lysed with 20 µg/mL lysozyme for 10 minutes for cultures grown to exponential phase, and 20 minutes for cultures grown to stationary phase. RNA was isolated with the GeneJET RNA Purification Kit (ThermoFisher Scientific). 1 µg of RNA was treated with RNase-free DNase I (ThermoFisher Scientific) for 40 minutes at 37°C. DNase I was denatured by addition of 1 ul of EDTA and incubation at 65°C for 10 minutes. Reverse transcription was performed with iScript Supermix (BioRad) as per manufacturer’s instructions.
RNA-Seq
Parallel cultures of WT B. subtilis strain (HM1) were grown to mid-exponential growth phase (OD 0.3) in liquid LB media at 37° C. Cells were either left untreated, or 5M NaCl was added to a final concentration of 1.2M, and cells continued incubating as before for 30 minutes. Cells were then treated with a 1:1 volume of methanol pre-chilled to −20C, spun down, and frozen at −80C. RNA was purified using the Ovation Complete Prokaryotic RNA-Seq kit (Nugen 0326), then sequenced on an Illumina Next-Seq at the University of Washington Northwest Genomics Center. This yielded ~40M paired end reads per sample at 100 bp per read. Reads were mapped to the B. subtilis strain JH642 genome (Genbank accession number NZ_CP007800) using the CLC Genomics Workbench RNA-Seq tool. The transcripts per kilobase million (TPM) value output by CLC Genomics Workbench was used to calculate the fold-induction for each gene (TPM treated / TPM untreated), independently for both biological replicates. For each gene, the average induction between the two biological isolates was calculated, either in the WT or ΔrnhC strain. We then collected the induction data for genes that were induced at least 2-fold in the WT strain after salt treatment. Among these, we removed genes with a fold induction lower than 1 in the ΔrnhC strain. The resulting data set allowed us to directly compare the relative fold induction of genes in the two strains: fold induction in ΔrnhC /fold induction in WT. We then split the data into two bins based upon gene orientation (co-directional or head-on). We then ordered the relative induction values based upon descending fold induction values in the WT strain (i.e. we examined the relative induction level in the ΔrnhC strain as a function of overall induction). We then plotted the average fold induction value for genes among the top 10, 20, or 30 induced genes, or for all genes. To reduce noise, we removed data points greater than 1 standard deviation from the mean in each group. P-values were determined using a 2-tailed t-test.
In parallel, we conducted a second analysis of the TPM data. Here we identified differentially expressed genes in WT or ΔrnhC cells after salt treatment using the R software package EdgeR, and the function exactTest(). We used the resulting statistical significance data to identify only genes that were induced in both the WT and ΔrnhC data sets by removing genes with a p-value of > 0.05. We again ranked the remaining genes by descending fold induction in the WT strain, then calculated the average relative induction in the ΔrnhC strain for the 10, 20, or 30 highest induced genes. This method yielded similar results to the first method (which did not consider statistical significance when identifying induced genes). As with the first analysis, the average fold induction was lower in the rnhC mutant (0.56 ± 0.08) relative to the WT strain (1.28 ± .17) for the 10 most highly induced genes (p=0.002). This difference declined in genes induced to a lesser degree.
DRIP-Seq
DRIP samples were prepared from cultures of either WT or ΔrnhC cells treated with 1.2 M NaCl and then were further prepared for deep sequencing using an Nextera XT DNA Library Preparation kit (Illumina). After preparation, libraries were sequenced on an Illumina HiSeq sequencing platform. After sequencing, reads were mapped to the B. subtilis strain JH642 genome (Genbank accession number NZ_CP007800) using the CLC Genomics Workbench. Alignment files were then uploaded to the DeepTool Galaxy instance (Ramírez et al., 2014). Alignment files were then normalized for sequencing depth by calculated the RPKM for 50 bp bins and smoothed across 60 bp for the entire genome using the bamCoverage tool. Each DRIP library was then normalized to the input samples using the bigwigCompare tool, which calculated the ratio of each bin between the DRIP and input files. Matrices were then generated using the computeMatrix tool scaling the regions for 1000bp including 100 bp upstream and 150 downstream of each gene using the normalized DRIP/input files and BED files containing highly expressed salt response genes as determined by the RNA-Seq experiments. Genes groups in each orientation (head-on and co-directional) were parsed for genes >900 bp in length and 5 or more fold induction levels in the WT strain up salt treatment. Eight co-directional genes were then removed that had absolute expression values around 2× – 4× higher than the most highly expressed head-on gene to normalize the groups for transcription levels. This produced lists of 36 head-on and 38 co-directional genes, all with similar length and transcription distributions. After matrix calculation, plotProfile was used to generate line graphs plotting the mean and standard error of bins across all genes in each group. Similar results were obtained in two biological replicates.
Marker frequency
Precultures were diluted to OD600 of 0.05 in LB and grown at 32° C with shaking. At OD600 ~0.1, cultures were induced with 1 mM IPTG (final concentration) and grown until the culture was at OD600 = 0.3. Cells were pelleted by centrifugation (12k RPMs) and cell pellets were immediately frozen at −80° C. Genomic DNA was purified using a commercially available genomic DNA extraction kit (Thermo) and sent to Sinlgerla Genomics (La Jolla, CA) for DNA sequencing. Approximately 30M × 70 bp paired-end Illumina Next-Seq reads per sample were mapped to the genome of B. subtilis strains HM1300 (head-on lacZ) and HM1416 (co-directional lacZ) in the strain background JH642 (GenBank: CP007800.1) using Bowtie 2 (Langmead and Salzberg, 2012). Both PCR and optical duplicates were removed using Picard v1.3. Sam files were processed by SAMtools, view, sort, and mpileup functions to produce wiggle plots which were then normalized to total read count (Li et al., 2009).
2-dimensional (2D) gel electrophoresis
2D gels were run as described (Merrikh et al., 2015). B. subtilis cultures were grown to OD 0.3, then treated with 0.2% NaAzide to arrest growth. 20 mg of cells were then suspended in low-melt agarose plugs (0.5%). Lysis was performed in 2 mg/ml lysozyme for 16 hours at 37°C. Protein was removed via incubation with 5 mg/ml proteinase K, 5% sarkosyl, 0.5 M EDTA for 4 hours at 37°C. Proteinase K was then removed by 8 successive 4 hour washes in TE at 4°C. DNA was digested overnight in plugs equilibrated in 1× CutSmart buffer plus 2.0 µl of EcoRV (lacZ) or PstI (luxABCDE) (NEB). DNA was subjected to 2-dimensional electrophoresis and Southern blotting as previously (Friedman and Brewer, 1995). Probes for Southern blots were generated via random priming of gel-extracted PCR products corresponding to the lacZ (primer pair HM2765/HM2766) or luxABCDE (primer pair HM3862/HM3863) region. Probes were radioactively labelled using α-32P-dATP. Hybridization images were generated with phosphor screens and imaged on a Typhoon 6000 imager (GE Healthcare).
Mutation rates
Fluctuation analyses were performed as described previously (Foster, 2006; Paul et al., 2013). Precultures were grown for ~14 h, and then diluted to OD600 of 0.0005 in individual 18-mm culture tubes containing 2 mL of fresh LB either supplemented with 1 mM IPTG. Cultures were incubated at 37°C, with shaking, until reaching OD600 of 0.5. A volume of 1.5 mL of each culture was centrifuged, resuspended in 13 Spizizen’s salts, and plated on minimal medium lacking histidine with IPTG. The remainder of each culture was serially diluted and plated to quantify viable cells on minimal media containing all necessary amino acids. Colonies were enumerated after 40- to 48-h incubation at 37°C. Mutation rates were estimated using the Ma–Sandri–Sarkar maximum-likelihood method as described (Foster, 2006).
β-galactosidase activity
Precultures were diluted to OD600 of 0.05 in LB+1mM IPTG and grown at 37° C with shaking. At OD600 of 0.3–0.5 (which was recorded), 200 µL of cells were collected by centrifugation at 12,000 RPM for 2 min. The cell pellet was resuspended in Solution A + 5 mg/mL of lysozyme and incubated at 37° C for 30 min. 50 µL of 2× IP buffer is added and 1 mL of Z-buffer (60 mM Na2HPO4, 40 mM NaH2PO4, 10 mM KCl, and 1 mM MgSO4) supplemented with 20 mM β-mercaptoethanol and 4 mg/mL 2-nitrophenyl-β-D-galactopyranoside (ONPG). Reactions were incubated at 30° C until slightly yellow in color (the time was recorded for each reaction). Reactions were stopped by adding 300 µL of 1M Na2CO3) and pelleted at 14,000 RPM for 2 min. The OD420 was recorded for each reaction. Miller units were calculated as previously described (Miller, 1972).
Listeria growth curves
Overnight cultures of L. monocytogenes growth in BHI at 37° C were back diluted to OD600 of 0.005 in 10 mL of BHI in a 125 mL flask. Cultures were growth at 37° C with shaking. Samples were taken every 20 min to measure the OD600 of the culture.
Listeria chronic stress assays
Overnight cultures of L. monocytogenes were back diluted to OD600 of 0.05 in 2 mL of BHI broth. The tubes were incubated at 37° C with shaking until they reached mid-exponential phase (OD600 = 0.3 – 0.5). Each culture was then normalized to OD600 = 0.3 and then serially diluted and plated on either BHI agar plates or BHI agar plates containing 4% NaCl. Plates were incubated overnight at 37° C and then overnight again at room temperature before imaging.
Listeria tissue culture infections
TIB73 murine hepatocytes were cultured in DMEM medium (GIBCO) with 10% heat-inactivated FBS (HyClone) and supplemented with 2 mM sodium pyruvate and 1 mM L-Glutamine (Thermo Fisher). Murine and immortalized bone marrow macrophages (iBMDMs) were cultured in the same media. Macrophages were activated for 20 hours with murine interferon gamma (Peprotech) prior to infection. All cells were kept at 37°C in 5% CO2. WT 10403S L. monocytogenes were grown overnight at 30°C in BHI, washed twice in sterile PBS (Life Tech) and resuspended in PBS. For infection, 106 bacteria were added to 0.5 × 10⁶ iBMDMs and 8 × 10⁶ bacteria to 1.5 × 10⁶ TIB73 cells. Gentamicin (50 µg/mL) was added to the media at 1 hour post infection (hpi) to prevent growth of extracellular bacteria. At various times post infection iBMDMs were lysed in water and plated on BHI agar to quantify bacterial numbers in the cells. At three days post infection TIB73 plaques were visualized using 0.3% crystal violet solution (Fisher) and quantified using ImageJ software.
Mouse infections
Mice were all female between 6–8 weeks of age. Bacterial strains were grown overnight statically at 30 degrees in BHI then back-diluted using 1.2 mL of overnight to 4.8 mL of fresh BHI and grown for 1 hour at 37 degrees shaking. OD600 of these cultures were taken (WT OD=0.27 and Mutant OD=0.25) and, using the conversion of 1 OD = 1.7*10^9 CFU, diluted to 5*10^5 CFU/mL with PBS. 200 ul were then injected into each mouse retro-orbitally (1*10^5 CFU/mouse) and livers and spleens were harvested at 72 hours post infection. Livers were homogenized in 10 mL of cold 0.1% IPEGAL and spleens were homogenized in 5 mL using a Tissue Tearor Model 985370 (Biospec Products) at 10,000 RPM for 5 seconds/organ. Homogenates were diluted in PBS and plated on BHI plates to obtain CFU. All protocols were reviewed and approved by the Institutional Animal Care and Use Committee at the University of Washington.
QUANTIFICATION AND STATISICAL ANALYSIS
The definition of all data points and variance measurements are included in the figure legends. All measurements of standard deviation and/or standard error of means was performed in Prism 7.0 (Graphpad). RNA-Seq analysis of differentially expressed genes was done using CLC genomics workbench and the R package EdgeR. DRIP-seq analysis was done using CLC genomics workbench and DeepTools.
DATA AND SOFTWARE AVAILABILITY
The accession number for the data reported in this paper is NCBI SRA BIOPROJECT: SUB2307064.
Supplementary Material
Figure S1. DRIP-qPCR Analysis, Related to Figure 1
(A) Quantitative Real Time PCRs of DNA from either wild-type cells (HM1300 (HO)) or cells lacking rnhC (HM2043 (HO)) pulled down with the S9.6 anti-DNA:RNA hybrid antibody. Genetic background is indicated below graph. Relative enrichment is indicated on the y-axis and was calculated as the ratio of gene copy number for the 5’ and 3’ of lacZ (location indicated below x-axis) to the control locus yhaX. Data represent the means and SEM of at least 2 independent experiments.
(B) Quantitative Real Time PCRs of DNA from either wild-type cells (HM2195 (HO)) or cells lacking rnhC (HM2658 (HO)) pulled down with the S9.6 anti-DNA:RNA hybrid antibody. Genetic background is indicated below graph. Relative enrichment is indicated on the y-axis and was calculated as the ratio of gene copy number for the 5’ and 3’ of luxABCDE (location indicated below x-axis) to the control locus yhaX. Data represent the means and SEM of at least 2 independent experiments.
(C) DRIP enrichment at yhaX was calculated from data collected for measuring DRIPs at the reporter gene lacZ. The qPCR signal obtained from the DRIP enrichment sample at the yhaX locus was divided by the signal obtained from the input for each sample. The x-axis indicates the genotype of the cells that the samples were obtained; CD, reporter gene lacZ in the co-directional orientation; HO, reporter gene lacZ in the head-on orientation; WT (HM1300 (HO), HM1416 (CD), wild-type; ΔrnhC (HM2043 (HO), HM2044 (CD)), cells lacking rnhC. The y-axis represents the DRIP enrichment signal over the signal from the input sample. Data represent the mean and SEM from at least 2 independent experiments.
Figure S2. Survival of Cells Expressing a Loss-of-Function rnhC Allele, Related to Figure 3
ΔrnhC cells with rnhCE234A expressed at an ectopic locus harboring the IPTG-inducible reporter gene lacZ in either the HO (HM3208) or CD (HM3209) orientation plated on LB plates contain 0 (top panel) or 1 mM IPTG (bottom panel).
Figure S3. Survival of Cells Lacking Various RNases H, Related to Figure 3
(A) Top panel, representative plates of survival assays for either wild-type (WT) cells (HM1300, HM1416), or ΔrnhC cells (HM2043 (HO), HM2044 (CD)), or ΔrnhB (HM2041 (HO), HM2042 (CD)) harboring the IPTG-inducible reporter gene lacZ in either the HO or CD orientation plated on LB plates. Bottom panel, the same cells as the top panel but plated on LB+IPTG plates.
(B) Top panel, representative plates of survival assays for either wild-type (WT) cells (HM1300, HM1416), or ΔypeP cells (HM2781 (HO), HM2782 (CD)), or ΔypdQ (HM2783 (HO), HM2784 (CD)) harboring the IPTG-inducible reporter gene lacZ in either the HO or CD orientation plated on LB plates. Bottom panel, the same cells as the top panel but plated on LB+IPTG plates.
Figure S4. Protein Abundance of Cells Expressing lacZ in the Head-On Orientation, Related to Figure 5
Levels of beta-galactosidase activity were measured in cultures of WT (HM1300) or ΔrnhC cells (HM2043) expressing lacZ in the head-on orientation. The y-axis indicates the Miller units calculation and the x-axis indicates the genotype of the cells. Bars represent the mean and SEM of at least 3 independent experiments.
Figure S5. R-Loops Block Expression of Head-On Stress-Response Genes, Related to Figure 6
(A) Analysis of RNA-Seq results (same data as in Figure 5A) in either WT (HM1) or ΔrnhC (HM2655) cells exposed to osmotic stress. Each gene was plotted by its normalized expression values in ΔrnhC (HM2655, y-axis) and in WT (HM1, x-axis). Green dots indicate highly expressed co-directional (CD) genes. Blue dots indicate highly expressed head-on genes (HO). Lines indicate linear regression fits for each gene group.
(B and C) qRT-PCR analysis of stress response genes in either WT (HM1) or ΔrnhC (HM2655) cells. The y-axis indicates the fold induction of the indicated gene’s mRNA after the indicated treatment compared to untreated cultures. Black bars indicate wild-type cells and gray bars indicate ΔrnhC cells. Data represent the mean and SEM of at least two independent experiments. *p<0.05, n.s. not significant (B) qRT-PCR analysis of co-directional osmotic stress genes measured in either log-phase growth (+ Replication) or saturated, stationary phase growth (− Replication). (C) qRT-PCR analysis of head-on and co-directional lysozyme and paraquat stress response genes measured in either log-phase growth (+ Replication) or saturated, stationary phase growth (− Replication).
(D) Representative plates from acute treatment of cells with various stressors. + Replication indicates cells treated during mid-log phase and − Replication indicates cells treated in saturated stationary phase cultures.
Figure S6. Growth Kinetics of Listeria monocytogenes Lacking RNase HIII, Related to Figure 7
(A) Relative bacterial burdens for ΔrnhC vs. WT bacteria from data presented in Figure 7B. hpi, hours post infection.
(B) Growth curves for wild-type (HM3274, black circles) and ΔrnhC (HM3275, open circles) L. monocytogenes. Each time point represents the mean and SEM of 3 independent experiments.
Figure S7. Co-orientation of Genomes Correlates to Presences of RNase HIII, Related to Discussion
Data were compiled from (Zheng et al., 2015) and (Kochiwa et al., 2007). The y-axis represents the percent of genes on the chromosome that are co-oriented with respect to replication. Different strains and the presence (+) or absence (−) of genes encoding the different RNase H enzymes found by sequence similarity are indicated along the x-axis.
Highlights.
Head-on replication-transcription collisions lead to pervasive R-loop formation
R-loops at head-on genes stall replication, increase mutagenesis, and prevent restart
Gene-expression defects occur if R-loops at head-on genes are not resolved
Bacterial stress survival and pathogenesis requires R-loop processing at head-on genes
Acknowledgments
We would like to thank the members of the Merrikh lab for helpful discussions and Richard Losick for his generous gift of the Pspank(hy)-luxABCDE plasmid, pAH60. We thank Bonny Brewer for helpful discussions about the analysis of 2D gels. We thank Jay Shendure and Choli Lee for assistance in sequencing the DRIP-seq libraries. Finally, a special thank you to Sarah Mangiameli for performing the fluctuation tests on the mutation rate data. This work was supported by the Cell and Molecular Biology Training Grant T32 GM 007270 to A.N.H., the National Institutes of Health grants AI116669 and AI108698 and the Pew Scholars Program in the Biomedical Sciences to J.J.W. as well as the National Institute of Health New Innovator Award (DP2GM110773) and National Science Foundation grant MCB1243492 to H.M.
Footnotes
Supplemental Information includes seven figures and three tables and can be found with this article online at http://dx.doi.org/10.1016/j.cell.2017.07.044.
AUTHOR CONTRIBUTIONS
K.S.L., A.N.H., C.N.M., H.T., A.J.P., J.E.D., and M.R. performed experiments. K.S.L., A.N.H., C.N.M., M.R., H.T., J.J.W., and H.M. analyzed data. K.S.L., C.N.M., H.T., J.J.W., and H.M. designed experiments. K.S.L., H.T., C.N.M., J.J.W., and H.M. wrote the paper.
The following references appear in the Supplemental Information: Kochiwa et al., 2007; Zheng et al., 2015.
References
- Aguilera A, García-Muse T. R loops: from transcription byproducts to threats to genome stability. Mol. Cell. 2012;46:115–124. doi: 10.1016/j.molcel.2012.04.009. [DOI] [PubMed] [Google Scholar]
- Bigot A, Raynaud C, Dubail I, Dupuis M, Hossain H, Hain T, Chakraborty T, Charbit A. lmo1273, a novel gene involved in Listeria monocytogenes virulence. Microbiology. 2009;155:891–902. doi: 10.1099/mic.0.022277-0. [DOI] [PubMed] [Google Scholar]
- Boubakri H, de Septenville AL, Viguera E, Michel B. The helicases DinG, Rep and UvrD cooperate to promote replication across transcription units in vivo. EMBO J. 2010;29:145–157. doi: 10.1038/emboj.2009.308. [DOI] [PMC free article] [PubMed] [Google Scholar]
- Boulé J-B, Zakian VA. The yeast Pif1p DNA helicase preferentially unwinds RNA DNA substrates. Nucleic Acids Res. 2007;35:5809–5818. doi: 10.1093/nar/gkm613. [DOI] [PMC free article] [PubMed] [Google Scholar]
- Brehm SP, Staal SP, Hoch JA. Phenotypes of pleiotropic-negative sporulation mutants of Bacillus subtilis. J. Bacteriol. 1973;115:1063–1070. doi: 10.1128/jb.115.3.1063-1070.1973. [DOI] [PMC free article] [PubMed] [Google Scholar]
- Brill J, Hoffmann T, Bleisteiner M, Bremer E. Osmotically controlled synthesis of the compatible solute proline is critical for cellular defense of Bacillus subtilis against high osmolarity. J. Bacteriol. 2011;193:5335–5346. doi: 10.1128/JB.05490-11. [DOI] [PMC free article] [PubMed] [Google Scholar]
- Camejo A, Buchrieser C, Couvé E, Carvalho F, Reis O, Ferreira P, Sousa S, Cossart P, Cabanes D. In vivo transcriptional profiling of Listeria monocytogenes and mutagenesis identify new virulence factors involved in infection. PLoS Pathog. 2009;5:e1000449. doi: 10.1371/journal.ppat.1000449. [DOI] [PMC free article] [PubMed] [Google Scholar]
- Cao M, Moore CM, Helmann JD. Bacillus subtilis paraquat resistance is directed by sigmaM, an extracytoplasmic function sigma factor, and is conferred by YqjL and BcrC. J. Bacteriol. 2005;187:2948–2956. doi: 10.1128/JB.187.9.2948-2956.2005. [DOI] [PMC free article] [PubMed] [Google Scholar]
- Chang EY, Stirling PC. Replication fork protection factors controlling R-loop bypass and suppression. Genes (Basel) 2017;8:33. doi: 10.3390/genes8010033. [DOI] [PMC free article] [PubMed] [Google Scholar]
- Chib S, Byrd AK, Raney KD. Yeast helicase Pif1 unwinds RNA:DNA hybrids with higher processivity than DNA:DNA duplexes. J. Biol. Chem. 2016;291:5889–5901. doi: 10.1074/jbc.M115.688648. [DOI] [PMC free article] [PubMed] [Google Scholar]
- Chon H, Matsumura H, Koga Y, Takano K, Kanaya S. Crystal structure and structure-based mutational analyses of RNase HIII from Bacillus stearothermophilus: a new type 2 RNase H with TBP-like substrate-binding domain at the N terminus. J. Mol. Biol. 2006;356:165–178. doi: 10.1016/j.jmb.2005.11.017. [DOI] [PubMed] [Google Scholar]
- Costantino L, Koshland D. The yin and yang of R-loop biology. Curr. Opin. Cell Biol. 2015;34:39–45. doi: 10.1016/j.ceb.2015.04.008. [DOI] [PMC free article] [PubMed] [Google Scholar]
- Cutting SM, Harwood CR. Molecular Biological Methods for Bacillus. John Wiley & Sons, Inc.; 1990. [Google Scholar]
- Drolet M, Bi X, Liu LF. Hypernegative supercoiling of the DNA template during transcription elongation in vitro. J. Biol. Chem. 1994;269:2068–2074. [PubMed] [Google Scholar]
- Dutta D, Shatalin K, Epshtein V, Gottesman ME, Nudler E. Linking RNA polymerase backtracking to genome instability in E. coli. Cell. 2011;146:533–543. doi: 10.1016/j.cell.2011.07.034. [DOI] [PMC free article] [PubMed] [Google Scholar]
- Ferguson CC, Camp AH, Losick R. gerT, a newly discovered germination gene under the control of the sporulation transcription factor sigmaK in Bacillus subtilis. J. Bacteriol. 2007;189:7681–7689. doi: 10.1128/JB.01053-07. [DOI] [PMC free article] [PubMed] [Google Scholar]
- Foster PL. Methods for determining spontaneous mutation rates. Methods Enzymol. 2006;409:195–213. doi: 10.1016/S0076-6879(05)09012-9. [DOI] [PMC free article] [PubMed] [Google Scholar]
- French S. Consequences of replication fork movement through transcription units in vivo. Science. 1992;258:1362–1365. doi: 10.1126/science.1455232. [DOI] [PubMed] [Google Scholar]
- Friedman KL, Brewer BJ. Analysis of replication intermediates by two-dimensional agarose gel electrophoresis. Methods Enzymol. 1995;262:613–627. doi: 10.1016/0076-6879(95)62048-6. [DOI] [PubMed] [Google Scholar]
- Fukushima S, Itaya M, Kato H, Ogasawara N, Yoshikawa H. Reassessment of the in vivo functions of DNA polymerase I and RNase H in bacterial cell growth. J. Bacteriol. 2007;189:8575–8583. doi: 10.1128/JB.00653-07. [DOI] [PMC free article] [PubMed] [Google Scholar]
- Gan W, Guan Z, Liu J, Gui T, Shen K, Manley JL, Li X. R-loop-mediated genomic instability is caused by impairment of replication fork progression. Genes Dev. 2011;25:2041–2056. doi: 10.1101/gad.17010011. [DOI] [PMC free article] [PubMed] [Google Scholar]
- Ganesan A, Spivak G, Hanawalt PC. Transcription-coupled DNA repair in prokaryotes. Prog. Mol. Biol. Transl. Sci. 2012;110:25–40. doi: 10.1016/B978-0-12-387665-2.00002-X. [DOI] [PubMed] [Google Scholar]
- García-Muse T, Aguilera A. Transcription-replication conflicts: how they occur and how they are resolved. Nat. Rev. Mol. Cell Biol. 2016;17:553–563. doi: 10.1038/nrm.2016.88. [DOI] [PubMed] [Google Scholar]
- García-Rubio ML, Pérez-Calero C, Barroso SI, Tumini E, Herrera-Moyano E, Rosado IV, Aguilera A. The Fanconi anemia pathway protects genome integrity from R-loops. PLoS Genet. 2015;11:e1005674. doi: 10.1371/journal.pgen.1005674. [DOI] [PMC free article] [PubMed] [Google Scholar]
- Guariglia-Oropeza V, Helmann JD. Bacillus subtilis σ(V) confers lysozyme resistance by activation of two cell wall modification pathways, peptidoglycan O-acetylation and D-alanylation of teichoic acids. J. Bacteriol. 2011;193:6223–6232. doi: 10.1128/JB.06023-11. [DOI] [PMC free article] [PubMed] [Google Scholar]
- Haruki M, Tsunaka Y, Morikawa M, Kanaya S. Cleavage of a DNA-RNA-DNA/DNA chimeric substrate containing a single ribonucleotide at the DNA-RNA junction with prokaryotic RNases HII. FEBS Lett. 2002;531:204–208. doi: 10.1016/s0014-5793(02)03503-2. [DOI] [PubMed] [Google Scholar]
- Itaya M, Omori A, Kanaya S, Crouch RJ, Tanaka T, Kondo K. Isolation of RNase H genes that are essential for growth of Bacillus subtilis 168. J. Bacteriol. 1999;181:2118–2123. doi: 10.1128/jb.181.7.2118-2123.1999. [DOI] [PMC free article] [PubMed] [Google Scholar]
- Ivančić-Baće I, AL Howard J, Bolt EL. Tuning in to Interference: R-Loops and Cascade Complexes in CRISPR Immunity. J. Mol. Biol. 2012;422:607–616. doi: 10.1016/j.jmb.2012.06.024. [DOI] [PubMed] [Google Scholar]
- Jore MM, Lundgren M, van Duijn E, Bultema JB, Westra ER, Waghmare SP, Wiedenheft B, Pul Ü, Wurm R, Wagner R, et al. Structural basis for CRISPR RNA-guided DNA recognition by Cascade. Nat. Struct. Mol. Biol. 2011;18:529–536. doi: 10.1038/nsmb.2019. [DOI] [PubMed] [Google Scholar]
- Kochiwa H, Tomita M, Kanai A. Evolution of ribonuclease H genes in prokaryotes to avoid inheritance of redundant genes. BMC Evol. Biol. 2007;7:128. doi: 10.1186/1471-2148-7-128. [DOI] [PMC free article] [PubMed] [Google Scholar]
- Kogoma T. Stable DNA replication: interplay between DNA replication, homologous recombination, and transcription. Microbiol. Mol. Biol. Rev. 1997;61:212–238. doi: 10.1128/mmbr.61.2.212-238.1997. [DOI] [PMC free article] [PubMed] [Google Scholar]
- Langmead B, Salzberg SL. Fast gapped-read alignment with Bowtie 2. Nat. Methods. 2012;9:357–359. doi: 10.1038/nmeth.1923. [DOI] [PMC free article] [PubMed] [Google Scholar]
- Li H, Handsaker B, Wysoker A, Fennell T, Ruan J, Homer N, Marth G, Abecasis G, Durbin R 1000 Genome Project Data Processing Subgroup. The sequence alignment/map format and SAMtools. Bioinformatics. 2009;25:2078–2079. doi: 10.1093/bioinformatics/btp352. [DOI] [PMC free article] [PubMed] [Google Scholar]
- Lin Y-L, Pasero P. Interference between DNA replication and transcription as a cause of genomic instability. Curr. Genomics. 2012;13:65–73. doi: 10.2174/138920212799034767. [DOI] [PMC free article] [PubMed] [Google Scholar]
- Liu B, Alberts BM. Head-on collision between a DNA replication apparatus and RNA polymerase transcription complex. Science. 1995;267:1131–1137. doi: 10.1126/science.7855590. [DOI] [PubMed] [Google Scholar]
- Liu J, Marians KJ. PriA-directed assembly of a primosome on D loop DNA. J. Biol. Chem. 1999;274:25033–25041. doi: 10.1074/jbc.274.35.25033. [DOI] [PubMed] [Google Scholar]
- Maduike NZ, Tehranchi AK, Wang JD, Kreuzer KN. Replication of the Escherichia coli chromosome in RNase HI-deficient cells: multiple initiation regions and fork dynamics. Mol. Microbiol. 2014;91:39–56. doi: 10.1111/mmi.12440. [DOI] [PMC free article] [PubMed] [Google Scholar]
- Masse E, Drolet M. Relaxation of Transcription-induced Negative Supercoiling Is an Essential Function of Escherichia coli DNA Topoisomerase I. J. Biol. Chem. 1999;274:16654–16658. doi: 10.1074/jbc.274.23.16654. [DOI] [PubMed] [Google Scholar]
- Matson SW. Escherichia coli DNA helicase II (uvrD gene product) catalyzes the unwinding of DNA.RNA hybrids in vitro. Proc. Natl. Acad. Sci. USA. 1989;86:4430–4434. doi: 10.1073/pnas.86.12.4430. [DOI] [PMC free article] [PubMed] [Google Scholar]
- Merrikh H. Spatial and temporal control of evolution through replication-transcription conflicts. Trends Microbiol. 2017;25:515–521. doi: 10.1016/j.tim.2017.01.008. [DOI] [PMC free article] [PubMed] [Google Scholar]
- Merrikh CN, Brewer BJ, Merrikh H. The B. subtilis accessory helicase PcrA facilitates DNA replication through transcription units. PLoS Genet. 2015;11:e1005289. doi: 10.1371/journal.pgen.1005289. [DOI] [PMC free article] [PubMed] [Google Scholar]
- Merrikh H, Machón C, Grainger WH, Grossman AD, Soultanas P. Co-directional replication-transcription conflicts lead to replication restart. Nature. 2011;470:554–557. doi: 10.1038/nature09758. [DOI] [PMC free article] [PubMed] [Google Scholar]
- von Meyenburg K, Boye E, Skarstad K, Koppes L, Kogoma T. Mode of initiation of constitutive stable DNA replication in RNase H-defective mutants of Escherichia coli K-12. J. Bacteriol. 1987;169:2650–2658. doi: 10.1128/jb.169.6.2650-2658.1987. [DOI] [PMC free article] [PubMed] [Google Scholar]
- Miller JH. Experiments in Molecular Genetics. Cold Spring Harbor, NY: Cold Spring Harbor Laboratory Press; 1972. [Google Scholar]
- Million-Weaver S, Samadpour AN, Moreno-Habel DA, Nugent P, Brittnacher MJ, Weiss E, Hayden HS, Miller SI, Liachko I, Merrikh H. An underlying mechanism for the increased mutagenesis of lagging- strand genes in Bacillus subtilis. Proc. Natl. Acad. Sci. USA. 2015a;112:E1096–E1105. doi: 10.1073/pnas.1416651112. [DOI] [PMC free article] [PubMed] [Google Scholar]
- Million-Weaver S, Samadpour AN, Merrikh H. Replication restart after replication-transcription conflicts requires recA in Bacillus subtilis. J. Bacteriol. 2015b;197:2374–2382. doi: 10.1128/JB.00237-15. [DOI] [PMC free article] [PubMed] [Google Scholar]
- Mirkin EV, Mirkin SM. Mechanisms of transcription-replication collisions in bacteria. Mol. Cell. Biol. 2005;25:888–895. doi: 10.1128/MCB.25.3.888-895.2005. [DOI] [PMC free article] [PubMed] [Google Scholar]
- Mostertz J, Scharf C, Hecker M, Homuth G. Transcriptome and proteome analysis of Bacillus subtilis gene expression in response to superoxide and peroxide stress. Microbiology. 2004;150:497–512. doi: 10.1099/mic.0.26665-0. [DOI] [PubMed] [Google Scholar]
- Nicolas P, Mäder U, Dervyn E, Rochat T, Leduc A, Pigeonneau N, Bidnenko E, Marchadier E, Hoebeke M, Aymerich S, et al. Condition-dependent transcriptome reveals high-level regulatory architecture in Bacillus subtilis. Science. 2012;335:1103–1106. doi: 10.1126/science.1206848. [DOI] [PubMed] [Google Scholar]
- Ohtani N, Haruki M, Morikawa M, Kanaya S. Molecular diversities of RNases H. J. Biosci. Bioeng. 1999a;88:12–19. doi: 10.1016/s1389-1723(99)80168-6. [DOI] [PubMed] [Google Scholar]
- Ohtani N, Haruki M, Morikawa M, Crouch RJ, Itaya M, Kanaya S. Identification of the genes encoding Mn2+dependent RNase HII and Mg2+dependent RNase HIII from Bacillus subtilis: classification of RNases H into three families. Biochemistry. 1999b;38:605–618. doi: 10.1021/bi982207z. [DOI] [PubMed] [Google Scholar]
- Paul S, Million-Weaver S, Chattopadhyay S, Sokurenko E, Merrikh H. Accelerated gene evolution through replication-transcription conflicts. Nature. 2013;495:512–515. doi: 10.1038/nature11989. [DOI] [PMC free article] [PubMed] [Google Scholar]
- Pomerantz RT, O’Donnell M. The replisome uses mRNA as a primer after colliding with RNA polymerase. Nature. 2008;456:762–766. doi: 10.1038/nature07527. [DOI] [PMC free article] [PubMed] [Google Scholar]
- Ramírez F, Dündar F, Diehl S, Grüning BA, Manke T. deepTools: a flexible platform for exploring deep-sequencing data. Nucleic Acids Res. 2014;42:W187–W191. doi: 10.1093/nar/gku365. [DOI] [PMC free article] [PubMed] [Google Scholar]
- Rocha EPC, Danchin A. Essentiality, not expressiveness, drives gene-strand bias in bacteria. Nat. Genet. 2003a;34:377–378. doi: 10.1038/ng1209. [DOI] [PubMed] [Google Scholar]
- Rocha EPC, Danchin A. Gene essentiality determines chromosome organisation in bacteria. Nucleic Acids Res. 2003b;31:6570–6577. doi: 10.1093/nar/gkg859. [DOI] [PMC free article] [PubMed] [Google Scholar]
- Ruiz de los Mozos I, Vergara-Irigaray M, Segura V, Villanueva M, Bitarte N, Saramago M, Domingues S, Arraiano CM, Fechter P, Romby P, et al. Base pairing interaction between 5′- and 3′-UTRs controls icaR mRNA translation in Staphylococcus aureus. PLoS Genet. 2013;9:e1004001. doi: 10.1371/journal.pgen.1004001. [DOI] [PMC free article] [PubMed] [Google Scholar]
- Rutkauskas M, Sinkunas T, Songailiene I, Tikhomirova MS, Siksnys V, Seidel R. Directional R-Loop Formation by the CRISPR-Cas Surveillance Complex Cascade Provides Efficient Off-Target Site Rejection. Cell Rep. 2015;10:1534–1543. doi: 10.1016/j.celrep.2015.01.067. [DOI] [PubMed] [Google Scholar]
- Santos-Pereira JM, Aguilera A. R loops: new modulators of genome dynamics and function. Nat. Rev. Genet. 2015;16:583–597. doi: 10.1038/nrg3961. [DOI] [PubMed] [Google Scholar]
- Scortti M, Monzó HJ, Lacharme-Lora L, Lewis DA, Vázquez-Boland JA. The PrfA virulence regulon. Microbes Infect. 2007;9:1196–1207. doi: 10.1016/j.micinf.2007.05.007. [DOI] [PubMed] [Google Scholar]
- Skourti-Stathaki K, Proudfoot NJ. A double-edged sword: R loops as threats to genome integrity and powerful regulators of gene expression. Genes Dev. 2014;28:1384–1396. doi: 10.1101/gad.242990.114. [DOI] [PMC free article] [PubMed] [Google Scholar]
- Smits WK, Goranov AI, Grossman AD. Ordered association of helicase loader proteins with the Bacillus subtilis origin of replication in vivo. Mol. Microbiol. 2010;75:452–461. doi: 10.1111/j.1365-2958.2009.06999.x. [DOI] [PMC free article] [PubMed] [Google Scholar]
- Srivatsan A, Tehranchi A, MacAlpine DM, Wang JD. Co-orientation of replication and transcription preserves genome integrity. PLoS Genet. 2010;6:e1000810. doi: 10.1371/journal.pgen.1000810. [DOI] [PMC free article] [PubMed] [Google Scholar]
- Sureka K, Choi PH, Precit M, Delince M, Pensinger D, Huynh TN, Jurado AR, Goo YA, Sadilek M, Iavarone AT, et al. The cyclic dinucleotide c-di-AMP is an allosteric regulator of metabolic enzyme function. Cell. 2014;158:1389–1401. doi: 10.1016/j.cell.2014.07.046. [DOI] [PMC free article] [PubMed] [Google Scholar]
- Thomas M, White RL, Davis RW. Hybridization of RNA to double-stranded DNA: formation of R-loops. Proc. Natl. Acad. Sci. U. S. A. 1976;73:2294–2298. doi: 10.1073/pnas.73.7.2294. [DOI] [PMC free article] [PubMed] [Google Scholar]
- Wahba L, Costantino L, Tan FJ, Zimmer A, Koshland D. S1-DRIP-seq identifies high expression and polyA tracts as major contributors to R-loop formation. Genes Dev. 2016;30:1327–1338. doi: 10.1101/gad.280834.116. [DOI] [PMC free article] [PubMed] [Google Scholar]
- Wu HY, Shyy SH, Wang JC, Liu LF. Transcription generates positively and negatively supercoiled domains in the template. Cell. 1988;53:433–440. doi: 10.1016/0092-8674(88)90163-8. [DOI] [PubMed] [Google Scholar]
- Zhang Y, Mooney RA, Grass JA, Sivaramakrishnan P, Herman C, Landick R, Wang JD. DksA guards elongating RNA polymerase against ribosome-stalling-induced arrest. Mol. Cell. 2014;53:766–778. doi: 10.1016/j.molcel.2014.02.005. [DOI] [PMC free article] [PubMed] [Google Scholar]
- Zheng W-X, Luo C-S, Deng Y-Y, Guo F-B. Essentiality drives the orientation bias of bacterial genes in a continuous manner. Sci. Rep. 2015;5:16431. doi: 10.1038/srep16431. [DOI] [PMC free article] [PubMed] [Google Scholar]
Associated Data
This section collects any data citations, data availability statements, or supplementary materials included in this article.
Supplementary Materials
Figure S1. DRIP-qPCR Analysis, Related to Figure 1
(A) Quantitative Real Time PCRs of DNA from either wild-type cells (HM1300 (HO)) or cells lacking rnhC (HM2043 (HO)) pulled down with the S9.6 anti-DNA:RNA hybrid antibody. Genetic background is indicated below graph. Relative enrichment is indicated on the y-axis and was calculated as the ratio of gene copy number for the 5’ and 3’ of lacZ (location indicated below x-axis) to the control locus yhaX. Data represent the means and SEM of at least 2 independent experiments.
(B) Quantitative Real Time PCRs of DNA from either wild-type cells (HM2195 (HO)) or cells lacking rnhC (HM2658 (HO)) pulled down with the S9.6 anti-DNA:RNA hybrid antibody. Genetic background is indicated below graph. Relative enrichment is indicated on the y-axis and was calculated as the ratio of gene copy number for the 5’ and 3’ of luxABCDE (location indicated below x-axis) to the control locus yhaX. Data represent the means and SEM of at least 2 independent experiments.
(C) DRIP enrichment at yhaX was calculated from data collected for measuring DRIPs at the reporter gene lacZ. The qPCR signal obtained from the DRIP enrichment sample at the yhaX locus was divided by the signal obtained from the input for each sample. The x-axis indicates the genotype of the cells that the samples were obtained; CD, reporter gene lacZ in the co-directional orientation; HO, reporter gene lacZ in the head-on orientation; WT (HM1300 (HO), HM1416 (CD), wild-type; ΔrnhC (HM2043 (HO), HM2044 (CD)), cells lacking rnhC. The y-axis represents the DRIP enrichment signal over the signal from the input sample. Data represent the mean and SEM from at least 2 independent experiments.
Figure S2. Survival of Cells Expressing a Loss-of-Function rnhC Allele, Related to Figure 3
ΔrnhC cells with rnhCE234A expressed at an ectopic locus harboring the IPTG-inducible reporter gene lacZ in either the HO (HM3208) or CD (HM3209) orientation plated on LB plates contain 0 (top panel) or 1 mM IPTG (bottom panel).
Figure S3. Survival of Cells Lacking Various RNases H, Related to Figure 3
(A) Top panel, representative plates of survival assays for either wild-type (WT) cells (HM1300, HM1416), or ΔrnhC cells (HM2043 (HO), HM2044 (CD)), or ΔrnhB (HM2041 (HO), HM2042 (CD)) harboring the IPTG-inducible reporter gene lacZ in either the HO or CD orientation plated on LB plates. Bottom panel, the same cells as the top panel but plated on LB+IPTG plates.
(B) Top panel, representative plates of survival assays for either wild-type (WT) cells (HM1300, HM1416), or ΔypeP cells (HM2781 (HO), HM2782 (CD)), or ΔypdQ (HM2783 (HO), HM2784 (CD)) harboring the IPTG-inducible reporter gene lacZ in either the HO or CD orientation plated on LB plates. Bottom panel, the same cells as the top panel but plated on LB+IPTG plates.
Figure S4. Protein Abundance of Cells Expressing lacZ in the Head-On Orientation, Related to Figure 5
Levels of beta-galactosidase activity were measured in cultures of WT (HM1300) or ΔrnhC cells (HM2043) expressing lacZ in the head-on orientation. The y-axis indicates the Miller units calculation and the x-axis indicates the genotype of the cells. Bars represent the mean and SEM of at least 3 independent experiments.
Figure S5. R-Loops Block Expression of Head-On Stress-Response Genes, Related to Figure 6
(A) Analysis of RNA-Seq results (same data as in Figure 5A) in either WT (HM1) or ΔrnhC (HM2655) cells exposed to osmotic stress. Each gene was plotted by its normalized expression values in ΔrnhC (HM2655, y-axis) and in WT (HM1, x-axis). Green dots indicate highly expressed co-directional (CD) genes. Blue dots indicate highly expressed head-on genes (HO). Lines indicate linear regression fits for each gene group.
(B and C) qRT-PCR analysis of stress response genes in either WT (HM1) or ΔrnhC (HM2655) cells. The y-axis indicates the fold induction of the indicated gene’s mRNA after the indicated treatment compared to untreated cultures. Black bars indicate wild-type cells and gray bars indicate ΔrnhC cells. Data represent the mean and SEM of at least two independent experiments. *p<0.05, n.s. not significant (B) qRT-PCR analysis of co-directional osmotic stress genes measured in either log-phase growth (+ Replication) or saturated, stationary phase growth (− Replication). (C) qRT-PCR analysis of head-on and co-directional lysozyme and paraquat stress response genes measured in either log-phase growth (+ Replication) or saturated, stationary phase growth (− Replication).
(D) Representative plates from acute treatment of cells with various stressors. + Replication indicates cells treated during mid-log phase and − Replication indicates cells treated in saturated stationary phase cultures.
Figure S6. Growth Kinetics of Listeria monocytogenes Lacking RNase HIII, Related to Figure 7
(A) Relative bacterial burdens for ΔrnhC vs. WT bacteria from data presented in Figure 7B. hpi, hours post infection.
(B) Growth curves for wild-type (HM3274, black circles) and ΔrnhC (HM3275, open circles) L. monocytogenes. Each time point represents the mean and SEM of 3 independent experiments.
Figure S7. Co-orientation of Genomes Correlates to Presences of RNase HIII, Related to Discussion
Data were compiled from (Zheng et al., 2015) and (Kochiwa et al., 2007). The y-axis represents the percent of genes on the chromosome that are co-oriented with respect to replication. Different strains and the presence (+) or absence (−) of genes encoding the different RNase H enzymes found by sequence similarity are indicated along the x-axis.