Abstract
The accumulation of neutral lipids in intracellular lipid droplets has been associated with the formation and progression of many cancers, including prostate cancer (PCa). Alpha-beta Hydrolase Domain Containing 5 (ABHD5) is a key regulator of intracellular neutral lipids that has been recently identified as a tumor suppressor in colorectal cancer, yet its potential role in PCa has not been investigated. Through mining publicly accessible PCa gene expression datasets, we found that ABHD5 gene expression is markedly decreased in metastatic castration-resistant PCa (mCRPC) samples. We further demonstrated that RNAi-mediated ABHD5 silencing promotes, whereas ectopic ABHD5 overexpression inhibits, the invasion and proliferation of PCa cells. Mechanistically, we found that ABHD5 knockdown induces epithelial to mesenchymal transition, increasing aerobic glycolysis by upregulating the glycolytic enzymes hexokinase 2 and phosphofrucokinase, while decreasing mitochondrial respiration by downregulating respiratory chain complexes I and III. Interestingly, knockdown of ATGL, the best-known molecular target of ABHD5, impeded the proliferation and invasion, suggesting an ATGL-independent role of ABHD5 in modulating PCa aggressiveness. Collectively, these results provide evidence that ABHD5 acts as a metabolic tumor suppressor in PCa that prevents EMT and the Warburg effect, and indicates that ABHD5 is a potential therapeutic target against mCRPC, the deadly aggressive PCa.
Introduction
Prostate cancer (PCa) is the most common solid organ malignancy in men and the second leading cause of cancer-related death reported in industrialized countries1. Because PCa belongs to a class of hormone-dependent malignancies, androgen deprivation therapy (ADT) has been employed as the frontline approach for its therapeutic intervention for over 70 years2. However, despite initial responsiveness to ADT, the majority of the treated patients will relapse within two years, and further develop metastatic and castration-resistant PCa (mCRPC), the most aggressive and deadly form of PCa3,4. Presently, how PCa cells acquire the ability to grow and invade in the absence of hormonal stimulation is not well understood.
Cancer initiation and progression involve derangement of cellular metabolism5. For example, many cancer cells prefer partial catabolism of glucose in cytosol to complete oxidation in mitochondria, even in the presence of abundant oxygen. The phenomenon of aerobic glycolysis, termed the Warburg effect6, is a central feature of cancer cell metabolism that efficiently reserves anabolic building blocks for proliferation and reduces oxidative stress resulting from mitochondrial respiration, thus providing proliferative and survival advantages7,8. Notably, PCa cells do not exhibit a switch to aerobic glycolysis until the disease progresses to the mCRPC stage9–14, suggesting that there might be important alterations in oxidative metabolism that facilitate PCa progression.
Many cancer cells, including PCa cells, often display marked expansion of lipid droplets (LDs), the intracellular organelles that serve as the storage depots for neutral lipids such as triacylglycerols (TAGs)15,16. LDs control the availability of free fatty acids (FA), which act both as signaling molecules and fuels for mitochondrial oxidative metabolism when glucose is in short supply17,18. Biochemically, mobilization of FAs from LDs is achieved through the process of lipolysis in which FAs are made available from hydrolysis of TAGs by triacylglycerol lipases. Alpha-beta Hydrolase Domain Containing 5 (ABHD5) is an activating coenzyme for Adipose Triglyceride Lipase (ATGL), the rate-limiting lipase in numerous tissues18. In humans, loss-of-function mutations of the ABHD5 gene lead to Chanarin-Dorfman Syndrome, a rare hereditary disorder that is characterized by excessive deposition of neutral lipids in multiple organs19,20. In mice, ablation of ABHD5 gene in liver decreases respiration and increases glycolysis, conferring a metabolic state reminiscent of the Warburg effect21. These data suggest that alteration of ABHD5 might also influence cancer metabolism. Recently, pioneering work by Ou et al. identified ABHD5 as a novel tumor suppressor in colorectal cancer22. Using a combination of genetically engineered mouse models and molecular cellular approaches, these authors discovered that intestine-specific ablation of ABHD5 dramatically promotes metastatic progression of colorectal tumor, by downregulation of AMPK/p53 signaling and thereby promoting the epithelial to mesenchymal transition (EMT)22. Interestingly, it was later found that elevation of ABHD5 in tumor-associated macrophages promotes colorectal tumor growth23, indicating a cell-type-specific functional role of ABHD5. Thus, although ABHD5 established as a tumor suppressor in colon cancer, its regulatory roles in other cancer types have not been investigated.
In this study, we analyzed ABHD5 gene expression in the publicly accessible human PCa datasets. Our results showed that ABHD5 is markedly decreased in mCRPC. Using LNCaP cell as a model system, we found that ABHD5 knockdown increased, whereas its overexpression reduced, the aggressiveness of PCa cells. As expected, ABHD5 silencing promoted aerobic glycolysis. Intriguingly, we found ABHD5 silencing reduced expression of specific respiratory chain complexes (RCCs). Thus, our results indicate that ABHD5 suppresses PCa aggressiveness by supporting oxidative metabolism, and suggest that activation of ABHD5 might be useful in treatment of advanced PCa.
Results
ABHD5 is downregulated in mCRPC
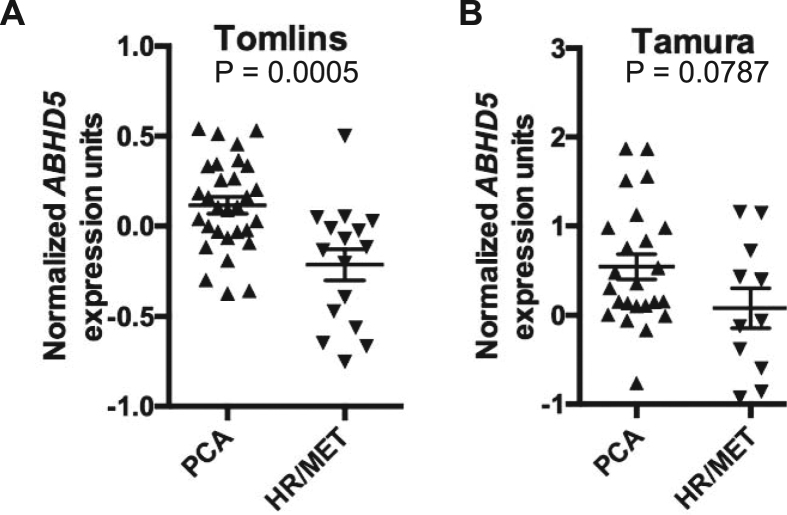
We first examined the human PCa expression datasets that were published in the Gene Expression Omnibus (GEO) database and found 2 datasets, Tomolins24 and Tamura25, that contain sufficient mCRPC samples for statistical analyses. In the Tomlins dataset, ABHD5 gene expression was significantly decreased in the mCRPC cases compared to the non-metastatic PCa (p = 0.0005, Fig. 1A). Decreased expression of ABHD5 was also suggested in Tamura dataset, although the statistical significance was marginal due to a larger variance of the data (p = 0.08, Fig. 1B). These results suggest that ABHD5 gene expression is suppressed in mCRPC.
Figure 1.
Markedly decreased ABHD5 gene expression in metastatic castration-resistant PCa. Scatter plots demonstrate ABHD5 gene expression in primary (PCA) and hormone-refractory metastatic (HR/MET) prostate cancers in Tomlins (A) and Tamura (B) datasets.
ABHD5 expression is decreased whereas TAG content is increased in aggressive PCa cells
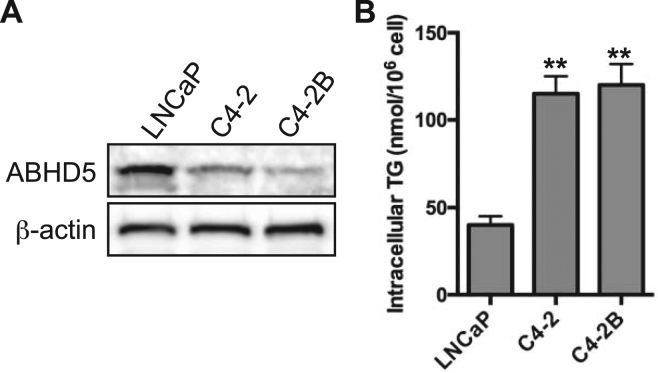
LNCaP, C4-2 and C4-2B are isogenic PCa cell lines differing in the degrees of tumorigenicity and androgen dependence26,27. As compared to low metastatic and androgen-sensitive LNCaP cells, C4-2 and C4-2B cells are highly metastatic and androgen-insensitive26,27. Compared to low-metastatic LNCaP cells, ABHD5 protein levels were consistently lower (Fig. 2A) and intracellular TAG higher (Fig. 2B) in C4-2 and C4-2B cells. The reciprocal relationship between ABHD5 expression and TAG accumulation among these PCa cells lines suggested a possible role of ABHD5 in reducing the aggressive phenotype of PCa cells.
Figure 2.
Determination of ABHD5 expression and triacylglycerol content in LNCaP, C4-2 and C4-2B cells. (A) Expression level of endogenous ABHD5 was determined in LNCaP, C4-2 and C4-2B cells by Western blotting. β-actin was used as a loading control. (B) Intracellular triacylglycerol level in LNCaP, C4-2 and C4-2B cells. Data are presented as mean ± SEM (n = 3) of experiments performed in triplicate. Two tailed t-test, *P < 0.01.
Knockdown of ABHD5 promotes the epithelial to mesenchymal transition of PCa cells
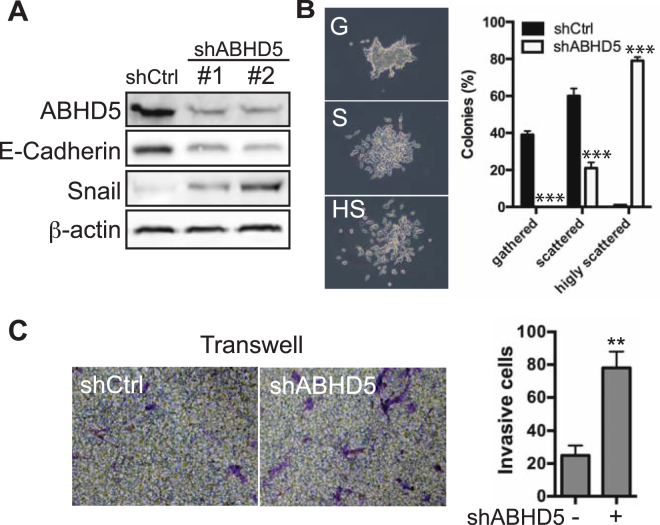
Next, we investigated whether altering ABHD5 expression influences PCa cell behavior. We first used shRNA to silence ABHD5 expression in LNCaP cells, which express relatively high levels of ABHD5 (Fig. 2A). LNCaP cells were infected with lentiviral vectors expressing either ABHD5-targeting shRNA (shABHD5) or scramble control (shCtrl), and pools of cells were tested following selection with puromycin. Western blotting demonstrated that shABHD5 with two different shRNA sequences both reduced ABHD5 expression by >70% (Fig. 3A). Knockdown of ABHD5 reduced the expression of E-Cadherin, an epithelial marker, and elevated that of Snail, a mesenchymal maker (Fig. 3A), indicating that loss of ABHD5 activates EMT of LNCaP cells. Knockdown of ABHD5 dramatically promoted cell scattering (Fig. 3B): whereas all colonies of shABHD5 cells were scattered and ~80% were scored as highly scattered, ~40% of control colonies were scored as gathered. These results indicated enhanced migration as a result of ABHD5 silencing. Furthermore, Matrigel Boyden chamber analysis showed that knockdown of ABHD5 enhanced cell invasion by ~4 fold (Fig. 3C). Thus, ABHD5 silencing confers an invasive phenotype to LNCaP cells by activating EMT.
Figure 3.
Effects of ABHD5 silencing on the migration and invasion of LNCaP cells. (A) Expression level of ABHD5, E-Cadherin, Snail and β-actin proteins in shControl and shABHD5 cells. (B) Enhanced cell scattering of shABHD5 cells. shControl and shABHD5 cells were seeded at low density and grown for 2 weeks. Cell colonies (>100 cells/colony) were analyzed under the microscope and sorted into the following groups according to morphology: gathered (G), cells attached to each other tightly; scattered (S), cells scattered but attached loosely; highly scattered (HS), cells detached from each other. Percentages of colonies from each group are plotted in the left panel. Data are presented as mean ± SEM (n = 3) of experiments performed in triplicate. Two-tailed t-test, ***P < 0.001. Representative images of cell colonies are shown on the right. (C) Enhanced cell invasion of shABHD5 cells. A representative image of Transwell invasion assay is shown for each group, respectively, (left panels). Numbers of invasive cell are plotted on the right. Data are presented as mean ± SEM (n = 3) of experiments performed in triplicate. Two-tailed t-test, **P < 0.01.
Mechanistic aspects for EMT activation by ABHD5 deficiency
ABHD5 deficiency in colorectal cells downregulates the AMPK/p53 signaling axis, leading to EMT22. To test whether this occurs in PCa cells, we first measured the levels of phosphorylated AMPK and total p53 in the LNCaP cells with or without ABHD5 knockdown. The results showed that shABHD5 decreased the expression of phospho-AMPKα and p53 (Supplementary Figure 1), suggesting that ABHD5 silencing downregulates AMPK/p53 signaling in LNCaP cells. PC3 is a prostate cancer cell line deficient of p5328. We knocked down ABHD5 in PC3 cells with shRNAs and observed that knockdown of ABHD5 had negligible effects on the expression of E-Cadherin and Snail (Supplementary Figure 2A) and on cell invasion (Supplementary Figure 2B), which suggests that p53 is required for activation of EMT in PCa cells by ABHD5 loss. Thus, EMT activation by ABHD5 deficiency in PCa cells may involve downregulation of AMPK/p53 signaling axis.
Knockdown of ABHD5 promotes TAG accumulation and aerobic glycolysis
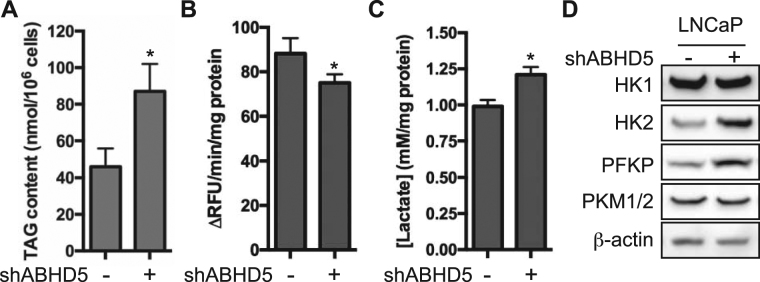
A possible mechanism by which loss of ABHD5 function promotes the aggressiveness of PCa cells is by altering cellular metabolism. To test this possibility, we examined whether ABHD5 silencing influences the TAG content of LNCaP cells. The results showed that ABHD5 silencing increased TAG level by ~2-fold (Fig. 4A), consistent with the reduced cellular triglyceride hydrolysis activity (Fig. 4B).
Figure 4.
ABHD5 silencing elevates the production of lactic acid and upregulates the expression of key glycolytic enzymes. Intracellular TAG content (A), lipase activity (B) and lactic acid secretion (C) of LNCaP cells. Data are presented as mean ± SEM (n = 3) of experiments performed in triplicate. Two-tailed t-test, *P < 0.05. (D) Protein level of key glycolytic enzymes in LNCaP cells.
shABHD5 cells were observed to acidify culture media much faster than shControl cells, as indicated by rapid yellowing of culture media. Analysis of culture media showed that shABHD5 cells produced lactic acid at a significantly higher rate than shControl cells (Fig. 4C), indicating enhanced aerobic glycolysis. Consistent with elevation of glycolytic flux, we found that ABHD5 silencing upregulated hexokinase (HK) 2 and phosphofrucotokinase P (PFKP) protein expression without affecting levels of HK1 or pyruvate kinase M1/M2 (PKM1/2) (Fig. 4D). Thus, ABHD5 silencing promotes aerobic glycolysis (the Warburg effect) in LNCaP cells by upregulating key glycolytic enzymes.
Knockdown of ABHD5 impairs mitochondrial respiration
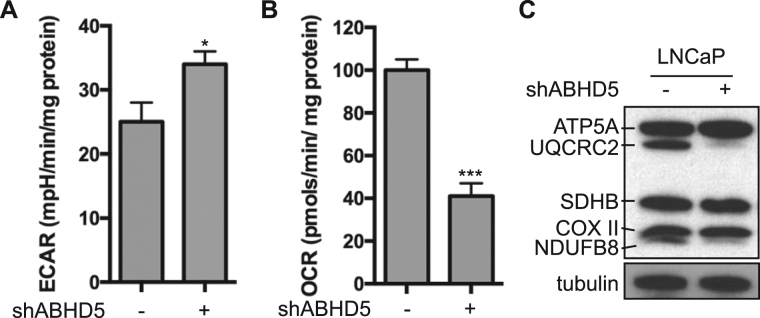
To further characterize the metabolic effects of ABHD5 knockdown, we performed metabolic flux measurements on a XFe24 Seahorse analyzer. As expected from the measurement of lactate production, ABHD5 silencing significantly elevated the basal extracellular acidification rate (EACR) (Fig. 5A). In contrast, results further showed that ABHD5 silencing significantly decreased the basal oxygen consumption rate (OCR) (Fig. 5B), indicating reduced mitochondrial respiration. To explore the molecular basis for regulation of mitochondrial respiration by ABHD5, we determined the influence of ABHD5 silencing on the expression of respiratory chain complex (RCC) proteins. Simultaneously probing expression markers of all RCCs using a cocktail of OXPHOS antibodies demonstrated that ABHD5 silencing selectively downregulated RCCs I and III (Fig. 5C).
Figure 5.
ABHD5 silencing reduces oxygen consumption and downregulates the expression of RCC I and III. Basal extracellular acidification rate (EACR) (A) and oxygen consumption rate (OCR) (B) of LNCaP cells measured with a Seahorse metabolic flux analyzer. Data are presented as mean ± SEM (n = 3) of experiments performed in triplicate. Two-tailed t-test, *P < 0.05, ***P < 0.001. (C) Protein levels of respiratory chain complexes of LNCaP cells visualized with Total OXPHOS antibody cocktail in Western Blotting.
Overexpression of ABHD5 inhibits the aggressiveness of PCa cells
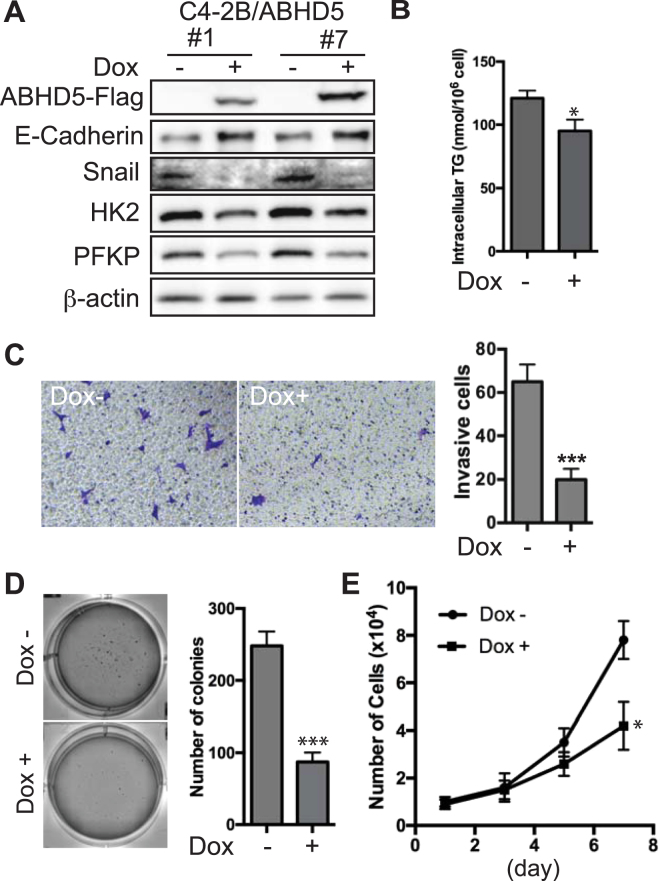
To test whether increased ABHD5 expression could antagonize the aggressiveness of PCa cells, we overexpressed ABHD5 in C4-2B, the cell line expressing relatively low level of ABHD5 (Fig. 2A), using a doxycycline (dox)-responsive vector29. Following viral vector infection and drug-resistance selection, we identified ABHD5-overexpressing cells and designated these cells as C4-2B-ABHD5 cells. As shown in Fig. 6A, a 2-day dox treatment markedly induced Flag-tagged ABHD5 expression, concomitantly decreasing the expression of Snail, HK2 and PFKP, but increasing that of E-Cadherin in two individual clones. Further functional characterization of C4-2B-ABHD5 cells showed that overexpression of ABHD5 significantly reduced intracellular TAG contents (Fig. 6B), cell invasion (Fig. 6C), colony formation (Fig. 6D) and cell proliferation (Fig. 6E). Thus, overexpression of ABHD5 was sufficient to inhibit the aggressiveness of PCa cells.
Figure 6.
Effects of ectopic ABHD5 overexpression on the proliferation and invasion of C4-2B cells. (A) Expression level of ABHD5-Flag, E-Cadherin, Snail, HK2, PFKP and β-actin proteins in C4-2B/ABHD5 cells treated with or without doxycycline (dox). (B) Level of intracellular TAG content in C4-2B/ABHD5 cells treated with or without dox. Two-tailed t-test, *P < 0.05. (C) Repression of cell invasion by ABHD5. A representative image of Transwell invasion assay is shown for each group, respectively, on the left. Numbers of invasive cell are plotted on the right. Data are presented as mean ± SEM (n = 3) of experiments performed in triplicate. Two-tailed t-test, ***P < 0.001. (D) Repression of colony formation by ABHD5. A representative image of soft agar assay is shown for each group, respectively, on the left. Number of colonies is plotted on the right. Data are presented as mean ± SEM (n = 3) of experiments performed in triplicate. Two-tailed t-test, ***P < 0.001. (E) Repression of cell proliferation by ABHD5. Growth curve is plotted for C4-2B cells grown in the presence or absence of doxycycline. Data are presented as mean ± SEM (n = 3) of experiments performed in triplicate. Two-way ANOVA test, *P < 0.05.
Knockdown of ATGL impedes proliferation and invasion of PCa cells
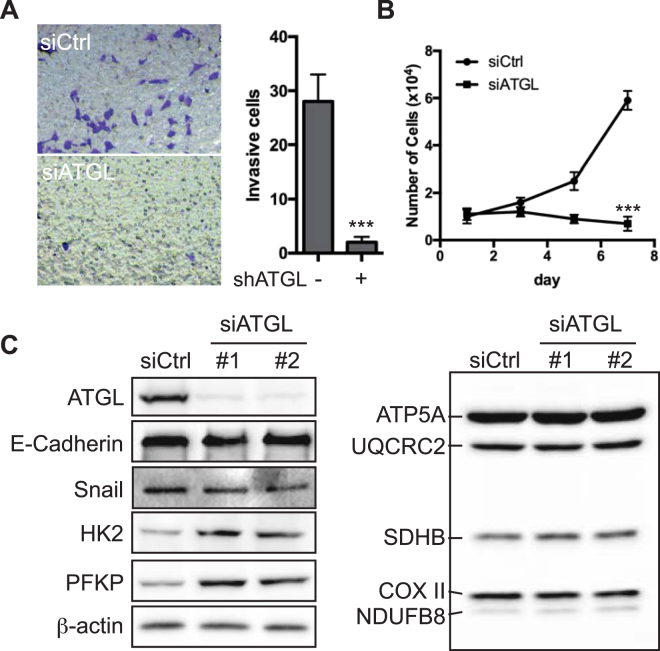
ABHD5 is well characterized as a coactivator of ATGL, the rate-limiting enzyme of lipolysis in numerous cell types. To test whether ATGL mediates the effects of ABHD5 on PCa cell aggressiveness, we studied the effects on cell proliferation and invasion by ATGL knockdown with siRNA oligos in LNCaP cells. Surprisingly, we found that knockdown of ATGL severely slowed cell proliferation (Fig. 7A) and inhibited cell invasion (Fig. 7B). Knockdown of ATGL also had negligible effects on the expression of E-Cadherin and Snail (Fig. 7C). Nonetheless, knockdown of ATGL upregulated the expression of HK2 and PFKP (Fig. 7C, left), without affecting the expression of RCCs (Fig. 7C, right). Thus, these results suggest that ABHD5 and ATGL may diverge in the molecular pathways for modulating PCa cell aggressiveness and certain aspects of the metabolic phenotype.
Figure 7.
Knockdown of ATGL impedes proliferation and invasion of LNCaP cells. (A) ATGL knockdown strongly decreases cell invasion. A representative image of Transwell invasion assay is shown for each group on the left. Numbers of invasive cells are plotted on the right. Two-tailed test, ***P < 0.001. (B) ATGL knockdown strongly slows cell proliferation. Growth curve is plotted for LNCaP cells treated with or without the siRNA against ATGL. Two-way ANOVA test, ***P < 0.001. (C) Protein expression of ATGL, E-Cadherin, Snail, HK2, PFKP, RCCs and β-actin, analyzed by Western blotting.
Discussion
Despite the initial effectiveness of standard therapy, the majority of PCa patients relapse and develop the incurable and deadly mCRPC. Reprogramming of cellular metabolism has been linked to the progression of prostate tumors30,31, raising the possibility that new therapeutic targets might be discovered in the pathways that support aberrant metabolism in PCa. In this study, we examined the role of ABHD5, a lipase co-activator and newly identified tumor suppressor22, in PCa progression. Our results indicate that ABHD5 gene expression is reduced in mCRPC, and that ABHD5 is critical in maintaining oxidative cellular metabolism that suppresses the aggressiveness of PCa cells. These results provide strong evidence to support ABHD5 as a novel target against PCa progression.
The marked accumulation of intracellular lipid droplets is a well-known morphological feature of PCa16, and such accumulation is often more pronounced in metastatic PCa cells32,33. While lipogenesis, the biosynthetic arm of lipid metabolism, is upregulated in PCa and likely promotes PCa oncogenesis34, how the TAG catabolism of stored lipids influences PCa progression has not been investigated. The present work shows that loss of ABHD5 function promotes EMT (Fig. 3) and TAG accumulation (Fig. 4) of LNCaP cells, suggesting an important role of ABHD5 in reducing the aggressiveness of PCa cells. Consistent with this conclusion we found that ectopic overexpression of ABHD5 attenuates both proliferation and invasion of C4-2B cells (Fig. 6). These findings support a novel anti-oncogenic role of ABHD5 in PCa and suggest that activation of ABHD5 function might have utility against advanced PCa.
The molecular mechanism by which ABHD5 deficiency activates EMT was explored in the present study. A comprehensive study by Ou et al. revealed that loss of ABHD5 in colorectal cancer cells represses AMPK/p53 signaling, leading to activation of EMT22. Consistent with these observations, we found that silencing ABHD5 decreased the expression of pAMPKα and p53 in LNCaP cells (Supplementary Figure 1). In addition, we observed that p53-null PC3 cells were refractory to the EMT activation by ABHD5 knockdown (Supplementary Figure 2), suggesting a critical role of p53 for mediating the modulation of EMT status by ABHD5 in PCa cells.
Advanced PCa cells adopt the Warburg phenotype to support metastatic progression and androgen resistance35–37. Our results demonstrate that ABHD5 silencing strongly promotes aerobic glycolysis as revealed by increased production of lactic acid (Fig. 4C) and by upregulated expression of the rate-limiting glycolytic enzymes HK2 and PFKP (Fig. 4D) in shABHD5 cells. It was reported that HK2 is a key mediator for promoting mCRPC progression under conditions of PTEN and p53 loss36. Thus, the ABHD5/HK2 axis identified here suggests that ABHD5 prevents aerobic glycolysis and thereby reinforces tumor suppression by PTEN and p53. Our results also demonstrate that ABHD5 silencing greatly decreases mitochondrial respiration in PCa cells (Fig. 5B), similar to the effects observed in colon cancer cells22 and other normal cells21. Interestingly, ABHD5 silencing dramatically downregulated the expression of RCC I and III enzymes, which indicates an unanticipated role of ABHD5 in modulating the electron transport chain (ETC). It is not currently known how ABHD5 modulates ETC gene expression; however, it is possible that fatty acids generated from ABHD5-mediated lipolysis act either as metabolic fuels to boost mitochondrial oxidative metabolism or as signaling molecules to promote mitochondrial biogenesis38. Taken together, our results indicate that ABHD5 is required for both inhibiting aerobic glycolysis and maintaining mitochondrial respiration, which together prevents the Warburg effect.
The TAG lipase ATGL is the best-known molecular target of ABHD5. However, our results revealed that knockdown of ATGL failed to mimic the effects of ABHD5 with respect to cell proliferation and invasion (Fig. 7A and B), and expression of EMT markers (Fig. 7C). In this regard, although loss of ABHD5 and ATGL function increases TAG accumulation in numerous tissues, defects in these genes give rise to distinct phenotypes19,39,40, indicating that ABHD5 regulates lipases and pathways that are independent of ATGL. Our results, which are consistent with the early observations made in colorectal cancer cells22, provide further evidence that ABHD5 modulates certain aspects of cancer aggressiveness independently of ATGL.
In summary, our findings strongly support ABHD5 as a suppressor of the Warburg effect and the aggressive progression of PCa cells. Given that ABHD5 activity can be directly modulated by endogenous and synthetic allosteric ligands41, our findings suggest that ABHD5 might be developed as a new therapeutic target for advanced PCa.
Methods
Cell culture, plasmid construction, viral packaging and cell line establishment
Human prostate cancer cell lines LNCaP (ATCC), C4-2 and C4-2B (Urocor Inc. Oklahoma) were maintained in RPMI 1640 medium supplemented with 10% fetal bovine serum (FBS) and 100 U of penicillin/ml, and 0.1 ng of streptomycin/ml. HEK293FT (Invitrogen) cells were maintained in DMEM medium supplemented with 10% fetal bovine serum (FBS) and 100 U of penicillin/ml, and 0.1 ng of streptomycin/ml.
For construction of lentiviral vector for ectopic overexpression of ABHD5, the DNA fragment encoding full-length human ABHD5 protein was PCR-amplified with the primer pair, 5′-GGGGACAAGTTTGTACAAAAAAGCAGGCTATCGATGCCACCATGGCGGCGGAGGAGGAG-3′ and 5′-TTTGTCGACTCACTTGTCATCGTCGTCCTTGTAGTCTCCGCCCCCGTCCACAGTGTCGCA-3′, and cloned into pInducer2029 with gateway cloning technology (Invitrogen). The resultant expression vector was designated as pInducer20-ABHD5. For knockdown of ABHD5, the pLKO.puro lentiviral small-hairpin RNA vectors against human ABHD5 (TRCN0000052020 and TRCN0000299891) was obtained from Sigma. For knockdown of ATGL, the siRNA oligos (SASI_Hs01_00225605 and SASI_Hs01_00225606) were obtained from Sigma and transfected into cells with RNAiMAX transfection reagent (Invitrogen).
For lentiviral packaging, pInducer20 or pLKO.puro vectors was cotransfected with pMD2.G and psPAX2 packaging vectors into HEK293FT cells using lipofectamine 2000 (Invitrogen). 48 h post transfection, virus-containing culture media were harvested and cell debris were removed by passing through 0.45 um filters.
For stable overexpression of ABHD5, C4-2B cells were infected with pInducer20-ABHD5 lentivirus, and selected with 500 ug G418/ml. For stable knockdown of ABHD5, LNCaP cells were infected with pLKO.puro-ABHD5, and selected with 2 ug puromycin/ml. The drug-resistant cells were validated for altered ABHD5 expression by Western blotting.
Measurements of metabolic fluxes and cellular metabolites
To measure intracellular triacylglycerol, cells were harvested and suspended in 5% NP-40 aqueous solution. Cell extracts were prepared with 2 cycles of heating (95 °C, 5 min) and cooling (on ice, 5 min) followed by a centrifugation at 12,000 g for 5 min. Cellular triacylglycerol contents were determined with Triglyceride reagent (#T2449, Sigma) on a microplate reader (BMG Labtech) according to the manufacturer’s specifications.
The method of lactic acid measurement was adapted from Brandt et al.42. In brief, appropriate amount of culture media was incubated at RT for 30 min in a final 100 ul of reaction mix containing 160 mM Tris-Hydrozine (pH 9.0), 2.5 mM NAD+, 0.01% BSA and 8 U lactate dehydrogenase. The amount of lactic acid was extrapolated from a standard curve based on the Ab340 reading recorded on a microplate reader (BMG Labtech).
To measure EACR and OCR, 40,000 cells were plated on polylysine coated XFe24 extracellular flux plates a day prior to the assay. On the day of analysis, the adherent cells were washed and fresh media were added. Basal oxygen consumption rate (OCR) was measured along with the Extracellular acidification (ECAR) on a Seahorse XF Extracellular Flux Analyzer (Seahorse Bioscience).
Determination of cell growth and invasion
Cell growth curves were determined as previously described43.
To measure cellular capacity for anchor-independent growth, the soft-agar colony formation assay was performed. In brief, 5,000 cells were seeded in the top layer of the agar media containing 0.35% Nobel agar, 1x RPMI 1640 and 10% FBS, and laid on the bottom layer of the agar media containing 0.75% Nobel agar in a 6-well plate. Cells were fed with complete growth media every 3 days. Following cell growth for 3 weeks, cell colonies were stained with crystal violet (0.005% in PBS) and quantified under a microscope.
To measure cellular capacity for invasion, the Boyden chamber Matrigel invasion assay was performed. In brief, cells were seeded in the serum-free media in 8 um Boyden Chamber (Corning) coated with Matrigel (BD Bioscience), and the chamber was placed inside a bottom plate containing complete growth media as migratory attractants. Following 24 h incubation, invasive cells retained on the filter were fixed with 1% paraformaldehyde and stained with 1% crystal violet, and quantified under a microscope.
Western blotting
Cells were washed twice in phosphate-buffered saline (PBS) and lysed in cytoplasmic lysis buffer (25 mM Tris-HCl pH 7.5, 40 mM NaCl, 1% Triton X-100). Protein concentrations were determined with the Bradford reagent (Bio-Rad). Cell lysates (30 ug) were resolved by sodium dodecyl sulfate-polyacrylamide gel electrophoresis (SDS-PAGE), and proteins were transferred onto nitrocellulose filters. The blots were saturated with 5% nonfat milk and probed with antibodies against ABHD538, E-Cadherin (#610181, BD Biosciences, 1:2000), Snail (#3879, Cell Signaling, 1:500), p53 (#AHO0152, Invitrogen, 1:1000), phospho-AMPKα (#2535, Cell Signaling, 1:1000), HK1 (#2024, Cell Signaling, 1:1000), HK2 (#2867, Cell Signaling, 1:1000), PFKP (#8164, Cell Signaling, 1:1000), PKM1/2 (#3190, Cell Signaling, 1:1000), ATGL (#55190-1-AP, Proteintech, 1:1000), FLAG (#F3165, Sigma, 1:1000), β-actin (A2066, Sigma, 1:1000), Total OXPHOS Human Antibody Cocktail (ab110411, Abcam, 1:1000) or α-tubulin (ab52866, Abcam, 1:1000). Following a wash with PBST (PBS containing 0.1% Tween 20), the blots were incubated with horseradish peroxidase-coupled goat anti-rabbit or –mouse immunoglobulin G (Sigma, 1:5000). The immunolabeled protein bands were detected by enhanced chemiluminescence (ECL) method (Perkin Elmer).
Cellular lipase activity assay
The method for measurement of cellular lipase activity was adapted from Ou et al.22. The cellular lipase activity was determined by measuring the rate of fluorescence production (λex/λem = 355/460 nM) from fluorogenic ester substrate 4-methylumbelliferyl heptanoate (MUH) by cell homogenates. Briefly, Cells were washed with phosphate buffered saline and then homogenized in the buffer (50 mM Tris-HCl, pH 7.4, 250 mM Sucrose, 1 mM EDTA) by sonication. The assay reaction was initiated by forming the 100 μl reaction mix containing 20 mM Tris-HCl pH 8.0, 1.5 μM MUH, 100 μg cell homogenates and 1 mM EDTA in a 96-well microplate. The changes of fluorescence were monitored in the kinetic mode for 5 minutes on a CLARIOstar microplate reader (BMG Labtech). The lipase activities were expressed as ΔRFU/min/mg protein (RFU = relative fluorescence units).
Bioinformatics analysis for ABHD5 gene expression in human mCRPC datasets
Two publically available gene expression profiling datasets of prostate cancer, the Tomlins (accession number: GSE6099) and the Tamura (accession number: GSE6811), were retrieved from the NCBI Gene Expression Omnibus (GEO) database (https://www.ncbi.nlm.nih.gov/gds). The Tomlins and the Tamura datasets contain 30 and 24 primary prostate cancer tissues as well as 16 and 11 hormone refractory and metastatic cancer tissues, respectively. For multiple probes corresponding to ABHD5 gene, only the probe closest to the 3′ end of ABHD5 gene full-length mRNA was used based on the available corresponding EST sequences where the probes were derived. Finally, the probe ID labeled as “Hs6-13-4-8” in the Tomlins dataset and as “7562” in the Tamura dataset, the corresponding ABHD5 gene expression values, and the sample source information were abstracted for further analysis. The gene expression values in both datasets were presented as log2-transformed signal intensity ratio (Cy5/Cy3). For each microarray dataset, we classified the samples with both hormone refractory and metastasis as Cases and the ones sampled from primary prostate cancer tissues without metastasis as Controls. After checking the normality of ABHD5 gene expression distribution and the equality of variances between case and control groups in each dataset, a t-test was applied to compare mean difference of ABHD5 expression between two groups. The statistical significance level, α, was set as 0.05 for a two-sided test. The final results were summarized as mean of the log2(ratio) and its corresponding standard error (SE), and further visualized with a scatterplot.
Statistical analysis
Statistical analyses were performed with SAS v9.4 (SAS Institute, Cary, North Carolina) and GraphPad Prism 6 software (GraphPad Software, La Jolla, CA). Data are presented as means ± SE. Statistical significance between two groups was determined by unpaired t-test. Comparison between cell growth curves was performed using a two-way ANOVA.
Data availability
All data generated and analyzed during this study are included in this published article.
Electronic supplementary material
Acknowledgements
We are thankful to James Wang for critical reading of the manuscript. This work is partly supported by the KCI PCRT Pilot grant to J.W. and J.G. and by the WSU startup to J.W.
Author Contributions
J.W., J.G., I.P. and W.S. designed the research; G.C., G.Z., S.A., Z.H. and S.L. performed the research; G.C., G.Z., S.A. and J.W. analyze data; J.W., J.G. and I.P. wrote the paper.
Competing Interests
The authors declare that they have no competing interests.
Footnotes
Electronic supplementary material
Supplementary information accompanies this paper at 10.1038/s41598-017-13398-w.
Publisher's note: Springer Nature remains neutral with regard to jurisdictional claims in published maps and institutional affiliations.
References
- 1.Siegel RL, Miller KD, Jemal A. Cancer statistics, 2015. CA Cancer J. Clin. 2015;65:5–29. doi: 10.3322/caac.21254. [DOI] [PubMed] [Google Scholar]
- 2.Hodges, C. The effect of castration, of estrogen and of androgen injection on serum phosphatases in metastatic carcinoma of the prostate. Cancer Res. (1941). [DOI] [PubMed]
- 3.Chen CD, et al. Molecular determinants of resistance to antiandrogen therapy. Nat. Med. 2004;10:33–39. doi: 10.1038/nm972. [DOI] [PubMed] [Google Scholar]
- 4.DeMarzo AM, Nelson WG, Isaacs WB, Epstein JI. Pathological and molecular aspects of prostate cancer. The Lancet. 2003;361:955–964. doi: 10.1016/S0140-6736(03)12779-1. [DOI] [PubMed] [Google Scholar]
- 5.Hanahan D, Weinberg RA. Hallmarks of Cancer: The Next Generation. Cell. 2011;144:646–674. doi: 10.1016/j.cell.2011.02.013. [DOI] [PubMed] [Google Scholar]
- 6.Warburg O. On the Origin of Cancer Cells. Science. 1956;123:309–314. doi: 10.1126/science.123.3191.309. [DOI] [PubMed] [Google Scholar]
- 7.Vander Heiden MG, Cantley LC, Thompson CB. Understanding the Warburg effect: the metabolic requirements of cell proliferation. Science. 2009;324:1029–1033. doi: 10.1126/science.1160809. [DOI] [PMC free article] [PubMed] [Google Scholar]
- 8.Garcia-Heredia JM, Carnero A. Decoding Warburg’s hypothesis: tumor-related mutations in the mitochondrial respiratory chain. Oncotarget. 2015;6:41582. doi: 10.18632/oncotarget.6057. [DOI] [PMC free article] [PubMed] [Google Scholar]
- 9.Hofer C, et al. Fluorine-18-fluorodeoxyglucose positron emission tomography is useless for the detection of local recurrence after radical prostatectomy. European Urol. 1999;36:31–35. doi: 10.1159/000019923. [DOI] [PubMed] [Google Scholar]
- 10.Effert PJ, et al. Metabolic imaging of untreated prostate cancer by positron emission tomography with sup 18 fluorine-labeled deoxyglucose. J. Urol. 1996;155:994–998. doi: 10.1016/S0022-5347(01)66366-3. [DOI] [PubMed] [Google Scholar]
- 11.Pertega‐Gomes, N. et al. A glycolytic phenotype is associated with prostate cancer progression and aggressiveness: A role for Monocarboxylate Transporters as metabolic targets for therapy. J. Pathol. (2015). [DOI] [PMC free article] [PubMed]
- 12.Shreve PD, Grossman HB, Gross MD, Wahl RL. Metastatic prostate cancer: initial findings of PET with 2-deoxy-2-[F-18] fluoro-D-glucose. Radiology. 1996;199:751–756. doi: 10.1148/radiology.199.3.8638000. [DOI] [PubMed] [Google Scholar]
- 13.Flavin R, Zadra G, Loda M. Metabolic alterations and targeted therapies in prostate cancer. J. Pathol. 2011;223:284–295. doi: 10.1002/path.2809. [DOI] [PMC free article] [PubMed] [Google Scholar]
- 14.Karantanos T, Corn PG, Thompson TC. Prostate cancer progression after androgen deprivation therapy: mechanisms of castrate resistance and novel therapeutic approaches. Oncogene. 2013;32:5501–5511. doi: 10.1038/onc.2013.206. [DOI] [PMC free article] [PubMed] [Google Scholar]
- 15.Bozza PT, Viola JP. Lipid droplets in inflammation and cancer. Prostaglandins Leukot. Essent. Fatty Acids. 2010;82:243–250. doi: 10.1016/j.plefa.2010.02.005. [DOI] [PubMed] [Google Scholar]
- 16.Mao P, Nakao K, Angrist A. Human prostatic carcinoma: an electron microscope study. Cancer Res. 1966;26:955–973. [PubMed] [Google Scholar]
- 17.Mottillo EP, Bloch AE, Leff T, Granneman JG. Lipolytic products activate peroxisome proliferator-activated receptor (PPAR) α and δ in brown adipocytes to match fatty acid oxidation with supply. J. Biol. Chem. 2012;287:25038–25048. doi: 10.1074/jbc.M112.374041. [DOI] [PMC free article] [PubMed] [Google Scholar]
- 18.Zechner R. FAT FLUX: enzymes, regulators, and pathophysiology of intracellular lipolysis. EMBO Mol. Med. 2015;7:359–362. doi: 10.15252/emmm.201404846. [DOI] [PMC free article] [PubMed] [Google Scholar]
- 19.Lass A, et al. Adipose triglyceride lipase-mediated lipolysis of cellular fat stores is activated by CGI-58 and defective in Chanarin-Dorfman Syndrome. Cell Metab. 2006;3:309–319. doi: 10.1016/j.cmet.2006.03.005. [DOI] [PubMed] [Google Scholar]
- 20.Yamaguchi T, Osumi T. Chanarin–Dorfman syndrome: deficiency in CGI-58, a lipid droplet-bound coactivator of lipase. BBA-Mol. Cell Biol. L. 2009;1791:519–523. doi: 10.1016/j.bbalip.2008.10.012. [DOI] [PubMed] [Google Scholar]
- 21.Lord CC, et al. Regulation of Hepatic Triacylglycerol Metabolism by CGI-58 Does Not Require ATGL Co-activation. Cell Rep. 2016;16:939–949. doi: 10.1016/j.celrep.2016.06.049. [DOI] [PMC free article] [PubMed] [Google Scholar]
- 22.Ou, J. et al. Loss of Abhd5 Promotes Colorectal Tumor Development and Progression by Inducing Aerobic Glycolysis and Epithelial-Mesenchymal Transition. Cell Rep. (2014). [DOI] [PMC free article] [PubMed]
- 23.Miao, H. et al. Macrophage ABHD5 promotes colorectal cancer growth by suppressing spermidine production by SRM. Nat. Commun. 7 (2016). [DOI] [PMC free article] [PubMed]
- 24.Tomlins SA, et al. Integrative molecular concept modeling of prostate cancer progression. Nat. Genet. 2007;39:41–51. doi: 10.1038/ng1935. [DOI] [PubMed] [Google Scholar]
- 25.Tamura K, et al. Molecular features of hormone-refractory prostate cancer cells by genome-wide gene expression profiles. Cancer Res. 2007;67:5117–5125. doi: 10.1158/0008-5472.CAN-06-4040. [DOI] [PubMed] [Google Scholar]
- 26.Thalmann GN, et al. LNCaP progression model of human prostate cancer: Androgen‐independence and osseous metastasis. The Prostate. 2000;44:91–103. doi: 10.1002/1097-0045(20000701)44:2<91::AID-PROS1>3.0.CO;2-L. [DOI] [PubMed] [Google Scholar]
- 27.Thalmann GN, et al. Androgen-independent cancer progression and bone metastasis in the LNCaP model of human prostate cancer. Cancer Res. 1994;54:2577–2581. [PubMed] [Google Scholar]
- 28.Carroll AG, Voeller HJ, Sugars L, Gelmann EP. p53 oncogene mutations in three human prostate cancer cell lines. The Prostate. 1993;23:123–134. doi: 10.1002/pros.2990230206. [DOI] [PubMed] [Google Scholar]
- 29.Meerbrey KL, et al. The pINDUCER lentiviral toolkit for inducible RNA interference in vitro and in vivo. Proc. Natl. Acad. Sci. USA. 2011;108:3665–3670. doi: 10.1073/pnas.1019736108. [DOI] [PMC free article] [PubMed] [Google Scholar]
- 30.Cutruzzolà, F. et al. Glucose metabolism in the progression of prostate cancer. Front. Physiol. 8 (2017). [DOI] [PMC free article] [PubMed]
- 31.Zadra G, Photopoulos C, Loda M. The fat side of prostate cancer. BBA-Mol. Cell Biol. L. 2013;1831:1518–1532. doi: 10.1016/j.bbalip.2013.03.010. [DOI] [PMC free article] [PubMed] [Google Scholar]
- 32.Mitra R, Goodman OB, Le TT. Enhanced detection of metastatic prostate cancer cells in human plasma with lipid bodies staining. BMC Cancer. 2014;14:91. doi: 10.1186/1471-2407-14-91. [DOI] [PMC free article] [PubMed] [Google Scholar]
- 33.Yue S, et al. Cholesteryl Ester Accumulation Induced by PTEN Loss and PI3K/AKT Activation Underlies Human Prostate Cancer Aggressiveness. Cell Metab. 2014;19:393–406. doi: 10.1016/j.cmet.2014.01.019. [DOI] [PMC free article] [PubMed] [Google Scholar]
- 34.Baron A, Migita T, Tang D, Loda M. Fatty acid synthase: a metabolic oncogene in prostate cancer? J. Cell. Biochem. 2004;91:47–53. doi: 10.1002/jcb.10708. [DOI] [PubMed] [Google Scholar]
- 35.Massie CE, et al. The androgen receptor fuels prostate cancer by regulating central metabolism and biosynthesis. EMBO J. 2011;30:2719–2733. doi: 10.1038/emboj.2011.158. [DOI] [PMC free article] [PubMed] [Google Scholar]
- 36.Wang L, et al. Hexokinase 2-Mediated Warburg Effect Is Required for PTEN- and p53-Deficiency-Driven Prostate Cancer Growth. Cell Rep. 2014;8:1461–1474. doi: 10.1016/j.celrep.2014.07.053. [DOI] [PMC free article] [PubMed] [Google Scholar]
- 37.Diedrich JD, et al. Bone marrow adipocytes promote the Warburg phenotype in metastatic prostate tumors via HIF-1α activation. Oncotarget. 2016;7:64854–64877. doi: 10.18632/oncotarget.11712. [DOI] [PMC free article] [PubMed] [Google Scholar]
- 38.Gerhart‐Hines Z, et al. Metabolic control of muscle mitochondrial function and fatty acid oxidation through SIRT1/PGC‐1α. EMBO J. 2007;26:1913–1923. doi: 10.1038/sj.emboj.7601633. [DOI] [PMC free article] [PubMed] [Google Scholar]
- 39.Fischer J, et al. The gene encoding adipose triglyceride lipase (PNPLA2) is mutated in neutral lipid storage disease with myopathy. Nat. Genet. 2007;39:28. doi: 10.1038/ng1951. [DOI] [PubMed] [Google Scholar]
- 40.Schweiger M, Lass A, Zimmermann R, Eichmann TO, Zechner R. Neutral lipid storage disease: genetic disorders caused by mutations in adipose triglyceride lipase/PNPLA2 or CGI-58/ABHD5. Am. J. Physiol. Endocrinol. Metab. 2009;297:E289–E296. doi: 10.1152/ajpendo.00099.2009. [DOI] [PubMed] [Google Scholar]
- 41.Sanders MA, et al. Endogenous and Synthetic ABHD5 Ligands Regulate ABHD5-Perilipin Interactions and Lipolysis in Fat and Muscle. Cell Metab. 2015;22:851–860. doi: 10.1016/j.cmet.2015.08.023. [DOI] [PMC free article] [PubMed] [Google Scholar]
- 42.Brandt RB, Siegel SA, Waters MG, Bloch MH. Spectrophotometric assay for D-(−)-lactate in plasma. Anal. Biochem. 1980;102:39–46. doi: 10.1016/0003-2697(80)90314-0. [DOI] [PubMed] [Google Scholar]
- 43.Wang J, Pantopoulos K. Conditional derepression of ferritin synthesis in cells expressing a constitutive IRP1 mutant. Mol. Cell. Biol. 2002;22:4638–4651. doi: 10.1128/MCB.22.13.4638-4651.2002. [DOI] [PMC free article] [PubMed] [Google Scholar]
Associated Data
This section collects any data citations, data availability statements, or supplementary materials included in this article.
Supplementary Materials
Data Availability Statement
All data generated and analyzed during this study are included in this published article.


