

Summary
Telomeres employ TRF2 to protect chromosome ends from activating the DNA damage sensor MRE11-RAD50-NBS1 (MRN), thereby repressing ATM-dependent DNA damage checkpoint responses. How TRF2 prevents MRN activation at dysfunctional telomeres is unclear. Here, we show that the phosphorylation status of NBS1 determines the repair pathway choice of dysfunctional telomeres. The crystal structure of the TRF2-NBS1 complex at 3.0 Å resolution shows that the NBS1 429YQLSP433 motif interacts specifically with the TRF2TRFH domain. Phosphorylation of NBS1 serine 432 by CDK2 in S/G2 dissociates NBS1 from TRF2, promoting TRF2-Apollo/SNM1B complex formation and the protection of leading-strand telomeres. Classical-NHEJ mediated repair of telomeres lacking TRF2 requires phosphorylated NBS1S432 to activate ATM, while interaction of de-phosphorylated NBS1S432 with TRF2 promotes alternative-NHEJ repair of telomeres lacking POT1-TPP1. Our work advances understanding how the TRF2TRFH domain orchestrates telomere end protection, and reveals how the phosphorylation status of the NBS1S432 dictates repair pathway choice of dysfunctional telomeres.
Introduction
Double-strand breaks (DSBs) are highly genotoxic, and their proper repair is essential for organismal survival and the faithful transmission of genetic information. Failure to correctly repair DSBs can lead to increased genome instability that is potentially cancer promoting. Two major pathways have evolved to repair DSBs in mammals (Lieber, 2010; Symington and Gautier, 2011). The canonical non-homologous end joining (C-NHEJ) is an error-prone pathway during which blunt DNA ends are ligated independently of a template, whereas homology directed repair (HDR) utilizes 3′ single-stranded DNA substrates and homologous sister chromatids as templates for error-free repair. The repair choice of DSBs is cell cycle regulated and occurs at the earliest steps following DNA damage. The primary sensor of DSBs is the highly conserved MRN (MRE11-RAD50-NBS1) complex. The MRE11-Rad50 heterodimer binds to and stabilizes DNA DSBs, while the nuclease activity of MRE11 initiates 5′ to 3′ end resection. NBS1 interacts with CtIP, which together with BRCA1 promotes the initial resection step by MRE11. The generation of very short ssDNAs activates ATM signaling (Chen et al., 2008a; Lee and Paull, 2005; Nimonkar et al., 2011; Wang et al., 2013; Yun and Hiom, 2009). Further resection is mediated by the nucleases ExoI and DNA2 together with the BLM helicase, resulting in 3′ overhangs bound by RPA that is required for the activation of the PIKK ATR (Peterson et al., 2013; Zou and Elledge, 2003). Error free HDR is initiated when RAD51 replaces RPA on the ssDNA, forming nucleofiliments to promote homologous recombination. Resection is therefore a key step for DNA repair path choice: the formation of long ss DNA at the breakpoint favors HDR but prevents C-NHEJ mediated repair. Cell cycle dependent regulation of DSB repair choice is achieved through the phosphorylation of CTIP, NBS1 and EXOI specifically in S/G2 phases by cyclin dependent kinases (CDKs) (Buis et al., 2012; Huertas and Jackson, 2009; Tomimatsu et al., 2014; Yu and Chen, 2004). In addition, 53BP1 and RIF1 prevent the accumulation of the BRCA1-CTIP complex at DSBs in G1, favoring C-NHEJ-mediated repair (Bunting et al., 2010; Escribano-Diaz et al., 2013). Localization of Ku70/80 further protect these DNA ends from end resection, as well as the recruitment of another PIKK family member, DNA-PKcs to DSBs. Ligation of DNA ends by Ligase 4 completes C-NHEJ-mediated repair. In contrast to C-NHEJ and error-free HDR, a highly mutagenic HDR pathway, termed alternative NHEJ (A-NHEJ), occurs independently of Ku70/80, DNA-PKcs and Ligase4 (Decottignies, 2013; Verma and Greenberg, 2016). Instead, it utilizes the MRE11-CTIP resection machinery as well as the low fidelity DNA polymerase theta and poly(ADP-ribose) polymerase 1 (PARP1), to generate microhomologous sequences that are joined by Ligase 3 (Audebert et al., 2004; Ceccaldi et al., 2015; Dinkelmann et al., 2009; Kent et al., 2015; Rai et al., 2010; Rass et al., 2009; Xie et al., 2009).
Telomeres, DNA-protein complexes that cap the ends of all eukaryotic chromosomes, prevent chromosome ends from being recognized as DSBs and the activation of inappropriate DNA damage signaling and repair reactions. Mammalian telomeres are composed of repetitive TTAGGG DNA sequences bound to the shelterin complex, which is composed of six telomere-specific proteins: the TTAGGG repeat binding factors TRF1 and TRF2-RAP1 binds to duplex telomeric DNA and interacts with TIN2. TIN2 interacts with TPP1, which forms a heterodimer with the single-stranded telomere DNA binding protein Protection of Telomere 1 (POT1) (Palm and de Lange, 2008). Shelterin components function to repress distinct DNA damage signaling and repair pathways at telomeres. Telomeres rendered dysfunctional from the removal of TRF2 signals through the MRN complex, which activates ATM to promote C-NHEJ-mediated repair (Attwooll et al., 2009; Deng et al., 2009; Dimitrova and de Lange, 2009). In contrast, removal of POT1-TPP1 activates ATR and telomere repair via A-NHEJ (Denchi and de Lange, 2007; Guo et al., 2007; Rai et al., 2010; Sfeir and de Lange, 2012). How TRF2 and POT1-TPP1 interact with the MRN complex to repress ATM and ATR activation at telomeres, and prevent the engagement of specific DNA repair pathways is not well understood.
In our current study, we demonstrate that the phosphorylation status of NBS1 determines the DNA repair pathway choice of dysfunctional telomeres. The NBS1 429YQLSP433 motif interacts specifically with the TRF2 homology (TRFH) domain. Phosphorylation of NBS1S432 by CDK2 in S/G2 dissociate NBS1 from TRF2, promoting TRF2-Apollo/SNM1B interaction and protection of newly synthesized leading-strand telomeres. De-phosphorylation of NBS1S432 by PP1-α promotes NBS1-TRF2 inteaction. C-NHEJ mediated repair of telomeres lacking TRF2 requires phosphorylated NBS1S432 to activate ATM, while interaction of de-phosphorylated NBS1S432 with TRF2 promotes A-NHEJ mediated repair of telomeres lacking POT1-TPP1. Our work advances the understanding how the TRF2TRFH domain orchestrates TRF2 binding proteins for the repair of dysfunctional telomeres, and shed light on how the phosphorylation status of NBS1S432 dictates telomere repair pathway choice.
Results
The TRF2TRFH domain interacts with both human and mouse NBS1
Using a yeast two-hybrid assay, we found that the N-terminal hTRF2TRFH domain binds specifically to the central fragment of hNBS1 (residues 419–449) denoted as the TRF2-Binding Motif (NBS1TBM) (Figure 1A). To determine the structural basis for this interaction, we solved the crystal structure of this complex at a resolution of 3.0 Å by molecular replacement (Figures 1B–1D; S1A–1D, Table S1). 12 out of 31 residues of the hNBS1 peptide were modeled unambiguously. The overall structure highly resembles previously reported TRF2TRFH-ApolloTBM complex structures (Chen et al., 2008b; Gaullier et al., 2016; Wan et al., 2013). The hTRF2TRFH domain forms a horseshoe-shaped dimer and each monomer adopts an almost identical configuration as apo hTRF2TRFH (PDB: 1H6P) with a root-main-square deviation of 0.86 Å (Fairall et al., 2001). The major noticeable difference is that the flexible loop region between helices α3 and α4 (L34) is significantly reoriented and becomes well-structured to make extensive contacts with hNBS1TBM (Figure 1B, S1D), indicating that hNBS1TBM binding stabilizes an otherwise flexible region of hTRF2 through an induced-fit mechanism. hNBS1TBM binds to hTRF2TRFH in an extended conformation across the concave face of each hTRF2 subunit (Figure 1B). Binding of the hNBS1 peptide to hTRF2 buries ~ 836 Å2 of the total surface area at the intermolecular interface and involves an extensive set of interactions, including both Van der Waals contacts and electrostatic polar interactions (Figure 1C). The most critical interaction interface is the central portion of hNBS1TBM (429YQLSP433), which adopts an identical configuration as its counterpart in the hApollo/hSNM1B exonuclease (Figure 1D and S1B) (Chen et al., 2008b). C-terminal residues 434TKL436 pack against loop L34 of hTRF2 and form three main-chain hydrogen bonds with the 117DCS119 residues on loop L34 of hTRF2 (Figure 1C). Unexpectedly, the N-terminal hNBS1TBM residues 424MRIPN428 display two different conformations in the hTRF2TRFH–hNBS1TBM dimer (S1A). The N-terminal residues in one conformation acquire a pseudo-helical conformation that is similar to that found in the structure of the hTRF2–hApollo complex (S1B). The guanidinium group of Arg425 forms three hydrogen bonds with Arg89 and Gly92 of hTRF2 (S1C). In the second conformation, the N-terminus adopts an extended conformation, making no further contact with hTRF2. In both conformations, the N-terminal residues of hNBS1 (424MRIPN428) contribute the least to binding with hTRF2, explaining why the hNBS1TBM N-terminal conformation is not constrained in this complex. In sharp contrast, the N-terminus of hApollo/hSNM1B forms short helices and packs on loop L23 and helices α2 and α3 of hTRF2TRFH through extensive hydrophobic contacts. This difference in the N-terminal region likely accounts for the weaker affinity of hNBS1 binding to hTRF2 as compared to hApollo/SNM1B (see below) (Chen et al., 2008b).
Figure 1. Structure of the human TRF2TRFH–NBS1TBM complex.
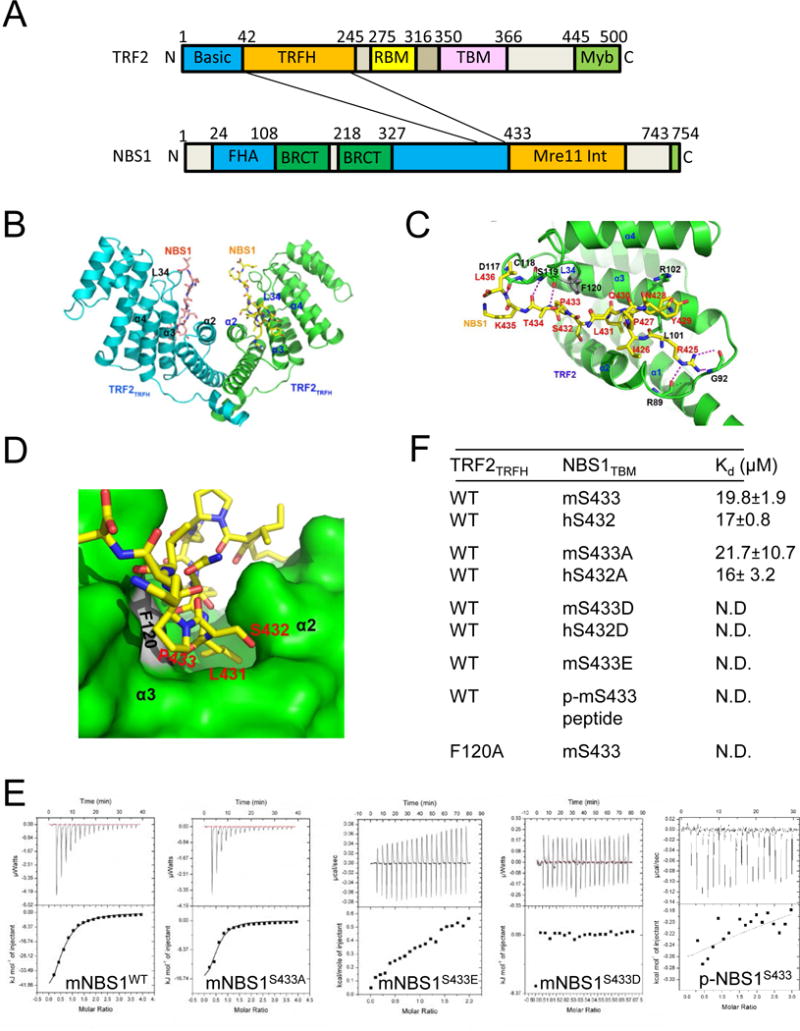
A. The NBS1TBM domain interacts with the TRF2TRFH domain. B. Dimeric TRF2-NBS1 structure is shown as ribbon (TRF2, green/cyan) and stick (NBS1, yellow/magenta) figures. C. TRF2 and NBS1 are colored in green and yellow, respectively. NBS1 residues are shown in stick representation and labeled in red. Secondary structural elements of the TRF2TRFH domain involved in the recognition of NBS1 are labeled black. Hydrogen bonding: dashed magenta lines. D. NBS1L431, S432, P433 are buried within a deep pocket surrounded by hydrophobic residues from α2 and α3 of TRF2 (dark green). TRF2F120 (grey) stacks with NBS1P433 to stabilize this peptide configuration. E. ITC measurement of interactions between TRF2TRFH, WT NBS1 and NBS1S433 mutants. F. ITC binding data of TRF2TRFH with human and mouse WT and NBS1S432/3 mutants (ND, not detectable by ITC). Kd, equilibrium dissociation constant. See also Figures S1, S2 and Table S1.
The central portion of hNBS1TBM (429YQLSP433) harbors the typical TRFH-binding signature motif Y/F/H-X-L-X-P (where X is any amino acid) found in proteins that interact with hTRF2, including hApollo/hSNM1B (Figure 1D, S1C, S2A). hNBS1Y429 fits into a hydrophobic cleft formed by the aliphatic side chain of hTRF2L101 and hTRF2R102, while hNBS1L431 buries into a deep pocket from helices α2 and α3. The pyrrolidine ring of hNBS1P433 stacks with the phenol group of hTRF2F120, stabilizing the refolded TRF2 L34 loop, which is partially disordered in the peptide-free hTRF2TRFH structure (Figure 1D and S1A, S1B). Isothermal titration calorimetry (ITC) revealed that alanine substitutions of any of these mouse or human NBS1 amino acid residues completely disrupted the interaction between NBS1 with TRF2 (S1E).
Interestingly, the hNBS1 432SPTR435 peptide has been shown to be a highly evolutionarily conserved consensus CDK1/2 phosphorylation motif (S/T-P-X-K/R), where X is any amino acid) (Falck et al., 2012; Wohlbold et al., 2012), suggesting that the interaction between TRF2 and NBS1 might be modulated by phosphorylation. To test this hypothesis, NBS1 were mutated at S432 (human) or S433 (mouse) to either alanine (A) or phosphomimetics aspartic acid (D) or glutamic acid (E). TRF2TRFH bound to WT mNBS1 with a Kd of 19.8 μM and to mNBS1S433A with a Kd of 21.7 μM, similar to its binding affinity to WT hNBS1 (17 μM) and to hNBS1S432A (16 μM) (Figures 1E, 1F). In contrast, the binding enthalpy of TRF2TRFH with an in vitro phosphorylated mNBS1S433 peptide (phospho-mNBS1S433), or with h/mNBS1S432/3D and h/mNBS1S432/3E peptides were not measureable, indicating that for both species, phosphorylated NBS1S432/3 and the two NBS1 phosphomimetic mutants cannot bind to TRF2 (Figures 1E, 1F, S1F). Finally, we found that the TRF2TRFH F120A mutant was unable to interact with WT mNBS1, further confirming the importance of this domain in its interaction with NBS1.
TRF2 recruits de-phosphorylated NBS1 to telomeres
To understand mechanistically how NBS1 interacts with TRF2, we reconstituted WT Myc-mTRF2, WT Flag-mNBS1 and Flag-mNBS1S433 mutants in 293T cells. Consistent with our ITC data, co-IP experiments revealed that Flag-mNBS1S433A interacts as robustly with Myc-mTRF2 as did WT Flag-mNBS1. In contrast, both Flag-mNBS1S433D and Flag-mNBS1S433E were unable to interact with Myc-mTRF2 (Figure 2A). Immunofluorescence microscopy (IM) revealed that both WT Flag-mNBS1 and Flag-mNBS1S433A localized to telomeres in Nbs1−/− mouse embryo fibroblasts (MEFs) (Matsuura et al., 2004) (Figures 2B, 2C). In contrast, Flag-mNBS1S433D and Flag-mNBS1S433E failed to accumulate at functional telomeres (Figures 2B, 2C). Treatment of whole-cell extracts with a cocktail of phosphatase inhibitors abolished the interaction between Myc-mTRF2 and WT Flag-mNBS1 (data not shown). Finally, the affinity of WT Flag-mNBS1 for Myc-mTRF2 increased with increasing amounts of the serine/threnonine-protein phosphatase 1-alpha (PP1-α), a protein involved in a diverse array of cellular regulatory functions (Allen et al., 1998; Kim et al., 2003) (Figure 2D). These results reinforce our ITC data that de-phosphorylation of mNBS1S433 is required for mNBS1-mTRF2 interaction.
Figure 2. Analysis of TRF2-NBS1 interaction.
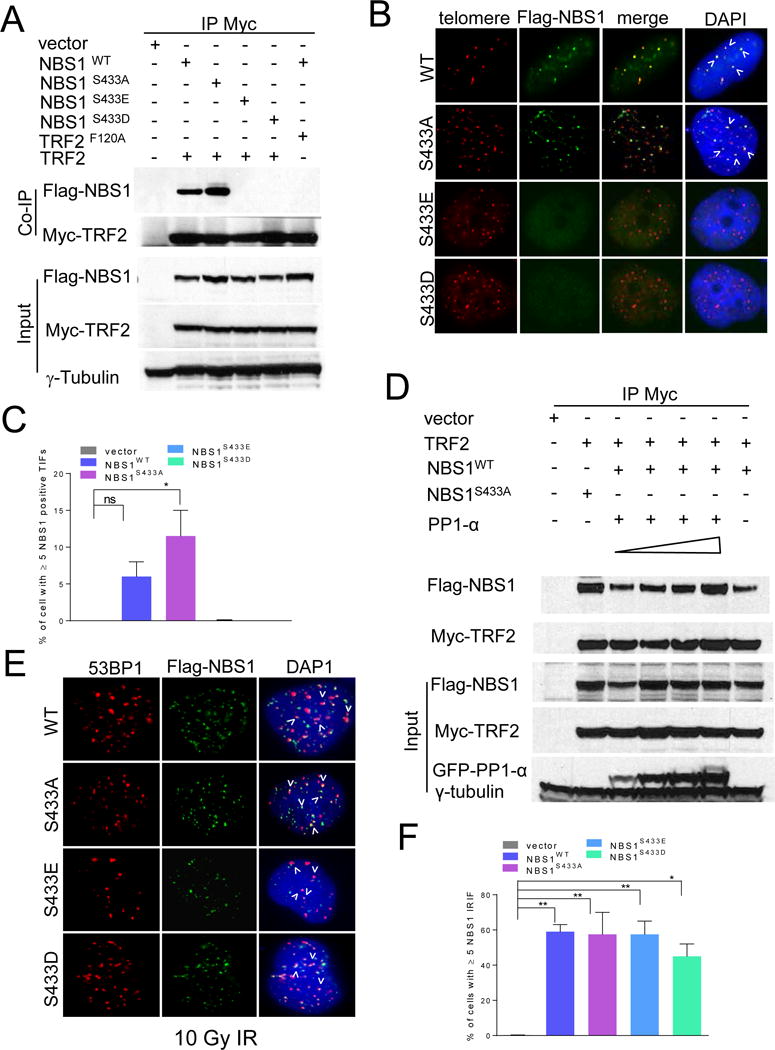
A. 293T cells expressing the indicated proteins were immunoprecipitated with anti-Myc antibody and immunoblotted with anti-Myc and anti-Flag antibodies. Inputs represent 5% of the total cell lysate used for the immunoprecipitations. γ-tubulin: loading control. B. Localization of WT mNBS1 and mNBS1S433 mutants in Nbs1−/− MEFs. Telomeres were visualized with telomere PNA-FISH (red), anti-Flag antibody to visualize mNBS1 (green) and DAPI staining to visualize nuclei (blue). C. Quantification of co-localization of WT mNBS1 and mNBS1S433 mutants on telomeres in (B). Data represents the mean of three independent experiments ± standard error of the mean (SEM). *: p<0.0184, one-way ANOVA. NS, not significant. D. 293T cells expressing the indicated proteins were immunoprecipitated with anti-Myc antibody and immunoblotted with anti-Myc, anti-Flag and anti-GFP antibodies. Increasing concentration of PP1-α (0.125μg to 1.0 μg) were used in the lanes 3–6. Inputs represent 5% of the total cell lysate used for the immunoprecipitations. γ-tubulin: loading control. E. 10Gy IR induced foci with transiently expressed WT mNBS1 and mNBS1S433 mutants in U2OS cells. Cells were stained with anti-53BP1 antibody (red), anti-Flag antibody to visualize NBS1 (green) and DAPI to visualize nuclei (blue). F. Quantification of WT mNBS1 and mNBS1S433 mutant foci in (E). Data represents the mean of three independent experiments ± SEM; n>100 nuclei scored per experiment (*: p<0.02; **: p<0.008; one-way ANOVA). See also Figures S2.
We next asked whether the phosphorylation status of NBS1 influenced MRN complex formation. Endogenous MRE11 co-localizes with telomeres in U2OS cells (S2B). WT mNBS1 and all mNBS1S433 mutants reconstituted in Nbs1−/− MEFs interacted with endogenous mMRE11 (S2C). All mNBS1 mutants were also able to co-localize with mMRE11 and the DNA damage markers γ-H2AX and 53BP1 to form IR-induced DNA damage foci (Figures 2E, 2F, S2D). In addition, localization of both WT NBS1 and mNBS1S433A to dysfunctional telomeres occurred independent of functional ATM (S2E). These results reveal that the phosphorylation status of mNBS1S433 does not impact upon the formation of the MRN complex, nor affect MRN recruitment to IR-induced genomic DNA damage sites.
CDK2 phosphorylation and PP1-α de-phosphorylation mediate interaction between NBS1 and TRF2
hNBS1S432 has been previously shown to be a CDK1/2 phosphorylation site (Falck et al., 2012; Wohlbold et al., 2012). Using an antibody that specifically recognizes phosphorylated hNBS1S432 (Falck et al., 2012), we show that endogenous hNBS1S432 is phosphorylated by CDK2, and that this phosphorylation is reduced upon expression of a dominant negative CDK2 allele (CDK2DN) (Figure 3A). CDK2 also reduced the association between WT Flag-mNBS1 and Myc-mTRF2 both in vitro and on telomeres in 293T cells, while CDK2DN enhanced WT NBS1-TRF2 interaction (Figures 3B–3D). As expected, CDK2 did not appreciably impact upon Flag-mNBS1S433A’s ability to interact with Myc-mTRF2 (Figures 3B–3D). To further confirm that CDK2 is specifically involved in mediating the phosphorylation of mNBS1S433, we utilized CDK2AS cells, in which the endogenous CDK2 allele is replaced with mutant CDK2AS to enable selective inhibition by 1NM-PP1 (Merrick et al., 2011; Wohlbold et al., 2012). Addition of 1NM-PP1 to CDK2AS cells enhanced the association between Myc-mTRF2 and WT Flag-mNBS1 (S3A), suggesting that CDK2 phosphorylation prevents NBS1S432/3-TRF2 interaction.
Figure 3. CDK2 and PP1-α mediate interaction between NBS1 and TRF2.
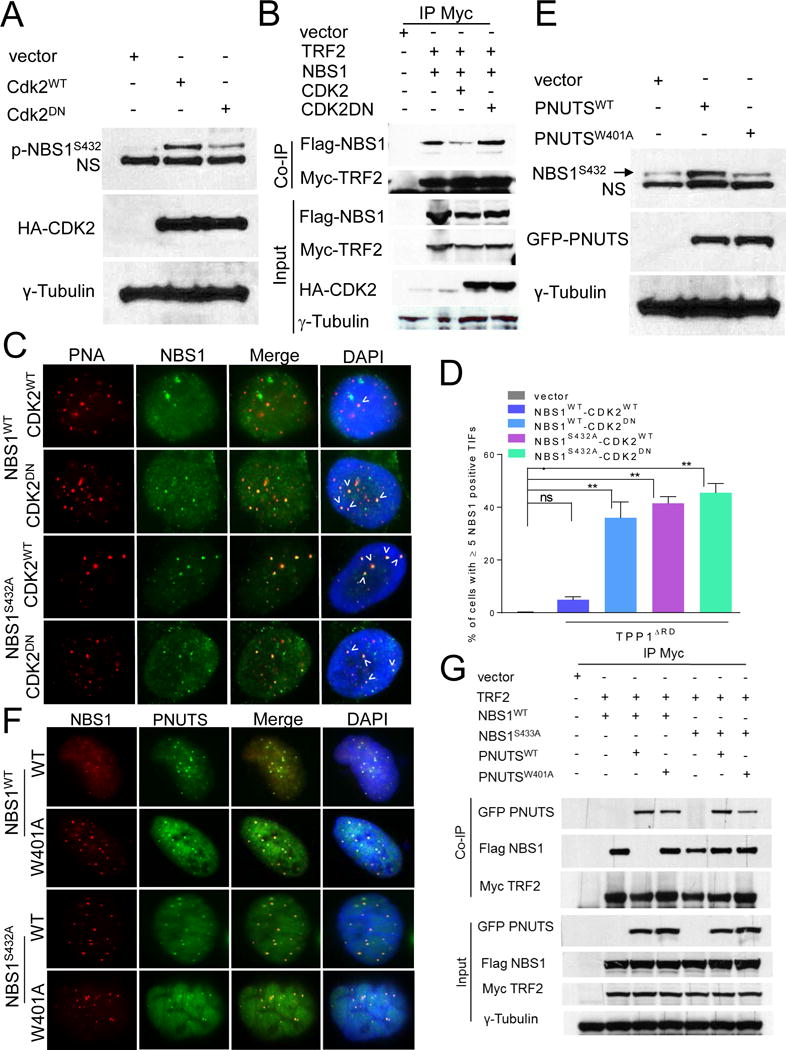
A. 293T cells expressing the indicated DNAs were immunoblotted with anti-phospho-NBS1S432 and anti-HA antibodies. γ-tubulin: loading control. NS: nonspecific band. B. 293T cells expressing the indicated DNAs were immunoprecipated with anti-Myc antibody and probed with anti-Myc, anti-Flag and anti-HA antibodies. Inputs represent 5% of total cell lysates used for IP. γ-tubulin was used as loading control. C. Telomeric localization of WT hNBS1 or hNBS1S432A following telomere uncapping by TPP1ΔRD in the presence of WT CDK2 or mutant CDK2DN in U2OS cells. Telomeres were visualized by PNA-FISH (red), anti-Myc antibody to visualize NBS1 (green), and DAPI (blue). D. Quantification of percentage of cells with ≥ 5 WT NBS1 and NBS1S432A positive TIFs in (C). Data represents the mean of three independent experiments ± SEM; n>150 nuclei scored per experiment. **: p<0.001; one-way ANOVA. NS, non-significant. E. 293T cells expressing WT and mutant GFP-PNUTS DNA were fractionated and immunoblotted with anti-phospho-NBS1S432 antibody. γ-tubulin: loading control. NS: nonspecific band. F. hNBS-ILB1 cells were transiently transfected with WT hNBS1 and hNBS1S432A in the presence of either WT GFP-PNUTS or GFP-PNUTSW401A. Anti-Myc visualized NBS1 (red), GFP visualized PNUTS (green) and DAPI (blue). G. 293T cell transfected with indicated DNAs were immunoprecipated with anti-Myc antibody and immunoblotted with anti-Myc, anti-Flag and anti-GFP antibodies. Inputs represent 5% of total cell lysates. See also Figure S3.
Efficient phosphorylation of CDK2 substrates requires the binding of CDK2-cyclin complexes in a bipartite manner, with CDK2 binding to its phosphorylation site and cyclin binding to an Arg-X-Leu (RXL) motif called Cy, where X is any amino acid (Chen et al., 1996). We identified an evolutionary conserved Cy motif upstream of both hNBS1S432 and mNBS1S433. Mutating it to 395Ala-Lys-Ala397 (mNBS1AKA) enhanced the association between Flag-mNBS1AKA with Myc-mTRF2 and Flag-mNBS1AKA (S3B), while mNBS1AKA displayed no impact on the formation of the MRN complex (S2C). mNBS1AKA also readily localized to sites of IR-induced genomic DNA damage and to dysfunctional telomeres lacking mPOT1-mTPP1 in an ATM-independent manner (S2D, S2E).
The phosphatase PP1-α de-phosphorylates mNBS1S433 to promote interaction between NBS1 and TRF2 (Figure 2D). PP1-α specifically interacts with and is inactivated by the phosphatase-1 nuclear targeting subunit (PNUTS) (Landsverk et al., 2010). Since PNUTS also interacts with TRF2TRFH (Kim et al., 2009), we asked whether PNUTS influences the phosphorylation status of NBS1 at telomeres. Co-expression of WT GFP-PNUTS or the catalytically inactive GFP-PNUTSW401A mutant in 293T cells revealed that WT GFP-PNUTS, but not GFP-PNUTSW401A, increased the phosphorylation of endogenous hNBS1S432 (Figure 3E). Expression of WT GFP-PNUTS reduced the localization of WT Myc-hNBS1 to telomeres in hNBS1-deficient hNBS-ILB1 cells (Kraakman-van der Zwet et al., 1999) and reduced WT Flag-mNBS1-Myc-mTRF2 interaction (Figures 3F, 3G). In addition, neither expression of WT GFP-PNUTS or GFP-PNUTSW401A affected mNBS1S433A’s robust interaction with mTRF2 nor its localization to telomeres (Figures 3F, 3G). Finally, we show that expression of WT GFP-PNUTS, but not GFP-PNUTSW401A, disrupted WT Flag-NBS1-Myc-TRF2 interaction (but not NBS1S432A-Myc-TRF2 interaction) in a concentration dependent manner (S3D). These results suggest that PNUTS does not directly inhibit NBS1-TRF2 interaction, but rather influence this interaction by catalytically inhibiting PP1-α.
Phosphorylation of hNBS1S432 enables Apollo/SNM1B to protect newly replicated telomeres
Previous reports suggest that NBS1 localization to telomeres is cell cycle dependent, and that hNBS1S432 is not phosphorylated in G1, becoming maximally phosphorylated only in mid-S/G2 (Falck et al., 2012; Verdun et al., 2005; Zhu et al., 2000). We examined how the cell cycle impacts TRF2-NBS1 interaction in three ways. First, we employed the Fucci system, which utilizes the fluorescent G1 reporter CDT1 and the S/G2 reporter Geminin (Sakaue-Sawano et al., 2008). We FACS sorted U2OS-Fucci cells expressing Myc-TRF2 and WT Flag-NBS1 or Flag-NBS1S432A and purified G1 and S/G2 cells. Cyclin A expression, which is restricted primarily to S/G2, was used to show that we prepared G1 cells largely free from S/G2 cells. Anti-Myc antibody was used to pull down Myc-TRF2 and associated proteins in whole-cell extracts. Second, we used a double thymidine block to synchronize U2OS cells expressing Myc-TRF2 and WT Flag-NBS1 or Flag-NBS1S432A and harvested every 3 hrs after release to monitor for TRF2-NBS1 interaction. Third, we monitored cell cycle progression by IM. In all cases, NBS1S432 interacts robustly with TRF2 primarily in G1, while this association declined dramatically in S/G2 (Figures 4A, 4B, S4A–S4F). In contrast, NBS1S432A-TRF2 interaction persisted throughout the cell cycle (Figures 4A, 4B, S4A–S4F). Endogenous MRE11 interacts with Myc-TRF2 throughout the cell cycle (Figure 4A). Finally, we show that PP1-α is enriched in G1 (Figure 4A, S4C, S4D). Our data suggest that de-phosphorylation of mNBS1S433 by PP1-α promotes NBS1-TRF2 interaction in G1, while phosphorylation by CDK2 in S/G2 dissociates NBS1S432 from TRF2.
Figure 4. NBS1S432 phosphorylation is cell cycle regulated and required to protect newly replicated telomeres.
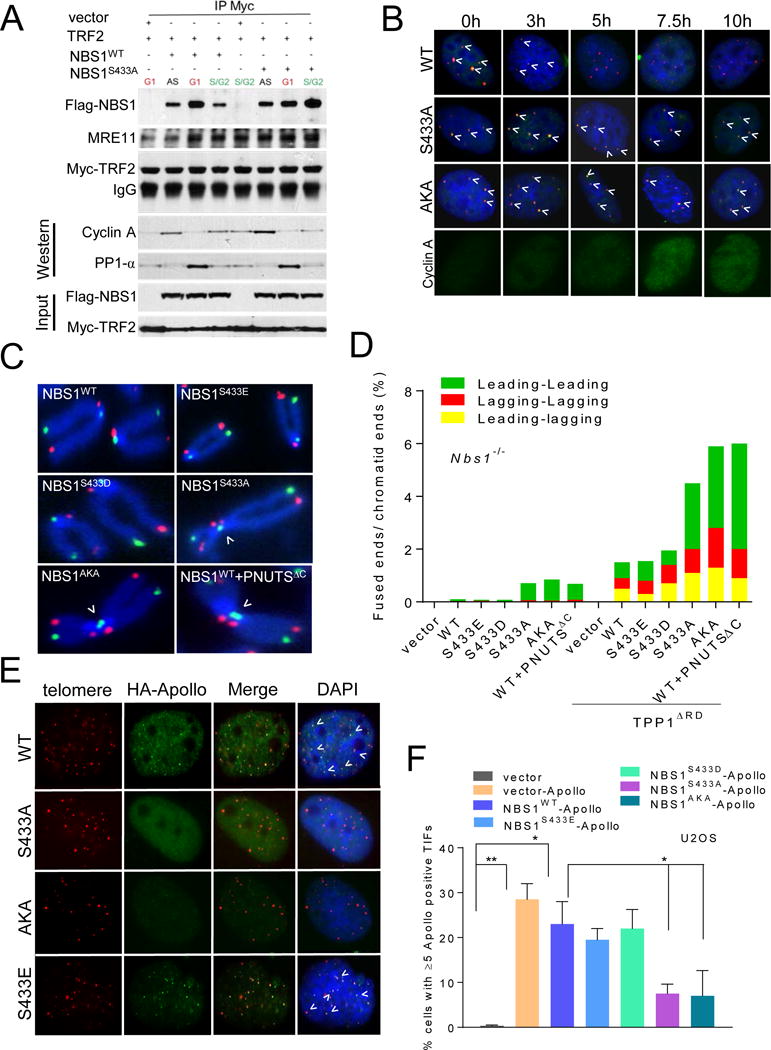
A. Fucci U2OS cells transfected with indicated DNA constructs were FACS sorted to purify G1 and S/G2 cells. Sorted cells were immunoprecipated with anti-Myc antibody and then immunoblotted with anti-Myc and anti-Flag antibodies. Inputs represent 5% of the total cell lysate used for the IP. Cyclin A was used to mark S/G2 phase of the cell cycle. B. U2OS cells synchronized with 2mM thymidine and 1.0 μg/ml aphidicolin were fixed, telomeres visualized by PNA-FISH (red), NBS1 visualized by anti-Flag antibody (green), and DAPI (blue). Anti-cyclin A antibody was used to mark S/G2. C. Metaphases prepared from Nbs1−/− MEFs reconstituted with WT mNBS1, mNBS1S433 mutants or PNUTSΔC were analyzed by CO-FISH. FITC-OO-(TTAGGG)4 (green, leading strand), Tam-OO-(CCCTAA)4 (red, lagging strand) and DAPI for chromosomes (blue). Arrowheads indicate leading-leading chromatid fusions. D. Quantification of chromatid fusions observed in (C). E. Localization of Apollo/SNM1B in U2OS cells expressing WT Flag-mNBS1 or Flag-mNBS1S433 mutants. Telomeres were visualized with PNA-FISH (red), anti-HA antibody to visualize Apollo/SNM1B (green), and DAPI (blue). F. Quantification of Apollo/SNM1B foci in (E). Data represents the mean of three independent experiments ± SEM; n>200 nuclei scored per experiment. *: p<0.01; one-way Anova. See also Figures S3 and S4.
The MRN complex plays a critical role in the protection of newly replicated leading-strand telomere ends (Attwooll et al., 2009; Deng et al., 2009; Dimitrova and de Lange, 2009). To examine how phosphorylation of mNBS1S433 might be involved in this protective process, we examined Nbs1−/− MEFs reconstituted with WT mNBS1, mNBS1S433 mutants and the catalytically inactive PNUTSΔC (Kim et al., 2009) for chromatid fusion events characteristic of post-replicative repair, using telomere chromosome orientation (CO)-FISH (Bailey et al., 2001; Lam et al., 2010). mNBS1S433A, mNBS1AKA and PNUTSΔC, but not WT mNBS1 or mNBS1S433E, induced an ~7-fold increase in leading-leading strand chromatid fusions (Figures 4C, 4D). The lack of lagging-strand chromatid fusions is due to protection of the nascent 3′ overhang by mPOT1a/b-mTPP1, since removal of this complex by mTPP1ΔRD increased lagging-strand chromatid fusions 20-fold (Figure 4D). Notably, the total number of chromatid fusions increased most dramatically in cells expressing de-phosphorylated NBS1S433. The preponderance of leading-leading strand chromatid fusions reminded us of the cytogenetic aberrations observed in Apollo/SNM1B−/− MEFs (Lam et al., 2010). Since Apollo/SNM1B also interacts with TRF2TRFH (Chen et al., 2008b) and is required to protect leading-strand telomeres by initiating 5′ end resections inhibitory to chromatid fusions, we asked whether recruitment of Apollo/SNM1B to telomeres is influenced by NBS1S433 phosphorylation. While HA-Apollo/SNM1B readily localized to telomeres in U2OS cells reconstituted with either WT mNBS1, mNBS1S433D or mNBS1S433E, co-localization of HA-Apollo/SNM1B with telomeres decreased ~3-fold in cells reconstituted with either mNBS1S433A or mNBS1AKA (Figures 4E, 4F). This result suggests that de-phosphorylated NBS1 competes with Apollo/SNM1B for binding to TRF2TRFH. To test this hypothesis, we examined the interactions between Flag-NBS1, HA-Apollo/SNM1B and Myc-TRF2. While increasing concentrations of Flag-NBS1S433A or Flag-NBS1AKA were able to compete Apollo/SNM1B away from Myc-TRF2, increasing concentrations of HA-Apollo/SNM1B was unable to disrupt NBS1-TRF2 interaction (S3E, S3F and data not shown). Our data suggest that TRF2 recruitment of Apollo/SNM1B to leading-strand telomeres first requires CDK2 phosphorylation of NBS1S432 to dissociate it from TRF2.
Phosphorylation of hNBS1S432 activates ATM and C-NHEJ-mediated repair of telomeres lacking TRF2
Deletion of TRF2 in MEFs activates the MRN complex, leading to the phosphorylation of ATM and C-NHEJ-mediated repair of uncapped telomeres in G1 (Attwooll et al., 2009; Celli and de Lange, 2005; Deng et al., 2009; Dimitrova and de Lange, 2009). However, it is not clear how TRF2 interacts with MRN to block ATM activation at telomeres. We reconstituted WT NBS1 and NBS1S432/3 mutants in either hNBS–ILB1 cells or Nbs1−/− MEFs and removed endogenous TRF2 using either a dominant-negative allele of TRF2 (TRF2ΔBΔM) in human cells or with shTrf2 in MEFs (Deng et al., 2009). As expected, removal of TRF2 in hNBS–ILB1 cells did not induce any ATM or CHK2 phosphorylation, 53BP1 TIF formation or chromosome fusions, since activation of ATM by telomeres lacking TRF2 absolutely requires functional MRN (Figures 5A–5E). Surprisingly, expression of mutants hNBS1S432D or hNBS1S432E restored ATM-dependent DNA damage response, promoted robust 53BP1 TIF formation and generated trains of telomere-telomere chromosome fusions similar to cells expressing WT NBS1 (Figures 5A–5E). Further confirmation that phosphorylated NBS1S432/3 mediates ATM signaling and C-NHEJ-mediated fusion of telomeres lacking TRF2 comes from our finding that endogenous phospho-NBS1S432 co-localizes with Myc-MRE11 on dysfunctional telomeres in U2OS cells (S5A). Flag-NBS1S433E is also able to localize to telomeres devoid of TRF2 through interaction with Myc-MRE11 (S5B). Localization of phospho-hNBS1S432 to telomeres is abolished in cells expressing catalytically dead PNUTSW401A, WT PP1-α, and dominant-negative CDK2, all of which promotes de-phosphorylation of hNBS1S432. In accord with these results, cells containing de-phosphorylated hNBS1S432 also do not show any end-to- end fusions when TRF2 is depleted (S5C–S5F).
Figure 5. hNBS1S432 phosphorylation is required for C-NHEJ repair of telomeres without TRF2.

A. Immunoblot for total ATM, phosphorylated ATM, total CHK2 and phosphorylated CHK2 in hNBS-ILB1 cells expressing indicated proteins. γ-tubulin: loading control. B. hNBS–ILB1 cells expressing the indicated DNAs were exposed to TRF2ΔBΔM and telomeres were visualized by PNA-FISH (red), anti-53BP1 antibody (green) and DAPI (blue). Arrowheads point to 53BP1 positive TIFs. C. Quantification of percentage of cells containing ≥ 5 53BP1 positive TIFs in (B). Data represents the mean of two independent experiments ± SEM; n>100 nuclei analyzed per experiment. **: p<0.003, ***: p<0.0007, one-way Anova. NS, non-significant. D. hNBS–ILB1 cells (top) or Nbs1−/− MEFs (bottom) expressing either WT NBS1 or NBS1 serine mutants were infected with either control vector, TRF2ΔBΔM or shTrf2. FITC-OO-(TTAGGG)4 (green, leading strand), Tam-OO-(CCCTAA)4 (red, lagging strand), DAPI (blue) were used to visualize fused chromosomes (arrowheads). E. Quantification of telomere fusion frequencies in (D). Data represents the average of three independent experiments as mean ± SEM from a minimum of 70 metaphases. ***: p<0.0002, ****: p<0.0001; one-way Anova. See also Figure S5.
Finally, our data reveal that reconstitution of mNBS1S433A or mNBS1AKA into Nbs1−/− MEFs was unable to generate any end-to-end chromosome fusions when TRF2 is removed (Figures 5D, 5E). Phosphorylation of mNBS1S433 and C-NHEJ fusions require CDK2, since fusions are completely abolished in Cdk2−/− MEFs and partially restored by the expression of mNBS1S433E, but not mNBS1S433A (S5G, S5H). Importantly, expression of WT PNUTS in addition to mNBS1S433E (but not mNBS1S433A) further increased the number of end-to-end fusions (~38%), approaching those observed in Cdk2+/+ MEFs lacking TRF2 (~50%)(S5G, S5H). Taken together, our data indicate that CDK2-mediated phosphorylation of NBS1S432/3 is essential for downstream ATM signaling and C-NHEJ-mediated repair of telomeres lacking TRF2-RAP1. De-phosphorylation of NBS1S432/3 by PP1-α inhibits fusions, while PNUTS inhibits PP1-α to promote fusions.
De-phosphorylated mNBS1S433 promotes A-NHEJ repair of telomeres lacking mPOT1a/b-mTPP1
mPOT1-mTPP1 has been previously shown to protects telomeres from engaging ATR-dependent HDR (Rai et al., 2010; Sfeir and de Lange, 2012; Wu et al., 2006). The inability of de-phosphorylated hNBS1S432 to activate ATM-dependent signaling at dysfunctional telomeres lacking TRF2-RAP1 prompted us to ask whether de-phosphorylated mNBS1S433 plays any role in ATR signaling. WT Flag-NBS1, Flag-mNBS1S433A and Flag-mNBS1AKA all localized to telomeres devoid of mPOT1-mTPP1 (S6A, S6B). Expressing Flag-mNBS1S433A and PNUTSΔC, but not Flag-mNBS1S433E or WT Flag-mNBS1 in Nbs1−/− MEFs, lead to the generation of telomere double minutes (TDM), telomere sister chromatid exchanges (T-SCEs), end-to-end chromosome fusions and ring chromosomes (S6C–S6E), cytogenetic products characteristic of HDR. To test the hypothesis that de-phosphorylated mNBS1S433 promotes aberrant HDR at telomeres, we removed mPOT1a/b-mTPP1 from telomeres in Nbs1−/− MEFs using mTPP1ΔRD. As expected, CHK1 phosphorylation was minimal in Nbs1−/− MEFs devoid of mPOT1a/b-mTPP1. Reconstitution with WT Flag-mNBS1 or Flag-mNBS1S433A restored CHK1 phosphorylation and chromosomal fusions characteristic of mPOT1a/b-mTPP1 loss (Wu et al., 2006) (Figures 6A–6C). These chromosomal fusions were not prominent in Nbs1−/− MEFs reconstituted with either Flag-mNBS1S433E, Flag-mNBS1S433D or in Nbs1+/+ MEFs expressing WT PNUTS (Figures 6B, 6C). We also observed increased T-SCEs in Nbs1−/− MEFs expressing mTPP1ΔRD and WT PNUTS (S6F). These results suggest that de-phosphorylated mNBS1S433 is required to activate ATR-dependent damage signaling at telomeres without mTPP1-mPOT1a/b.
Figure 6. NBS1S432 de-phosphorylation promotes A-NHEJ repair.
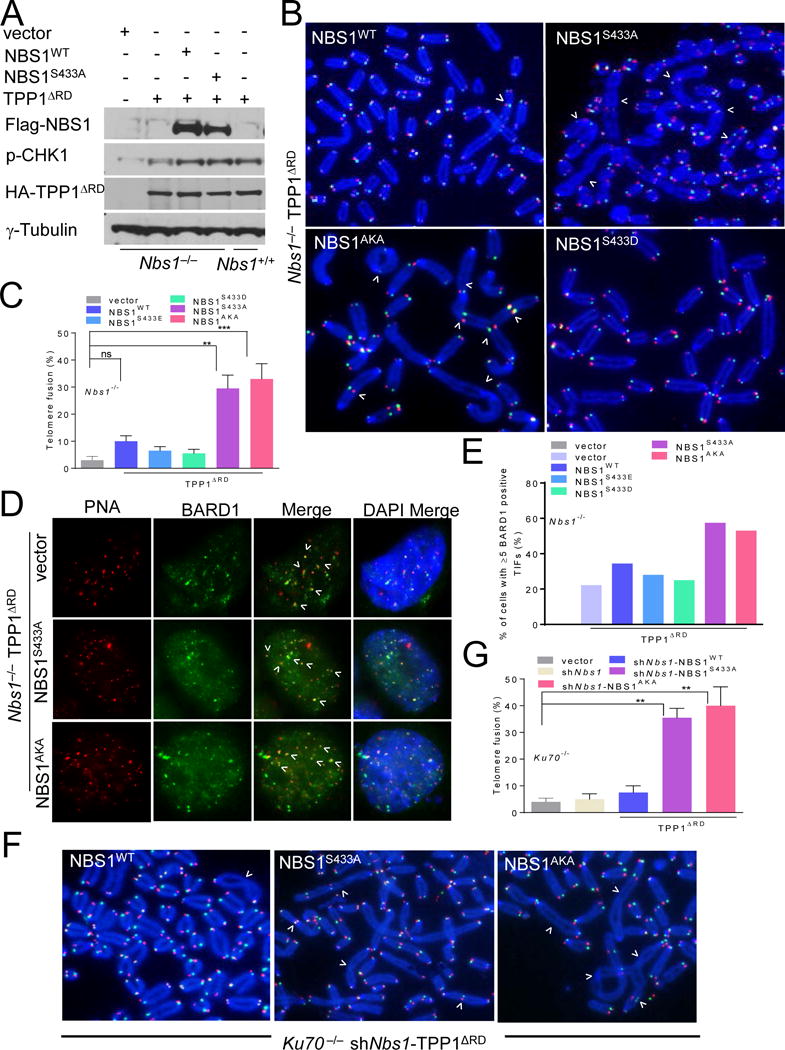
A. Immunoblots of Nbs1−/− MEFs expressing the indicated DNAs were performed with antibodies against phospho-CHK1, Flag and HA. γ-tubulin: loading control. B. Nbs1−/− MEFs reconstituted with WT mNBS1 or mNBS1S433 mutants were treated with vector or TPP1ΔRD. FITC-OO-(TTAGGG)4 (green, leading strand), Tam-OO-(CCCTAA)4 (red, lagging strand) and DAPI (blue) were used to visualize fused chromosomes (arrowheads). C. Quantification of telomere fusion frequencies in Nbs1−/− MEFs. Data represents the average of three independent experiments as mean ± SEM from 30 metaphases analyzed per experiment. **: p<0.001, ***: p<0.0006, one-way Anova. NS, non-significant. D. Nbs1−/− MEFs expressing indicated DNAs were treated with TPP1ΔRD. Telomeres were visualized by PNA-FISH (red), anti-BARD1 antibody (green) and DAPI (blue). E. Quantification of percent of cells containing ≥ 5 BARD1 positive TIFs in (D). F. Ku70−/− MEFs reconstituted with WT mNBS1 or mNBS1S433 mutants were treated with vector or TPP1ΔRD. FITC-OO-(TTAGGG)4 (green, leading strand), Tam-OO-(CCCTAA)4 (red, lagging strand) and DAPI (blue) were used to visualize fused chromosomes (arrowheads). G. Quantification of telomere fusion frequencies in Ku70−/− MEFs. Data represents the mean of two independent experiments ± SEM, a minimum of 45 metaphases were scored per experiment. **: p<0.002, one-way Anova. See also Figure S6.
The mPOT1a/b-mTPP1 heterodimer potently represses A-NHEJ-mediated repair at telomeres (Rai et al., 2010; Sfeir and de Lange, 2012). Initiation of the A-NHEJ repair requires end resection to generate single-stranded 3′ overhangs. We observed an ~1.7-fold increase in the amount ss telomeric DNA by TRF Southern in Nbs1−/− MEFs reconstituted with either Flag-mNBS1S433A or Flag-mNBS1AKA, but not Flag-mNBS1S433D or Flag-mNBS1S433E (S6G). Similarly, IM experiments revealed a 2-fold increase in the localization of the ss DNA binding proteins BARD1 and RPA to telomeres in Nbs1−/− MEFs expressing de-phosphorylated NBS1 mutants (Figures 6D, 6E, S6H). A-NHEJ joining of dysfunctional telomeres is mediated by Ligase 3, PARP1 and repressed by the Ku70/80 heterodimer (Rai et al., 2010; Sfeir and de Lange, 2012). After removing mPOT1a/b-mTPP1, we found that Nbs1 depleted Ku70−/− MEFs reconstituted with mNBS1S433A or mNBS1AKA displayed a 4-fold increase in the number of chromosome fusions observed over cells expressing WT mNBS1 (Figures 6F, 6G). In contrast, depletion of PARP1 and Ligase 3 significantly reduced the number of chromosome fusions in Nbs1−/− MEFs expressing mNBS1S433A, further supporting the notion that these fusions are due to A-NHEJ mediated repair (S6I).
De-phosphorylated mNBS1S433 recruits EXOI to telomeres to promote genomic instability
The initial 5′–3′ resection of double-stranded DNA to generate 3′ ss DNA involves the MRN complex, CTIP, and EXO1. In Apollo/SNM1B null cells reconstituted with mNBS1S433A or mNBS1AKA, formation of end-to-end chromosomal fusions requires EXO1 and ATR, but not CTIP (Figure 7A, S7A). Both WT Myc-hNBS1 and Myc-hNBS1S432A directly interacts with Flag-hEXO1, while interaction with Myc-hNBS1S432E occurs to a lesser extent (Figure 7B). While both WT GFP-EXO1 and the catalytically inactive GFP-EXO14A mutant by themselves were unable to localize to telomeres in U2OS cells, co-expression with WT Myc-hNBS1 or Myc-hNBS1S432A, but not with Myc-hNBS1S432E, recruited WT GFP-EXOI to telomeres (Figure 7C, S7B, S7C). Strikingly, the expression of de-phosphorylated mNBS1S433 in WT MEFs, coupled with the presence of dysfunctional telomeres lacking either mPOT1a/b-mTPP1 or Apollo/SNM1B, elicited genome instability, manifested as trains of interstitial telomeres in ~40% of metaphases examined (~1–3 aberrations per metaphase) (Figure 7D, S7D, S7E). CO-FISH revealed that they consist of either telomere-telomere or telomere-DSB fusions that could occur through dysfunctional telomere-induced breakage-fusion bridge (BFB) cycles. Compared to Nbs1−/− MEFs expressing WT Flag-mNBS1, we found significantly increased numbers of chromatin bridges containing telomeric DNA (indicative of rampant BFB cycles) in cells expressing Flag-mNBS1S433A or Flag-mNBS1AKA (S7F, S7G). Our results suggest that the inability to dissociate NBS1 from telomeres promotes genome instability.
Figure 7. hNBS1S432A recruits EXOI to telomeres to promote genome instability.
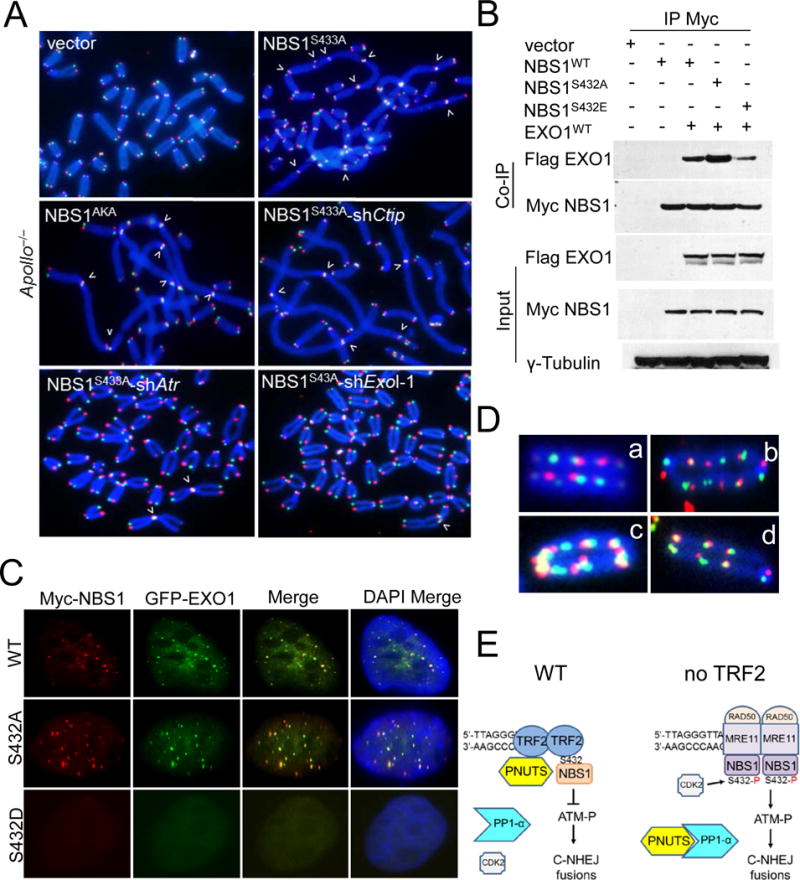
A. shAtr, shExoI or shCtip mediated depletion of Apollo/SNM1B−/− MEFs were reconstituted with either WT mNBS1 or mNBS1S433 mutants. FITC-OO-(TTAGGG)4 (green, leading strand), Tam-OO-(CCCTAA)4 (red, lagging strand) and DAPI (blue) were used to visualize fused chromosomes (arrowheads). B. 293T cells expressing the indicated DNAs were immunoprecipated with anti-Myc beads and immunoblotted with anti-Myc and anti-Flag antibodies. Inputs represent 5% of the total cell lysate used for the immunoprecipitations. γ-tubulin: loading control. C. U2OS cells expressing GFP-hEXOI were reconstituted with either WT hNBS1 or hNBS1S432 mutants and stained to visualize Myc-NBS1 (red), GFP-EXOI (green) and DAPI (blue). D. Telomere-telomere and telomere-DSB fusions were abundant in Apollo/SNM1B−/− (a, b) and WT MEFs treated with TPP1ΔRD (c, d) expressing mNBS1S433A. E. Schematic depicting how phosphorylated NBS1S432 promotes C-NHEJ mediated repair of telomeres lacking TRF2. See text for details.
Discussion
The MRN complex plays important roles in telomere homeostasis. MRE11 and RAD50 are present on telomeres throughout the cell cycle, while NBS1 localizes to telomeres during S-phase (Zhu et al., 2000). Immediately following DNA replication, telomeres created by leading-strand DNA synthesis are initially blunt-ended (Lam et al., 2010). Nucleolytic processing of the blunt leading-strand by the 5′–3′ nuclease activities of MRE11, together with Apollo/SNM1B, is required for the generation of the 3′ ss overhang necessary to prevent engagement of the NHEJ repair pathway and promote t-loop formation after replication (Lam et al., 2010; Wu et al., 2010). These results suggest that the MRN complex plays an essential role in telomere end protection. However, since MRN is the only sensor for dysfunctional telomeres devoid of TRF2-RAP1, it also plays an undesirable role in promoting ATM-dependent C-NHEJ mediated repair of dysfunctional telomeres lacking TRF2-RAP1. How telomeres channel MRN to promote telomere end protection but prevent ATM damage signaling and C-NHEJ mediated fusions is therefore an important question.
The phosphorylation status of NBS1S432 dictates telomere repair choice
In this study, we show that the interaction between TRF2 and NBS1 is modulated by NBS1’s phosphorylation status. CDK2 mediated phosphorylation of NBS1S432 (NBS1S433 in the mouse) dissociates NBS1 from TRF2 in S/G2, while de-phosphorylation of NBS1S432 by PP1-α promotes NBS1-TRF2 interaction in G1. When it is not bound to TRF2, PNUTS also actively participates in this process by inhibiting the phosphatase PP1-α. We found that phosphorylated NBS1S432 is required to initiate ATM damage signaling and C-NHEJ-mediated repair of telomeres devoid of TRF2-RAP1 (Figure 7E). In contrast, it is de-phosphorylated NBS1S432 that promotes ATR signaling and A-NHEJ-mediated repair of telomeres devoid of POT1-TPP1. While phosphorylated NBS1S432 cannot bind to TRF2, it is able to localizes to dysfunctional telomeres by interacting with MRE11 lacking TRF2. In S/G2, CDK2-mediated phosphorylation inhibits PP1-α activity (Liu et al., 1999) and promotes dissociation of phospho-NBS1S432 from TRF2, enabling TRF2 to recruit Apollo-SNM1B to telomeres to protect leading-strand telomeric ends from NHEJ repair. ATM-mediated phosphorylation of NBS1S343, which is important in response to DNA damage (Lim et al., 2000; Wu et al., 2000; Zhao et al., 2000), appears dispensible for de-phospho-NBS1S432-TRF2 interaction (S4E).
Telomeres devoid of TRF2-RAP1 undergo C-NHEJ -mediated repair primarily in G1 and is repressed in G2 by CDK2 (Konishi and de Lange, 2008). We confirm previous results suggesting that in G1, CDK2 level is low while PP1-α level is high (Aleem et al., 2005; Bashir and Pagano, 2005; Berndt et al., 1997; Dohadwala et al., 1994; Kwon et al., 1997; Liu et al., 1999; Wohlbold and Fisher, 2009). This maintains NBS1S432 in a de-phosphorylated state, favoring NBS1-TRF2 interaction and protection of telomeres from engaging in ATM-dependent C-NHEJ-mediated repair. When TRF2-RAP1 is removed from telomeres in G1, PNUTS is no longer sequestered by TRF2 and is now able to inhibit PP1-α. Since CDK2 is recruited to DSBs by binding to MRE11 (Buis et al., 2012), we postulate that MRE11’s recruitment of CDK2 to dysfunctional telomeres also facilitates NBS1S432 phosphorylation. We also identified a new function for de-phosphorylated NBS1S432 as a recruiter of EXO1 to telomeres lacking POT1-TPP1 to extend 5′ resection, generating ss telomeric DNA that is amenable for A-NHEJ-mediated chromosome fusions. It is likely that the presence of NBS1S432A at telomeres obviates the need for CTIP, since the 5′–3′ nuclease activity of MRE11 is able to initiate 5′ resection of the telomeric C-strand (Deng et al., 2009). Our data reveal that phosphorylation of NBS1S432 functions as a switch to dictate dysfunctional telomere repair pathway choice.
Regulation of TRF2TRFH binding through phosphorylation
We have previously shown that the TRFH domains of TRF1 and TRF2 function as a docking platform for various telomeric and telomere-associated proteins (Chen et al., 2008b). TRFH domains recognize a conserved TRFH binding motif in a manner reminiscent of other known protein interaction modules (Chen et al., 2008b; Kim et al., 2009; Wan et al., 2013). How TRF1 and TRF2 coordinate their interactions with these different TBM containing proteins have remained elusive. Our data reveal that proteins that contain TBM sequences, including NBS1, Apollo/SNM1B and PNUTS, all bind to the same molecular recognition surface of the TRF2TRFH domain in a manner that could be mutually exclusive. For example, de-phosphorylated NBS1S432 is able to out compete Apollo/SNM1B for binding to TRF2 both in vitro and in vivo, suggesting that CDK2-mediated phosphorylation of NBS1S432 during S-phase is required to remove NBS1 to promote Apollo/SNM1B-TRF2 interaction. The finding that the interaction between TRF2 and NBS1 is modulated by a cycle of phosphorylation/de-phosphorylation reactions suggests that the phosphorylation status of other TRF2 binding proteins might also determine interaction with TRF2. Primary sequence alignment of TBMs from several other TRF2-interacting proteins reveals that they contain potential non CDK (L-S/T-P) and CDK (L-S/T-P-X-K/R) phosphorylation sites in the core of the TBM sequence (S2A). Examination of this interface reveals that the TBM domain fits snugly on a deep hydrophobic cleft surrounded by negatively charged residues of TRFH (Figure 1D). Thus, phosphorylated TBMs cannot fit into this TRFH pocket. This situation is reminiscent of phosphorylation-dependent regulation of proline-rich peptide binding to SH3 domains (Comer et al., 1998). Either cell-cycle-dependent or DDR-dependent phosphorylation could modulate the interaction between TRF2 and its interaction partners. Because each TRF2 homodimer contains two TRFH domains, we speculate that two different TBM containing proteins (for example NBS1 and PNUTS) could interact with the same TRF2 homodimer, allowing TRF2 to function not only as a binding platform to both proteins, but also as an orchestrator of diverse telomeric functions in a highly regulated manner. On the other hand, two TBMs from the same protein/complex could cooperatively interact with the same TRF2 homodimer, thus enhancing the binding affinity between TBM-containing proteins and TRF2. In the case of NBS1, NBS1 exists as a dimer in the MRN complex, and binding with two copies of NBS1 by dimerized TRF2 is greatly preferred. Thus, the native MRN complex very likely associate with TRF2 with much higher affinity than that of NBS1TBM-TRF2TRFH characterized here (~10μM).
The TRF2TRFH domain represses ATM signaling
The TRF2TRFH domain has been shown to repress the initial step of ATM activation (Okamoto et al., 2013), but the mechanism of this repression is unclear. Our data suggests that this initial step is linked to the inability of de-phosphorylated NBS1S432 to activate ATM signaling. In addition, binding of NBS1 to the TRF2TRFH domain likely also serve to sequester the MRN complex away from telomere ends, preventing the activation of aberrant repair (fusions) in G1. Phosphorylated NBS1S432 dissociates from TRF2 but binds to MRE11 at telomeric ends and enables ATM activation and C-NHEJ-mediated repair of telomeres lacking TRF2-RAP1. Finally, in addition to being a protein docking hub, a recent report suggests that TRF2 could also wrap telomeric DNA around its TRF2TRFH domain to repress ATM-signaling and C-NHEJ at telomeres (Benarroch-Popivker et al., 2016). While it is not yet known whether the NBS1-TRF2 interaction is enhanced by topological changes due to TRFH loop formation, what is apparent is that multiple redundant pathways have evolved to keep ATM activation and the threat of aberrant C-NHEJ mediated chromosome fusions in check to maintain genome stability.
STAR Methods
CONTACT FOR REAGENT AND RESOURCE SHARING
Further information and requests for resources and reagents should be directed to and will be fulfilled by the co-corresponding author Sandy Chang (s.chang@yale.edu).
EXPERIMENTAL MODEL AND SUBJECT DETAILS
Peptides for structure determination
Human TRF2TRFH (residues 42-245)(McCoy et al., 2007) was expressed and purified as previously described (Chen et al., 2008b). WT NBS1 and mutant peptides (423–438) were synthesized by Convenience Biology.
Cell lines
Human NBS-ILB1 cells, Nbs1−/− and Apollo/Snm1B−/− MEFs were cultured in DMEM supplemented with 10% FBS and maintained in 5% CO2 at 37°C. HCT116 cells bearing WT CDK2 or the CDK2AS mutation were cultured in Macoy’s medium.
METHOD DETAIL
Protein crystallization, data collection and structure determination
TRF2TRFH and NBS1TBM were mixed at a molar ratio of 1:2 prior to crystallization. The complex was crystallized in the buffer with 0.1M MES, pH6.5, 20% PEG8000, 2mM DTT at 293K. The crystals were harvested in the same buffer with 20% glycerol. The 3.0 Å dataset was collected at the Advanced Photon Source (APS) beamlines 21-ID-D, and was processed by program HKL2000 (Otwinowski and Minor, 1997). The crystal belongs to P21212 space group. The structure of TRF2TRFH-NBS1TBM was solved by molecular replacement with Phaser (McCoy et al., 2007) using TRF2TRFH (PDB ID: 1H6P) structure as the searching model. Crystallography refinement was performed with Phenix (Adams et al., 2002) together with manual model building in Coot (Emsley and Cowtan, 2004).
Isothermal titration calorimetry
The equilibrium dissociation constants of the WT and mutant TRF2TRFH-NBS1TBM interactions were determined using an iTC200 calorimeter (MicroCal). The enthalpies of binding between the TRF2TRFH domain and the NBS1TBM were measured at 20°C in 25 mM Tris-HCl (pH8.0) and 150 mM NaCl. ITC data were subsequently analyzed and fitted using Origin 7 software (OriginLab) with blank injections of peptides into buffer subtracted from the experimental titrations prior to data analysis.
Western analysis
For immunoblotting, trypsinized cells were lysed in urea lysis buffer (8M urea, 50mM Tris-HCL pH 7.4 and 150mM β-mercaptoethanol). The lysate was resolved on SDS-PAGE gel and separated proteins were then blotted on a PVDF membrane (Amersham), blocked with blocking solution (5% non-fat dry milk in PBS/0.1% Tween 20) for 1 h and incubated with the appropriate primary antibody in blocking solution for 2 h at room temperature or overnight at 4°C. The membranes were washed 3× 5 min with PBS/0.1% Tween 20 and incubated with appropriate secondary antibody in blocking solution for 1 h at room temperature. Chemiluminescence detection was performed using an ECL Western Blotting Detection kit from GE Healthcare.
Cell Cycle Analysis
Exponentially growing U2OS cells subjected to 2 mM thymidine containing medium for 14 h followed by PBS wash (three times) and release into fresh medium for 11 h. Cells were arrested second time in 1μg/ml aphidicolin or thymidine for 14 h and then washed in PBS thrice before release into fresh medium for 0–15 h with the exception of the 0-hour time point, which correspond to blocked cells before release. The Fucci system was used to purify cycling G1 and S/G2 cells, based on fluorescent proteins with fragments of CDT1 and Geminin, for the G1 and S/G2 reporters, respectively (Sakaue-Sawano et al., 2008). U2OS-Fucci transfected cells were subjected to fluorescence-activated cell sorting (FACS) to purify G1 and S/G2 cells for immunoprecipitation or fixed to perform immunofluorescence for protein staining in G1 and S/G2 cells.
Telomere Length analysis and G-Strand Overhang Assays
For in-gel detection of telomere length and G-stand overhang, a total of 1–2 × 10⁶ cells were suspended in PBS, mixed 1:1 with 1.8% agarose in 1XPBS and cast into plugs. The plugs were then digested overnight at 50°C with 20mg/ml Proteinase K (Roche) in 10 mM Sodium phosphate (pH 7.2) and 0.5 mM EDTA and 1% sodium lauryl sarcosine. DNA in plugs were subsequently digested by Hinf1/Rsa1 overnight at 37°C. The next morning, plugs were washed once with 0.1 × TE and equilibrated with 0.5× TBE. The plugs were loaded onto a 0.8% agarose gel in 0.5x TBE and run on a CHEF-DRII pulse field electrophoresis apparatus (BioRad). The electrophoresis parameters were as follows: The electrophoresis parameters were as follows: Initial pulse: 0.3 s, final pulse: 16 s, voltage: 6 V cm 1, run time: 14 h. Dried gel pre-hybridized with Church mix for 2 h at 55 C and hybridized overnight at 55 C in Church mix with 32P-labelled T2AG3 oligonucleotides. After hybridization, the gel was washed three times for 30 min with 4 SSC/0.1% SDS at 37 C, thrice with 4 SSC/0.1% SDS at 55C and exposed to a phosphoimager screen overnight. After exposure, the screen was scanned on a STORM phosphoimager (Molecular Dynamics) and the gel was subsequently denatured and hybridized using the same probe.
Retroviral infections
For retroviral infection, DNA constructs were transfected into 293T cells using Fugene 6 and packaged into viral particles. Viral supernatant was collected 48–72 h after transfection, filtered and directly used to infect immortalized MEFs.
Immunoprecipitation
293T cells grown in 10 cm plates were co-transfected with Myc- TRF2, Flag-NBS1 and vector controls. 48 h after transfection, cells were harvested and lysed in buffer (20 mM HEPES, pH 7.5, 10% glycerol, 1mM EDTA, 0.5% (v/v) NP-40). Supernatants were immunoprecipitated with anti-Myc antibody conjugated agarose beads (Sigma). Beads were washed and eluted proteins analyzed by SDS-PAGE.
Immunofluorescence and fluorescent in situ hybridization
Cells grown on coverslips were fixed for 10 min in 2% (w/v) sucrose and 2% (v/v) paraformaldehyde at room temperature followed by PBS washes. Coverslips were blocked in 0.2% (w/v) fish gelatin and 0.5% (w/v) BSA in PBS. Cells were incubated with primary antibodies and after PBS washes, cells were incubated with appropriate Alexa fluor secondary antibodies followed by washes in PBS + 0.1% Triton. IF-FISH was carried out using a 5′-Tam-OO-(CCCTAA)4-3′ PNA telomere probe (PANAgene). DNA was stained with DAPI, and digital images captured using Metamorph (Molecular Devices) with a Nikon Eclipse 800 microscope and an Andore CCD camera.
Chromosome analysis by telomere PNA-FISH and CO-FISH
Cells were treated with 0.5 μg/ml of Colcemid before harvest. Chromosomes were fixed and telomere PNA-FISH performed with a 5′-Tam-OO-(CCCTAA)4-3′ probe (PANAgene) as described (Rai et al., 2016; Wu et al., 2006). For CO-FISH, metaphase spreads were incubated sequentially with 5′-Tam-OO-(CCCTAA)4-3′ and 5′-FITC-CO-(TTAGGG)4-3′ probes. Images were captured as above. The percent of chromosome fusions observed is defined as: total number of chromosome fusions in 30–50 metaphase spreads analyzed divided by the total number of chromosomes examined X 100%.
QUANTIFICATION AND STATISTICAL ANALYSIS
IC50 values were determined by nonlinear least-squares analysis of the competition curves. ITC data were analyzed and fitted using Origin 7 software (OriginLab) with blank injections of peptides into buffer subtracted from the experimental titrations prior to data analysis. Quantification of co-localization of NBS1 on telomeres was performed using Prism 6 (Graphpad Software, San Diego, CA). Data represents the mean ± standard error of the mean (SEM) or as individual data points, as stated in the figure legends. P values were determined by one-way ANOVA. The percent of chromosome fusions observed is defined as: total number of chromosome fusions in 30–50 metaphase spreads analyzed divided by the total number of chromosomes examined X 100%.
KEY RESOURCES TABLE
The table highlights the genetically modified organisms and strains, cell lines, reagents, software, and source data essential to reproduce results presented in the manuscript. Depending on the nature of the study, this may include standard laboratory materials (i.e., food chow for metabolism studies), but the Table is not meant to be comprehensive list of all materials and resources used (e.g., essential chemicals such as SDS, sucrose, or standard culture media don’t need to be listed in the Table). Items in the Table must also be reported in the Method Details section within the context of their use. The number of primers and RNA sequences that may be listed in the Table is restricted to no more than ten each. If there are more than ten primers or RNA sequences to report, please provide this information as a supplementary document and reference this file (e.g., See Table S1 for XX) in the Key Resources Table.
Please note that ALL references cited in the Key Resources Table must be included in the References list. Please report the information as follows:
REAGENT or RESOURCE: Provide full descriptive name of the item so that it can be identified and linked with its description in the manuscript (e.g., provide version number for software, host source for antibody, strain name). In the Experimental Models section, please include all models used in the paper and describe each line/strain as: model organism: name used for strain/line in paper: genotype. (i.e., Mouse: OXTRfl/fl: B6.129(SJL)-Oxtrtm1.1Wsy/J). In the Biological Samples section, please list all samples obtained from commercial sources or biological repositories. Please note that software mentioned in the Methods Details or Data and Software Availability section needs to be also included in the table. See the sample Table at the end of this document for examples of how to report reagents.
SOURCE: Report the company, manufacturer, or individual that provided the item or where the item can obtained (e.g., stock center or repository). For materials distributed by Addgene, please cite the article describing the plasmid and include “Addgene” as part of the identifier. If an item is from another lab, please include the name of the principal investigator and a citation if it has been previously published. If the material is being reported for the first time in the current paper, please indicate as “this paper.” For software, please provide the company name if it is commercially available or cite the paper in which it has been initially described.
- IDENTIFIER: Include catalog numbers (entered in the column as “Cat#” followed by the number, e.g., Cat#3879S). Where available, please include unique entities such as RRIDs, Model Organism Database numbers, accession numbers, and PDB or CAS IDs. For antibodies, if applicable and available, please also include the lot number or clone identity. For software or data resources, please include the URL where the resource can be downloaded. Please ensure accuracy of the identifiers, as they are essential for generation of hyperlinks to external sources when available. Please see the Elsevier list of Data Repositories with automated bidirectional linking for details. When listing more than one identifier for the same item, use semicolons to separate them (e.g. Cat#3879S; RRID: AB_2255011). If an identifier is not available, please enter “N/A” in the column.
-
◦A NOTE ABOUT RRIDs: We highly recommend using RRIDs as the identifier (in particular for antibodies and organisms, but also for software tools and databases). For more details on how to obtain or generate an RRID for existing or newly generated resources, please visit the RII or search for RRIDs.
-
◦
Please see the sample Table at the end of this document for examples of how reagents should be cited. To see how the typeset table will appear in the PDF and online, please refer to any of the research articles published in Cell in the August 25, 2016 issue and beyond.
Please use the empty table that follows to organize the information in the sections defined by the subheading, skipping sections not relevant to your study. Please do not add subheadings. To add a row, place the cursor at the end of the row above where you would like to add the row, just outside the right border of the table. Then press the ENTER key to add the row. You do not need to delete empty rows. Each entry must be on a separate row; do not list multiple items in a single table cell.
TABLE FOR AUTHOR TO COMPLETE
Please upload the completed table as a separate document. Please do not add subheadings to the Key Resources Table. If you wish to make an entry that does not fall into one of the subheadings below, please contact your handling editor.
KEY RESOURCES TABLE
| REAGENT or RESOURCE | SOURCE | IDENTIFIER |
|---|---|---|
| Antibodies | ||
| phospho-CHK1 | Cell Signaling Technology | 2348 |
| phospho-CHK2 | BD Biosciences | 611,570 |
| γ-H2AX | Millipore | 05–636 |
| phospho-NBS1S432 | Abcam | ab12297 |
| phospho-RPA32 (S4/S8) | Bethyl | A300-245A |
| BARD1 (H-300) | Santa Cruz | sc-11,438 |
| 53BP1 | Santa Cruz | sc-22760 |
| TRF2 | Millipore | 05–521 |
| c-Myc (A14) | Santa Cruz | sc-789 |
| GFP | Santa Cruz | Sc-9996 |
| Flag | Sigma-Aldrich | F3165 |
| HA | Sigma-Aldrich | H3663 |
| PP1-α | Santa Cruz | sc-443 |
| γ-tubulin (clone GTU-488) | Sigma-Aldrich | T6557 |
| anti-Myc agarose beads | Sigma-Aldrich | A7470 |
| anti-Flag agarose beads | Sigma-Aldrich | A2220 |
| Biological Samples | ||
| Chemicals, Peptides, and Recombinant Proteins | ||
| Roscovitine | Sigma-Aldrich | R7772 |
| Phosphatase inhibitor cocktail | Sigma-Aldrich | P 5726 |
| 1NM-PP1 | Calbiochem | 529581-1MG |
| Thymidine | Sigma-Aldrich | T1895-5G |
| Aphidicolin | Sigma-Aldrich | A4487-1ML |
| FAM-labeled NBS1 peptides (hNBS1 423–438) | This paper | N/A |
| FAM-labeled Apollo peptides (hAPOLLO 500–513) | This paper | |
| Human TRF2TRFH (residues 42-245) | Chen et al., 2008b | |
| NBS1WT and mutant peptides (423–438) | Convenience Biology | |
| Critical Commercial Assays | ||
| Site-directed mutagenesis | Stratagene | 200521 |
| Deposited Data | ||
| atomic coordinates of the TRF2-NBS1 complex | This paper | PDB: 5WQD |
| Experimental Models: Cell Lines | ||
| Human NBS-ILB1 cells | Falck et al., 2012, EMBO Reports. | N/A |
| HCT116 CDK2WT cells |
Wohlbold et al., 2012 PLoS Genetics. |
N/A |
| HCT116 CDK2AS/AS cells |
Wohlbold et al., 2012 PLoS Genetics. |
N/A |
| U2OS | ATCC | |
| Nbs1−/− MEFs | Matsuura et al., 2004, Adv Biophys. | N/A |
| Apollo/SNM1B−/− MEFs | Lam et al., 2010, EMBO J. | N/A |
| Atm−/− MEFs | Rai et al., 2010, EMBO J. | N/A |
| Ku70−/− MEFs | Rai et al., 2010, EMBO J. | N/A |
| Cdk2−/− MEFs |
Buis et al., 2012 NSMB |
N/A |
| Experimental Models: Organisms/Strains | ||
| Recombinant DNA | ||
| pBabe puro Myc-hTRF2ΔBΔM | This paper | N/A |
| pQCXIP puro Flag-hTPP1ΔRD | This paper | N/A |
| pQCXIP puro HA-mTPP1ΔRD | This paper | N/A |
| pQCXIP puro Flag-mNBS1WT and mutants | This paper | N/A |
| pSG5 Myc-hNBS1WT and mutants |
Falck et al., 2012 EMBO Reports |
N/A |
| pEGFP-N1-PNUTSWT | Landsverk et al., 2010, EMBO Reports | N/A |
| pEGFP-N1-PNUTSW401A | Landsverk et al., 2010, EMBO Reports | N/A |
| pLPC Flag-PNUTSWT | Kim et al., 2009, NSMB | N/A |
| pLPC Flag-PNUTSΔC | Kim et al., 2009, NSMB | N/A |
| pCMV HA-CDK2WT | Addgene | 1884 |
| pCMV HA-CDK2DN | Addgene | 1882 |
| EGFP-PP1 alpha | Ceulemans et al., 2002, JBC | N/A |
| GFP-EXOI | Tomimatsu et al., 2014, Nature Comm. | N/A |
| GFP-EXOI 4A | Tomimatsu et al., 2014, Nature Comm. | N/A |
| pLPC HA-Apollo | Chen et al., 2011, NSMB | N/A |
| pCDNA3.1 Myc-TRF2 | Chen et al., 2011, NSMB | N/A |
| pBabe Myc-hMRE11, pBabe hMyc NBS1 | Dr. Xiaohua Wu | N/A |
| Fucci mKO-CTD1 | Sakaue-Sawano et al., 2008, Cell | N/A |
| Fucci mAG-Geminin | Sakaue-Sawano et al., 2008, Cell | N/A |
| pRetroSuper shParp1 | Madalena Tarsounas | N/A |
| pRetroSuper shLigase 3 | Madalena Tarsounas | N/A |
| pRetroSuper shNbs1 | This paper | N/A |
| pRetroSuper shTrf2 | Deng et al., 2009 | N/A |
| PlK.01 Lenti shCtip | Sigma-Aldrich | N/A |
| PlK.01 Lenti shExo1 | Sigma-Aldrich | N/A |
| Sequence-Based Reagents | ||
| 5′-Tam-OO-(CCCTAA)4-3′ PNA telomere probe | Panagene | F1002 |
| 5′-FITC-CO-(TTAGGG)4-3′ probes | Panagene | F1005 |
| Software and Algorithms | ||
| Prism 6 | Graphpad Software, San Diego, CA | N/A |
| Origin 7 | OriginLab | N/A |
| Metamorph | Molecular Devices | N/A |
| Phaser | McCoy et al., 2007 | N/A |
| Phenix | Adams et al., 2002 | N/A |
| Coot | Emsley and Cowtan, 2004 | N/A |
| HKL2000 | Otwinowski and Minor, 1997 | N/A |
| Other | ||
TABLE WITH EXAMPLES FOR AUTHOR REFERENCE
| REAGENT or RESOURCE | SOURCE | IDENTIFIER |
|---|---|---|
| Antibodies | ||
| Rabbit monoclonal anti-Snail | Cell Signaling Technology | Cat#3879S; RRID: AB_2255011 |
| Mouse monoclonal anti-Tubulin (clone DM1A) | Sigma-Aldrich | Cat#T9026; RRID: AB_477593 |
| Rabbit polyclonal anti-BMAL1 | This paper | N/A |
| Biological Samples | ||
| Healthy adult BA9 brain tissue | University of Maryland Brain & Tissue Bank; http://medschool.umaryland.edu/btbank/ | Cat#UMB1455 |
| Human hippocampal brain blocks | New York Brain Bank | http://nybb.hs.columbia.edu/ |
| Patient-derived xenografts (PDX) | Children’s Oncology Group Cell Culture and Xenograft Repository | http://cogcell.org/ |
| Chemicals, Peptides, and Recombinant Proteins | ||
| MK-2206 AKT inhibitor | Selleck Chemicals | S1078; CAS: 1032350-13-2 |
| SB-505124 | Sigma-Aldrich | S4696; CAS: 694433-59-5 (free base) |
| Picrotoxin | Sigma-Aldrich | P1675; CAS: 124-87-8 |
| Human TGF-β | R&D | 240-B; GenPept: P01137 |
| Activated S6K1 | Millipore | Cat#14-486 |
| GST-BMAL1 | Novus | Cat#H00000406-P01 |
| Critical Commercial Assays | ||
| EasyTag EXPRESS 35S Protein Labeling Kit | Perkin-Elmer | NEG772014MC |
| CaspaseGlo 3/7 | Promega | G8090 |
| TruSeq ChIP Sample Prep Kit | Illumina | IP-202-1012 |
| Deposited Data | ||
| Raw and analyzed data | This paper | GEO: GSE63473 |
| B-RAF RBD (apo) structure | This paper | PDB: 5J17 |
| Human reference genome NCBI build 37, GRCh37 | Genome Reference Consortium | http://www.ncbi.nlm.nih.gov/projects/genome/assembly/grc/human/ |
| Experimental Models: Cell Lines | ||
| Hamster: CHO cells | ATCC | CRL-11268 |
| D. melanogaster: Cell line S2: S2-DRSC | Laboratory of Norbert Perrimon | FlyBase: FBtc0000181 |
| Human: Passage 40 H9 ES cells | MSKCC stem cell core facility | N/A |
| Human: HUES 8 hESC line (NIH approval number NIHhESC-09-0021) | HSCI iPS Core | hES Cell Line: HUES-8 |
| Experimental Models: Organisms/Strains | ||
| Streptococcus pyogenes: M1 serotype strain: strain SF370; M1 GAS | ATCC | ATCC:700294 |
| C. elegans: Strain BC4011: srl-1(s2500) II; dpy-18(e364) III; unc-46(e177)rol-3(s1040) V. | Caenorhabditis Genetics Center | WB Strain: BC4011; WormBase: WBVar00241916 |
| D. melanogaster: RNAi of Sxl: y[1] sc[*] v[1]; P{TRiP.HMS00609}attP2 | Bloomington Drosophila Stock Center | BDSC:34393; FlyBase: FBtp0064874 |
| S. cerevisiae: Strain background: W303 | ATCC | ATTC: 208353 |
| Mouse: R6/2: B6CBA-Tg(HDexon1)62Gpb/3J | The Jackson Laboratory | JAX: 006494 |
| Mouse: OXTRfl/fl: B6.129(SJL)-Oxtrtm1.1Wsy/J | The Jackson Laboratory | RRID: IMSR_JAX:008471 |
| Zebrafish: Tg(Shha:GFP)t10: t10Tg | Neumann and Nuesslein-Volhard, 2000 | ZFIN: ZDB-GENO-060207-1 |
| Arabidopsis: 35S::PIF4-YFP, BZR1-CFP | Wang et al., 2012 | N/A |
| Arabidopsis: JYB1021.2: pS24(AT5G58010)::cS24:GFP(-G):NOS #1 | NASC | NASC ID: N70450 |
| Recombinant DNA | ||
| pLVX-Tight-Puro (TetOn) | Clonetech | Cat#632162 |
| Plasmid: GFP-Nito | This paper | N/A |
| cDNA GH111110 | Drosophila Genomics Resource Center | DGRC:5666; FlyBase:FBcl013041 5 |
| AAV2/1-hsyn-GCaMP6- WPRE | Chen et al., 2013 | N/A |
| Mouse raptor: pLKO mouse shRNA 1 raptor | Thoreen et al., 2009 | Addgene Plasmid #21339 |
| Sequence-Based Reagents | ||
| siRNA targeting sequence: PIP5K I alpha #1: ACACAGUACUCAGUUGAUA | This paper | N/A |
| Primers for XX, see Table SX | This paper | N/A |
| Primer: GFP/YFP/CFP Forward: GCACGACTTCTTCAAGTCCGCCATGCC | This paper | N/A |
| Morpholino: MO-pax2a GGTCTGCTTTGCAGTGAATATCCAT | Gene Tools | ZFIN: ZDB-MRPHLNO-061106-5 |
| ACTB (hs01060665_g1) | Life Technologies | Cat#4331182 |
| RNA sequence: hnRNPA1_ligand: UAGGGACUUAGGGUUCUCUCUAGGGACUUAGGGUUCUCUCUAGGGA | This paper | N/A |
| Software and Algorithms | ||
| Bowtie2 | Langmead and Salzberg, 2012 | http://bowtie-bio.sourceforge.net/bowtie2/index.shtml |
| Samtools | Li et al., 2009 | http://samtools.sourceforge.net/ |
| Other | ||
| Sequence data, analyses, and resources related to the ultra-deep sequencing of the AML31 tumor, relapse, and matched normal. | This paper | http://aml31.genome.wustl.edu |
| Resource website for the AML31 publication | This paper | https://github.com/chrisamiller/aml31SuppSite |
Supplementary Material
Supplementary Figure 1. Analysis of the TRF2TRFH-NBS1TBM crystal structure, Related to Figure 1. A. The two different conformations of NBS1 in a TRF2-NBS1 dimer (form A and form B). TRF2 and NBS1 are colored in green and yellow respectively in one complex, and cyan and magenta in the other complex. The central fragments YQLSPT, shown in stick models, are in the same configuration. However, N termini of peptides adopt different conformations. B. Comparison of TRF2-NBS1 and TRF2-Apollo/SNM1B structure. TRF2-NBS1 is in form A as shown above. In the TRF2-NBS1 structure, TRF2 and NBS1 are in green and yellow respectively. In the TRF2-Apollo/SNM1B structure, TRF2 and Apollo/SNM1B are in magenta and blue respectively. The conserved three hydrophobic residues (Y, L, P) are shown in stick representations. C. Superposition of the TRF2-NBS1 complex on the unliganded structure of the TRF2TRFH domain. In TRF2-NBS1, TRF2 is colored in green and NBS1 is colored in yellow. The unliganded TRF2 is colored grey. TRF2TRFH in TRF2-NBS1 complex exhibits essentially the same conformation as unliganded TRF2TRFH except for loop L34, which becomes partially ordered upon NBS1 binding. D. Electron density map of the dimeric TRF2-NBS1 complex. E, F. In vitro ITC measurement of interaction between wild-type TRF2TRFH and the indicated human and mouse NBS1 mutants.
Supplementary Figure 2. mNBS1S433 mutants do not affect localization of the MRN complex to genomic DSBs, Related to Figure 2. A. Proteins that contain the F/Y/H-X-L-X-P TRF2TRFH binding motif (yellow). B. Localization of endogenous MRE11 in U2OS cells. Fixed cells were stained with anti-MRE11 antibody to visualize endogenous MRE11 (red), DAPI staining to visualize nuclei (blue), and PNA-FISH to visualize telomeres (red). C. mNBS1S433 mutants do not abolish interaction with MRE11. 293T cells transfected with indicated DNAs were immunoprecipitated with anti-Flag antibody and immunoblotted with anti-Myc and anti-Flag antibodies. Inputs represent 5% of the total cell lysate used for the immunoprecipitations. γ-tubulin was used as loading control. D. WT mNBS1 and mNBS1S433 mutants reconstituted in Nbs1−/− MEFs form radiation induced foci after exposure to 10Gy IR. Fixed cells were stained with anti-MRE11 antibody to visualize endogenous Mre11 (red), anti-Flag antibody to visualize Flag-mNBS1 (green) and DAPI staining to visualize nuclei (blue). E. WT Flag-mNBS1 and Flag-mNBS1S433 mutants localize to dysfunctional telomeres lacking mPOT1a/b-mTPP1 in Atm−/− MEFs. Atm−/− MEFs expressing mTPP1ΔRD were reconstituted with the indicated DNAs and stained with anti-Flag antibody to visualize Flag-mNBS1 proteins. PNA-FISH was used to visualize telomeres and DAPI staining to visualize nuclei (blue). Quantification of percent of cells with ≥ 5 NBS1 positive TIFs.
Supplementary Figure 3. CDK2 phosphorylates hNBS1S432, Related to Figure 3. A. HCT116 cells expressing WT CDK2 or CDK2AS and the indicated DNAs were treated with 5μM 1NM-PP1. Cell lysates were immunoprecipitated with anti-Myc antibody and immunoblotted with anti-Myc and anti-Flag antibodies. Inputs represent 5% of the total cell lysate used for IP. B. The cyclin binding mutant mNBS1AKA binds to mTRF2 with increased affinity. Cells expressing the indicated DNAs were immunoprecipated with anti Myc-antibody and detected by Western blotting with anti-Myc and anti-Flag antibodies. Inputs represent 5% of the total cell lysate used for IP. C. Quantification of percent of cells expressing the indicated DNA constructs with ≥ 5 NBS1 positive TIFs (from Figure 3F). Data represents the mean of three independent experiments ± SEM; n>150 nuclei scored per experiment.*: p<0.02, **: p<0.005, ***: p<0.0007; one-way Anova). NS: not significant. D. 293T cells expressing the indicated proteins were immunoprecipitated with anti-Myc antibody and immunoblotted with anti-Myc, anti-Flag and anti-GFP antibodies. Decreasing concentration of GFP-PNUTS (1.0 μg, 0.5 μg, 0.25μg, 0.125μg) were used in the lanes 3–6 and 1.0 μg of GFP-PNUTS was used in lane 7. The amount of Flag-NBS1 was held constant. Inputs represent 5% of the total cell lysate used for the immunoprecipitations. γ-tubulin: loading control. E. 293T cell lysates containing equal amounts of HA-Apollo/SNM1B were mixed with increasing concentrations of Flag-NBS1AKA (lanes 2–5) in the presence of equal amounts of Myc-TRF2. Lysates were then immunoprecipitated with anti-Myc antibody and immunoblotted with anti-Myc, anti-Flag and anti-HA antibodies. F. 293T cell lysates containing equal amounts of Flag-NBS1AKA were mixed with increasing concentrations of HA-Apollo/SNM1B (lanes 2–5) in the presence of equal amounts of Myc-TRF2. Lysates were then immunoprecipitated with anti-Myc antibody and immunoblotted with anti-Myc, anti-Flag and anti-HA antibodies.
Supplementary Figure 4. Cell cycle regulation of NBS1S432 phosphorylation, Related to Figure 4. A. U2OS Fucci cells expressing mKO1-hCTD1 (red, G1) or mAG1-hGeminin (green, S/G2) were fixed and stained with antibody against phospho-NBS1S432 (either red or green) and TRF2 antibody (blue). Phospho-NBS1S432 is found predominantly in S/G2 cells. B. Quantification of cells in (A). Percentage of cells with ≥ 5 phospho-NBS1S432 positive foci in G1 and S/G2 cells were determined. Data are the mean from two independent experiments ± SEM; n>150 nuclei scored per experiment. C. U2OS Fucci cells transfected with mKO1-hCTD1 (red, G1) or mAG1-hGeminin (green, S/G2) were fixed and stained with anti-PP1-α antibody (red or green). G1 and S/G2 indicated is the phase of the cell cycle. D. Quantification of (C). Percentage of cells with PP1-α positive staining in G1 and S/G2 cells were determined. E. Association between NBS1S432 and TRF2 is cell-cycle regulated. U2OS cells expressing the indicated DNAs were synchronized with 2 mM thymidine and lysates prepared at indicated times after release were immunoprecipated with anti Myc-antibody and then immunoblotted with anti-Myc and anti-Flag-antibodies. Inputs represent 5% of the total cell lysate used for the IP. Cyclin A was used to mark phases of the cell cycle. γ-tubulin was a loading control. ES: early S phase. F. Quantification of cell cycle dependent localization of WT NBS1 and NBS1S433A for Figure 4B.
Supplementary Figure 5. CDK2 dependent phosphorylation of NBS1S432/3 is required for C-NHEJ mediated repair of telomeres lacking TRF2, Related to Figure 5. A. Localization of endogenously phosphorylated p-NBS1S432 in U2OS cells. Cells expressing the indicated DNA constructs were stained with anti-phospho-NBS1S432 antibody to visualize p-NBS1 (green), anti-Myc antibody to visualize Myc-MRE11 (red), and DAPI to visualize nuclei (blue). PNA-telomere FISH was used to visualize telomeres (red). Arrowheads point to telomeres co-localizing with p-NBS1S432. B. Localization of Flag-NBS1S433E on telomeres in WT MEFs treated with shTrf2, stained with anti-Flag antibody to visualize Flag-NBS1S433E (green), anti-Myc antibody to visualize Myc-MRE11 (red), DAPI to visualize nuclei (blue), and PNA-FISH to visualize telomeres (red). Arrowheads point to Flag-NBS1S432E co-localizing with Myc-MRE11 at dysfunctional telomeres. C, D. U2OS cells were transiently transfected with the indicated DNA constructs, fixed and stained with anti-p-NBS1S432 antibody to visualize endogenous p-NBS1 (red), GFP to visualize WT GFP-PNUTS or GFP-PNUTSW401A (green), anti-PP1-α antibody to visualize PP1-α (green), and anti-TRF2 antibody (blue) to visualize TRF2 (telomeres). White arrowheads point to phospho-NBS1S432 and WT GFP-PNUTS co-localizing with TRF2. Red arrowhead shows and GFP-PNUTSW401A co-localizing with TRF2, but phospho-NBS1S432 is not on telomeres. E. Quantification of percent of cells with ≥5 phospho-NBS1S432 positive foci in (C, D). F. Quantification of percent of cells expressing the indicated DNA constructs with telomere fusions. Data represents the mean of two independent experiments, with a minimum of 30 metaphases scored per experiment. ***: p<0.0005; one-way Anova. G. Cdk2+/+ or Cdk2−/− MEFs expressing either WT mNBS1 or mNBS1S433 mutants were infected with either control vector or shTrf2 for 120 h, after which metaphases were prepared and telomere fusions visualized by CO-FISH. FITC-OO-(TTAGGG)4 (green) was used to visualize the leading-strand and Tam-OO-(CCCTAA)4 (red) was used to visualize the lagging-strand. DAPI (blue) visualized chromosomes. Arrowheads point to fusion sites of a few fused chromosomes. H. Quantification of percentage of cells with telomere fusions in (G). Data represents the mean of two independent experiments, with a minimum of 40 metaphases scored per experiment. **: p<0.028; one-way Anova.
Supplementary Figure 6. Expression of de-phosphorylated mNBS1S433 mutants leads to increased HDR mediated chromosomal aberrations, Related to Figure 6. A Localization of WT mNBS1, mNBS1S433A and mNBS1AKA mutants in Nbs1−/− MEFs after removal of mPOT1/mTPP1 from telomeres using TPP1ΔRD. Telomeres were visualized with telomere PNA-FISH (red), anti-Flag antibody to visualize NBS1 (green) and DAPI staining to visualize nuclei (blue). Arrowheads point to NBS1 co-localizing with telomeres. B. Quantification of percent of cells with ≥ 5 NBS1 positive TIFs in (A). Data represents the mean of two independent experiments ± SEM; n>100 nuclei analyzed per experiment (**:p<0.005; one-way Anova). C. Quantification of chromosome aberrations of cells expressing the indicated DNAs. TDM: telomere double minute chromosomes, fusions: chromosome end-to-end fusions, ring; ring chromosomes. D. Quantification of T-SCEs in cells expressing the indicated DNAs. Data are the representative of the mean ±SEM from three independent experiments, with at least 40 metaphases scored per experiment. **: p<0.006, ***: p<0.0005; one-way Anova. E. Quantification of percent telomere fusions of cells expressing the indicated DNAs. Data represent the average of two independent experiments ± SEM, a minimum of 30 metaphases were examined per experiment **p<0.002; one-way Anova. F. Quantification of T-SCEs in Nbs1−/− MEFs expressing the indicated DNAs. Data represent the average of two independent experiments ± SEM. A minimum of 30 metaphases were examined per experiment. *: p<0.002; one-way Anova. G. Genomic DNA from Nbs1−/− MEFs expressing the indicated DNAs was fractionated with a clamped homogenous electric field (CHEF) gel, then in-gel hybridization was performed using a (CCCTAA)4 probe to detect the 3′ single-stranded (SS) overhang under native conditions (left) and under denatured condition to detect total TTAGGG repeats (right). Single strand G overhang and total telomere signals in the control was set at 100% after normalizing the lanes with a denatured subtelomeric fragment that served as an internal loading control. For quantification, we used native telomeric signals from the portions of the gel between the 23 kb and the 9.4 kb marks. The numbers below the gel represents normalized overhang signal as compared to control vector. H. Quantification of percentage of nuclei with ≥ 5 p-RPA positive TIFs in cells expressing the indicated DNAs. A minimum of 100 nuclei were scored per sample. I. Quantification of percent telomere fusions in cells expressing the indicated DNAs. Data represent the average of two independent experiments ± SEM, a minimum of 30 metaphases were examined per experiment.
Supplementary Figure 7. NBS1S433A recruits EXO1 to telomeres and promotes genome instability, Related to Figure 7. A. Quantification of percentage of cells containing chromosomal fusions. Fusions were visualized in Apollo/SNM1B−/− MEFs expressing the indicated DNAs. Data represent the average of two independent experiments ± SEM, and a minimum of 25 metaphases were examined per experiment. B. U2OS cells expressing either WT EXOI or the EXO14A mutant were stained for telomeres using PNA-FISH (red), anti-GFP antibody to visualize GFP-EXOI (green) and DAPI to visualize nuclei (blue). C. Quantification of percentage of cells containing ≥5 positive foci for both EXO1 and NBS1 (from Figure 7C). Data represent the average of two independent experiments, a minimum of 200 nuclei were examined per experiment. D. Telomere-telomere and telomere-DSB fusion phenotypes observed in cells of the indicated genotypes. Metaphases were prepared and telomere aberrations visualized by CO-FISH. FITC-OO-(TTAGGG)4 (green) was used to visualize the leading strand and Tam-OO-(CCCTAA)4 (red) was used to visualize the lagging strand and DAPI (blue) to label chromosomes. E. Quantification of number of interstitial telomeres per metaphase in WT and Nbs1−/− MEFs expressing the indicated DNAs observed in (D). A minimum of 30 metaphases were examined per experiment. F. Detection of anaphase bridges (AB, arrows) in Nbs1−/− MEFs expressing mNBS1S433A or mNBS1AKA and treated with mTPP1ΔRD. G. Quantification of percentage of cells containing anaphase bridges in E. Data represent the average of two independent experiments ± SEM, a minimum of 30 metaphases were examined per experiment.
Table 1.
Data collection and refinement statistics, Related to Figure 1
| TRF2-NBS1 | |
|---|---|
| Data collection | |
| Space group | P21212 |
| Cell dimensions | |
| a, b, c (Å) | 144.616, 153.267, 108.029 |
| α, β, γ (°) | 90, 90,90 |
| Resolution (Å) | 3.0 |
| Rsym or Rmerge | 0.080 (0.437) |
| I/σI | 19.8 (2.2) |
| Completeness (%) | 96.4 (79.9) |
| Redundancy | 7.5 (3.4) |
| Refinement | |
| Resolution (Å) | 48.1-3.0 |
| No. reflections | 47155 |
| Rwork/Rfree | 23.3/28.4 |
| No. atoms | |
| TRF2 | 11045 |
| NBS1 | 574 |
| B-factors | |
| TRF2 | 86.79 |
| NBS1 | 105.97 |
| R.m.s. deviations | |
| Bond lengths (Å) | 0.003 |
| Bond angles (°) | 0.551 |
Acknowledgments
We would like to thank the Chang lab for helpful suggestions, and thank Dr. Lee Zou and Dr. Kenshi Komatsu for kindly providing Nbs1−/− MEFs, Dr. Steve Jackson for human NBS-ILB1 cells, Dr. Rob Fisher for CDK2WT and CDK2AS cell lines, and Dr. Sandeep Verma for EXO1 cDNA constructs. This work was supported by grants from the Ministry of Science and Technology of China (2013CB910402.), the National Natural Science Foundation of China (31330040 and 31525007), the Strategic Priority Research Program of the Chinese Academy of Sciences (XDB08010201) to M.L., and the NCI (RO1 CA129037, RO1CA202816, R21CA200506 and R21CA182280) to S.C.
Footnotes
Author Contributions
RR, YC, ML and SC conceived the project and designed the experiments. CH, YC and ML performed X-ray crystallography, CH performed ITC, RR performed the biochemistry and molecular biology experiments and CB performed immunofluorescence microscopy. RR, YC, CH and CB generated data for the figures. RR, YC, ML and SC analyzed and interpreted the data, composed the figures and wrote the paper.
Competing Financial Interests
The authors declare no competing financial interests.
The authors have declared that no conflict of interest exists.
References
- Adams PD, Grosse-Kunstleve RW, Hung LW, Ioerger TR, McCoy AJ, Moriarty NW, Read RJ, Sacchettini JC, Sauter NK, Terwilliger TC. PHENIX: building new software for automated crystallographic structure determination. Acta Crystallogr D Biol Crystallogr. 2002;58:1948–1954. doi: 10.1107/s0907444902016657. [DOI] [PubMed] [Google Scholar]
- Aleem E, Kiyokawa H, Kaldis P. Cdc2-cyclin E complexes regulate the G1/S phase transition. Nat Cell Biol. 2005;7:831–836. doi: 10.1038/ncb1284. [DOI] [PubMed] [Google Scholar]
- Allen PB, Kwon YG, Nairn AC, Greengard P. Isolation and characterization of PNUTS, a putative protein phosphatase 1 nuclear targeting subunit. J Biol Chem. 1998;273:4089–4095. doi: 10.1074/jbc.273.7.4089. [DOI] [PubMed] [Google Scholar]
- Attwooll CL, Akpinar M, Petrini JH. The mre11 complex and the response to dysfunctional telomeres. Mol Cell Biol. 2009;29:5540–5551. doi: 10.1128/MCB.00479-09. [DOI] [PMC free article] [PubMed] [Google Scholar]
- Audebert M, Salles B, Calsou P. Involvement of poly(ADP-ribose) polymerase-1 and XRCC1/DNA ligase III in an alternative route for DNA double-strand breaks rejoining. J Biol Chem. 2004;279:55117–55126. doi: 10.1074/jbc.M404524200. [DOI] [PubMed] [Google Scholar]
- Bailey SM, Cornforth MN, Kurimasa A, Chen DJ, Goodwin EH. Strand-specific postreplicative processing of mammalian telomeres. Science. 2001;293:2462–2465. doi: 10.1126/science.1062560. [DOI] [PubMed] [Google Scholar]
- Bashir T, Pagano M. Cdk1: the dominant sibling of Cdk2. Nat Cell Biol. 2005;7:779–781. doi: 10.1038/ncb0805-779. [DOI] [PubMed] [Google Scholar]
- Benarroch-Popivker D, Pisano S, Mendez-Bermudez A, Lototska L, Kaur P, Bauwens S, Djerbi N, Latrick CM, Fraisier V, Pei B, et al. TRF2-Mediated Control of Telomere DNA Topology as a Mechanism for Chromosome-End Protection. Mol Cell. 2016;61:274–286. doi: 10.1016/j.molcel.2015.12.009. [DOI] [PMC free article] [PubMed] [Google Scholar]
- Berndt N, Dohadwala M, Liu CW. Constitutively active protein phosphatase 1alpha causes Rb-dependent G1 arrest in human cancer cells. Curr Biol. 1997;7:375–386. doi: 10.1016/s0960-9822(06)00185-0. [DOI] [PubMed] [Google Scholar]
- Buis J, Stoneham T, Spehalski E, Ferguson DO. Mre11 regulates CtIP-dependent double-strand break repair by interaction with CDK2. Nat Struct Mol Biol. 2012;19:246–252. doi: 10.1038/nsmb.2212. [DOI] [PMC free article] [PubMed] [Google Scholar]
- Bunting SF, Callen E, Wong N, Chen HT, Polato F, Gunn A, Bothmer A, Feldhahn N, Fernandez-Capetillo O, Cao L, et al. 53BP1 inhibits homologous recombination in Brca1-deficient cells by blocking resection of DNA breaks. Cell. 2010;141:243–254. doi: 10.1016/j.cell.2010.03.012. [DOI] [PMC free article] [PubMed] [Google Scholar]
- Ceccaldi R, Liu JC, Amunugama R, Hajdu I, Primack B, Petalcorin MI, O’Connor KW, Konstantinopoulos PA, Elledge SJ, Boulton SJ, et al. Homologous-recombination-deficient tumours are dependent on Poltheta-mediated repair. Nature. 2015;518:258–262. doi: 10.1038/nature14184. [DOI] [PMC free article] [PubMed] [Google Scholar]
- Celli GB, de Lange T. DNA processing is not required for ATM-mediated telomere damage response after TRF2 deletion. Nat Cell Biol. 2005;7:712–718. doi: 10.1038/ncb1275. [DOI] [PubMed] [Google Scholar]
- Chen J, Saha P, Kornbluth S, Dynlacht BD, Dutta A. Cyclin-binding motifs are essential for the function of p21CIP1. Mol Cell Biol. 1996;16:4673–4682. doi: 10.1128/mcb.16.9.4673. [DOI] [PMC free article] [PubMed] [Google Scholar]
- Chen L, Nievera CJ, Lee AY, Wu X. Cell cycle-dependent complex formation of BRCA1.CtIP.MRN is important for DNA double-strand break repair. J Biol Chem. 2008a;283:7713–7720. doi: 10.1074/jbc.M710245200. [DOI] [PubMed] [Google Scholar]
- Chen Y, Yang Y, van Overbeek M, Donigian JR, Baciu P, de Lange T, Lei M. A shared docking motif in TRF1 and TRF2 used for differential recruitment of telomeric proteins. Science. 2008b;319:1092–1096. doi: 10.1126/science.1151804. [DOI] [PubMed] [Google Scholar]
- Comer AR, Ahern-Djamali SM, Juang JL, Jackson PD, Hoffmann FM. Phosphorylation of Enabled by the Drosophila Abelson tyrosine kinase regulates the in vivo function and protein-protein interactions of Enabled. Mol Cell Biol. 1998;18:152–160. doi: 10.1128/mcb.18.1.152. [DOI] [PMC free article] [PubMed] [Google Scholar]
- Decottignies A. Alternative end-joining mechanisms: a historical perspective. Front Genet. 2013;4:48. doi: 10.3389/fgene.2013.00048. [DOI] [PMC free article] [PubMed] [Google Scholar]
- Denchi EL, de Lange T. Protection of telomeres through independent control of ATM and ATR by TRF2 and POT1. Nature. 2007;448:1068–1071. doi: 10.1038/nature06065. [DOI] [PubMed] [Google Scholar]
- Deng Y, Guo X, Ferguson DO, Chang S. Multiple roles for MRE11 at uncapped telomeres. Nature. 2009;460:914–918. doi: 10.1038/nature08196. [DOI] [PMC free article] [PubMed] [Google Scholar]
- Dimitrova N, de Lange T. Cell cycle-dependent role of MRN at dysfunctional telomeres: ATM signaling-dependent induction of nonhomologous end joining (NHEJ) in G1 and resection-mediated inhibition of NHEJ in G2. Mol Cell Biol. 2009;29:5552–5563. doi: 10.1128/MCB.00476-09. [DOI] [PMC free article] [PubMed] [Google Scholar]
- Dinkelmann M, Spehalski E, Stoneham T, Buis J, Wu Y, Sekiguchi JM, Ferguson DO. Multiple functions of MRN in end-joining pathways during isotype class switching. Nat Struct Mol Biol. 2009;16:808–813. doi: 10.1038/nsmb.1639. [DOI] [PMC free article] [PubMed] [Google Scholar]
- Dohadwala M, da Cruz e Silva EF, Hall FL, Williams RT, Carbonaro-Hall DA, Nairn AC, Greengard P, Berndt N. Phosphorylation and inactivation of protein phosphatase 1 by cyclin-dependent kinases. Proc Natl Acad Sci U S A. 1994;91:6408–6412. doi: 10.1073/pnas.91.14.6408. [DOI] [PMC free article] [PubMed] [Google Scholar]
- Emsley P, Cowtan K. Coot: model-building tools for molecular graphics. Acta Crystallogr D Biol Crystallogr. 2004;60:2126–2132. doi: 10.1107/S0907444904019158. [DOI] [PubMed] [Google Scholar]
- Escribano-Diaz C, Orthwein A, Fradet-Turcotte A, Xing M, Young JT, Tkac J, Cook MA, Rosebrock AP, Munro M, Canny MD, et al. A cell cycle-dependent regulatory circuit composed of 53BP1-RIF1 and BRCA1-CtIP controls DNA repair pathway choice. Mol Cell. 2013;49:872–883. doi: 10.1016/j.molcel.2013.01.001. [DOI] [PubMed] [Google Scholar]
- Fairall L, Chapman L, Moss H, de Lange T, Rhodes D. Structure of the TRFH dimerization domain of the human telomeric proteins TRF1 and TRF2. Mol Cell. 2001;8:351–361. doi: 10.1016/s1097-2765(01)00321-5. [DOI] [PubMed] [Google Scholar]
- Falck J, Forment JV, Coates J, Mistrik M, Lukas J, Bartek J, Jackson SP. CDK targeting of NBS1 promotes DNA-end resection, replication restart and homologous recombination. EMBO Rep. 2012;13:561–568. doi: 10.1038/embor.2012.58. [DOI] [PMC free article] [PubMed] [Google Scholar]
- Gaullier G, Miron S, Pisano S, Buisson R, Le Bihan YV, Tellier-Lebegue C, Messaoud W, Roblin P, Guimaraes BG, Thai R, et al. A higher-order entity formed by the flexible assembly of RAP1 with TRF2. Nucleic Acids Res. 2016;44:1962–1976. doi: 10.1093/nar/gkv1531. [DOI] [PMC free article] [PubMed] [Google Scholar]
- Guo X, Deng Y, Lin Y, Cosme-Blanco W, Chan S, He H, Yuan G, Brown EJ, Chang S. Dysfunctional telomeres activate an ATM-ATR-dependent DNA damage response to suppress tumorigenesis. EMBO J. 2007;26:4709–4719. doi: 10.1038/sj.emboj.7601893. [DOI] [PMC free article] [PubMed] [Google Scholar]
- Huertas P, Jackson SP. Human CtIP mediates cell cycle control of DNA end resection and double strand break repair. J Biol Chem. 2009;284:9558–9565. doi: 10.1074/jbc.M808906200. [DOI] [PMC free article] [PubMed] [Google Scholar]
- Kent T, Chandramouly G, McDevitt SM, Ozdemir AY, Pomerantz RT. Mechanism of microhomology-mediated end-joining promoted by human DNA polymerase theta. Nat Struct Mol Biol. 2015;22:230–237. doi: 10.1038/nsmb.2961. [DOI] [PMC free article] [PubMed] [Google Scholar]
- Kim H, Lee OH, Xin H, Chen LY, Qin J, Chae HK, Lin SY, Safari A, Liu D, Songyang Z. TRF2 functions as a protein hub and regulates telomere maintenance by recognizing specific peptide motifs. Nat Struct Mol Biol. 2009;16:372–379. doi: 10.1038/nsmb.1575. [DOI] [PubMed] [Google Scholar]
- Kim YM, Watanabe T, Allen PB, Kim YM, Lee SJ, Greengard P, Nairn AC, Kwon YG. PNUTS, a protein phosphatase 1 (PP1) nuclear targeting subunit. Characterization of its PP1- and RNA-binding domains and regulation by phosphorylation. J Biol Chem. 2003;278:13819–13828. doi: 10.1074/jbc.M209621200. [DOI] [PubMed] [Google Scholar]
- Konishi A, de Lange T. Cell cycle control of telomere protection and NHEJ revealed by a ts mutation in the DNA-binding domain of TRF2. Genes Dev. 2008;22:1221–1230. doi: 10.1101/gad.1634008. [DOI] [PMC free article] [PubMed] [Google Scholar]
- Kraakman-van der Zwet M, Overkamp WJ, Friedl AA, Klein B, Verhaegh GW, Jaspers NG, Midro AT, Eckardt-Schupp F, Lohman PH, Zdzienicka MZ. Immortalization and characterization of Nijmegen Breakage syndrome fibroblasts. Mutat Res. 1999;434:17–27. doi: 10.1016/s0921-8777(99)00009-9. [DOI] [PubMed] [Google Scholar]
- Kwon YG, Lee SY, Choi Y, Greengard P, Nairn AC. Cell cycle-dependent phosphorylation of mammalian protein phosphatase 1 by cdc2 kinase. Proc Natl Acad Sci U S A. 1997;94:2168–2173. doi: 10.1073/pnas.94.6.2168. [DOI] [PMC free article] [PubMed] [Google Scholar]
- Lam YC, Akhter S, Gu P, Ye J, Poulet A, Giraud-Panis MJ, Bailey SM, Gilson E, Legerski RJ, Chang S. SNMIB/Apollo protects leading-strand telomeres against NHEJ-mediated repair. EMBO J. 2010;29:2230–2241. doi: 10.1038/emboj.2010.58. [DOI] [PMC free article] [PubMed] [Google Scholar]
- Landsverk HB, Mora-Bermudez F, Landsverk OJ, Hasvold G, Naderi S, Bakke O, Ellenberg J, Collas P, Syljuasen RG, Kuntziger T. The protein phosphatase 1 regulator PNUTS is a new component of the DNA damage response. EMBO Rep. 2010;11:868–875. doi: 10.1038/embor.2010.134. [DOI] [PMC free article] [PubMed] [Google Scholar]
- Lee JH, Paull TT. ATM activation by DNA double-strand breaks through the Mre11-Rad50-Nbs1 complex. Science. 2005;308:551–554. doi: 10.1126/science.1108297. [DOI] [PubMed] [Google Scholar]
- Lieber MR. The mechanism of double-strand DNA break repair by the nonhomologous DNA end-joining pathway. Annu Rev Biochem. 2010;79:181–211. doi: 10.1146/annurev.biochem.052308.093131. [DOI] [PMC free article] [PubMed] [Google Scholar]
- Lim DS, Kim ST, Xu B, Maser RS, Lin J, Petrini JH, Kastan MB. ATM phosphorylates p95/nbs1 in an S-phase checkpoint pathway. Nature. 2000;404:613–617. doi: 10.1038/35007091. [DOI] [PubMed] [Google Scholar]
- Liu CW, Wang RH, Dohadwala M, Schonthal AH, Villa-Moruzzi E, Berndt N. Inhibitory phosphorylation of PP1alpha catalytic subunit during the G(1)/S transition. J Biol Chem. 1999;274:29470–29475. doi: 10.1074/jbc.274.41.29470. [DOI] [PubMed] [Google Scholar]
- Matsuura S, Kobayashi J, Tauchi H, Komatsu K. Nijmegen breakage syndrome and DNA double strand break repair by NBS1 complex. Adv Biophys. 2004;38:65–80. [PubMed] [Google Scholar]
- McCoy AJ, Grosse-Kunstleve RW, Adams PD, Winn MD, Storoni LC, Read RJ. Phaser crystallographic software. J Appl Crystallogr. 2007;40:658–674. doi: 10.1107/S0021889807021206. [DOI] [PMC free article] [PubMed] [Google Scholar]
- Merrick KA, Wohlbold L, Zhang C, Allen JJ, Horiuchi D, Huskey NE, Goga A, Shokat KM, Fisher RP. Switching Cdk2 on or off with small molecules to reveal requirements in human cell proliferation. Molecular cell. 2011;42:624–636. doi: 10.1016/j.molcel.2011.03.031. [DOI] [PMC free article] [PubMed] [Google Scholar]
- Nimonkar AV, Genschel J, Kinoshita E, Polaczek P, Campbell JL, Wyman C, Modrich P, Kowalczykowski SC. BLM-DNA2-RPA-MRN and EXO1-BLM-RPA-MRN constitute two DNA end resection machineries for human DNA break repair. Genes Dev. 2011;25:350–362. doi: 10.1101/gad.2003811. [DOI] [PMC free article] [PubMed] [Google Scholar]
- Okamoto K, Bartocci C, Ouzounov I, Diedrich JK, Yates JR, 3rd, Denchi EL. A two-step mechanism for TRF2-mediated chromosome-end protection. Nature. 2013;494:502–505. doi: 10.1038/nature11873. [DOI] [PMC free article] [PubMed] [Google Scholar]
- Otwinowski Z, Minor W. [20] Processing of X-ray diffraction data collected in oscillation mode. Methods Enzymol. 1997;276:307–326. doi: 10.1016/S0076-6879(97)76066-X. [DOI] [PubMed] [Google Scholar]
- Palm W, de Lange T. How shelterin protects mammalian telomeres. Annu Rev Genet. 2008;42:301–334. doi: 10.1146/annurev.genet.41.110306.130350. [DOI] [PubMed] [Google Scholar]
- Peterson SE, Li Y, Wu-Baer F, Chait BT, Baer R, Yan H, Gottesman ME, Gautier J. Activation of DSB processing requires phosphorylation of CtIP by ATR. Mol Cell. 2013;49:657–667. doi: 10.1016/j.molcel.2012.11.020. [DOI] [PMC free article] [PubMed] [Google Scholar]
- Rai R, Chen Y, Lei M, Chang S. TRF2-RAP1 is required to protect telomeres from engaging in homologous recombination-mediated deletions and fusions. Nat Commun. 2016;7:10881. doi: 10.1038/ncomms10881. [DOI] [PMC free article] [PubMed] [Google Scholar]
- Rai R, Zheng H, He H, Luo Y, Multani A, Carpenter PB, Chang S. The function of classical and alternative non-homologous end-joining pathways in the fusion of dysfunctional telomeres. EMBO J. 2010;29:2598–2610. doi: 10.1038/emboj.2010.142. [DOI] [PMC free article] [PubMed] [Google Scholar]
- Rass E, Grabarz A, Plo I, Gautier J, Bertrand P, Lopez BS. Role of Mre11 in chromosomal nonhomologous end joining in mammalian cells. Nat Struct Mol Biol. 2009;16:819–824. doi: 10.1038/nsmb.1641. [DOI] [PubMed] [Google Scholar]
- Sakaue-Sawano A, Kurokawa H, Morimura T, Hanyu A, Hama H, Osawa H, Kashiwagi S, Fukami K, Miyata T, Miyoshi H, et al. Visualizing spatiotemporal dynamics of multicellular cell-cycle progression. Cell. 2008;132:487–498. doi: 10.1016/j.cell.2007.12.033. [DOI] [PubMed] [Google Scholar]
- Sfeir A, de Lange T. Removal of shelterin reveals the telomere end-protection problem. Science. 2012;336:593–597. doi: 10.1126/science.1218498. [DOI] [PMC free article] [PubMed] [Google Scholar]
- Symington LS, Gautier J. Double-strand break end resection and repair pathway choice. Annu Rev Genet. 2011;45:247–271. doi: 10.1146/annurev-genet-110410-132435. [DOI] [PubMed] [Google Scholar]
- Tomimatsu N, Mukherjee B, Catherine Hardebeck M, Ilcheva M, Vanessa Camacho C, Louise Harris J, Porteus M, Llorente B, Khanna KK, Burma S. Phosphorylation of EXO1 by CDKs 1 and 2 regulates DNA end resection and repair pathway choice. Nat Commun. 2014;5:3561. doi: 10.1038/ncomms4561. [DOI] [PMC free article] [PubMed] [Google Scholar]
- Verdun RE, Crabbe L, Haggblom C, Karlseder J. Functional human telomeres are recognized as DNA damage in G2 of the cell cycle. Mol Cell. 2005;20:551–561. doi: 10.1016/j.molcel.2005.09.024. [DOI] [PubMed] [Google Scholar]
- Verma P, Greenberg RA. Noncanonical views of homology-directed DNA repair. Genes Dev. 2016;30:1138–1154. doi: 10.1101/gad.280545.116. [DOI] [PMC free article] [PubMed] [Google Scholar]
- Wan B, Yin J, Horvath K, Sarkar J, Chen Y, Wu J, Wan K, Lu J, Gu P, Yu EY, et al. SLX4 assembles a telomere maintenance toolkit by bridging multiple endonucleases with telomeres. Cell Rep. 2013;4:861–869. doi: 10.1016/j.celrep.2013.08.017. [DOI] [PMC free article] [PubMed] [Google Scholar]
- Wang H, Shi LZ, Wong CC, Han X, Hwang PY, Truong LN, Zhu Q, Shao Z, Chen DJ, Berns MW, et al. The interaction of CtIP and Nbs1 connects CDK and ATM to regulate HR-mediated double-strand break repair. PLoS Genet. 2013;9:e1003277. doi: 10.1371/journal.pgen.1003277. [DOI] [PMC free article] [PubMed] [Google Scholar]
- Wohlbold L, Fisher RP. Behind the wheel and under the hood: functions of cyclin-dependent kinases in response to DNA damage. DNA Repair (Amst) 2009;8:1018–1024. doi: 10.1016/j.dnarep.2009.04.009. [DOI] [PMC free article] [PubMed] [Google Scholar]
- Wohlbold L, Merrick KA, De S, Amat R, Kim JH, Larochelle S, Allen JJ, Zhang C, Shokat KM, Petrini JH, et al. Chemical genetics reveals a specific requirement for Cdk2 activity in the DNA damage response and identifies Nbs1 as a Cdk2 substrate in human cells. PLoS Genet. 2012;8:e1002935. doi: 10.1371/journal.pgen.1002935. [DOI] [PMC free article] [PubMed] [Google Scholar]
- Wu L, Multani AS, He H, Cosme-Blanco W, Deng Y, Deng JM, Bachilo O, Pathak S, Tahara H, Bailey SM, et al. Pot1 deficiency initiates DNA damage checkpoint activation and aberrant homologous recombination at telomeres. Cell. 2006;126:49–62. doi: 10.1016/j.cell.2006.05.037. [DOI] [PubMed] [Google Scholar]
- Wu P, van Overbeek M, Rooney S, de Lange T. Apollo contributes to G overhang maintenance and protects leading-end telomeres. Mol Cell. 2010;39:606–617. doi: 10.1016/j.molcel.2010.06.031. [DOI] [PMC free article] [PubMed] [Google Scholar]
- Wu X, Ranganathan V, Weisman DS, Heine WF, Ciccone DN, O’Neill TB, Crick KE, Pierce KA, Lane WS, Rathbun G, et al. ATM phosphorylation of Nijmegen breakage syndrome protein is required in a DNA damage response. Nature. 2000;405:477–482. doi: 10.1038/35013089. [DOI] [PubMed] [Google Scholar]
- Xie A, Kwok A, Scully R. Role of mammalian Mre11 in classical and alternative nonhomologous end joining. Nat Struct Mol Biol. 2009;16:814–818. doi: 10.1038/nsmb.1640. [DOI] [PMC free article] [PubMed] [Google Scholar]
- Yu X, Chen J. DNA damage-induced cell cycle checkpoint control requires CtIP, a phosphorylation-dependent binding partner of BRCA1 C-terminal domains. Mol Cell Biol. 2004;24:9478–9486. doi: 10.1128/MCB.24.21.9478-9486.2004. [DOI] [PMC free article] [PubMed] [Google Scholar]
- Yun MH, Hiom K. CtIP-BRCA1 modulates the choice of DNA double-strand-break repair pathway throughout the cell cycle. Nature. 2009;459:460–463. doi: 10.1038/nature07955. [DOI] [PMC free article] [PubMed] [Google Scholar]
- Zhao S, Weng YC, Yuan SS, Lin YT, Hsu HC, Lin SC, Gerbino E, Song MH, Zdzienicka MZ, Gatti RA, et al. Functional link between ataxia-telangiectasia and Nijmegen breakage syndrome gene products. Nature. 2000;405:473–477. doi: 10.1038/35013083. [DOI] [PubMed] [Google Scholar]
- Zhu XD, Kuster B, Mann M, Petrini JH, de Lange T. Cell-cycle-regulated association of RAD50/MRE11/NBS1 with TRF2 and human telomeres. Nat Genet. 2000;25:347–352. doi: 10.1038/77139. [DOI] [PubMed] [Google Scholar]
- Zou L, Elledge SJ. Sensing DNA damage through ATRIP recognition of RPA-ssDNA complexes. Science. 2003;300:1542–1548. doi: 10.1126/science.1083430. [DOI] [PubMed] [Google Scholar]
Associated Data
This section collects any data citations, data availability statements, or supplementary materials included in this article.
Supplementary Materials
Supplementary Figure 1. Analysis of the TRF2TRFH-NBS1TBM crystal structure, Related to Figure 1. A. The two different conformations of NBS1 in a TRF2-NBS1 dimer (form A and form B). TRF2 and NBS1 are colored in green and yellow respectively in one complex, and cyan and magenta in the other complex. The central fragments YQLSPT, shown in stick models, are in the same configuration. However, N termini of peptides adopt different conformations. B. Comparison of TRF2-NBS1 and TRF2-Apollo/SNM1B structure. TRF2-NBS1 is in form A as shown above. In the TRF2-NBS1 structure, TRF2 and NBS1 are in green and yellow respectively. In the TRF2-Apollo/SNM1B structure, TRF2 and Apollo/SNM1B are in magenta and blue respectively. The conserved three hydrophobic residues (Y, L, P) are shown in stick representations. C. Superposition of the TRF2-NBS1 complex on the unliganded structure of the TRF2TRFH domain. In TRF2-NBS1, TRF2 is colored in green and NBS1 is colored in yellow. The unliganded TRF2 is colored grey. TRF2TRFH in TRF2-NBS1 complex exhibits essentially the same conformation as unliganded TRF2TRFH except for loop L34, which becomes partially ordered upon NBS1 binding. D. Electron density map of the dimeric TRF2-NBS1 complex. E, F. In vitro ITC measurement of interaction between wild-type TRF2TRFH and the indicated human and mouse NBS1 mutants.
Supplementary Figure 2. mNBS1S433 mutants do not affect localization of the MRN complex to genomic DSBs, Related to Figure 2. A. Proteins that contain the F/Y/H-X-L-X-P TRF2TRFH binding motif (yellow). B. Localization of endogenous MRE11 in U2OS cells. Fixed cells were stained with anti-MRE11 antibody to visualize endogenous MRE11 (red), DAPI staining to visualize nuclei (blue), and PNA-FISH to visualize telomeres (red). C. mNBS1S433 mutants do not abolish interaction with MRE11. 293T cells transfected with indicated DNAs were immunoprecipitated with anti-Flag antibody and immunoblotted with anti-Myc and anti-Flag antibodies. Inputs represent 5% of the total cell lysate used for the immunoprecipitations. γ-tubulin was used as loading control. D. WT mNBS1 and mNBS1S433 mutants reconstituted in Nbs1−/− MEFs form radiation induced foci after exposure to 10Gy IR. Fixed cells were stained with anti-MRE11 antibody to visualize endogenous Mre11 (red), anti-Flag antibody to visualize Flag-mNBS1 (green) and DAPI staining to visualize nuclei (blue). E. WT Flag-mNBS1 and Flag-mNBS1S433 mutants localize to dysfunctional telomeres lacking mPOT1a/b-mTPP1 in Atm−/− MEFs. Atm−/− MEFs expressing mTPP1ΔRD were reconstituted with the indicated DNAs and stained with anti-Flag antibody to visualize Flag-mNBS1 proteins. PNA-FISH was used to visualize telomeres and DAPI staining to visualize nuclei (blue). Quantification of percent of cells with ≥ 5 NBS1 positive TIFs.
Supplementary Figure 3. CDK2 phosphorylates hNBS1S432, Related to Figure 3. A. HCT116 cells expressing WT CDK2 or CDK2AS and the indicated DNAs were treated with 5μM 1NM-PP1. Cell lysates were immunoprecipitated with anti-Myc antibody and immunoblotted with anti-Myc and anti-Flag antibodies. Inputs represent 5% of the total cell lysate used for IP. B. The cyclin binding mutant mNBS1AKA binds to mTRF2 with increased affinity. Cells expressing the indicated DNAs were immunoprecipated with anti Myc-antibody and detected by Western blotting with anti-Myc and anti-Flag antibodies. Inputs represent 5% of the total cell lysate used for IP. C. Quantification of percent of cells expressing the indicated DNA constructs with ≥ 5 NBS1 positive TIFs (from Figure 3F). Data represents the mean of three independent experiments ± SEM; n>150 nuclei scored per experiment.*: p<0.02, **: p<0.005, ***: p<0.0007; one-way Anova). NS: not significant. D. 293T cells expressing the indicated proteins were immunoprecipitated with anti-Myc antibody and immunoblotted with anti-Myc, anti-Flag and anti-GFP antibodies. Decreasing concentration of GFP-PNUTS (1.0 μg, 0.5 μg, 0.25μg, 0.125μg) were used in the lanes 3–6 and 1.0 μg of GFP-PNUTS was used in lane 7. The amount of Flag-NBS1 was held constant. Inputs represent 5% of the total cell lysate used for the immunoprecipitations. γ-tubulin: loading control. E. 293T cell lysates containing equal amounts of HA-Apollo/SNM1B were mixed with increasing concentrations of Flag-NBS1AKA (lanes 2–5) in the presence of equal amounts of Myc-TRF2. Lysates were then immunoprecipitated with anti-Myc antibody and immunoblotted with anti-Myc, anti-Flag and anti-HA antibodies. F. 293T cell lysates containing equal amounts of Flag-NBS1AKA were mixed with increasing concentrations of HA-Apollo/SNM1B (lanes 2–5) in the presence of equal amounts of Myc-TRF2. Lysates were then immunoprecipitated with anti-Myc antibody and immunoblotted with anti-Myc, anti-Flag and anti-HA antibodies.
Supplementary Figure 4. Cell cycle regulation of NBS1S432 phosphorylation, Related to Figure 4. A. U2OS Fucci cells expressing mKO1-hCTD1 (red, G1) or mAG1-hGeminin (green, S/G2) were fixed and stained with antibody against phospho-NBS1S432 (either red or green) and TRF2 antibody (blue). Phospho-NBS1S432 is found predominantly in S/G2 cells. B. Quantification of cells in (A). Percentage of cells with ≥ 5 phospho-NBS1S432 positive foci in G1 and S/G2 cells were determined. Data are the mean from two independent experiments ± SEM; n>150 nuclei scored per experiment. C. U2OS Fucci cells transfected with mKO1-hCTD1 (red, G1) or mAG1-hGeminin (green, S/G2) were fixed and stained with anti-PP1-α antibody (red or green). G1 and S/G2 indicated is the phase of the cell cycle. D. Quantification of (C). Percentage of cells with PP1-α positive staining in G1 and S/G2 cells were determined. E. Association between NBS1S432 and TRF2 is cell-cycle regulated. U2OS cells expressing the indicated DNAs were synchronized with 2 mM thymidine and lysates prepared at indicated times after release were immunoprecipated with anti Myc-antibody and then immunoblotted with anti-Myc and anti-Flag-antibodies. Inputs represent 5% of the total cell lysate used for the IP. Cyclin A was used to mark phases of the cell cycle. γ-tubulin was a loading control. ES: early S phase. F. Quantification of cell cycle dependent localization of WT NBS1 and NBS1S433A for Figure 4B.
Supplementary Figure 5. CDK2 dependent phosphorylation of NBS1S432/3 is required for C-NHEJ mediated repair of telomeres lacking TRF2, Related to Figure 5. A. Localization of endogenously phosphorylated p-NBS1S432 in U2OS cells. Cells expressing the indicated DNA constructs were stained with anti-phospho-NBS1S432 antibody to visualize p-NBS1 (green), anti-Myc antibody to visualize Myc-MRE11 (red), and DAPI to visualize nuclei (blue). PNA-telomere FISH was used to visualize telomeres (red). Arrowheads point to telomeres co-localizing with p-NBS1S432. B. Localization of Flag-NBS1S433E on telomeres in WT MEFs treated with shTrf2, stained with anti-Flag antibody to visualize Flag-NBS1S433E (green), anti-Myc antibody to visualize Myc-MRE11 (red), DAPI to visualize nuclei (blue), and PNA-FISH to visualize telomeres (red). Arrowheads point to Flag-NBS1S432E co-localizing with Myc-MRE11 at dysfunctional telomeres. C, D. U2OS cells were transiently transfected with the indicated DNA constructs, fixed and stained with anti-p-NBS1S432 antibody to visualize endogenous p-NBS1 (red), GFP to visualize WT GFP-PNUTS or GFP-PNUTSW401A (green), anti-PP1-α antibody to visualize PP1-α (green), and anti-TRF2 antibody (blue) to visualize TRF2 (telomeres). White arrowheads point to phospho-NBS1S432 and WT GFP-PNUTS co-localizing with TRF2. Red arrowhead shows and GFP-PNUTSW401A co-localizing with TRF2, but phospho-NBS1S432 is not on telomeres. E. Quantification of percent of cells with ≥5 phospho-NBS1S432 positive foci in (C, D). F. Quantification of percent of cells expressing the indicated DNA constructs with telomere fusions. Data represents the mean of two independent experiments, with a minimum of 30 metaphases scored per experiment. ***: p<0.0005; one-way Anova. G. Cdk2+/+ or Cdk2−/− MEFs expressing either WT mNBS1 or mNBS1S433 mutants were infected with either control vector or shTrf2 for 120 h, after which metaphases were prepared and telomere fusions visualized by CO-FISH. FITC-OO-(TTAGGG)4 (green) was used to visualize the leading-strand and Tam-OO-(CCCTAA)4 (red) was used to visualize the lagging-strand. DAPI (blue) visualized chromosomes. Arrowheads point to fusion sites of a few fused chromosomes. H. Quantification of percentage of cells with telomere fusions in (G). Data represents the mean of two independent experiments, with a minimum of 40 metaphases scored per experiment. **: p<0.028; one-way Anova.
Supplementary Figure 6. Expression of de-phosphorylated mNBS1S433 mutants leads to increased HDR mediated chromosomal aberrations, Related to Figure 6. A Localization of WT mNBS1, mNBS1S433A and mNBS1AKA mutants in Nbs1−/− MEFs after removal of mPOT1/mTPP1 from telomeres using TPP1ΔRD. Telomeres were visualized with telomere PNA-FISH (red), anti-Flag antibody to visualize NBS1 (green) and DAPI staining to visualize nuclei (blue). Arrowheads point to NBS1 co-localizing with telomeres. B. Quantification of percent of cells with ≥ 5 NBS1 positive TIFs in (A). Data represents the mean of two independent experiments ± SEM; n>100 nuclei analyzed per experiment (**:p<0.005; one-way Anova). C. Quantification of chromosome aberrations of cells expressing the indicated DNAs. TDM: telomere double minute chromosomes, fusions: chromosome end-to-end fusions, ring; ring chromosomes. D. Quantification of T-SCEs in cells expressing the indicated DNAs. Data are the representative of the mean ±SEM from three independent experiments, with at least 40 metaphases scored per experiment. **: p<0.006, ***: p<0.0005; one-way Anova. E. Quantification of percent telomere fusions of cells expressing the indicated DNAs. Data represent the average of two independent experiments ± SEM, a minimum of 30 metaphases were examined per experiment **p<0.002; one-way Anova. F. Quantification of T-SCEs in Nbs1−/− MEFs expressing the indicated DNAs. Data represent the average of two independent experiments ± SEM. A minimum of 30 metaphases were examined per experiment. *: p<0.002; one-way Anova. G. Genomic DNA from Nbs1−/− MEFs expressing the indicated DNAs was fractionated with a clamped homogenous electric field (CHEF) gel, then in-gel hybridization was performed using a (CCCTAA)4 probe to detect the 3′ single-stranded (SS) overhang under native conditions (left) and under denatured condition to detect total TTAGGG repeats (right). Single strand G overhang and total telomere signals in the control was set at 100% after normalizing the lanes with a denatured subtelomeric fragment that served as an internal loading control. For quantification, we used native telomeric signals from the portions of the gel between the 23 kb and the 9.4 kb marks. The numbers below the gel represents normalized overhang signal as compared to control vector. H. Quantification of percentage of nuclei with ≥ 5 p-RPA positive TIFs in cells expressing the indicated DNAs. A minimum of 100 nuclei were scored per sample. I. Quantification of percent telomere fusions in cells expressing the indicated DNAs. Data represent the average of two independent experiments ± SEM, a minimum of 30 metaphases were examined per experiment.
Supplementary Figure 7. NBS1S433A recruits EXO1 to telomeres and promotes genome instability, Related to Figure 7. A. Quantification of percentage of cells containing chromosomal fusions. Fusions were visualized in Apollo/SNM1B−/− MEFs expressing the indicated DNAs. Data represent the average of two independent experiments ± SEM, and a minimum of 25 metaphases were examined per experiment. B. U2OS cells expressing either WT EXOI or the EXO14A mutant were stained for telomeres using PNA-FISH (red), anti-GFP antibody to visualize GFP-EXOI (green) and DAPI to visualize nuclei (blue). C. Quantification of percentage of cells containing ≥5 positive foci for both EXO1 and NBS1 (from Figure 7C). Data represent the average of two independent experiments, a minimum of 200 nuclei were examined per experiment. D. Telomere-telomere and telomere-DSB fusion phenotypes observed in cells of the indicated genotypes. Metaphases were prepared and telomere aberrations visualized by CO-FISH. FITC-OO-(TTAGGG)4 (green) was used to visualize the leading strand and Tam-OO-(CCCTAA)4 (red) was used to visualize the lagging strand and DAPI (blue) to label chromosomes. E. Quantification of number of interstitial telomeres per metaphase in WT and Nbs1−/− MEFs expressing the indicated DNAs observed in (D). A minimum of 30 metaphases were examined per experiment. F. Detection of anaphase bridges (AB, arrows) in Nbs1−/− MEFs expressing mNBS1S433A or mNBS1AKA and treated with mTPP1ΔRD. G. Quantification of percentage of cells containing anaphase bridges in E. Data represent the average of two independent experiments ± SEM, a minimum of 30 metaphases were examined per experiment.