Abstract
DNA methylation is a major epigenetic modification; however, the precise role of DNA methylation in vertebrate development is still not fully understood. Here, we show that DNA methylation is essential for the establishment of the left–right (LR) asymmetric body plan during vertebrate embryogenesis. Perturbation of DNA methylation by depletion of DNA methyltransferase 1 (dnmt1) or dnmt3bb.1 in zebrafish embryos leads to defects in dorsal forerunner cell (DFC) specification or collective migration, laterality organ malformation, and disruption of LR patterning. Knockdown of dnmt1 in Xenopus embryos also causes similar defects. Mechanistically, loss of dnmt1 function induces hypomethylation of the lefty2 gene enhancer and promotes lefty2 expression, which consequently represses Nodal signaling in zebrafish embryos. We also show that Dnmt3bb.1 regulates collective DFC migration through cadherin 1 (Cdh1). Taken together, our data uncover dynamic DNA methylation as an epigenetic mechanism to control LR determination during early embryogenesis in vertebrates.
Keywords: cell adhesion, DNA methylation, dorsal forerunner cells, left–right asymmetry, Nodal signaling
Subject Categories: Chromatin, Epigenetics, Genomics & Functional Genomics; Development & Differentiation; Signal Transduction
Introduction
DNA methylation is one of the major epigenetic modifications in vertebrates, which involves adding a methyl group to the 5th carbon of cytosine to form 5‐methylcytosine (5mC). 5mC is established and maintained by DNA methyltransferases (DNMT), which are classified into two groups, that is, maintenance DNMTs (Dnmt1) and “de novo” DNMTs (Dnmt3a and Dnmt3b) (Smith & Meissner, 2013). Genomewide 5mC mapping has implicated the role of DNA methylation during early embryogenesis in that DNMTs maintain the existing DNA methylation pattern to stabilize the genome integrity. In vertebrates, after fertilization, the embryo shows a relatively stable (in zebrafish) or low level (in mice) of DNA methylation before early cleavage stages, and then, the overall DNA methylation level gradually increases until gastrulation (Jiang et al, 2013; Potok et al, 2013; Wang et al, 2014). Various development processes including gastrulation and organogenesis occur after the cleavage stages (Kimelman, 2006). However, our knowledge on how DNA methylation regulates early embryonic development is still limited.
The body pattern determination is initiated during gastrulation, followed by organogenesis. The organs such as the heart, pancreas, liver, and intestines are then asymmetrically positioned within the body cavity. This left–right (LR) asymmetry is first established by symmetry breaking, and then followed by laterality organizer formation, that is, the node in mammals and the Kupffer's vesicle (KV) in zebrafish (Blum et al, 2014). The progenitor cells of KV are dorsal forerunner cells (DFCs), which arise from a subset of dorsal surface epithelial (DSE) cells at the sphere stage. The DFC cluster first appears adjacent to the embryonic shield, then migrates to the vegetal pole, and forms a rosette‐shaped structure, finally differentiates into ciliated epithelial cells of KV (Oteiza et al, 2008). Cilia in laterality organ generate directional fluid flow (i.e., Nodal flow), which thereby leads to asymmetric expression of genes such as Nodal gene (e.g., spaw in fish) and its targets (Matsui & Bessho, 2012; Blum et al, 2014). This asymmetric expression (usually left side‐specific expression of Nodal genes) directs internal organ primordium to position asymmetrically in later stages of development (Okada et al, 2005). Several signaling pathways, including Nodal, have been demonstrated to be critical in determining LR asymmetry during vertebrate embryogenesis (Burdine & Schier, 2000; Tanaka et al, 2005; Matsui & Bessho, 2012). However, very little is known about the role of epigenetic regulation in LR determination.
In this study, we demonstrate a critical role of DNA methylation in LR asymmetry in vertebrates including zebrafish and Xenopus. We show that loss of dnmt1 or dnmt3bb.1 disrupts laterality of organs including heart, pancreas, and liver. Mechanistically, hypomethylation of the lefty2 gene enhancer caused by loss of dnmt1 can promote lefty2 expression, which in turn inhibits Nodal signaling, therefore leading to impaired DFC specification and loss of LR asymmetry. In addition, Dnmt3bb.1 is required for cadherin 1 (cdh1)‐mediated DFC clustering to ensure proper LR determination. Our finding unravels a new layer of regulation involving dynamic DNA methylation in embryonic development in vertebrates.
Results
DNA methylation signal is enriched in the LR organizer
To explore a potential role of DNA methylation in gastrulation, we first knocked down dnmt1 by injecting dnmt1 antisense MOs into zebrafish embryos to reduce the global DNA methylation level as reported previously (Rai et al, 2006), and then performed MeDIP‐seq and RNA‐seq in control and dnmt1‐deficient embryos at early and late gastrulation stages, respectively. The overall methylation level in dnmt1‐deficient embryos was much lower than that in control embryos (Fig 1A and Appendix Fig S1). Consistently, differential methylation analysis showed that dnmt1‐deficient embryos had significantly more hypomethylated peaks (n = 1,715) than hypermethylated peaks (n = 284) (Fig 1B). Gene ontology (GO) analysis of genes with differentially methylated peaks in dnmt1‐deficient embryos revealed an enrichment of genes that are implicated in developmental processes, such as embryo development, pattern specification process, and cell fate commitment (Fig 1C). Notably, genes involved in determination of bilateral symmetry and LR asymmetry were also enriched (Table EV1), indicating a potential role of DNA methylation in this process. Consistently, GO analysis of RNA‐seq data showed that developmental process terms were highly enriched among the differentially expressed genes in dnmt1 morphants, such as determination of bilateral symmetry and pattern specification (Fig EV1A and B). To determine whether DNA methylation is directly involved in LR asymmetry determination, we examined the 5mC level in wild‐type embryos using immunofluorescence analysis. 5mC was readily detectable in sox17 + DFCs, the progenitor of KV, suggesting potential involvement of DNA methylation in LR determination (Fig 1D). We then investigated which DNMTs are likely to control this process. In zebrafish, there are eight DNMTs, including maintenance DNMT (Dnmt1), “de novo” DNMTs (Dnmt3a/b), and Dnmt2 (Campos et al, 2012). We examined the expression of Dnmt family genes in sox17 + DFCs and found that dnmt1, dnmt3bb.2, dnmt3bb.1, and dnmt3bb.3 were expressed at higher level in DFCs (Fig EV1C). Double fluorescence in situ analysis with the DFC marker, sox17, further showed that dnmt1 and dnmt3bb.1 were specifically enriched in KV and DFCs, respectively (Fig EV1D). Taken together, these data suggest that DNA methylation is possibly involved in LR asymmetry.
Figure 1. DNA methylation signal is enriched in Left–Right organizer.
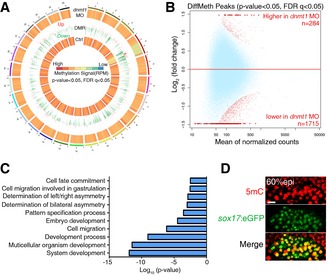
- Circos representation of genomewide DNA methylation level in control and dnmt1 morphants. Each chromosome is marked with different color. The central and outer circles indicate the methylation level in control and dnmt1‐deficient embryos, respectively. The middle circle displays distribution of DMRs. Decreased and upregulated DMRs in dnmt1‐deficient embryos are indicated in green and red, respectively. P < 0.05, FDR q < 0.05.
- Differentially methylated peaks in control and dnmt1 morphants. P < 0.05, FDR q < 0.05.
- Gene ontology analysis of genes with DMRs in dnmt1 morphants.
- Immunofluorescence of 5mC at 60% epi stage in Tg(sox17:eGFP) embryos. Scale bar, 20 μm.
Figure EV1. DNA methyltransferases expressed in LR organizer.
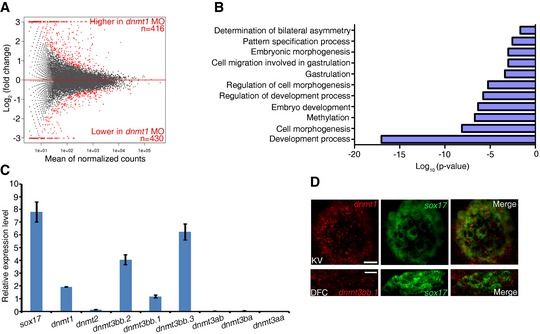
- Differentially expressed genes in dnmt1 morphants (P < 0.05).
- Representative GO terms enriched in differentially expressed genes in dnmt1 morphants.
- Expression level of DNA methyltransferases in DFCs. Error bars, mean ± SD, n = 3 technical replicates. Student's t‐test.
- Double FISH revealed that dnmt1 and dnmt3bb.1 are co‐expressed with sox17 in KV and DFC region. Scale bar, 20 μm.
DNA methylation is required for LR determination
To investigate whether DNA methylation can modulate LR patterning directly, we injected dnmt1 MO or dnmt3bb.1 MO into the yolk at the 512‐cell stage as demonstrated previously (Amack & Yost, 2004), to block translation of endogenous dnmt1 or dnmt3bb.1 specifically in DFCs. The efficacy of the dnmt1 translation‐blocking MO (atgMO) or dnmt3bb.1 MO (atgMO) was validated using Western blotting or co‐injection with an EGFP plasmid reporter (due to lack of Dnmt3b‐specific antibody in zebrafish) (Fig EV2A and Appendix Fig S2). Knockdown of dnmt1 or dnmt3bb.1 did not cause any defects during early gastrulation (data not shown). Then, we examined the knockdown effects on organ laterality. During zebrafish embryogenesis, the initially midline‐positioned heart tube undergoes a leftward jogging at 28 h post‐fertilization (hpf) (Stainier, 2001). In dnmt1‐deficient embryos, we observed abnormal cardiac jogging, including rightward and middling looping by detecting nkx2.5 expression and visualizing heart position in cmlc2:GFP transgenic embryos at 30 hpf (Fig 2A). To test the specificity of dnmt1 MO, we generated dnmt1 mis‐mRNA (with the mutated atgMO target sequence without changing amino acid coding) and co‐injected it with dnmt1 MO into the 1‐cell stage embryos. Western blotting results showed that dnmt1 mis‐mRNA can efficiently restore Dnmt1 expression in dnmt1 morphants (Fig EV2A). As expected, overexpression of dnmt1 mis‐mRNA restored the randomized organ laterality in dnmt1 morphants (Fig EV2B). Furthermore, a dnmt1 splice‐blocking MO was also used, and its specificity was validated by Western blotting (Fig EV2C). The abnormal cardiac jogging was also found in embryos injected with dnmt1 splice MO (Fig EV2D), supporting that the disrupted organ laterality was caused by dnmt1 knockdown specifically. To further confirm these results, we outcrossed the dnmt1 mutant (dnmt1 s872) with Tg(fabp10:dsRed, ela3l:GFP)gz12; Tg(ins:dsRed)m1081 to examine the organ laterality (Anderson et al, 2009). Because of the maternal expression of dnmt1, the mutant appeared morphologically normal in comparison with the wild type and heterozygotes (Fig EV2E). Therefore, a low dose of dnmt1 MO was injected into 1‐cell stage embryos including homozygous mutants, wild‐type and heterozygous siblings to block the maternal expression of dnmt1. The results showed that a low dose of MO injection failed to affect organ laterality in wild type and heterozygotes, while the injected homozygous mutant exhibited randomized liver and pancreas (Fig EV2E). Collectively, these data support a critical role of dnmt1 in LR asymmetry.
Figure EV2. Deficiency of dnmt1 or dnmt3bb.1 causes defects of organ patterning and DFC development.
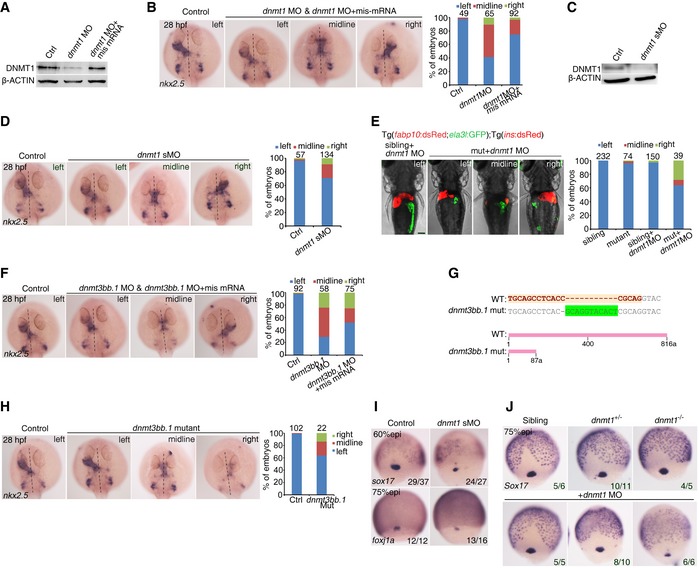
- Protein level of Dnmt1 in the control, dnmt1 morphants, dnmt1 MO and mis‐mRNA‐co‐injected embryos at 75% epi stage by Western blotting.
- Representative images showing heart asymmetry labeled by nkx2.5 at 30 hpf (left panel) with quantification (right panel).
- Western blotting analysis of Dnmt1 in the control and dnmt1 splice MO‐injected embryos at 75% epi stage.
- Representative images showing heart asymmetry labeled by nkx2.5 at 30 hpf (left panel) with quantification (right panel).
- Representative images showing pattern of liver and pancreas in Tg(fabp10:dsRed; ela3l:GFP); Tg(ins:dsRED) embryos at 4 dpf (left panel) with quantification (right panel). Scale bar, 100 μm.
- Representative images showing nkx2.5 expression at 30 hpf in control, dnmt3bb.1 morphants and dnmt3bb.1 mis‐mRNA‐rescued embryos (left panel) with quantification (right panel).
- Generation of dnmt3bb.1 mutant using the CRISPR/Cas9 technique.
- Representative images showing nkx2.5 expression at 30 hpf in control, dnmt3bb.1 mutants (left panel) with quantification (right panel).
- The expression of foxj1a and sox17 in DFCs at 75% epi stage in control and embryos injected with dnmt1 splice MO.
- The expression of sox17 in DFCs at 75% epi stage was reduced in dnmt1 homozygous mutant injected with a lose‐dose dnmt1 MO.
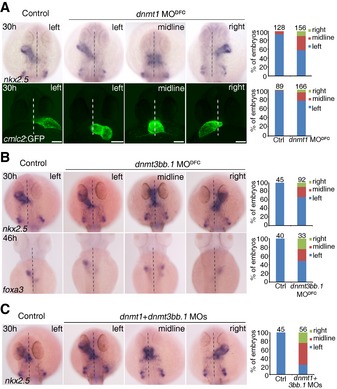
Figure 2. Defects in LR determination in Dnmt morphants.
-
A–CRepresentative images showing nkx2.5 expression in the heart at 30 hpf, foxa3 expression in visceral organs at 46 hpf or heart looping at 30 hpf using Tg(cmlc2: GFP) embryos (bottom panel) in control and DFC‐specific‐deficient embryos. Statistical analysis is shown on the right with the total observed number of embryos indicated above each bar. Effects of DFC‐specific dnmt1 (A), dnmt3bb.1 (B), and dnmt1 + dnmt3bb.1 (C) knockdown on organ laterality. Scale bar, 100 μm. Dashed lines denote the embryonic midline.
Interestingly, dnmt3bb.1 MODFC embryos also showed abnormal laterality based on examination of the cardiac marker nkx2.5 at 30 hpf and the liver/pancreas marker, foxa3 at 46 hpf (Fig 2B), and the modified dnmt3bb.1 mRNA (dnmt3bb.1 mis‐mRNA) injection can partially restore this abnormal laterality (Fig EV2F). To further confirm these results, we next generated a dnmt3bb.1 null mutant with an 11‐bp insertion in the third exon (236 bp after the start codon) using the CRISPR/Cas9 technique (Fig EV2G). We found that the cardiac jogging was also disturbed in dnmt3bb.1 mutant (Fig EV2H), indicating an important role of dnmt3bb.1 in LR development.
Since both dnmt1 and dnmt3bb.1 are required for LR patterning, we next investigated whether the LR defects would be more severe in double‐knockdown embryos. Examination of nkx2.5 at 30 hpf indeed revealed more severe abnormal laterality (37 out of 56 embryos) in embryos co‐injected with dnmt1 and dnmt3bb.1 MOs (Fig 2C), compared to individual morphants (Fig 2A and B). Together, these results demonstrate that DNA methylation is required for organ laterality in zebrafish.
Dnmt1 modulates DFC specification and KV formation
Previous studies in vertebrates including zebrafish, Xenopus, chicken and mice have demonstrated that organ laterality is regulated by asymmetric expression of LR genes (Hamada et al, 2002; Long et al, 2003). We thus analyzed the early asymmetric marker, southpaw (spaw, the Nodal‐related gene in zebrafish), and its downstream target gene lefty2. Normally, spaw is expressed in the left lateral plate mesoderm (LPM), while lefty2 is expressed in the anterior LPM at late somitogenesis and later on in the heart primordium on the left side of embryo. Knockdown of dnmt1 resulted in the randomized expression pattern of spaw and lefty2 (Appendix Fig S3). Given that the asymmetric gene expression is induced by the laterality organizer, we then examined the LR organizer, KV, including organizer formation and ciliogenesis at earlier stages. Live imaging of Tg(sox17:eGFP) embryos and immunofluorescence staining using anti‐acetylated tubulin showed that dnmt1 deficiency led to the disrupted lumen formation as well as the decrease in the number and length of primary cilia in the KV (Fig 3A and B). Ciliated epithelial cells of the KV generate the leftward Nodal flow, which is required for LR patterning (Hamada et al, 2002). We found that directional KV fluid flow was also disrupted in dnmt1 morphants (Fig 3C and Movies EV1 and EV2), indicating malformed KV function. Together, these results indicate the requirement of Dnmt1 for KV formation and ciliogenesis.
Figure 3. Dnmt1 modulates KV formation and DFC specification.
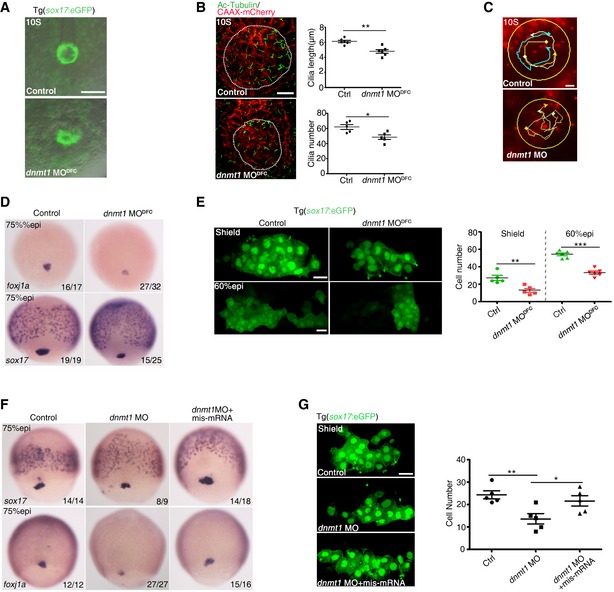
- Live imaging of KV in Tg(sox17:eGFP) embryo. Scale bar, 100 μm.
- Confocal images of cilia immunostained with Ac‐tubulin and cell membrane labeled with exogenous CAAX‐mCherry in KV region (dashed circles). Right panel shows quantification analysis of cilia number and length. Scale bar, 20 μm.
- KV fluid flow in control embryos and dnmt1 morphants with bead tracks. Yellow circles denote KV region. Scale bar, 50 μm.
- Expression of foxj1a and sox17 in DFCs in control‐ and dnmt1‐deficient embryos.
- DFCs were visualized at shield and 60% epi stage in Tg(sox17:eGFP) embryos (left panel). The right panel shows quantification analysis of cell number. Scale bar, 20 μm.
- Injection of dnmt1 mis‐mRNA restored the reduced expression of sox17 and foxj1a in dnmt1 morphants.
- Visualization of DFCs at 75% epi stage in Tg(sox17:eGFP) embryos showing that overexpression of dnmt1 mis‐mRNA restored the number of DFCs in dnmt1 morphants (left panel) with quantification (right panel). Scale bar, 20 μm.
To investigate whether DNA methylation affects LR patterning through regulation of DFC specification, we examined the expression of early markers specific for DFC fate specification (sox17) and differentiation (foxj1a), respectively. The expression of these two genes was decreased in dnmt1 MODFC embryos and in dnmt1 splice MO‐injected embryos (Figs 3D and EV2I). Furthermore, the number of sox17:eGFP‐labeled DFCs at shield and 60% epiboly (epi) stages was significantly reduced in dnmt1 morphants (Fig 3E), indicating that both DFC specification and the cell number were affected by dnmt1 knockdown. TUNEL assay showed more apoptosis in the DFCs of dnmt1 morphants, compared to controls, whereas there was no discernable difference on the cell proliferation in DFCs (Appendix Fig S4A and B). In addition, overexpression of dnmt1 mis‐mRNA efficiently rescued the reduced expression of sox17 and foxj1a as well as the number of DFCs at shield stage in dnmt1 MO‐injected embryos (Fig 3F and G). Given there were no obvious differences in the expression of sox17 in DFCs among embryos from dnmt1 heterozygous carrier fish, we then used a low dose of dnmt1 MO injection. As a result, we found a significantly reduced sox17 expression in homozygous mutant but not in wild‐type sibling or heterozygous embryos (Fig EV2J). Collectively, these data suggest that dnmt1 affects LR asymmetry through modulating DFC specification and KV formation.
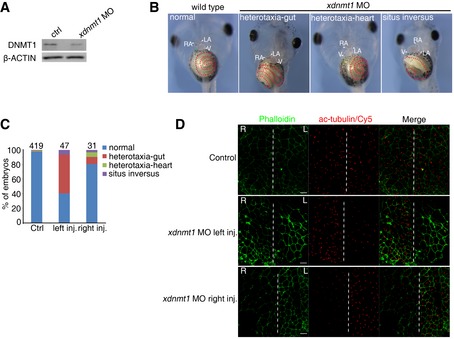
Next, to determine whether regulation of LR asymmetry by dnmt1 is conserved across vertebrates, we used Xenopus, a well‐established model for LR asymmetry studies (Blum et al, 2009). We injected 15–30 ng of xdnmt1 MO (Dunican et al, 2008) into one dorsal blastomere of Xenopus embryos at the 4‐cell stage and validated its efficiency using Western blotting (Fig EV3A). Examination of the heart and gut looping at the tadpole stage showed that about 60% of xdnmt1 MO‐injected embryos (27 out of 47 embryos) exhibited heterotaxia or situs inversus, suggesting a conserved and gene‐specific effect of dnmt1 on the LR patterning in Xenopus (Fig EV3B and C). Accordingly, we examined the cilia in gastrocoel roof plate (GRP), the LR organizer of Xenopus, by anti‐acetylated tubulin staining. The number of acetylated tubulin‐positive cilia was decreased on the side that received the xdnmt1 MO injection, but not on the non‐injected side that served as control (Fig EV3D). Collectively, these results demonstrate that DNA methylation is a conserved regulatory mechanism during LR asymmetry determination in vertebrates.
Figure EV3. Knockdown of dnmt1 in Xenopus disrupts left–right asymmetry and ciliogenesis.
-
AWestern blotting analysis showing the protein level of DNMT1 in the control and xdnmt1 morphants at stage 45.
-
B, CRepresentative imaging showing heart and gut looping in Xenopus embryos at stage 45 (B) with quantification (C). (B) The white and red dashed lines mark heart and gut, respectively.
-
DVisualization of cilia in GRP using anti‐acetylated tubulin immunofluorescence with gastrocoel roof cells labeled by Alexa488‐phalloidin staining, showing that the cilia length and number were decreased on the side that received the xdnmt1 MO injection, but not on the uninjected side. Scale bar, 20 μm.
Source data are available online for this figure.
Lefty2 mediates DFC specification downstream of Dnmt1
Our results above reveal an epigenetic regulation of DFC formation by DNA methylation. Numerous studies have demonstrated that the Nodal signaling pathway plays crucial roles in the process of DFC formation, whereas the number of DFCs increases or decreases in response to the enhanced or reduced Nodal signaling, respectively (Schier & Talbot, 2005). As a repressor of Nodal signaling, the elevated lefty2 expression leads to reduced number of DFCs (Choi et al, 2007; Oteiza et al, 2008). Since the morphological patterning defects of DFCs observed in dnmt1‐deficient embryos resemble those of lefty2‐mRNA‐injected embryos (Oteiza et al, 2008), we next analyzed lefty2 expression in dnmt1‐deficient embryos to test whether dnmt1 affects DFC formation through altering lefty2 expression. Whole‐mount in situ hybridization (WISH) analysis confirmed that the expression of lefty2 was markedly increased at 60% epi and 75% epi stages in dnmt1‐deficient embryos (Fig EV4A). Similarly, qPCR analysis also confirmed a significant increase of lefty2 expression upon dnmt1 knockdown in manually dissected sox17:eGFP+ DFCs (Figs 4A and EV4B). Double fluorescence in situ hybridization using Tg(sox17:eGFP) showed that lefty2 expression in DFCs was obviously increased upon dnmt1 deficiency (Fig 4B). We also evaluated the expression of Nodal target genes in DFCs. The qPCR analysis showed that the mRNA levels of these Nodal‐regulated genes (chd, ntl, dkk1b, dusp6, gata5, id3, pitx2a, and fgf8) were decreased in dnmt1 morphants (Fig 4C). To test whether overexpression of lefty2 alone can mimic the defects of DFC specification observed in dnmt1 morphants, we injected lefty2‐mRNA into sox17:eGFP transgenic embryos at 1‐cell stage. As expected, overexpression of lefty2 decreased the number of DFCs in a dose‐dependent manner (Fig EV4C).
Figure EV4. lefty2 deficiency rescues DFC specification defects through restoration of Nodal signaling.
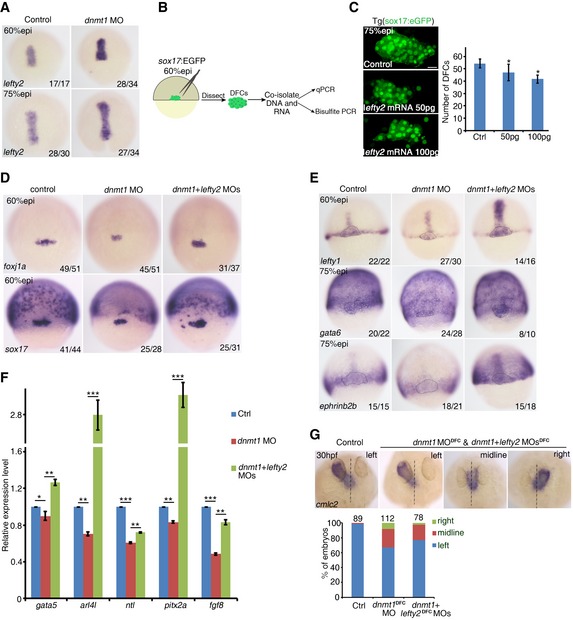
- The expression of lefty2 at 60% epi and 75% epi stage in dnmt1‐deficient embryos was upregulated, compared to control embryos.
- Schematic diagram showing the experimental procedure for the isolation of GFP‐positive DFCs from sox17:GFP transgenic zebrafish and using DNA and RNA extracted from these DFCs for bisulfite PCR or qPCR.
- lefty2 mRNA overexpression decreased the number of sox17 + DFCs at 75% epi stage. Scale bar, 20 μm.
- The reduced expression of foxj1a and sox17 at 60% epi in dnmt1 morphants was restored by lefty2‐MO co‐injection.
- lefty2 MO partially rescued the reduced expression of lefty1, gata6 and ephrinb2b in DFCs of dnmt1 morphants. The dotted black outlines denote DFC region.
- qPCR analysis of Nodal target genes in control embryos, dnmt1 morphants, and dnmt1 morphants co‐injected with lefty2 MO.
- Representative images showing heart pattern labeled by cmlc2 at 30 hpf (upper panel) with quantification (lower panel).
Figure 4. Lefty2 mediates Dnmt1 regulation of DFC specification.
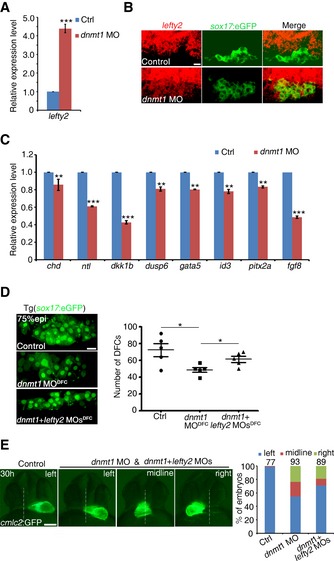
- qPCR analysis of lefty2 expression in DFCs in control and dnmt1 MO‐injected embryos.
- FISH analysis using Tg(sox17:eGFP) showing that lefty2 expression in DFCs was increased upon dnmt1 deficiency. Scale bar, 20 μm.
- qPCR analysis of Nodal target genes (chd, ntl, dkk1b, dusp6, gata5, id3, pitx2a, fgf8) in DFCs.
- Visualization of sox17 + DFCs in control embryos, dnmt1 MODFC‐ and dnmt1 + lefty2 MODFC‐injected embryos (left panel) with quantification (right panel). Scale bar, 20 μm.
- Representative heart looping pattern in Tg(cmlc2:GFP) embryos at 30 hpf (left panel) and statistical analysis is shown on the right with the total observed number of embryos indicated above each bar. Scale bar, 100 μm.
Next, we tested whether decreasing lefty2 expression would rescue the LR defects in dnmt1 morphants. Single lefty2 MO injection into wild‐type embryos did not result in any laterality defects; however, co‐injection of dnmt1 and lefty2 MOs led to restoration of sox17 and foxj1a expression and the number of DFCs (Figs 4D and EV4D). A significant restoration of Nodal target gene expression was also observed in co‐injected embryos (Fig EV4E and F). Moreover, the proportion of embryos with normal heart looping was increased, compared to dnmt1 morphants and dnmt1 DFC‐injected embryos (Figs 4E and EV4G). Taken together, these results demonstrate that Dnmt1 regulates LR asymmetry through Lefty2‐mediated DFC specification.
Dnmt1 represses the expression of lefty2 through DNA methylation
To verify whether lefty2 expression alteration in dnmt1 morphants was directly regulated by DNA methylation. Gene‐specific inspection of MeDIP data revealed a region with decreased DNA methylation at the lefty2 enhancer in dnmt1‐deficient embryos (Fig 5A). To determine the regulatory potential of this enhancer in vivo, we generated an EGFP reporter construct which contains the lefty2 enhancer and heat‐shock protein 70 minimal promoter for a transient expression assay. Consequently, this enhancer construct appeared to fully recapitulate the endogenous lefty2 expression at gastrulation stage (Fig 5B). Direct sequencing of PCR amplicons from bisulfite‐treated DNA of DFCs (Fig EV4B) confirmed the reduced methylation in the lefty2 enhancer region in dnmt1‐deficient DFCs (Fig 5C). Importantly, the lefty2 reporter activity was further increased at 90% epi stage upon dnmt1 knockdown (Fig 5D). Collectively, these data demonstrate that lefty2 is a direct target of Dnmt1 in DFC specification and its upregulation due to enhancer hypomethylation is responsible for the observed DFC and LR defects in dnmt1‐deficient embryos.
Figure 5. Dnmt1 represses the expression of lefty2 through DNA methylation.
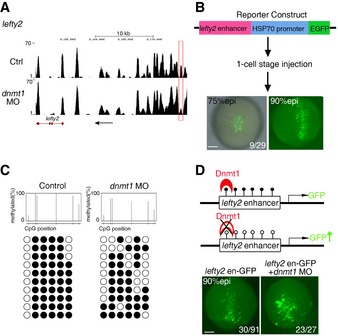
- MeDIP analysis revealing reduced methylation of an adjacent promoter or distal enhancer of lefty2. Red square marks the different region between control and dnmt1 morphants. The black arrow denotes the transcription direction of lefty2.
- Brief diagram of lefty2 enhancer reporter construct and its activity at gastrulation stages. The number shows the embryos with specific GFP expression in DFC region out of GFP+ embryos. Scale bar, 100 μm.
- Bisulfite sequencing analysis of DNA methylation at the lefty2 enhancer (Chr17:8,173,572‐Chr17:8,173,845) in DNA isolated from control and dnmt1 MO‐injected DFCs.
- Activity analysis of lefty2 enhancer indicating increased GFP expression upon dnmt1 deficiency at 90% epi stage. The numbers show embryos with specific GFP expression in DFC region out of GFP+ embryos (left panel) or embryos with enhanced GFP out of total embryos with DFC‐specific GFP expression (right panel). Scale bar, 100 μm.
Dnmt3bb.1 regulates collective DFC migration through Cdh1‐mediated cell adhesion
Since dnmt3bb.1 knockdown also caused LR defects, we next sought to explore how dnmt3bb.1 regulates this process mechanistically. Interestingly, we found that the DFC cluster was less cohesive as manifested by scattered expression patterns of foxj1a and sox17 in dnmt3bb.1 MODFC embryos and in dnmt3bb.1 mutant (Figs 6A and EV5A), but the total number of DFCs appeared to remain unchanged (Fig 6B), which was very different from that observed in dnmt1‐deficient embryos. Moreover, overexpression of dnmt3bb.1 mis‐mRNA partially restored the disrupted DFC clustering in dnmt3bb.1 morphants (Fig 6C). These results indicate that DFC clustering is disrupted by dnmt3bb.1 deficiency. Disaggregation of DFCs suggests a possible involvement of cell adhesion in DFC clustering (Matsui et al, 2011, 2015). Previous studies have shown that a tight and stable cluster of DFCs is essential for KV ciliogenesis and LR patterning in zebrafish (Oteiza et al, 2010; Matsui et al, 2011; Zhang et al, 2016). Cdh1‐mediated cell adhesion between adjacent DFCs facilitates cell cluster formation, while DFC‐specific knockdown of cdh1 leads to the broken‐up DFC phenotype (Matsui et al, 2011), similar to what we observed in dnmt3bb.1‐deficient embryos. qPCR analysis showed that the expression of cdh1 in the dissected sox17 + DFCs of dnmt3bb.1‐deficient embryos was significantly decreased (Fig 6D). Phalloidin staining analysis showed altered features of actin filament and local membrane characteristics, upon dnmt3bb.1 knockdown (Fig 6E). Consistently, cdh1 knockdown specifically in DFCs also caused defects including disrupted actin filament, disaggregation of DFCs as well as the randomized heart positioning, based on expression patterns of sox17 and foxj1a in DFCs and the cmlc2:GFP fluorescence imaging, respectively (Fig 6F and G). Together, these results indicate that Dnmt3bb.1 regulates the cell adhesion of DFCs most likely via cdh1. To verify the causal relationship between Dnmt3bb.1 and cdh1, we performed rescue experiments using sox17 and nkx2.5 as phenotypic readouts. Overexpression of human cdh1 partially rescued the disrupted DFC clustering and laterality defects in dnmt3bb.1 morphants (Fig 6H and I). Together, these results demonstrate that Dnmt3bb.1 regulates LR asymmetry through Cdh1‐mediated cell adhesion of DFCs.
Figure 6. Dnmt3bb.1 regulates DFC clustering through cdh1‐mediated cell adhesion.
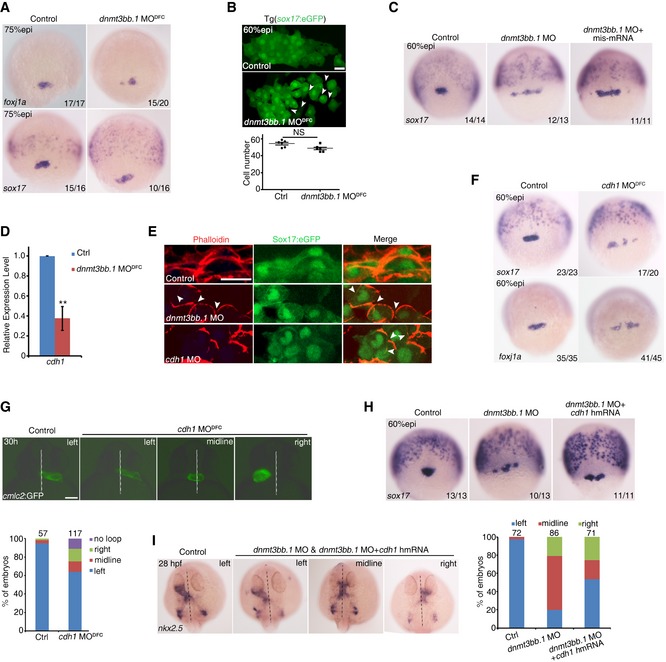
- Expression of foxj1a and sox17 in DFCs in control and dnmt3bb.1 MODFC‐injected embryos.
- Visualization of sox17 + DFCs at 60% epi stage in control and dnmt3bb.1 MODFC‐injected embryos (upper panel) and analysis of cell number (lower panel). Scale bar, 20 μm. The arrowheads denote the disrupted cell‐cell contact between DFCs.
- Injection of dnmt3bb.1 mis‐mRNA restored the disrupted sox17 expression in dnmt3bb.1 morphants.
- qPCR analysis of cdh1 expression in DFCs in control and dnmt3bb.1 MODFC‐injected embryos.
- F‐actin of DFCs labeled by phalloidin showing the defects in actin filament and local membrane in dnmt3bb.1 and cdh1 morphants, compared with control embryos. Scale bar, 20 μm. The arrowheads denote the disrupted local membrane.
- Reduced expression of foxj1a and sox17 in DFCs at 75% epi stage in cdh1 MODFC‐injected embryos.
- Representative heart looping pattern in Tg(cmlc2:GFP) embryos at 30 hpf. Statistical analysis is shown below with the total observed number of embryos indicated above each bar. Scale bar, 100 μm.
- Human cdh1 mRNA injection could restore the disrupted sox17 expression in dnmt3bb.1 MO‐injected embryos.
- Representative heart looping pattern labeled with nkx2.5 at 28 hpf (left panel). Statistical analysis is shown on the right with the total observed number of embryos indicated above each bar.
Figure EV5. Deficiency of DFC development in dnmt3bb.1 mutant and dnmt1 + dnmt3bb.1 double‐deficient embryos.
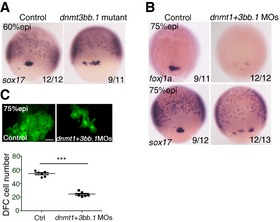
- The expression of sox17 in DFCs at 75% epi stage was disrupted in dnmt3bb.1 mutant embryos.
- The expression of foxj1a and sox17 in DFCs in dnmt1 + 3bb.1 MO‐injected embryos at 75% epi stage.
- DFCs were visualized at 60% epi stage in Tg(sox17:eGFP) zebrafish embryos injected with control MO or dnmt1 + 3bb.1 MOs (upper panel) with quantification (lower panel). Data are shown as mean ± SD. ***P < 0.001. Scale bar, 20 μm. n ≥ 5 embryos per experiment and n ≥ 2 technical replicates. Student's t‐test.
Our results above indicate that DNA methylation is essential for DFC cluster development. In particular, Dnmt1 regulates the specification of DFCs whereas Dnmt3bb.1 modulates the cohesiveness of DFCs. Examination of DFC cluster in dnmt1 + dnmt3bb.1‐deficient embryos showed more severely decreased expression of sox17 and foxj1a and the reduced number of sox17 + cells, indicating that both the cell fate specification and total cell number of DFCs were affected (Fig EV5B and C). To further confirm these results, we used a well‐studied DNA methylation inhibitor, 5‐aza‐2′‐deoxycytidine (5‐AZA) (Ghoshal et al, 2005), to treat embryos from the sphere stage to the shield stage, and then examined the expression of sox17 and foxj1a at shield stage or at 90% epi stage, respectively. 5‐AZA‐treated embryos showed impaired DFCs (Appendix Fig S5A and B), similar to dnmt1 + dnmt3bb.1 double‐knockdown embryos (Fig EV5B and C). Additionally, qPCR results showed that the expression of lefty2 was upregulated, while cdh1 expression was decreased in 5‐AZA‐treated embryos (Appendix Fig S5C), consistent with the MO‐injection results. Together, these data demonstrate that DNA methylation is required for DFC cluster development.
Discussion
The role of DNA methylation during vertebrate embryogenesis remains largely unclear. Our study demonstrates a critical function of DNA methylation in regulation of LR determination during early embryogenesis in vertebrates. We revealed abnormal organ laterality, DFC and KV malformation when DNA methylation level was attenuated. Mechanistically, Dnmt1 directly acts on the enhancer of lefty2 to fine‐tune the level of Nodal signaling and thus modulates DFC specification, while Dnmt3bb.1 is involved in cdh1‐mediated DFC cohesiveness to ensure LR asymmetry (Fig 7). These findings provide direct evidence for requirements of DNA methylation in the body plan formation during early embryogenesis in vertebrates.
Figure 7. Model for regulation of LR asymmetry by DNA methylation during embryogenesis in vertebrates.
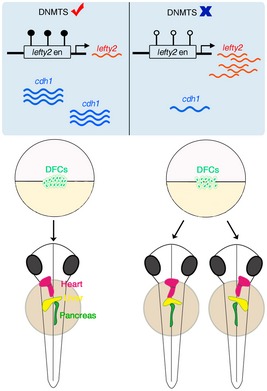
In the presence of DNMTs, the expression of lefty2 and cdh1 is tightly controlled to ensure normal LR asymmetry. In the absence of DNMTs, the expression of lefty2 and cdh1 is dysregulated due to hypomethylation, thereby causing abnormal LR asymmetry.
Previous studies have demonstrated the role of DNA methylation during zygotic gene activation after fertilization in vertebrates, including zebrafish, mice, and humans (Jiang et al, 2013; Potok et al, 2013; Guo et al, 2014; Wang et al, 2014). The methylation level appears to be stable (in fish) or decreased (in mice) in early cleavage stages of embryos compared to the predicted level in zygote, then increases gradually upon gastrulation (Jiang et al, 2013; Potok et al, 2013; Wang et al, 2014). Early developmental stages including blastula/morula and gastrulation are critical for the body plan determination, such as the formation of three germ layers and establishment of body axis (Tam & Loebel, 2007). Whether DNA methylation is directly involved in these development processes remains unclear. A recent study reported that Tet‐mediated DNA demethylation modulates Lefty‐Nodal signaling during gastrulation and Dnmt3a/b acts antagonistically to regulate the DNA methylation level of Lefty genes in this process (Dai et al, 2016). In our work, we reveal that DNA methytransferase1, Dnmt1, directly regulates lefty2 expression to maintain the balanced Nodal signaling during DFC specification, which is an important pattern specification process during gastrulation, whereas another methyltransferase, Dnmt3bb.1, can target cdh1‐mediated collective DFC migration at the onset of LR determination. Therefore, our work in zebrafish and the work by Dai et al in mice together reveal that dynamic DNA methylation and demethylation are crucial to modulating key signaling pathway during early development from different aspects.
Laterality determination of the vertebrate body plan critically depends on a transient embryonic ciliated organ (Nonaka et al, 1998; McGrath et al, 2003). Previous studies have demonstrated the evolutionary conservation of laterality organ formation via internalization of DSEs (Kinder et al, 2001; Hirokawa et al, 2006; Blum et al, 2007; Schweickert et al, 2007; Oteiza et al, 2008). In zebrafish, the ingressed DSEs firstly undergo Nodal signaling‐dependent conversion into DFCs, which are the precursors of KV. DFC specification is considered as the initial step of vertebrate laterality organ formation (Oteiza et al, 2008). Aberrant development of DFCs would cause reduced KV size, abnormal ciliogenesis, and randomized organ laterality. The molecular mechanisms involved in the specification and formation of DFCs from DSE cells are still poorly understood. Furthermore, DFC clustering and migration are also essential for normal LR asymmetry (Matsui et al, 2015), through the cell–cell junction and cell adhesion. Our findings support that DNA methylation mediated by Dnmt1 and Dnmt3bb.1, respectively, modulates the successive steps from the DFC specification, clustering, and migration, to the final organ laterality.
In summary, our studies indicate that DNA methylation‐mediated epigenetic modification maintains DFC specification at the onset of gastrulation and determines LR asymmetry, through direct regulation of Nodal signaling. We also show that cdh1‐mediated cell adhesion during DFC cluster migration is also regulated by DNA methylation as well. Heterotaxia is a group of congenital disorders characterized by a misplacement of one or more internal organs across the LR axis (Peeters & Devriendt, 2006). Given than genetic mechanisms underlying LR asymmetry are well conserved in vertebrates, including humans, a better understanding of regulatory mechanisms of LR asymmetry may contribute to therapies of heterotaxia‐related diseases in the clinic.
Materials and Methods
Zebrafish strains and husbandry
Zebrafish strain including AB, Tg(sox17:eGFP) (Chung & Stainier, 2008), Tg(fabp10:dsRed, ela3l:GFP)gz12; Tg(ins:dsRed)m1081 (Farooq et al, 2008), dnmt1 s872 (Anderson et al, 2009), and Tg(cmlc2:GFP) transgenic lines were raised and maintained at 28.5°C in system water and staged at previously described (Kimmel et al, 1995). This study was approved by the Ethical Review Committee of Institute of Zoology, Chinese Academy of Sciences, China.
Xenopus embryos and morpholino
Xenopus eggs and embryos were staged and handled according to standard protocols (Ruzov et al, 2004). xdnmt1 MO (GGACAGGCGTGAAACAGACTCGGC) was injected into blastomere of Xenopus 4‐cell stage embryos and examined at desired stage (Dunican et al, 2008). The GRP was isolated from the embryos at st18 for immunofluorescence of anti‐acetylated tubulin. This study was approved by the Ethical Review Committee of Institute of Zoology, Chinese Academy of Sciences, China.
Zebrafish morpholinos and mRNA injection
The following antisense morpholino oligonucleotides (MOs) were used:
dnmt1 MO (ACAATGAGGTCTTGGTAGGCATTTC) (Rai et al, 2006);
dnmt1 spliceMO (AGGTCTTGGTAGGCATTTCAAGTTC (This work);
dnmt3bb.1 MO (TTATTTCTTCCTTCCTCATCCTGTC) (Shimoda et al, 2005);
lefty2 MO (CAGCTGGATGAACAGAGCCATGCTC) (Feldman et al, 2002);
cdh1 MO (TAAATCGCAGCTCTTCCTTCCAACG) (Schotz et al, 2008);
1‐cell injection and yolk syncytial layer (YSL) injection were performed at 1‐cell stage or approximately the 512‐cell stage, respectively (Amack & Yost, 2004).
Whole‐mount in situ hybridization and double fluorescence in situ hybridization
Whole‐mount in situ hybridization with zebrafish embryos was performed as described previously with probes, including nkx2.5, cmlc2, foxa3, lefty1, lefty2, southpaw, sox17, foxj1a, ephrinb2b, gata6, and dnmt1 (Wang et al, 2013; Wei et al, 2014).
Whole‐mount immunofluorescence assay and Western blotting
Whole‐mount immunofluorescence was performed as described previously (Wang et al, 2013). The following primary antibodies for immunofluorescence were used: anti‐5mC (Active Motif, 39649, 1:500), anti‐acetylated tubulin (Sigma T6451, 1:500), phospho‐histone H3 (Cell Signaling Technology, 9701S, 1:300). Secondary antibodies were Alexa Fluor 488‐ or 543‐conjugated anti‐mouse or anti‐rabbit IgG. For imaging, the region of DFCs or KV was dissected, embedded in the mounting medium, and was observed using Nikon A1 confocal microscope. Western blotting was performed as previously reported (Wang et al, 2013) using anti‐Dnmt1 (Santa Cruz Biotechnology, sc‐20701, 1:300).
Enhancer construct and reporter assay
The lefty2 enhancer (Chr17:8,173,572‐Chr17:8,173,845) was amplified from zebrafish genomic DNA and linked with the heat‐shock protein 70 minimal promoter, then inserted into EGFP reporter vector (pT2AL‐EGFP). This construct was injected zebrafish embryos at 1‐cell stage and examined at gastrulation stage using fluorescence microscope (Nikon).
Live imaging and KV fluid flow tracking
Tg(sox17:eGFP) embryos at a desired stage were manually dechorionated and mounted in 1% low‐melting‐point agarose. Microscopy was then performed with Nikon or Nikon A1 confocal microscope. To visualize Nodal flow in KV, fluorescent beads of 0.5 μm diameter (Polysciences) were injected into KVs of dechorionated embryos at the 5‐somite stage. The embryos at the 10‐somite stage were mounted in 1% low‐melting‐point agarose. The movement of beads was recorded using fluorescence microscope (Leica).
RNA isolation, cDNA synthesis, qPCR
GFP+ DFCs were dissected from Tg(sox17:eGFP) embryos at 75% epi stage using tweezers, and total RNAs were extracted with TRIzol and glycogen, and then, equal amounts of RNA were reversely transcribed and amplified as previously described (Chen et al, 2017). The resulting cDNA was used for qPCR using SYBRGreen PCR mixture on a CFX96 Real Time PCR system (Bio‐Rad).
Genomic DNA isolation, bisulfite conversion, and sequencing
Appropriate DFCs were directly digested in digestion buffer with proteinase K using EZ DNA Methylation‐Direct kit from Zymo research. Then, digested material was bisulfite‐converted following manual instructions. Bisulfite‐converted DNA was amplified using primers designed by MethPrimer (Li & Dahiya, 2002). Zymo‐Taq DNA polymerase enzymes were used for amplifying bisulfite‐converted DNA. PCR products were purified and cloned. Mini‐prepped colonies were sequenced using T7 sequencing primers. The sequencing results were analyzed using QUMA (Kumaki et al, 2008).
Genotyping of dnmt1 s872 mutant
The method for genotyping of dnmt1 s872 was performed as previously described (Anderson et al, 2009). A 545‐bp DNA fragment spanning the mutation site was amplified from the genomic DNA of dnmt1 s872 embryos by PCR (Forward: 5′‐TGGGACGGATTCTTCAGCAC‐3′, Reverse: 5′‐GCTCCATTTTCTCCTGCTTCACA‐3′). 3 μl of the PCR product was digested by HincII at 37°C overnight and fractionated through 2% agarose gel. The uncleaved band represents the wild type without mutation. The DNA fragment from mutants could be cleaved into 360 and 194 bp, while the heterozygous fragment after digestion has three bands (554, 360, and 194 bp).
Generation dnmt3bb.1 mutant by CRISPR‐Cas9
The gRNA target site (GGTGGTGCAGCCTCACCCGC) for dnmt3bb.1 was designed using the website (http://zifit.partners.org/ZiFiT/), and then synthesized by T7 RNA polymerase and purified using mirVana™ miRNA Isolation Kit (Ambion) in vitro. dnmt3bb.1‐gRNA (70 pg) and Cas9 mRNA (250 pg) were co‐injected into one‐cell‐stage zebrafish embryos. Genomic DNA was extracted from normal developing embryos after injection at 24 hpf. A 465‐bp DNA fragment spanning the target site was amplified from the genomic DNA by PCR (P1: 5′‐TCAGGCTGCCATGAATCGAG‐3′, P2: 5′‐TCCCAATGTTGGGTTGTGGC‐3′) and sequenced. Founder (F 0) embryos were raised to adulthood and outcrossed with wild‐type zebrafish to screen for heritable mutations. Siblings of F 1 embryos carrying mutations were raised to adulthood to establish mutant fish lines.
MeDIP sequencing
Sequencing library was first generated for MeDIP sequencing. The genomic DNA from each sample was sonicated into 200‐ to 900‐base pair (bp) fragments, which were ligated with Illumina genomic adapters using a genomic DNA sample kit (FC‐102‐1002) according to the user manual. Then, anti‐5‐methylcytosine antibody was used to precipitate the 300‐ to 1,000‐bp ligated DNA fragments. PCR was performed to amplify the enriched DNA. The quality of the MeDIP and the sequencing library were assessed by quality control (QC). For cluster generation, each sample was diluted to a final concentration of 8 pM, and clusters were generated using an Illumina cBot. Sequencing was performed using an Illumina HiSeq 2000.
RNA sequencing
Total RNA extracted from control and dnmt1 morphants was reversely transcribed and amplified. cDNA samples were sequenced using Illumina HiSeq 2000 to produce 101‐bp paired‐end sequence reads. Quality of raw RNA‐seq reads for each sample was assessed by quality control (QC) software, and bases with quality scores less than 20 were removed by Trimmomatic. The remaining reads were mapped to the Zebrafish reference cDNA sequences (zv9, from Ensembl) by BWA.
Accession number
The GEO accession number for the MeDIP and RNA‐seq data in this study is GSE93927.
Author contributions
LW performed fish experiments with help from ZL; HL and QT performed Xenopus experiments; DM generated the dnmt3bb.1 mutant; LW and FL conceived the project, analyzed the data, and wrote the manuscript. All authors read and approved the final manuscript.
Conflict of interest
The authors declare that they have no conflict of interest.
Supporting information
Appendix
Expanded View Figures PDF
Table EV1
Movie EV1
Movie EV2
Source Data for Expanded View
Review Process File
Acknowledgements
We thank Anming Meng, Guo‐Liang Xu, and Wei Xie for helpful discussions and critical reading of the paper. This work was supported by grants from the National Natural Science Foundation of China (31425016, 81530004, and 31401242), and the Ministry of Science and Technology of China (2016YFA0100500).
The EMBO Journal (2017) 36: 2987–2997
References
- Amack JD, Yost HJ (2004) The T box transcription factor no tail in ciliated cells controls zebrafish left‐right asymmetry. Curr Biol 14: 685–690 [DOI] [PubMed] [Google Scholar]
- Anderson RM, Bosch JA, Goll MG, Hesselson D, Dong PD, Shin D, Chi NC, Shin CH, Schlegel A, Halpern M, Stainier DY (2009) Loss of Dnmt1 catalytic activity reveals multiple roles for DNA methylation during pancreas development and regeneration. Dev Biol 334: 213–223 [DOI] [PMC free article] [PubMed] [Google Scholar]
- Blum M, Andre P, Muders K, Schweickert A, Fischer A, Bitzer E, Bogusch S, Beyer T, van Straaten HW, Viebahn C (2007) Ciliation and gene expression distinguish between node and posterior notochord in the mammalian embryo. Differentiation 75: 133–146 [DOI] [PubMed] [Google Scholar]
- Blum M, Beyer T, Weber T, Vick P, Andre P, Bitzer E, Schweickert A (2009) Xenopus, an ideal model system to study vertebrate left‐right asymmetry. Dev Dyn 238: 1215–1225 [DOI] [PubMed] [Google Scholar]
- Blum M, Feistel K, Thumberger T, Schweickert A (2014) The evolution and conservation of left‐right patterning mechanisms. Development 141: 1603–1613 [DOI] [PubMed] [Google Scholar]
- Burdine RD, Schier AF (2000) Conserved and divergent mechanisms in left‐right axis formation. Genes Dev 14: 763–776 [PubMed] [Google Scholar]
- Campos C, Valente LM, Fernandes JM (2012) Molecular evolution of zebrafish dnmt3 genes and thermal plasticity of their expression during embryonic development. Gene 500: 93–100 [DOI] [PubMed] [Google Scholar]
- Chen J, Suo S, Tam PP, Han JJ, Peng G, Jing N (2017) Spatial transcriptomic analysis of cryosectioned tissue samples with Geo‐seq. Nat Protoc 12: 566–580 [DOI] [PubMed] [Google Scholar]
- Choi WY, Giraldez AJ, Schier AF (2007) Target protectors reveal dampening and balancing of Nodal agonist and antagonist by miR‐430. Science 318: 271–274 [DOI] [PubMed] [Google Scholar]
- Chung WS, Stainier DY (2008) Intra‐endodermal interactions are required for pancreatic beta cell induction. Dev Cell 14: 582–593 [DOI] [PMC free article] [PubMed] [Google Scholar]
- Dai HQ, Wang BA, Yang L, Chen JJ, Zhu GC, Sun ML, Ge H, Wang R, Chapman DL, Tang F, Sun X, Xu GL (2016) TET‐mediated DNA demethylation controls gastrulation by regulating Lefty‐Nodal signalling. Nature 538: 528–532 [DOI] [PubMed] [Google Scholar]
- Dunican DS, Ruzov A, Hackett JA, Meehan RR (2008) xDnmt1 regulates transcriptional silencing in pre‐MBT Xenopus embryos independently of its catalytic function. Development 135: 1295–1302 [DOI] [PubMed] [Google Scholar]
- Farooq M, Sulochana KN, Pan X, To J, Sheng D, Gong Z, Ge R (2008) Histone deacetylase 3 (hdac3) is specifically required for liver development in zebrafish. Dev Biol 317: 336–353 [DOI] [PubMed] [Google Scholar]
- Feldman B, Concha ML, Saude L, Parsons MJ, Adams RJ, Wilson SW, Stemple DL (2002) Lefty antagonism of Squint is essential for normal gastrulation. Curr Biol 12: 2129–2135 [DOI] [PubMed] [Google Scholar]
- Ghoshal K, Datta J, Majumder S, Bai S, Kutay H, Motiwala T, Jacob ST (2005) 5‐Aza‐deoxycytidine induces selective degradation of DNA methyltransferase 1 by a proteasomal pathway that requires the KEN box, bromo‐adjacent homology domain, and nuclear localization signal. Mol Cell Biol 25: 4727–4741 [DOI] [PMC free article] [PubMed] [Google Scholar] [Retracted]
- Guo H, Zhu P, Yan L, Li R, Hu B, Lian Y, Yan J, Ren X, Lin S, Li J, Jin X, Shi X, Liu P, Wang X, Wang W, Wei Y, Li X, Guo F, Wu X, Fan X et al (2014) The DNA methylation landscape of human early embryos. Nature 511: 606–610 [DOI] [PubMed] [Google Scholar]
- Hamada H, Meno C, Watanabe D, Saijoh Y (2002) Establishment of vertebrate left‐right asymmetry. Nat Rev Genet 3: 103–113 [DOI] [PubMed] [Google Scholar]
- Hirokawa N, Tanaka Y, Okada Y, Takeda S (2006) Nodal flow and the generation of left‐right asymmetry. Cell 125: 33–45 [DOI] [PubMed] [Google Scholar]
- Jiang L, Zhang J, Wang JJ, Wang L, Zhang L, Li G, Yang X, Ma X, Sun X, Cai J, Zhang J, Huang X, Yu M, Wang X, Liu F, Wu CI, He C, Zhang B, Ci W, Liu J (2013) Sperm, but not oocyte, DNA methylome is inherited by zebrafish early embryos. Cell 153: 773–784 [DOI] [PMC free article] [PubMed] [Google Scholar]
- Kimelman D (2006) Mesoderm induction: from caps to chips. Nat Rev Genet 7: 360–372 [DOI] [PubMed] [Google Scholar]
- Kimmel CB, Ballard WW, Kimmel SR, Ullmann B, Schilling TF (1995) Stages of embryonic development of the zebrafish. Dev Dyn 203: 253–310 [DOI] [PubMed] [Google Scholar]
- Kinder SJ, Tsang TE, Wakamiya M, Sasaki H, Behringer RR, Nagy A, Tam PP (2001) The organizer of the mouse gastrula is composed of a dynamic population of progenitor cells for the axial mesoderm. Development 128: 3623–3634 [DOI] [PubMed] [Google Scholar]
- Kumaki Y, Oda M, Okano M (2008) QUMA: quantification tool for methylation analysis. Nucleic Acids Res 36: W170–W175 [DOI] [PMC free article] [PubMed] [Google Scholar]
- Li LC, Dahiya R (2002) MethPrimer: designing primers for methylation PCRs. Bioinformatics 18: 1427–1431 [DOI] [PubMed] [Google Scholar]
- Long S, Ahmad N, Rebagliati M (2003) The zebrafish nodal‐related gene southpaw is required for visceral and diencephalic left‐right asymmetry. Development 130: 2303–2316 [DOI] [PubMed] [Google Scholar]
- Matsui T, Thitamadee S, Murata T, Kakinuma H, Nabetani T, Hirabayashi Y, Hirate Y, Okamoto H, Bessho Y (2011) Canopy1, a positive feedback regulator of FGF signaling, controls progenitor cell clustering during Kupffer's vesicle organogenesis. Proc Natl Acad Sci USA 108: 9881–9886 [DOI] [PMC free article] [PubMed] [Google Scholar]
- Matsui T, Bessho Y (2012) Left‐right asymmetry in zebrafish. Cell Mol Life Sci 69: 3069–3077 [DOI] [PMC free article] [PubMed] [Google Scholar]
- Matsui T, Ishikawa H, Bessho Y (2015) Cell collectivity regulation within migrating cell cluster during Kupffer's vesicle formation in zebrafish. Front Cell Dev Biol 3: 27 [DOI] [PMC free article] [PubMed] [Google Scholar]
- McGrath J, Somlo S, Makova S, Tian X, Brueckner M (2003) Two populations of node monocilia initiate left‐right asymmetry in the mouse. Cell 114: 61–73 [DOI] [PubMed] [Google Scholar]
- Nonaka S, Tanaka Y, Okada Y, Takeda S, Harada A, Kanai Y, Kido M, Hirokawa N (1998) Randomization of left‐right asymmetry due to loss of nodal cilia generating leftward flow of extraembryonic fluid in mice lacking KIF3B motor protein. Cell 95: 829–837 [DOI] [PubMed] [Google Scholar]
- Okada Y, Takeda S, Tanaka Y, Izpisua Belmonte JC, Hirokawa N (2005) Mechanism of nodal flow: a conserved symmetry breaking event in left‐right axis determination. Cell 121: 633–644 [DOI] [PubMed] [Google Scholar]
- Oteiza P, Koppen M, Concha ML, Heisenberg CP (2008) Origin and shaping of the laterality organ in zebrafish. Development 135: 2807–2813 [DOI] [PubMed] [Google Scholar]
- Oteiza P, Koppen M, Krieg M, Pulgar E, Farias C, Melo C, Preibisch S, Muller D, Tada M, Hartel S, Heisenberg CP, Concha ML (2010) Planar cell polarity signalling regulates cell adhesion properties in progenitors of the zebrafish laterality organ. Development 137: 3459–3468 [DOI] [PubMed] [Google Scholar]
- Peeters H, Devriendt K (2006) Human laterality disorders. Eur J Med Genet 49: 349–362 [DOI] [PubMed] [Google Scholar]
- Potok ME, Nix DA, Parnell TJ, Cairns BR (2013) Reprogramming the maternal zebrafish genome after fertilization to match the paternal methylation pattern. Cell 153: 759–772 [DOI] [PMC free article] [PubMed] [Google Scholar]
- Rai K, Nadauld LD, Chidester S, Manos EJ, James SR, Karpf AR, Cairns BR, Jones DA (2006) Zebra fish Dnmt1 and Suv39 h1 regulate organ‐specific terminal differentiation during development. Mol Cell Biol 26: 7077–7085 [DOI] [PMC free article] [PubMed] [Google Scholar]
- Ruzov A, Dunican DS, Prokhortchouk A, Pennings S, Stancheva I, Prokhortchouk E, Meehan RR (2004) Kaiso is a genome‐wide repressor of transcription that is essential for amphibian development. Development 131: 6185–6194 [DOI] [PubMed] [Google Scholar]
- Schier AF, Talbot WS (2005) Molecular genetics of axis formation in zebrafish. Annu Rev Genet 39: 561–613 [DOI] [PubMed] [Google Scholar]
- Schotz EM, Burdine RD, Julicher F, Steinberg MS, Heisenberg CP, Foty RA (2008) Quantitative differences in tissue surface tension influence zebrafish germ layer positioning. HFSP J 2: 42–56 [DOI] [PMC free article] [PubMed] [Google Scholar]
- Schweickert A, Weber T, Beyer T, Vick P, Bogusch S, Feistel K, Blum M (2007) Cilia‐driven leftward flow determines laterality in Xenopus . Curr Biol 17: 60–66 [DOI] [PubMed] [Google Scholar]
- Shimoda N, Yamakoshi K, Miyake A, Takeda H (2005) Identification of a gene required for de novo DNA methylation of the zebrafish no tail gene. Dev Dyn 233: 1509–1516 [DOI] [PubMed] [Google Scholar]
- Smith ZD, Meissner A (2013) DNA methylation: roles in mammalian development. Nat Rev Genet 14: 204–220 [DOI] [PubMed] [Google Scholar]
- Stainier DY (2001) Zebrafish genetics and vertebrate heart formation. Nat Rev Genet 2: 39–48 [DOI] [PubMed] [Google Scholar]
- Tam PP, Loebel DA (2007) Gene function in mouse embryogenesis: get set for gastrulation. Nat Rev Genet 8: 368–381 [DOI] [PubMed] [Google Scholar]
- Tanaka Y, Okada Y, Hirokawa N (2005) FGF‐induced vesicular release of Sonic hedgehog and retinoic acid in leftward nodal flow is critical for left‐right determination. Nature 435: 172–177 [DOI] [PubMed] [Google Scholar]
- Wang L, Liu T, Xu L, Gao Y, Wei Y, Duan C, Chen GQ, Lin S, Patient R, Zhang B, Hong D, Liu F (2013) Fev regulates hematopoietic stem cell development via ERK signaling. Blood 122: 367–375 [DOI] [PubMed] [Google Scholar]
- Wang L, Zhang J, Duan J, Gao X, Zhu W, Lu X, Yang L, Zhang J, Li G, Ci W, Li W, Zhou Q, Aluru N, Tang F, He C, Huang X, Liu J (2014) Programming and inheritance of parental DNA methylomes in mammals. Cell 157: 979–991 [DOI] [PMC free article] [PubMed] [Google Scholar]
- Wei Y, Ma D, Gao Y, Zhang C, Wang L, Liu F (2014) Ncor2 is required for hematopoietic stem cell emergence by inhibiting Fos signaling in zebrafish. Blood 124: 1578–1585 [DOI] [PubMed] [Google Scholar]
- Zhang J, Jiang Z, Liu X, Meng A (2016) Eph/ephrin signaling maintains the boundary of dorsal forerunner cell cluster during morphogenesis of the zebrafish embryonic left‐right organizer. Development 143: 2603–2615 [DOI] [PMC free article] [PubMed] [Google Scholar]
Associated Data
This section collects any data citations, data availability statements, or supplementary materials included in this article.
Supplementary Materials
Appendix
Expanded View Figures PDF
Table EV1
Movie EV1
Movie EV2
Source Data for Expanded View
Review Process File


