Abstract
Knowing atomistic details of proteins is essential not only for the understanding of protein function but also for the development of drugs. Experimental methods such as X-ray crystallography, NMR and cryo-EM are the preferred form of protein structure determination and have achieved great success over the last decades. Computational methods may be an alternative when experimental techniques fail. However, computational methods are severely limited when it comes to predicting larger macromolecule structures with little sequence similarity to known structures. The incorporation of experimental restraints in computational methods is becoming increasingly important to more reliably predict protein structure. One such experimental input used in structure prediction and refinement is cryo-EM densities. Recent advances in cryo-EM have arguably revolutionized the field of structural biology. Our previously developed cryo-EM guided Rosetta-MD protocol has shown great promise in the refinement of soluble protein structures. In this study, we extended cryo-EM density-guided iterative Rosetta-MD to membrane proteins. We also improved the methodology in general by picking models based on a combination of their score and fit-to-density during the Rosetta model selection. By doing so, we have been able to pick superior models than with the previous selection based on Rosetta score only and we have been able to further improve our previously refined models of soluble proteins. The method was tested with five membrane spanning protein structures. By applying density-guided Rosetta-MD iteratively we were able to refine the predicted structures of these membrane proteins to atomic resolutions. We also showed that the resolution of the density maps determines the improvement and quality of the refined models. By incorporating high resolution density maps (~ 4 Å) we were able to more significantly improve the quality of the models than when medium resolution maps (6.9 Å) were used. Beginning from an average starting structure RMSD to native of 4.66 Å, our protocol was able to refine the structures to bring the average refined structure RMSD to 1.66 Å when 4 Å density maps were used.
Keywords: protein structure prediction, protein structure refinement, molecular dynamics simulations, cryo-EM densities, membrane proteins, MolProbity, Rosetta, ab initio, experimental restraints, EMRinger
Graphical Abstract
Introduction
The atomic details of protein structures are important for understanding molecular interactions that give rise to their biological functions1, 2. For example, membrane proteins in the plasma membrane can be anchoring proteins, proteins that transport molecules from one side of the membrane to the other, receptors that can receive signals from outside the cell and activate an intracellular process, or they can simply act as enzymes3. Detailed atomic structures of proteins can help us understand how they perform each of these roles. A recently determined near-atomic detail structure of TRPV1 has helped broaden our understanding of the structural mechanism of how capsaicin, an active ingredient in hot peppers, can trigger a heat sensation4, 5. Atomic details of protein structures are also important for computer aided drug discovery. Structure-based drug discovery relies on the knowledge of potential disease-associated protein targets in the development of small molecule drugs6–8. Additionally, detailed structural information of binding site residues may give information about possible mutations which could lead to drug resistance9. Knowing atomic details of protein structures allows for optimization of candidate drug molecules to achieve higher affinity. To meaningfully use protein structure in either studying biological function or drug discovery, atomic-resolution structures with accurate side chain coordinates are necessary10.
For decades, the preferred choice in high-resolution protein structure determination have been two well-established structural biology techniques: X-ray crystallography and Nuclear Magnetic resonance (NMR) spectroscopy11. X-ray and NMR have helped to determine over 115,000 high-resolution protein structures over the last four decades12–16. Despite their phenomenal success, there are technical difficulties associated with these techniques as well17. X-ray crystallography, relies on the formation of protein crystals, which frequently is a challenge 18. Additionally, there is no guarantee that the crystallized form of the structure captures its natural state. One of the pitfalls of structure determination using NMR is that the technique is system dependent and is generally not suitable for large biological systems. As the size of the molecule increases, the NMR signal decreases which causes the experiments to fail 19. Due to the technical difficulties and bottlenecks associated with these traditional experiments, there has been a rise of another technique used to determine protein structure.
In the past few years cryo-electron microscopy (cryo-EM) has revolutionized the field of structural biology20, 21. In single particle cryo-EM, a purified sample of a protein solution is distributed over a grid and frozen quickly22. Then, 2D electron micrographs are collected and merged to construct a 3D density map of the protein. If the resolution of the map allows, the protein sequence is mapped into the density to construct the 3D structure of the protein22. With cryo-EM it is now possible to obtain high-resolution protein structures that are not possible to obtain by either NMR or X-ray crystallography. Cryo-EM has been used to determine structures of large macromolecular complexes and even membrane proteins23, 24. Due to recent improvements in cryo-EM methodology, such as direct electron detectors 25, corrections for beam-induced movements 26 and maximum likelihood image processing routines 27, the determination of medium and near-atomic resolution density maps of membrane proteins determined by cryo-EM has flourished 28–32. Recently the large human gamma-secretase enzyme complex which is found to have implications in Alzheimer’s disease was obtained by cryo-EM at 4.5 Å resolution 33. Other recent examples of single particle cryo-EM structure reconstruction include the TRPV1 ion channel32 and the ribosome–Ski2-Ski3-Ski8 helicase complex 34. These density maps show an unprecedented amount of detail, making it possible to identify secondary structure elements and often to even trace the backbone or identify bulky side chains. With the advent of the recent resolution revolution in cryo-EM, protein structures can now be determined that were deemed impossible to determine a decade ago. Despite the impressive advances in cryo-EM, there are still limitations. From crystallography it is known that a resolution better than ~2.5 Å is required to correctly identify the protein backbone and most of the side chain rotamers 35. Currently, cryo-EM rarely achieves sub-3 Å resolutions, even though there are notable exceptions36. However, the vast majority of current cryo-EM models do not quite have the accuracy desirable for use in structure-based mechanistic and drug discovery studies. Thus, for most 4–10 Å resolution cryo-EM density maps, it is still not possible to determine atomic-resolution structures based solely on the density map. However, computational tools can be used to add some of the atomic detail that is not unambiguously present in most of the medium and near-atomic resolution cryo-EM density maps and thus help generate atomic-resolution structures.
Computational determination of macromolecular structures has become an important tool to narrow the increasing sequence-structures gap37. When template structures are not available to match the sequence of unknown structure, ab initio prediction where protein structures are modeled solely based on sequence is used38, 39. However, these ab initio structure prediction methods are not reliable for proteins of larger sizes37. Rosetta is perhaps the most well-known and widely-used method in ab initio protein structure prediction 40. It has shown great promise in predicting and refining structures at high-resolution40, 41. MODELLER42 and I-TASSER43 are two other structure prediction approaches that have been successfully applied to determine protein structure44, 45. High-resolution structure prediction and refinement tools which aim to further improve protein structures to experimental accuracy have also been developed41, 46. Rosetta includes such tools which can improve ab initio structures47, 48.
Due to limitations of pure ab initio protein structure prediction and the need to further improve predicted protein structures, a lot of development has focused on integrative approaches49. These approaches combine low to medium-resolution experimental data from heterogeneous experimental techniques with computational modeling methods50, 51. Experimental data has been used from a broad range of sources including NMR spectroscopy52–54, fluorescence resonance energy transfer microscopy (FRET)55, electron paramagnetic resonance (EPR)56, 57, cryo-EM 58–60, small angle X-ray scattering (SAXS)61, 62, small angle neutron scattering (SANS) 63 and mass spectroscopy64–66. These sparse experimental restraints used in combination with computational methods have shown to considerably improve macromolecular structure prediction and refinement53, 60, 67. Rosetta allows the use of many types of experimental restraints in its structure prediction and refinement protocols 52, 58, 68.
Additionally, all-atom molecular dynamics (MD) simulations have been used along with experimental restraints as an integrative approach to refine protein structures69. As opposed to Rosetta, MD simulations use a purely physics-based approach, based on integrating the equations of motion in molecular mechanics force fields 70. The molecular dynamics flexible fitting method (MDFF) uses MD simulations to refine protein structure guided by experimental cryo-EM density maps 69, 71. MDFF has been successfully applied to various biological systems, including membrane proteins 71–73. The success of MDFF structure refinement depends on the resolutions of the available cryo-EM density maps. In addition to cryo-EM densities, NMR chemical shifts are also used as experimental structural restraints with MD simulations in refining protein structures74. This method also allows to combine other NMR restraints such as NOE data with chemical shifts.
In previous work, we introduced a protocol iteratively combining Rosetta with MD simulations that was successful for cryo-EM guided refinement of soluble protein 75, 76. Three iterations of Rosetta-MD were used, where short MDFF simulations were followed by cryo-EM guided Rosetta protein structure refinement. We were able to successfully refine four soluble proteins 1X91, 1DVO, 1ICX and 2FD5 with starting RMSDs of 1.82 Å, 2.50 Å, 2.65 Å and 2.16 Å respectively to 1.29 Å, 2.14 Å, 1.80 Å and 2.01 Å. By using Rosetta and MD iteratively, the protocol was able to avoid conformational traps and generate well-refined structures. Recently, Schweitzer et al. successfully applied such an iterative Rosetta-MD protocol for structural refinement of a 3.9 Å cryo-EM structure of the human 26S proteasome77. While the iterative Rosetta-MD refinement protocol was successful, there were restrictions remaining, most notably its limitation to soluble proteins.
In this work, we extended the iterative Rosetta-MD protein structure refinement protocol to membrane proteins. Additionally, using a new model selection criterion based on a combination of Rosetta score and the fit-to-density of models we were able to further refine our previous set of soluble proteins76. This Rosetta-MD protocol was able to refine a set of benchmark membrane protein structures with initial RMSDs of ~3–5 Å from the native conformation to atomistic resolutions (<~2 Å) when high-resolution cryo-EM density maps (4 Å) were used. MolProbity scores and clash scores showed that the refined membrane protein models obtained with our iterative Rosetta-MD protocol were not only higher quality structures than the starting models but also had atomic details accurately added that were not present in the starting structures78, 79.
Methods
Ab initio membrane protein model building
Since the presented iterative Rosetta-MD protocol focuses on protein structure refinement and relies on the presence of a starting model, starting models were obtained using Rosetta ab initio modeling (without the cryo-EM density present). Initial membrane protein models were generated with RMSDs to native ranging from ~3–5 Å. The idea was to generate starting models that have the correct overall topology, have some backbone conformations correct and generally have incorrect side chain conformations. This procedure mimicked the resolutions of structures that are now routinely built from tracing near-atomic resolution cryo-EM density maps 32, 34, 77. Alternatively, such structures could be generated by combining techniques such as EM-Fold, Gorgon, SSEHunter and Rosetta 59, 60, 80, 81. The EM-Fold method has been tested successfully in modeling challenges82. A set of small membrane spanning proteins for which high-resolution structures are known were obtained from the PDB. Thirteen membrane proteins (containing 4 to 7 transmembrane helices) were selected in the initial search. The sequences used in the ab initio model generation were first stripped of any terminal residues which were not present in the native PDB structures. This was done to avoid issues that could arise when the ab initio model is refined with simulated density maps which were based on the native protein structures. Having additional densities not present in the ab initio models can interfere with the density-guided refinement of the models. Ab initio models for the list of membrane proteins were generated following the Rosetta ab initio membrane modeling protocol starting from the sequences83.
Transmembrane regions of the sequences were predicted using Octopus 84. Octopus uses both artificial neural networks as well as hidden Markov models (HMM) to predict the transmembrane regions using sequence information. Lipophilicity prediction files were generated using the output files generated by Octopus. This was done by first doing a Blast search on the sequences with the NCBI non-redundant database85. Multiple sequence alignments were subsequently generated which were used to create the lipid exposed data profiles for the sequences. Largest lips scores indicated high lipid exposure regions on the helical surfaces, whereas small lips scores indicated regions that were buried from the membrane environment. Rosetta fragment files (3-residue and 9-residue) for the ab initio model generation were obtained from the Robetta web server86. The Rosetta ab initio membrane modeling protocol was then used to generate 5000 models for each membrane sequence. The magnitude of the membrane normal search angle was set to 5° and the magnitude of membrane center search was set to 1 Å.
RMSDs over the backbone atoms of the generated models were calculated using the BCL::Quality algorithm87. Since we were not interested in starting structures that significantly deviated from the native, we only picked proteins for which we were able to generate ab initio models with RMSDs of less than ~ 5 Å to the native. This limited the study to 5 protein structures (1PY6, 2LLY, 2MAW, 4G80 and 4RYM) which included 3 X-ray crystal structures and 2 NMR structures (Table 1, Figure 1). The best ab initio model RMSD of 2MAW was 4.98 Å. However, after manual adjustment of this structure to fit the density it was possible to improve the RMSD of this structure to 4.57 Å. The manual adjustment was performed in Chimera88. The accuracy of the starting models mimicked that of models which are now routinely built from tracing near-atomic resolution cryo-EM density maps as well other ab initio model building tools such as EM-Fold or SSEHunter.
Table 1.
The list of benchmark transmembrane proteins.
| Name | PDB ID | Method | No of TM helices | Tilt angle | Starting model RMSD (Å) |
|---|---|---|---|---|---|
| Bacteriorhodopsin | 1PY6 | X-ray | 7 | 24 ± 80 | 4.27 |
| nAChR a4 subunit | 2LLY | NMR | 4 | 8 ± 10 | 5.32 |
| Alpha7 nAChR transmembrane domain | 2MAW | NMR | 4 | 14 ± 10 | 4.57 |
| Voltage sensing domain of Ci-VSP | 4G80 | X-ray | 4 | 14 ± 10 | 4.12 |
| BcTSPO lodo type1 monomer | 4RYM | X-ray | 5 | 3 ± 00 | 5.04 |
Figure 1.
Native structures of the proteins used in this study embedded in membrane (a) 1PY6 (b) 2LLY (c) 2MAW (d) 4G80 (e) 4RYM. Water molecules are shown in purple, membrane is in green and protein structures are shown in blue.
Alignment of structures with OPM coordinates
It was important to make sure that the ab initio starting structures have the correct orientation in the membrane before explicit membrane simulations were performed. Most of the time, membrane spanning proteins are not 100% parallel to the bilayer normal and are tilted in the membrane (Table 1). The Orientations of Proteins in Membranes (OPM) database includes the correct orientation of membrane proteins89. The coordinates of the proteins from this database were used to align each of the starting structures with the corresponding OPM coordinates using Chimera88. The new coordinates of the aligned starting structures were saved. The starting models must also be properly aligned with the generated density maps. Thus, the native structures were aligned with the OPM coordinates before the simulation of the density maps. This process ensured that the starting structures were aligned with the simulated density maps while simultaneously having the correct orientation in a membrane environment.
Simulation of density maps
The density maps were generated for the OPM-aligned native protein structures of each membrane protein using the pdb2vol program in the Situs package 90. Pdb2vol can create a volumetric map of the input structure. One third of the target resolution was used as the voxel spacing. A Gaussian smoothing kernel was used with an amplitude of 1. For NMR structures the representative models were used to generate the density maps. Maps with 6.9 Å and 4 Å resolutions were simulated for each native structure (Figure 2). These maps had voxel spacings of 2.3 Å and 1.3 Å, respectively. Higher resolution maps (4 Å) captured not only the backbone details but also some side chain details of the structures. Medium-resolution (6.9 Å) maps showed transmembrane helices as density rods. These density maps were representative of medium (6.9 Å) and near-atomic resolution (4 Å) membrane protein cryo-EM density maps.
Figure 2.
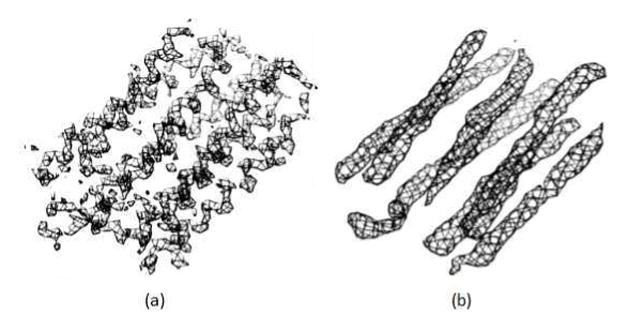
Simulated density maps for 1PY6 at (a) 4 Å and (b) 6.9 Å.
We also introduced Gaussian noise into the simulated density maps to mimic some of the error that is inherent in experimental density maps. This was done using the BCL::density::FromPDB algorithm91. Noise was randomly added to the maps to obtain a cross correlation coefficient of 0.8 between the noise-free and noise containing maps. It has been established that in order to realistically mimic experimental density maps a cross correlation coefficient of 0.8 is suitable91. Details of simulations of the density maps can be found in supporting information.
Density-guided iterative Rosetta-MD
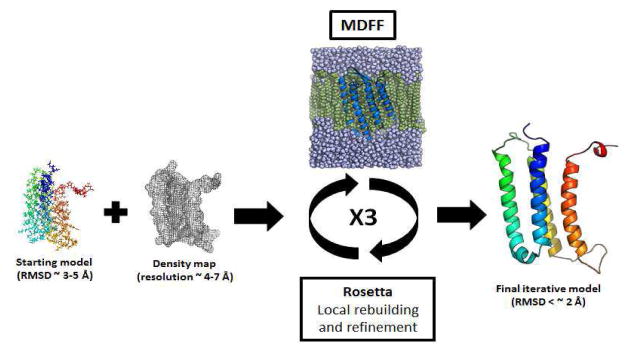
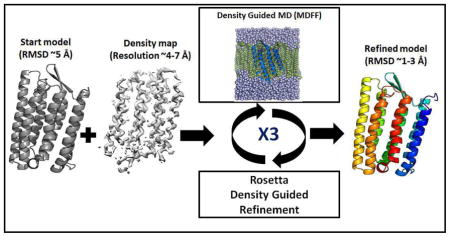
The starting protein structures were first embedded in the membrane or solution and the systems were minimized and equilibrated. Each equilibrated structure was then refined via a density-guided MD simulation step (MDFF1) 69, 71. The last frame of this trajectory was used as the input model for Rosetta density-guided local building and refinement (Rosettal)58. An ensemble of 5000 models was generated and the best scoring model (for 4 Å membrane refinement and soluble proteins) or the five best scoring models (for 6.9 Å membrane refinement) were picked for the second iteration of the MDFF run (MDFF2). This Rosetta-MD refinement was repeated three times and the final refined model was selected after the third Rosetta model generation stage (Figure 3). This protocol was performed on the five benchmark membrane proteins and was also applied to the four soluble proteins from our previous publication (1X91, 1DVO, 1ICX and 2FD5)76. The iterative Rosetta-MD protocol was repeated for soluble and membrane protein structures using noise-added density maps as well.
Figure 3.
A schematic diagram showing the iterative Rosetta-MD protocol.
Molecular dynamics flexible fitting (MDFF)
MDFF simulations were run on the starting models in the presence of membrane and in solution depending on the type of protein used69. Each membrane starting structure, aligned with OPM coordinates, was embedded in a POPC bilayer using the VMD membrane builder plugin. The lipid molecules within 3 Å of the proteins were eliminated. The system was solvated using the VMD solvate plugin with TIP3P water molecules and the water molecules within 1.5 Å from the protein and POPC bilayer were removed. Soluble proteins were immersed in a TIP3P water box with a 14 Å padding. NAMD2.10 with the CHARMM22 force field was used for the systems. Restraints were applied to enforce the secondary structure during the MDFF simulation using the package ssrestraints. An additional potential that was derived from each cryo-EM density map was applied in addition to the standard force field during each simulation. The density map was converted into an MDFF potential using mdff griddx. Particle Mesh Ewald (PME) was used with periodic boundary conditions. A local interaction distance cutoff of 12 Å was used for electrostatic and van der Waals calculations. The values of nonbondedFreq and the pairlistdist were set to 1 and 13.5 Å, respectively. We tested the performance of the protocol using three different density scaling factors; 0.2, 0.5 and 1.0. We used the default density scaling factor of 0.2 for both soluble and membrane protein refinement results presented in the manuscript.
Simulations were run on each of the membrane systems to create appropriate disorder in the bilayer. Protein, water, lipid head groups and ions were kept fixed and only the tail groups of POPC were allowed to move freely for 500,000 1fs steps (0.5 ns). Then the system was both minimized and equilibrated keeping the protein fixed. This allowed the lipids to be well packed around the protein. This was done for 500,000 1 fs steps (0.5 ns), heating up the system to a 300K temperature. Production MDFF simulations were then performed for 0.5 ns on the equilibrated membrane systems. The final MDFF trajectory frames were split into individual PDB structures and the RMSD of each frame along the trajectory was calculated using the BCL::Quality algorithm as before. Both the all backbone atom RMSD and the all backbone atom RMSD over the secondary structure elements were calculated. The soluble proteins were first embedded in solution and MDFF was earned out on the solvated systems. All simulations were run at 300K. For comparison, the MDFF runs were also performed with 1 ns simulation times.
Density-guided Rosetta local building and refinement
Rosetta allows for the refinement of protein structures to generate structures with high accuracy by using the native density as an additional restraint to refine into the density maps 58, 92, 93. The use of Rosetta is complementary to MDFF in structure refinement since the applied force fields are significantly different.
The last frame of the MDFF trajectory was used as the starting structure for Rosetta. The regions that were identified to have poor fit-to-density were rebuilt during this step. The starting model fit-to-density was measured and was used to find parts in the structure that least agree with the density. Each residue was scored to assess the agreement to data and the residues below a cutoff of a Z-score worse than −0.5 were selected for fragment-based local rebuilding92. The local sequence around a randomly selected residue from this list was matched to 25 protein backbone conformations that have similar local sequence and secondary structure arrangement from known high-resolution structures. Each of these backbone conformations was refined into density data and the fragment that best agreed with the density data was selected93. Once a fragment was selected and inserted in the structure, the whole structure was minimized following a Monte Carlo procedure.
A total of 5000 independent models were generated for each Rosetta step of the iterative Rosetta-MD protocol. The full atom solvation score term was set to zero to implicitly account for the membrane environment. RMSD of each model was calculated using the BCL::Quality algorithm87. The fit-to-density score of each model was also calculated using Rosetta density-tools which provided the model-map agreement94. The Rosetta scores and the fit-to-density scores of all models were both normalized such that the best scoring model out of the 5000 models had a normalized score of 1 and the best fit-to-density model had a normalized fit of 1. These two normalized parameters were combined to get a consensus score, a combination of both the score and the fit-to-density equally weighted. For the 6.9 Å medium-resolution maps the 5 best consensus score models from each Rosetta round were picked and 5 independent MDFF simulations were run in rounds 2 and 3. The five last frames of these simulations were then taken as input for generating the next Rosetta models. Thus in Rosetta 2 and 3, 1000 models were generated for each of the five last frames from MDFF 2 and 3, totaling 5000 total structures for each Rosetta round. For the 4 Å density maps, the model that gave the highest consensus score was picked as the best model to go into the next MDFF round. For the high-resolution 4 Å maps only the top consensus score model was selected from Rosetta1 and Rosetta2 because the high-resolution density maps did not necessitate the use of multiple structures in the refinement. At the end of Rosetta3, the model with the highest consensus score was picked as the final refined structure. The calculations were also repeated for the soluble proteins in our previous publication76, using the novel consensus score method to select the best model after each Rosetta iteration. The medium-resolution starting models for these proteins had been generated using the EM-Fold and Rosetta methods59.
Application of the protocol to HIV-1 capsid protein CTD
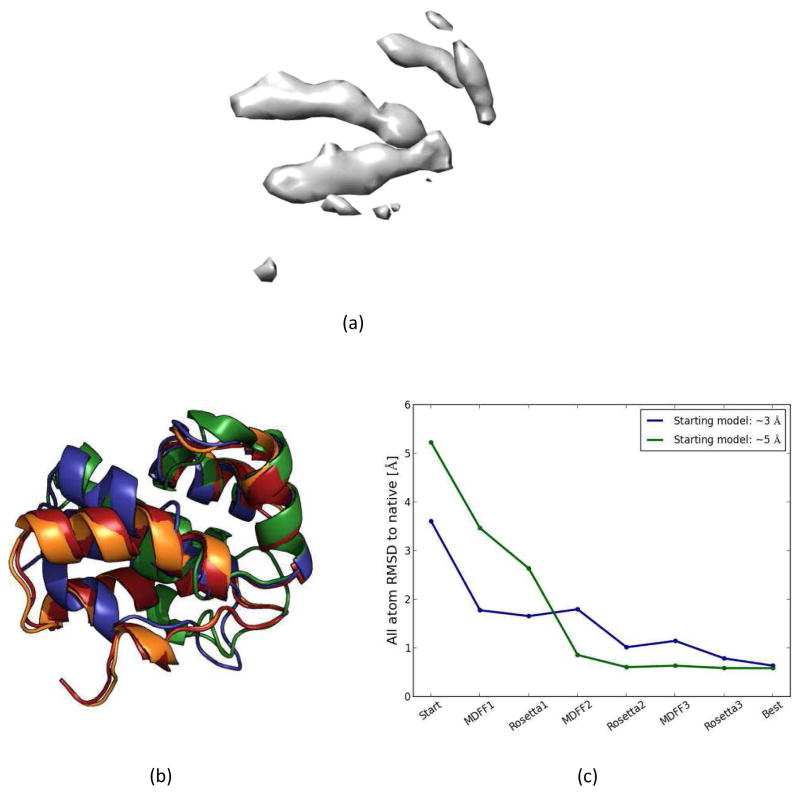
We generated 5000 ab initio models for HIV-1 capsid protein C-terminal domain (CTD) using Rosetta ab initio model building. The starting sequence for the HIV-1 CTD was obtained from the PDB structure of 2KOD. The 5 Å experimental density map for HIV-1 capsid hexamer (EMD-8595) was used 95. The two best scoring starting structures were each aligned with the experimental density map and the density map was segmented to obtain the density that corresponds to the CTD monomer using Chimera’s zone feature with the default settings (Figure 13(a)). Rosetta-MD protocol was applied to the two selected ab initio start models of 2KOD. The crystal structure of HIV-1 hexamer (4XFX) was used as the reference structure and the monomeric CTD was extracted in order to assess the extent of refinement.
Figure 13.
(a) 5 Å resolution density map of HIV-1 CTD (b) HIV-1 CTD structure; the native structure is shown in orange, two ab initio models (RMSDs ~3 Å, 5 Å) are shown in blue and green, the final refined structure is in red. (c) The variation of RMSDs for the two ab initio HIV-1 CTD models along the flow of the iterative Rosetta-MD protocol.
Model quality evaluation
In addition to using RMSD to the native structure, the final model quality was evaluated using MolProbity which is used as a standard way of quality validation 78, 79. MolProbity uses various knowledge-based and physics-based algorithms to evaluate the geometric quality of protein structures. MolProbity scores and MolProbity clash scores were calculated for the start models and the refined membrane protein structures.
The MolProbity clash score is an indicator of unfavorable steric clashes in a structure. These clashes are a strong indicator of poor model quality. MolProbity clash scores closer to zero are an indication of a well-ordered structure. The MolProbity score is a measure that takes into account not only the atom contact clashes, but also Ramachandran and rotamer outliers in a structure. The closer the MolProbity score is to 0, the better the overall quality of the model is. EMRinger score was also used to validate the high-resolution refined model and its density map agreement96. This score is used to assess the fitting of an atomistic level model to the density map. Good validation scores can indicate if a model is fitted to the map precisely and at the same time not over-fitted to the map. EMRinger scores over 1 are generally considered to be showing good model-map agreement for density maps with resolutions of 3–4 Å.
Results and Discussion
Soluble protein refinement
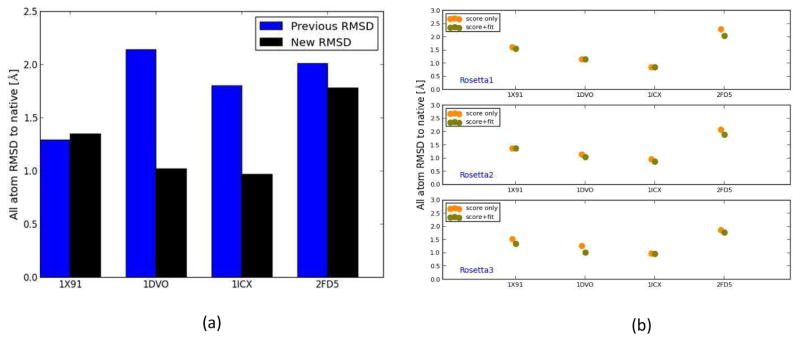
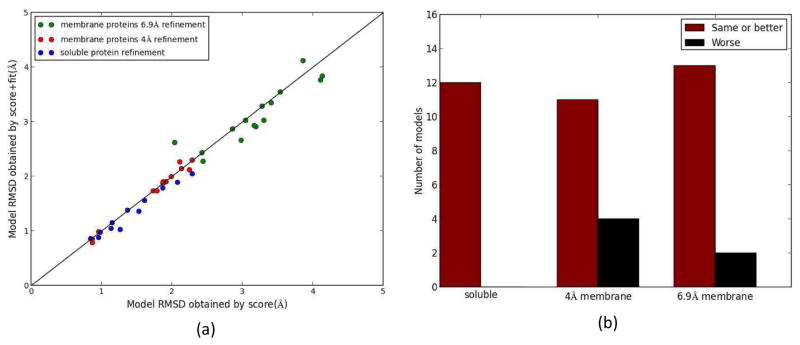
We refined the four soluble proteins from our previous publication using the new, improved model selection protocol. The density-guided iterative Rosetta-MD was performed on those proteins (1X91, 1DVO, 1ICX and 2FD5). This time, instead of picking models exclusively based on Rosetta score, the models were picked using the consensus score term (an equally weighed combination of Rosetta score and the fit-to-density). Before using the new selection method as part of the membrane protein refinement protocol, this enabled a comparison of the performance of the new selection protocol compared to the previous protocol’s performance. The new refined models for soluble proteins were compared to the models obtained based on the previously published work76. For 1ICX, 1DVO and 2FD5, the final models obtained with the new protocol improved dramatically. For 1DVO and 1ICX the final refined models now had RMSDs around ~ 1 Å which was significantly better than that of models previously obtained. Using the previous protocol it was only possible to refine 1DVO and 1ICX to RMSDs worse than 2 Å and 1ICX gave a refined RMSD of 1.80 Å. The final refined model RMSD for 1X91 (1.35 Å) was comparable to that of the previous protocol (1.29 Å) (Figure 4(a)). The consensus score method was able to always pick the same or better RMSD models in each Rosetta step compared to models potentially picked using the score-only method. In 75% of the cases, the consensus score models had better RMSDs than the models that would have been picked by the score-only selection method (Figure 4(b)). A better model was always picked for all four proteins in the final round of Rosetta when the generated models were closest to the native. By introducing the fit-to-density parameter with the Rosetta score we were able to favor the models that agree well with the density maps, without simultaneously overfitting the models to the densities.
Figure 4.
(a) The RMSDs of the final refined models using iterative Rosetta-MD protocol where models were picked based on a consensus score which is a combination of the Rosetta score and the fit-to-density (black) and based on Rosetta score-only (blue). For 1DVO, 1ICX and 2FD5 the new method was able to further improve the quality of the final structures. (b) RMSD of the selected models in each Rosetta step for the soluble proteins. Orange filled circles show the RMSDs of models picked by the best score method and green filled circles show the RMSDs of models picked based on consensus score method. For 75% of the cases, the consensus score method was able to pick a better model than the score-only method.
Ab initio membrane protein model generation
To test the proposed iterative Rosetta-MD membrane protein structure refinement protocol, unrefined starting structures with RMSDs to native ranging from ~3–5 Å were needed. The Rosetta ab initio membrane protocol (not guided by cryo-EM density) was used to generate 5000 models of each of 13 membrane protein sequences. RMSDs to native of the generated models ranged from ~4 Å to ~30 Å. The RMSD of the best models selected for 1PY6, 2LLY, 2MAW, 4G80 and 4RYM were 4.27 Å, 5.32 Å, 4.98 Å, 4.12 Å and 5.04 Å respectively (Table 1). Manual adjustment of the 2MAW structure to better fit the simulated density map improved the model RMSD to 4.57 Å Even though the improvement in RMSD was small, the manual twisting and rotating of the helices allowed for improvements during refinement, which were higher than what was obtained using the model that was not manually adjusted (Figure S1).
Iterative Rosetta-MD membrane protein refinement
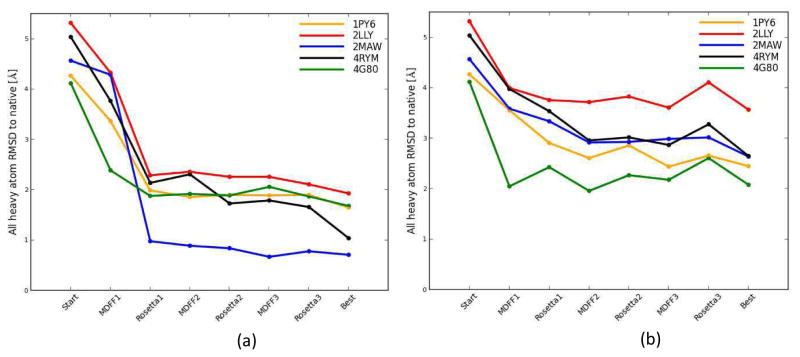
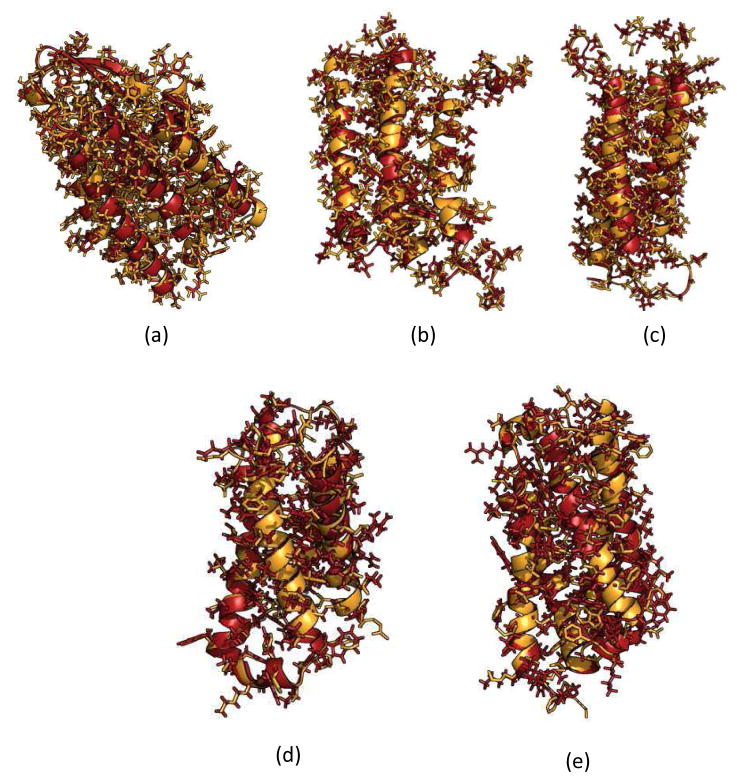
The iterative Rosetta-MD membrane protein structure refinement protocol with the new consensus score model selection method was applied to the five membrane protein structures. Since experimental density maps were not available for the five membrane proteins, the density maps had to be simulated. Density maps at two different resolutions (4 Å and 6.9 Å) were simulated. The 4 Å resolution was selected to mimic high-resolution density data. The 6.9 Å resolution mimicked medium-resolution density data and was the same resolution used in our previous publication 76. The RMSDs of the models for all membrane proteins in general improved throughout the three rounds of the iterative protocol. However, not surprisingly, the improvement in model quality was more prominent in the case of the 4 Å resolution maps (Figure 5(a)). There was a clear drop in the RMSDs for all membrane proteins after the first round of Rosetta-MD iteration regardless of the density map resolution (Figure 5). After the first iteration, RMSDs further dropped slightly during the next two iterations for the 4 Å density map refinement. For the 4 Å density maps, the final RMSDs were 1.90Å, 2.11Å, 0.78Å, 1.87Å and 1.66Å for 1PY6, 2LLY, 2MAW, 4G80 and 4RYM respectively. This constitutes a substantial improvement of RMSDs compared to the starting structures (Figure 6). The improved side chain overlaps for these structures are shown in Figure 7. In all of the cases, except for 2LLY, the final model RMSD was less than 2 Å. In the case of 2MAW, the final model RMSD (0.78 Å) showed a significant 83% improvement compared to its starting RMSD (4.57 Å). The average starting structure RMSD to native was 4.66 Å and after three rounds of Rosetta-MD iterations the final average structure RMSD dropped to 1.66 Å. The final average best model RMSD was 1.41 Å.
Figure 5.
The RMSDs of the models along the flow of the iterative Rosetta-MD protocol; 1PY6 (orange), 2LLY (red), 2MAW (blue), 4G80 (green) and 4RYM (black) (a) Refinement into 4 Å density map (b) refinement into 6.9 Å density map. RMSDs of the models for all membrane proteins generally improved throughout the three rounds of the iterative protocol. More prominent gradual decrease was observed in the case of the high-resolution 4 Å density map.
Figure 6.
The structure alignment of the native structure (orange), the ab initio start model (blue) and the final refined model (red) for the 4 Å refinement for (a) 1PY6 (b) 2LLY (c) 2MAW (d) 4G80 (e) 4RYM.
Figure 7.
Side chain agreement of refined models with native structures. Structure alignment of the native structure (orange) and the final refined model (red) for the 4 Å refinement for (a) 1PY6 (b) 2LLY (c) 2MAW (d) 4G80 (e) 4RYM.
Even though there was clear model refinement for the 6.9 Å medium-resolution density maps, the final RMSDs did not reach those obtained by the refinement using the 4 Å high-resolution density maps. For the 6.9 Å density map refinement there were slight fluctuations in the RMSDs along the stages of the protocol (Figure 5(b)). There was also a slight increase in the RMSDs after the third round of MDFF for all proteins except for 2MAW. This suggested that the resolution of the map might not be sufficient to improve the models further and could lead to over-fitting of the models in the final round of the iterative protocol. Best refinement for the 6.9 Å density maps was observed for 1PY6 and 4G80 which showed final RMSDs of 2.66 Å and 2.61 Å respectively.
With the manual twisting of the starting 2MAW structure, we were able to create a register shift in helices containing residues 2-26, 33-55 and 103-127 that agreed with the experimental structure of 2MAW (Figure S1 (a)). When the refinement was performed starting with the structure that was not adjusted, the final RMSDs of models were 3.03 Å and 3.74 Å for the 4 Å and 6.9 Å refinement respectively (Figure S1 (b) and (c)). It was not possible to refine the starting structure beyond ~3 Å RMSD because neither MDFF nor Rosetta refinement can easily allow helices to shift to create the register shifts.
Increased simulation time does not change the simulation results significantly. A simulation time of 0.5 ns was found to be sufficient to converge the system to the density maps. The results of refinement when different density map scaling factors (0.2, 0.5 and 1.0) were used showed that the results of refinement do not significantly change with the choice of the MDFF scaling factors (Figure S2 and S3). For example, the refined structures after the third round of Rosetta have average RMSDs of 1.66 Å, 1.56 Å and 1.59 Å for scaling factors 0.2, 0.5 and 1.0 respectively for the 4 Å density map refinement (Figure S2). For the 6.9 Å density map refinement the average RMSDs for the final refined models were 3.14 Å, 3.07 Å and 3.15 Å for scaling factors 0.2, 0.5 and 1.0 respectively (Figure S3). By using the lower default scaling factors we minimize the possibility of overfitting our structures to the density maps.
Consensus score-based selection of models
Previous implementations of the iterative Rosetta-MD protocol used Rosetta scores to select the best model in each Rosetta round. Here, an improved consensus score for the Rosetta model selection was used. The consensus score was the combination of the normalized Rosetta score and the normalized fit-to-density score for a model. The RMSDs of models obtained from the Rosetta score-only and from the consensus score method were compared. The results for all rounds of Rosetta showed that, in general, the consensus score was able to pick better models than the Rosetta score-only method (Figure 8). For soluble proteins, using the consensus score a better model or the same model as the one picked by the score-only method was identified for all proteins in all Rosetta rounds 100% of the time (Figure 4(a), Figure 8(a), Figure 8(b)). Furthermore, better selection of models was also observed for 4 Å and 6.9 Å density map membrane protein refinement. The percentage of cases that a better or a same model was observed for the consensus score method compared to the score-only method for the 4 Å and 6.9 Å density map refinement were 73% and 87% respectively (Figure 8(b)). The improvement caused by the consensus score was more prominent for the 6.9 Å density map refinement (Figure 8(a), 9(b)). Overall, the consensus score model selection method was able to outperform the Rosetta score-only selection method for both soluble proteins as well as membrane proteins.
Figure 8.
(a) The RMSDs of the models that would have been picked for all Rosetta rounds using the score-only method and the consensus score method for soluble proteins (blue) and membrane protein refinement utilizing 4 Å (red) and 6.9 Å (green) density maps. (b) Histogram of occurrences that a model with lower or same RMSD was picked by the consensus score method compared to the score-only method. For soluble proteins, 4 Å membrane refinement and 6.9 Å membrane refinement the model picked was better or the same 100%, 73% and 87% of the cases respectively.
Figure 9.
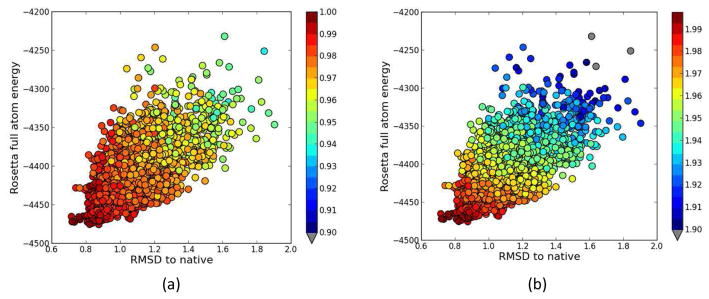
RMSD vs. Rosetta score plots for the final round Rosetta models of 2MAW. The models are color-coded by their respective (a) normalized fit-to-density and (b) consensus score (normalized score + normalized fit-to-density). The best score-only model RMSD is 0.87 Å and the model RMSD that is picked using the consensus score is 0.78 Å. With the consensus score, the model picked was better than the best score-only model.
Analysis of fit-to-density and consensus score
The normalized fit-to-density score for the 5000 models obtained in the final round of Rosetta model generation for the set of membrane proteins were analyzed to assess how fit-to-density of models varied with RMSDs of the models. High fit-to-density scores were observed for models with lower RMSDs to native (Figure 9(a)). The models that deviate the most from native showed poor fit-to-density scores indicating that this measure in general favored the models that were close to the native structure. The consensus score measure which is the combination of the normalized Rosetta score and the normalized fit-to-density showed this general trend as well (Figure 9(b)). Highest fit-to-density score models were the ones that had the lowest RMSDs to the native. By adding the normalized score to the normalized fit-to-density it was possible to drop the rank of the models that had low RMSDs but also had poor Rosetta scores which were unfavorable models. That is, models that were favored by the fit-to-density alone but had poor Rosetta scores ended up having poor consensus scores (compare Figure 9(a) and 9(b)). The consensus score measure favored the models in the tip of the funnel shape of the energy landscape. For example, the Rosetta best score model’s RMSD was 0.87 Å and the model RMSD that was picked using the consensus score was 0.78 Å for 2MAW (Figure 9(b)). The consensus score measure was able to pick better models than the Rosetta score-only method even though those models do not necessarily have the lowest Rosetta scores.
Refinement of structures using noisy density maps
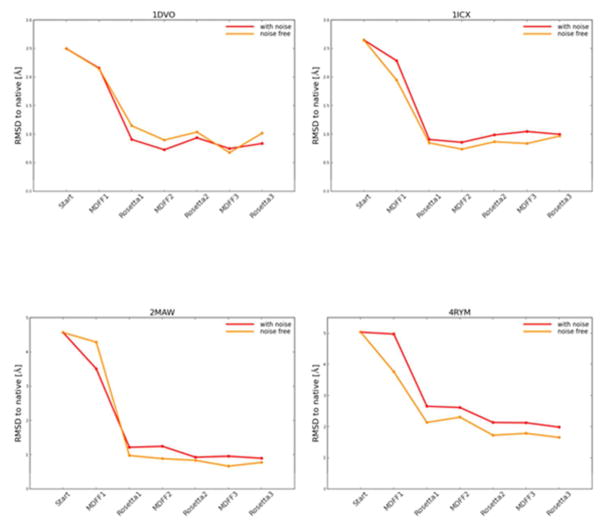
In order to test the performance of the iterative refinement protocol on more realistic density maps, noise-containing density maps were generated. When noisy density maps that mimic experimental error were used in the refinement protocol the refinement results agreed overall with that of noise-free refinement (Figure 10). For 1DVO, the final RMSDs of refined structures with noise-free and noise added maps were 1.02 Å and 0.84 Å respectively. For 1ICX, refinement using noise-free and noise-containing maps brought the RMSDs of final structures to 0.97 Å and 1.00 Å. For 2MAW noise-free map refined the final RMSD to 0.78 Å and with noise added map a final RMSD of 0.9 Å was obtained. 4RYM structure refinement with 4 Å noise added map the final refined structure RMSD was of 1.99 Å. When the noise-free 4 Å map was used for 4RYM, the final refined structure RMSD was 1.66 Å. Adding noise to the density maps did not significantly change the final RMSDs which gives us confidence that our refinement protocol would work with noisy experimental maps as well.
Figure 10.
The RMSDs of the models along the flow of the iterative Rosetta-MD protocol for noise-free density maps and noise-containing density maps (a) 1DVO (b) 1ICX (c) 2MAW (d) 4RYM. The addition of noise did not change the extent of refinement of the models.
Model quality evaluation
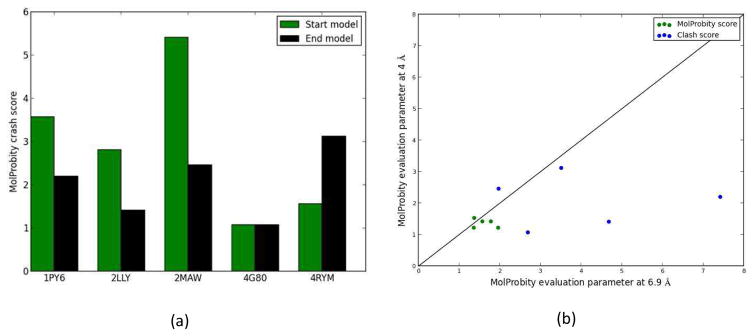
MolProbity scores and clash scores were used to assess the quality of the initial and final refined models. The closer the MolProbity score and clash score are to 0, the better the overall quality of the model is. The model quality evaluation using MolProbity clash scores indicated improved geometric quality of the refined models compared to the start models (Figure 11(a)). With the exception of 4RYM, refined models showed better MolProbity clash scores than their starting ab initio models. All final refined model MolProbity clash scores were less than 4 which is considered to be good quality models. When MolProbity clash scores and MolProbity scores were compared for the iteratively refined models using 6.9 Å and 4 Å density maps, respectively, lower scores were observed for the models refined using the 4 Å maps. Interestingly, this comparison showed that the quality of the refined models obtained by the high-resolution density maps produce better quality models than medium-resolution maps (Figure 11(b)). However, all refined models showed reasonable MolProbity scores to be considered physically realistic.
Figure 11.
Model evaluation using MolProbity. (a) The MolProbity clash score for the models refined by 4 Å resolution density maps (black) and the MolProbity clash score of their starting ab initio models (green) (b) MolProbity score (green) and the MolProbity clash score (blue) of final models obtained by the 4 Å and 6.9 Å maps.
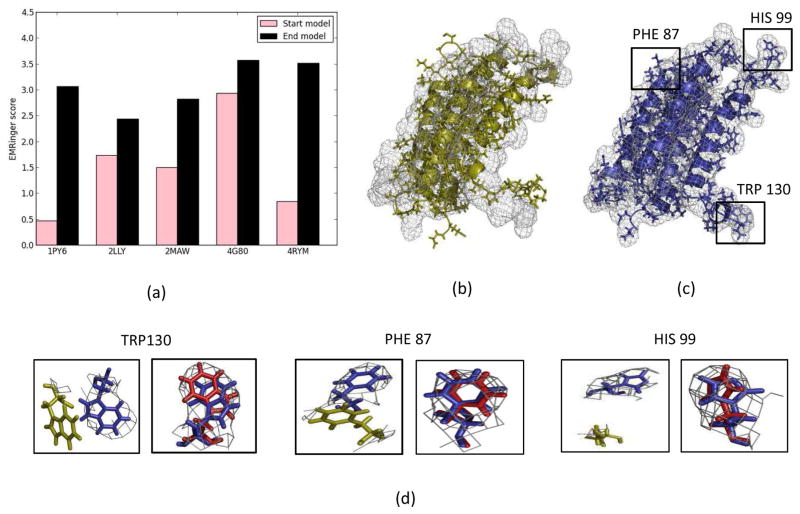
Finally, EMRinger scores were used to assess the model-map agreement of the final refined models. EMRinger scores over 1 are generally considered to be showing good model-map agreement for density maps with resolutions of 3–4 Å. EMRinger scores for the iteratively refined models using 4 Å density maps were always over 1 and higher than that of the start models indicating improved model-map agreement of refined models (Figure 12(a)). This observation further validated that the iteratively refined models were properly fitted to the density map without being over-fitted and gave increased confidence in the final refined models. In the starting structures, clear side chain mismatches and deviations from the density maps were observed. After refinement, these side chains were well converged with the density maps. Closer inspection of the side chains of these refined structures showed improved overlaps with the native structure side chains. The convergence of a few side chains that have benzene rings are shown for 2LLY in Figure 12(b) and 12(c). Similar well-converged regions were observed for all benchmark protein structures after three rounds of iterative Rosetta-MD refinement.
Figure 12.
(a) EMRinger score for the ab initio start models (pink) and the models after three rounds of iterative Rosetta-MD refinement using 4 Å density maps (black) (b) ab initio start structure of 2LLY (yellow) overlapped with the 4 Å density map (black mesh). Side chain mismatches and deviation from the densities can been seen. (c) The final refined 2LLY model (blue) overlapped with the 4 Å density map (black mesh). Three residues with benzene rings, PHE 87, HIS 99 and TRP 130, were misaligned with the density map in the ab initio start model but were well converged into the density map in the final refined model (highlighted in black boxes). (d) Zoomed in side chain residue overlaps; the native coordinates (red), the ab initio starting model coordinates (yellow) and the final refined model coordinates (blue). Side chains were well aligned with the density and overlapped with the native side chain coordinates in the refined model.
Application of the protocol to HIV-1 capsid protein CTD
To test the ability of the iterative Rosetta-MD protocol to refine proteins guided by experimental cryo-EM density maps, ab initio models for HIV-1 capsid protein C-terminal domain (CTD) were built using the 2KOD sequence. The two best scoring ab initio models of HIV-1 CTD exhibited RMSDs of 3.61 Å and 5.23 Å, respectively (Figure 13(b)). We selected both of these structures for refinement to test the protocol with good (<4 Å RMSD) and medium (>5 Å RMSD) quality starting models. After application of the iterative Rosetta-MD protocol on these two starting structures guided by the experimental HIV-1 density map (5 Å resolution) corresponding to the CTD, the final model RMSDs reached 0.79 Å and 0.59 Å for the 3.61 Å and 5.23 Å starting structures respectively (Figure 13(c)). With the score-only selection the final RMSD obtained for 3.61 Å and 5.23 Å starting structures were 0.94 Å and 0.70 Å. The consensus score method performed better than the score-only method as we saw for the soluble proteins and the membrane proteins.
Conclusion
Our goal was to extend the previously introduced cryo-EM guided iterative Rosetta-MD protein structure refinement protocol from soluble to membrane proteins. In this work, five membrane protein models that had RMSDs of ~3–5 Å from the native were refined to near-atomic resolutions with RMSDs less than ~2 Å (1.90 Å, 2.11 Å, 0.78 Å, 1.87 Å, 1.66 Å for 1PY6, 2LLY, 2MAW, 4G80 and 4RYM respectively) by incorporating cryo-EM densities as experimental restraints. The protocol used MD simulations and Rosetta structure refinement, both guided by cryo-EM density, iteratively to refine membrane protein structures. Improvements to the model selection process considerably improved the quality of the refined protein structures. Instead of purely using Rosetta scores to select models after the Rosetta refinement stages of the protocol, a consensus score that took into account the fit-to-density of models as well as the Rosetta score was used. By using the consensus score measure in selecting structures in Rosetta model generation, we were able to pick better models than just using Rosetta score which is the standard practice. This improvement was prominent when medium-resolution density maps were used. This protocol was able to further refine our previous set of soluble proteins. The resolution of the density maps determined the extent of the refinement. High-resolution maps (4 Å) were able to refine models better than medium-resolution maps (6.9 Å). Model evaluation methods showed that final refined models were not only close to native but also good quality models as well. The refinement of membrane proteins was more challenging because the membrane systems need to be prepared and then the simulations had to account for the different solvation patterns. Unlike for soluble protein simulations, in membrane protein simulations the proteins needed to be embedded in the membranes with the correct orientation of the proteins in nature. It was also important to have an equilibrated membrane system with lipids well packed around the protein before the unrestrained production runs were performed. Our previous protocol had to be modified to account for these explicit membrane simulations. The Rosetta refinement protocol guided by density that was used in soluble protein simulations also had to be adjusted for membrane proteins. The Rosetta solvation energy term was adjusted to account for the membrane environment implicitly.
When noisy density maps that mimicked experimental error were used in the refinement protocol the refinement results agreed overall with that of noise-free refinement, indicating that the protocol can successfully deal with noisy input maps. The ultimate targets of the iterative Rosetta-MD protocol are experimental cryo-EM structures. As a proof-of-concept, we tested this protocol on experimental density data for HIV-1. The testing of our protocol with the experimental 5 Å density map of HIV-1 CTD showed that the starting structures can be refined to RMSDs of less than 1 Å. Success of structure refinement using both the noisy maps and the experimental density map shows great promise in structure refinement when experimental cryo-EM restraints are available. This tool is not only applicable to membrane proteins but could be used with any kind of protein structure. Due to today’s growing number of cryo-EM protein structures determined using medium and near-atomic resolution density maps, our protocol will be increasingly useful to fine tune these structures to near-native resolutions.
Supplementary Material
Acknowledgments
The authors would also like to thank the members of the Lindert group for useful discussions. Work in the Lindert laboratory is supported through NIH (R03 AG054904). We would like to thank the Ohio Supercomputer Center for valuable computational resources 97.
Footnotes
The main supporting information pdf file contains the following information: The refinement of the 2MAW ab initio starting structure without manual adjustment is shown in Figure S1. The MDFF simulations using different gscale parameters for 4 Å and 6.9 Å resolution maps are compared in Figures S2 and S3 respectively. The Rosetta-MD protocol capture and the procedure for density map simulations are also included in the supporting information pdf file. In addition to the pdf file, we also added a zip file containing all files necessary to repeat the simulations. All simulated density maps for the 5 proteins at 4 Å resolution (1PY6_native_4A.mrc, 2LLY_native_4A.mrc, 2MAW_native_4A.mrc, 4G80_native_4A.mrc, 4RYM_native_4A.mrc) and 6.9 Å resolution ((1PY6_native_6.9A.mrc, 2LLY_native_6.9A.mrc, 2MAW_native_6.9A.mrc, 4G80_native_6.9A.mrc, 4RYM_native_6.9A.mrc) are included. The ab initio starting structures used are 1PY6_start.pdb, 2LLY_start.pdb, 2MAW_start.pdb, 4G80_start.pdb, and 4RYM_start.pdb. The final refined structures obtained using 4 Å resolution density maps are 1PY6_refined_4A.pdb, 2LLY_refined_4A.pdb, 2MAW_refined_4A.pdb, 4G80_refrned_4A.pdb, and 4RYM_refined_4A.pdb. The final refined structures obtained using 6.9 Å resolution density maps are 1PY6_refined_6.9A.pdb, 2LLY_refined_6.9A.pdb, 2MAW_refined_6.9A.pdb, 4G80_refined_6.9A.pdb, and 4RYM_refined_6.9A.pdb. The segmented experimental density map of the CTD of HIV-1 capsid protein is HIV1_sec2.mrc and the two starting ab initio models used in the refinement are HIV1_3A_model_aligned.pdb and HIV1_5A_model_aligned.pdb. The final refined model of the HIV-1 CTD is HIV1_refined.pdb. The tcl script last_frame_02_prepare.tcl was used to prepare the MDFF input files and last_frame_02_MDFF_1-step1.namd is the MDFF configuration file used in MDFF simulations. Simulation configuration files used for the melting of lipid tails and minimization/equilibration of the system with protein coordinates fixed, are melting-01.conf and protein_fixed-02.conf respectively. The xml input file used in the Rosetta density refinement is xml_local_rebuilting_mem.xml. This information is available free of charge via the Internet at http://pubs.acs.org.
References
- 1.Alberts B, Johnson A, Lewis J, Raff M, Roberts K, Walter P. The shape and structure of proteins. 2002 [Google Scholar]
- 2.Jacobson M, Sali A. Comparative protein structure modeling and its applications to drug discovery. Annual reports in medicinal chemistry. 2004;39:259–276. [Google Scholar]
- 3.Almén MS, Nordström KJV, Fredriksson R, Schiöth HB. Mapping the human membrane proteome: a majority of the human membrane proteins can be classified according to function and evolutionary origin. BMC Biology. 2009;7:50–50. doi: 10.1186/1741-7007-7-50. [DOI] [PMC free article] [PubMed] [Google Scholar]
- 4.Elokely K, Velisetty P, Delemotte L, Palovcak E, Klein ML, Rohacs T, Carnevale V. Understanding TRPV1 activation by ligands: Insights from the binding modes of capsaicin and resiniferatoxin. Proceedings of the National Academy of Sciences. 2016;113(2):E137–E145. doi: 10.1073/pnas.1517288113. [DOI] [PMC free article] [PubMed] [Google Scholar]
- 5.Bae C, Anselmi C, Kalia J, Jara-Oseguera A, Schwieters CD, Krepkiy D, Won Lee C, Kim EH, Kim JI, Faraldo-Gómez JD, Swartz KJ. Structural insights into the mechanism of activation of the TRPV1 channel by a membrane-bound tarantula toxin. elife. 2016;5:e11273. doi: 10.7554/eLife.11273. [DOI] [PMC free article] [PubMed] [Google Scholar]
- 6.Leelananda SP, Lindert S. Computational methods in drug discovery. Beilstein Journal of Organic Chemistry. 2016;12:2694–2718. doi: 10.3762/bjoc.12.267. [DOI] [PMC free article] [PubMed] [Google Scholar]
- 7.Sliwoski G, Kothiwale S, Meiler J, Lowe EW. Computational Methods in Drug Discovery. Pharmacological Reviews. 2014;66(1):334–395. doi: 10.1124/pr.112.007336. [DOI] [PMC free article] [PubMed] [Google Scholar]
- 8.Anderson AC. The Process of Structure-Based Drug Design. Chemistry & Biology. 2003;10(9):787–797. doi: 10.1016/j.chembiol.2003.09.002. [DOI] [PubMed] [Google Scholar]
- 9.Shafer RW, Schapiro JM. HIV-1 drug resistance mutations: an updated framework for the second decade of HAART. AIDS reviews. 2008;10(2):67. [PMC free article] [PubMed] [Google Scholar]
- 10.Davis AM, Teague SJ, Kleywegt GJ. Application and limitations of X-ray crystallographic data in structure-based ligand and drug design. Angewandte Chemie International Edition. 2003;42(24):2718–2736. doi: 10.1002/anie.200200539. [DOI] [PubMed] [Google Scholar]
- 11.Dukka BK. Recent advances in sequence-based protein structure prediction. Briefings in Bioinformatics. 2016:bbw070. doi: 10.1093/bib/bbw070. [DOI] [PubMed] [Google Scholar]
- 12.Berman HM, Kleywegt GJ, Nakamura H, Markley JL. The Protein Data Bank at 40: Reflecting on the Past to Prepare for the Future. Structure (London, England: 1993) 2012;20(3):391–396. doi: 10.1016/j.str.2012.01.010. [DOI] [PMC free article] [PubMed] [Google Scholar]
- 13.Berman HM, Westbrook J, Feng Z, Gilliland G, Bhat TN, Weissig H, Shindyalov IN, Bourne PE. The protein data bank. Nucleic acids research. 2000;28(1):235–242. doi: 10.1093/nar/28.1.235. [DOI] [PMC free article] [PubMed] [Google Scholar]
- 14.Berman HM. The protein data bank: a historical perspective. Acta Crystallographica Section A: Foundations of Crystallography. 2008;64(1):88–95. doi: 10.1107/S0108767307035623. [DOI] [PubMed] [Google Scholar]
- 15.Berman HM, Coimbatore Narayanan B, Costanzo LD, Dutta S, Ghosh S, Hudson BP, Lawson CL, Peisach E, Prlić A, Rose PW. Trendspotting in the protein data bank. FEBS letters. 2013;587(8):1036–1045. doi: 10.1016/j.febslet.2012.12.029. [DOI] [PMC free article] [PubMed] [Google Scholar]
- 16.Berman HM, Battistuz T, Bhat TN, Bluhm WF, Bourne PE, Burkhardt K, Feng Z, Gilliland GL, Iype L, Jain S. The protein data bank. Acta Crystallographica Section D: Biological Crystallography. 2002;58(6):899–907. doi: 10.1107/s0907444902003451. [DOI] [PubMed] [Google Scholar]
- 17.Krishnan VV, Rupp B. eLS. John Wiley & Sons, Ltd; 2001. Macromolecular Structure Determination: Comparison of X-ray Crystallography and NMR Spectroscopy. [Google Scholar]
- 18.Benvenuti M, Mangani S. Crystallization of soluble proteins in vapor diffusion for x-ray crystallography. Nat Protocols. 2007;2(7):1633–1651. doi: 10.1038/nprot.2007.198. [DOI] [PubMed] [Google Scholar]
- 19.Skinner AL, Laurence JS. High-field solution NMR spectroscopy as a tool for assessing protein interactions with small molecule ligands. Journal of pharmaceutical sciences. 2008;97(11):4670–4695. doi: 10.1002/jps.21378. [DOI] [PMC free article] [PubMed] [Google Scholar]
- 20.Callaway E. The revolution will not be crystallized. Nature. 2015;525(7568):172. doi: 10.1038/525172a. [DOI] [PubMed] [Google Scholar]
- 21.Kühlbrandt W. The Resolution Revolution. Science. 2014;343(6178):1443. doi: 10.1126/science.1251652. [DOI] [PubMed] [Google Scholar]
- 22.Doerr A. Single-particle cryo-electron microscopy. Nat Meth. 2016;13(1):23–23. doi: 10.1038/nmeth.3700. [DOI] [PubMed] [Google Scholar]
- 23.Vinothkumar KR. Membrane protein structures without crystals, by single particle electron cryomicroscopy. Current Opinion in Structural Biology. 2015;33:103–114. doi: 10.1016/j.sbi.2015.07.009. [DOI] [PMC free article] [PubMed] [Google Scholar]
- 24.Cheng Y. Single-particle cryo-EM at crystallographic resolution. Cell. 2015;161(3):450–457. doi: 10.1016/j.cell.2015.03.049. [DOI] [PMC free article] [PubMed] [Google Scholar]
- 25.McMullan G, Faruqi AR, Clare D, Henderson R. Comparison of optimal performance at 300keV of three direct electron detectors for use in low dose electron microscopy. Ultramicroscopy. 2014;147:156–63. doi: 10.1016/j.ultramic.2014.08.002. [DOI] [PMC free article] [PubMed] [Google Scholar]
- 26.Veesler D, Campbell MG, Cheng A, Fu CY, Murez Z, Johnson JE, Potter CS, Carragher B. Maximizing the potential of electron cryomicroscopy data collected using direct detectors. J Struct Biol. 2013;184(2):193–202. doi: 10.1016/j.jsb.2013.09.003. [DOI] [PMC free article] [PubMed] [Google Scholar]
- 27.Scheres SH. RELION: implementation of a Bayesian approach to cryo-EM structure determination. J Struct Biol. 2012;180(3):519–30. doi: 10.1016/j.jsb.2012.09.006. [DOI] [PMC free article] [PubMed] [Google Scholar]
- 28.Efremov RG, Leitner A, Aebersold R, Raunser S. Architecture and conformational switch mechanism of the ryanodine receptor. Nature. 2015;517(7532):39–43. doi: 10.1038/nature13916. [DOI] [PubMed] [Google Scholar]
- 29.Meyerson JR, Kumar J, Chittori S, Rao P, Pierson J, Bartesaghi A, Mayer ML, Subramaniam S. Structural mechanism of glutamate receptor activation and desensitization. Nature. 2014;514(7522):328–34. doi: 10.1038/nature13603. [DOI] [PMC free article] [PubMed] [Google Scholar]
- 30.Jiang J, Pentelute BL, Collier RJ, Zhou ZH. Atomic structure of anthrax protective antigen pore elucidates toxin translocation. Nature. 2015;521(7553):545–9. doi: 10.1038/nature14247. [DOI] [PMC free article] [PubMed] [Google Scholar]
- 31.Yan Z, Bai XC, Yan C, Wu J, Li Z, Xie T, Peng W, Yin CC, Li X, Scheres SH, Shi Y, Yan N. Structure of the rabbit ryanodine receptor RyR1 at near-atomic resolution. Nature. 2015;517(7532):50–5. doi: 10.1038/nature14063. [DOI] [PMC free article] [PubMed] [Google Scholar]
- 32.Liao M, Cao E, Julius D, Cheng Y. Structure of the TRPV1 ion channel determined by electron cryo-microscopy. Nature. 2013;504(7478):107–112. doi: 10.1038/nature12822. [DOI] [PMC free article] [PubMed] [Google Scholar]
- 33.Lu P, Bai X-c, Ma D, Xie T, Yan C, Sun L, Yang G, Zhao Y, Zhou R, Scheres SHW. Three-dimensional structure of human [ggr]-secretase. Nature. 2014;512(7513):166–170. doi: 10.1038/nature13567. [DOI] [PMC free article] [PubMed] [Google Scholar]
- 34.Schmidt C, Kowalinski E, Shanmuganathan V, Defenouillère Q, Braunger K, Heuer A, Pech M, Namane A, Berninghausen O, Fromont-Racine M. The cryo-EM structure of a ribosome-Ski2-Ski3-Ski8 helicase complex. Science. 2016;354(6318):1431–1433. doi: 10.1126/science.aaf7520. [DOI] [PubMed] [Google Scholar]
- 35.Blow DM. Outline of crystallography for biologists. pviii. Oxford University Press; Oxford; New York: 2002. p. 236. [Google Scholar]
- 36.Bartesaghi A, Merk A, Banerjee S, Matthies D, Wu X, Milne JL, Subramaniam S. 2.2 A resolution cryo-EM structure of beta-galactosidase in complex with a cell-permeant inhibitor. Science. 2015;348(6239):1147–51. doi: 10.1126/science.aab1576. [DOI] [PMC free article] [PubMed] [Google Scholar]
- 37.Marks DS, Hopf TA, Sander C. Protein structure prediction from sequence variation. Nature biotechnology. 2012;30(11):1072–1080. doi: 10.1038/nbt.2419. [DOI] [PMC free article] [PubMed] [Google Scholar]
- 38.Lee J, Wu S, Zhang Y. From protein structure to function with bioinformatics. Springer; 2009. Ab initio protein structure prediction; pp. 3–25. [Google Scholar]
- 39.Hardin C, Pogorelov TV, Luthey-Schulten Z. Ab initio protein structure prediction. Current opinion in structural biology. 2002;12(2):176–181. doi: 10.1016/s0959-440x(02)00306-8. [DOI] [PubMed] [Google Scholar]
- 40.Rohl CA, Strauss CEM, Misura KMS, Baker D. Protein structure prediction using Rosetta. Methods in enzymology. 2004;383:66–93. doi: 10.1016/S0076-6879(04)83004-0. [DOI] [PubMed] [Google Scholar]
- 41.Bradley P, Misura KMS, Baker D. Toward high-resolution de novo structure prediction for small proteins. Science. 2005;309(5742):1868–1871. doi: 10.1126/science.1113801. [DOI] [PubMed] [Google Scholar]
- 42.Eswar N, Webb B, Marti-Renom MA, Madhusudhan MS, Eramian D, Shen My, Pieper U, Sali A. Comparative Protein Structure Modeling Using Modeller. Current protocols in bioinformatics/editoral board, Andreas D.Baxevanis …[et al.] 2006;0 5(Unit-5) doi: 10.1002/0471250953.bi0506s15. [DOI] [PMC free article] [PubMed] [Google Scholar]
- 43.Zhang Y. I-TASSER server for protein 3D structure prediction. BMC bioinformatics. 2008;9(40) doi: 10.1186/1471-2105-9-40. [DOI] [PMC free article] [PubMed] [Google Scholar]
- 44.Enyedy IJ, Lee S-L, Kuo AH, Dickson RB, Lin C-Y, Wang S. Structure-based approach for the discovery of bis-benzamidines as novel inhibitors of matriptase. Journal of medicinal chemistry. 2001;44(9):1349–1355. doi: 10.1021/jm000395x. [DOI] [PubMed] [Google Scholar]
- 45.Roy A, Kucukural A, Zhang Y. I-TASSER: a unified platform for automated protein structure and function prediction. Nature protocols. 2010;5(4):725–738. doi: 10.1038/nprot.2010.5. [DOI] [PMC free article] [PubMed] [Google Scholar]
- 46.Feig M. Computational protein structure refinement: almost there, yet still so far to go. Wiley Interdisciplinary Reviews: Computational Molecular Science. 2017;7(3):e1307-n/a. doi: 10.1002/wcms.1307. [DOI] [PMC free article] [PubMed] [Google Scholar]
- 47.Qian B, Raman S, Das R, Bradley P, McCoy AJ, Read RJ, Baker D. High resolution protein structure prediction and the crystallographic phase problem. Nature. 2007;450(7167):259–264. doi: 10.1038/nature06249. [DOI] [PMC free article] [PubMed] [Google Scholar]
- 48.Barth P, Schonbrun J, Baker D. Toward high-resolution prediction and design of transmembrane helical protein structures. Proceedings of the National Academy of Sciences. 2007;104(40):15682–15687. doi: 10.1073/pnas.0702515104. [DOI] [PMC free article] [PubMed] [Google Scholar]
- 49.Ward AB, Sali A, Wilson IA. Integrative structural biology. Science. 2013;339(6122):913–915. doi: 10.1126/science.1228565. [DOI] [PMC free article] [PubMed] [Google Scholar]
- 50.Webb B, Lasker K, Schneidman-Duhovny D, Tjioe E, Phillips J, Kim SJ, Velázquez-Muriel J, Russel D, Sali A. Modeling of proteins and their assemblies with the integrative modeling platform. Network Biology: Methods and Applications. 2011:377–397. doi: 10.1007/978-1-61779-276-2_19. [DOI] [PubMed] [Google Scholar]
- 51.Alber F, Förster F, Korkin D, Topf M, Sali A. Integrating diverse data for structure determination of macromolecular assemblies. Annu Rev Biochem. 2008;77:443–477. doi: 10.1146/annurev.biochem.77.060407.135530. [DOI] [PubMed] [Google Scholar]
- 52.Shen Y, Lange O, Delaglio F, Rossi P, Aramini JM, Liu G, Eletsky A, Wu Y, Singarapu KK, Lemak A. Consistent blind protein structure generation from NMR chemical shift data. Proceedings of the National Academy of Sciences. 2008;105(12):4685–4690. doi: 10.1073/pnas.0800256105. [DOI] [PMC free article] [PubMed] [Google Scholar]
- 53.Bowers PM, Strauss CEM, Baker D. De novo protein structure determination using sparse NMR data. Journal of Biomolecular NMR. 2000;18(4):311–318. doi: 10.1023/a:1026744431105. [DOI] [PubMed] [Google Scholar]
- 54.Shen Y, Vernon R, Baker D, Bax A. De novo protein structure generation from incomplete chemical shift assignments. Journal of biomolecular NMR. 2009;43(2):63–78. doi: 10.1007/s10858-008-9288-5. [DOI] [PMC free article] [PubMed] [Google Scholar]
- 55.Kalinin S, Peulen T, Sindbert S, Rothwell PJ, Berger S, Restle T, Goody RS, Gohlke H, Seidel CAM. A toolkit and benchmark study for FRET-restrained high-precision structural modeling. Nat Meth. 2012;9(12):1218–1225. doi: 10.1038/nmeth.2222. [DOI] [PubMed] [Google Scholar]
- 56.Alexander N, Bortolus M, Al-Mestarihi A, McHaourab H, Meiler J. De Novo High-Resolution Protein Structure Determination from Sparse Spin labeling EPR Data. Structure (London, England: 1993) 2008;16(2):181–195. doi: 10.1016/j.str.2007.11.015. [DOI] [PMC free article] [PubMed] [Google Scholar]
- 57.Fischer AW, Alexander NS, Woetzel N, Karakas M, Weiner BE, Meiler J. BCL:: MP-fold: Membrane protein structure prediction guided by EPR restraints. Proteins: Structure, Function, and Bioinformatics. 2015;83(11):1947–1962. doi: 10.1002/prot.24801. [DOI] [PMC free article] [PubMed] [Google Scholar]
- 58.DiMaio F, Tyka MD, Baker ML, Chiu W, Baker D. Refinement of Protein Structures into Low-Resolution Density Maps using Rosetta. Journal of molecular biology. 2009;392(1):181–190. doi: 10.1016/j.jmb.2009.07.008. [DOI] [PMC free article] [PubMed] [Google Scholar]
- 59.Lindert S, Staritzbichler R, Wötzel N, Karakaş M, Stewart PL, Meiler J. EM-Fold: De Novo Folding of α-Helical Proteins Guided by Intermediate-Resolution Electron Microscopy Density Maps. Structure. 2009;17(7):990–1003. doi: 10.1016/j.str.2009.06.001. [DOI] [PMC free article] [PubMed] [Google Scholar]
- 60.Lindert S, Alexander N, Wötzel N, Karakaş M, Stewart Phoebe L, Meiler J. EM-Fold: De Novo Atomic-Detail Protein Structure Determination from Medium-Resolution Density Maps. Structure. 2012;20(3):464–478. doi: 10.1016/j.str.2012.01.023. [DOI] [PMC free article] [PubMed] [Google Scholar]
- 61.Putnam DK, Weiner BE, Woetzel N, Lowe EW, Meiler J. BCL::SAXS: GPU Accelerated Debye Method for computation of Small Angle X Ray Scattering Profiles. Proteins. 2015;83(8):1500–1512. doi: 10.1002/prot.24838. [DOI] [PMC free article] [PubMed] [Google Scholar]
- 62.Schneidman-Duhovny D, Kim SJ, Sali A. Integrative structural modeling with small angle X-ray scattering profiles. BMC structural biology. 2012;12(1):17. doi: 10.1186/1472-6807-12-17. [DOI] [PMC free article] [PubMed] [Google Scholar]
- 63.Vandavasi VG, Putnam DK, Zhang Q, Petridis L, Heller WT, Nixon BT, Haigler CH, Kalluri U, Coates L, Langan P. A structural study of CESA1 catalytic domain of Arabidopsis cellulose synthesis complex: evidence for CESA trimers. Plant physiology. 2016;170(1):123–135. doi: 10.1104/pp.15.01356. [DOI] [PMC free article] [PubMed] [Google Scholar]
- 64.Hofmann T, Fischer AW, Meiler J, Kalkhof S. Protein structure prediction guided by crosslinking restraints-A systematic evaluation of the impact of the crosslinking spacer length. Methods. 2015;89:79–90. doi: 10.1016/j.ymeth.2015.05.014. [DOI] [PMC free article] [PubMed] [Google Scholar]
- 65.Kahraman A, Herzog F, Leitner A, Rosenberger G, Aebersold R, Malmström L. Cross-link guided molecular modeling with ROSETTA. PLoS One. 2013;8(9):e73411. doi: 10.1371/journal.pone.0073411. [DOI] [PMC free article] [PubMed] [Google Scholar]
- 66.Politis A, Schmidt C, Tjioe E, Sandercock Alan M, Lasker K, Gordiyenko Y, Russel D, Sali A, Robinson Carol V. Topological Models of Heteromeric Protein Assemblies from Mass Spectrometry: Application to the Yeast eIF3:eIF5 Complex. Chemistry & Biology. 2015;22(1):117–128. doi: 10.1016/j.chembiol.2014.11.010. [DOI] [PMC free article] [PubMed] [Google Scholar]
- 67.Thompson JM, Sgourakis NG, Liu G, Rossi P, Tang Y, Mills JL, Szyperski T, Montelione GT, Baker D. Accurate protein structure modeling using sparse NMR data and homologous structure information. Proceedings of the National Academy of Sciences. 2012;109(25):9875–9880. doi: 10.1073/pnas.1202485109. [DOI] [PMC free article] [PubMed] [Google Scholar]
- 68.Hirst SJ, Alexander N, McHaourab HS, Meiler J. RosettaEPR: An integrated tool for protein structure determination from sparse EPR data. Journal of Structural Biology. 2011;173(3):506–514. doi: 10.1016/j.jsb.2010.10.013. [DOI] [PMC free article] [PubMed] [Google Scholar]
- 69.Trabuco LG, Villa E, Schreiner E, Harrison CB, Schulten K. Molecular dynamics flexible fitting: A practical guide to combine cryo-electron microscopy and X-ray crystallography. Methods. 2009;49(2):174–180. doi: 10.1016/j.ymeth.2009.04.005. [DOI] [PMC free article] [PubMed] [Google Scholar]
- 70.MacCallum JL, Perez A, Dill KA. Determining protein structures by combining semireliable data with atomistic physical models by Bayesian inference. Proceedings of the National Academy of Sciences. 2015;112(22):6985–6990. doi: 10.1073/pnas.1506788112. [DOI] [PMC free article] [PubMed] [Google Scholar]
- 71.McGreevy R, Teo I, Singharoy A, Schulten K. Advances in the molecular dynamics flexible fitting method for cryo-EM modeling. Methods. 2016;100:50–60. doi: 10.1016/j.ymeth.2016.01.009. [DOI] [PMC free article] [PubMed] [Google Scholar]
- 72.Singharoy A, Teo I, McGreevy R, Stone JE, Zhao J, Schulten K. Molecular dynamics-based refinement and validation for sub-5 Å cryo-electron microscopy maps. Elife. 2016;5:e16105. doi: 10.7554/eLife.16105. [DOI] [PMC free article] [PubMed] [Google Scholar]
- 73.Hsin J, Gumbart J, Trabuco LG, Villa E, Qian P, Hunter CN, Schulten K. Protein-Induced Membrane Curvature Investigated through Molecular Dynamics Flexible Fitting. Biophysical Journal. 2009;97(1):321–329. doi: 10.1016/j.bpj.2009.04.031. [DOI] [PMC free article] [PubMed] [Google Scholar]
- 74.Robustelli P, Kohlhoff K, Cavalli A, Vendruscolo M. Using NMR chemical shifts as structural restraints in molecular dynamics simulations of proteins. Structure. 2010;18(8):923–933. doi: 10.1016/j.str.2010.04.016. [DOI] [PubMed] [Google Scholar]
- 75.Lindert S, Meiler J, McCammon JA. Iterative Molecular Dynamics—Rosetta Protein Structure Refinement Protocol to Improve Model Quality. Journal of chemical theory and computation. 2013;9(8):3843–3847. doi: 10.1021/ct400260c. [DOI] [PMC free article] [PubMed] [Google Scholar]
- 76.Lindert S, McCammon JA. Improved cryoEM-Guided Iterative Molecular Dynamics–Rosetta Protein Structure Refinement Protocol for High Precision Protein Structure Prediction. Journal of Chemical Theory and Computation. 2015;11(3):1337–1346. doi: 10.1021/ct500995d. [DOI] [PMC free article] [PubMed] [Google Scholar]
- 77.Schweitzer A, Aufderheide A, Rudack T, Beck F, Pfeifer G, Plitzko JM, Sakata E, Schulten K, Förster F, Baumeister W. Structure of the human 26S proteasome at a resolution of 3.9 Å. Proceedings of the National Academy of Sciences. 2016:201608050. doi: 10.1073/pnas.1608050113. [DOI] [PMC free article] [PubMed] [Google Scholar]
- 78.Chen VB, Arendall WB, Headd JJ, Keedy DA, Immormino RM, Kapral GJ, Murray LW, Richardson JS, Richardson DC. MolProbity: all-atom structure validation for macromolecular crystallography. Acta Crystallographica Section D: Biological Crystallography. 2010;66(1):12–21. doi: 10.1107/S0907444909042073. [DOI] [PMC free article] [PubMed] [Google Scholar]
- 79.Davis IW, Leaver-Fay A, Chen VB, Block JN, Kapral GJ, Wang X, Murray LW, Arendall WB, Snoeyink J, Richardson JS. MolProbity: all-atom contacts and structure validation for proteins and nucleic acids. Nucleic acids research. 2007;35(suppl 2):W375–W383. doi: 10.1093/nar/gkm216. [DOI] [PMC free article] [PubMed] [Google Scholar]
- 80.Baker ML, Baker MR, Hryc CF, Ju T, Chiu W. Gorgon and pathwalking: macromolecular modeling tools for subnanometer resolution density maps. Biopolymers. 2012;97(9):655–668. doi: 10.1002/bip.22065. [DOI] [PMC free article] [PubMed] [Google Scholar]
- 81.Baker ML, Ju T, Chiu W. Identification of Secondary Structure Elements in Intermediate-Resolution Density Maps. Structure. 2007;15(1):7–19. doi: 10.1016/j.str.2006.11.008. [DOI] [PMC free article] [PubMed] [Google Scholar]
- 82.Lindert S, Hofmann T, Wötzel N, Karakaş M, Stewart PL, Meiler J. Ab initio protein modeling into CryoEM density maps using EM-Fold. Biopolymers. 2012;97(9):669–677. doi: 10.1002/bip.22027. [DOI] [PMC free article] [PubMed] [Google Scholar]
- 83.Yarov-Yarovoy V, Schonbrun J, Baker D. Multipass Membrane Protein Structure Prediction Using Rosetta. Proteins. 2006;62(4):1010–1025. doi: 10.1002/prot.20817. [DOI] [PMC free article] [PubMed] [Google Scholar]
- 84.Viklund H, Elofsson A. OCTOPUS: improving topology prediction by two-track ANN-based preference scores and an extended topological grammar. Bioinformatics. 2008;24(15):1662–1668. doi: 10.1093/bioinformatics/btn221. [DOI] [PubMed] [Google Scholar]
- 85.Johnson M, Zaretskaya I, Raytselis Y, Merezhuk Y, McGinnis S, Madden TL. NCBI BLAST: a better web interface. Nucleic Acids Research. 2008;36(suppl 2):W5–W9. doi: 10.1093/nar/gkn201. [DOI] [PMC free article] [PubMed] [Google Scholar]
- 86.Kim DE, Chivian D, Baker D. Protein structure prediction and analysis using the Robetta server. Nucleic acids research. 2004;32(suppl 2):W526–W531. doi: 10.1093/nar/gkh468. [DOI] [PMC free article] [PubMed] [Google Scholar]
- 87.Woetzel N, Karakaş M, Staritzbichler R, Müller R, Weiner BE, Meiler J. BCL::Score—Knowledge Based Energy Potentials for Ranking Protein Models Represented by Idealized Secondary Structure Elements. PLOS ONE. 2012;7(11):e49242. doi: 10.1371/journal.pone.0049242. [DOI] [PMC free article] [PubMed] [Google Scholar]
- 88.Pettersen EF, Goddard TD, Huang CC, Couch GS, Greenblatt DM, Meng EC, Ferrin TE. UCSF Chimera—a visualization system for exploratory research and analysis. Journal of computational chemistry. 2004;25(13):1605–1612. doi: 10.1002/jcc.20084. [DOI] [PubMed] [Google Scholar]
- 89.Lomize MA, Lomize AL, Pogozheva ID, Mosberg HI. OPM: orientations of proteins in membranes database. Bioinformatics. 2006;22(5):623–625. doi: 10.1093/bioinformatics/btk023. [DOI] [PubMed] [Google Scholar]
- 90.Wriggers W. Conventions and workflows for using Situs. Acta Crystallographica Section D: Biological Crystallography. 2012;68(4):344–351. doi: 10.1107/S0907444911049791. [DOI] [PMC free article] [PubMed] [Google Scholar]
- 91.Woetzel N, Lindert S, Stewart PL, Meiler J. BCL:: EM-Fit: Rigid body fitting of atomic structures into density maps using geometric hashing and real space refinement. Journal of structural biology. 2011;175(3):264–276. doi: 10.1016/j.jsb.2011.04.016. [DOI] [PMC free article] [PubMed] [Google Scholar]
- 92.DiMaio F, Song Y, Li X, Brunner MJ, Xu C, Conticello V, Egelman E, Marlovits TC, Cheng Y, Baker D. Atomic-accuracy models from 4.5-A cryo-electron microscopy data with density-guided iterative local refinement. Nat Meth. 2015;12(4):361–365. doi: 10.1038/nmeth.3286. [DOI] [PMC free article] [PubMed] [Google Scholar]
- 93.Wang RYR, Song Y, Barad BA, Cheng Y, Fraser JS, DiMaio F. Automated structure refinement of macromolecular assemblies from cryo-EM maps using Rosetta. eLife. 2016;5:e17219. doi: 10.7554/eLife.17219. [DOI] [PMC free article] [PubMed] [Google Scholar]
- 94.DiMaio F, Chiu W. Tools for Model Building and Optimization into Near-Atomic Resolution Electron Cryo-Microscopy Density Maps. Methods in enzymology. 2016;579:255–276. doi: 10.1016/bs.mie.2016.06.003. [DOI] [PMC free article] [PubMed] [Google Scholar]
- 95.Perilla JR, Zhao G, Lu M, Ning J, Hou G, Byeon l-JL, Gronenborn AM, Polenova T, Zhang P. CryoEM Structure Refinement by Integrating NMR Chemical Shifts with Molecular Dynamics Simulations. The Journal of Physical Chemistry B. 2017 doi: 10.1021/acs.jpcb.6b13105. [DOI] [PMC free article] [PubMed] [Google Scholar]
- 96.Barad BA, Echols N, Wang RY-R, Cheng Y, DiMaio F, Adams PD, Fraser JS. EMRinger: Side chain-directed model and map validation for 3D cryo-electron microscopy. Nature methods. 2015 doi: 10.1038/nmeth.3541. [DOI] [PMC free article] [PubMed] [Google Scholar]
- 97.Ohio Supercomputer Center. 1987.
Associated Data
This section collects any data citations, data availability statements, or supplementary materials included in this article.


