

Significance
Endothelial responses to shear stress modulate vascular homeostasis. This study offers a comprehensive temporal mechanistic model of shear stress response in cultured human vascular endothelial cells by presenting a systematic time-series RNA-sequencing dataset on endothelial cells exposed to pulsatile and oscillatory shears, consisting of 10 time points across 24 h. The experimental data were used for pathway analysis and construction of transcription factor-to-gene networks. The model highlights (i) dynamic regulation of several key shear-sensitive endothelial functions relevant to atheroprotective vs. atherogenic phenotype, (ii) how these functions may be causally interrelated, and (iii) how they are regulated by common upstream shear-responsive transcription factors. The results provide insights into the dynamics of functional evolution over time.
Keywords: endothelial cells, systems biology, time-series analysis, RNA-seq, shear stress
Abstract
Blood flow and vascular shear stress patterns play a significant role in inducing and modulating physiological responses of endothelial cells (ECs). Pulsatile shear (PS) is associated with an atheroprotective endothelial phenotype, while oscillatory shear (OS) is associated with an atheroprone endothelial phenotype. Although mechanisms of endothelial shear response have been extensively studied, most studies focus on characterization of single molecular pathways, mainly at fixed time points after stress application. Here, we carried out a longitudinal time-series study to measure the transcriptome after the application of PS and OS. We performed systems analyses of transcriptional data of cultured human vascular ECs to elucidate the dynamics of endothelial responses in several functional pathways such as cell cycle, oxidative stress, and inflammation. By combining the temporal data on differentially expressed transcription factors and their targets with existing knowledge on relevant functional pathways, we infer the causal relationships between disparate endothelial functions through common transcriptional regulation mechanisms. Our study presents a comprehensive temporally longitudinal experimental study and mechanistic model of shear stress response. By comparing the relative endothelial expressions of genes between OS and PS, we provide insights and an integrated perspective into EC function in response to differential shear. This study has significant implications for the pathogenesis of vascular diseases.
Hemodynamic forces exerted by blood flow on endothelial cells play a significant role in the onset of atherosclerotic plaques, along with cellular elements such as platelets, macrophages, and monocytes (1–3). Vascular endothelial cells (ECs) exhibit physiological or pathophysiological responses to hemodynamic forces. Pulsatile blood flow, characterized by a positive mean flow rate, exerts pulsatile shear (PS) on the endothelium and is associated with an atheroprotective endothelial phenotype. Disturbed flow, characterized by irregular flow patterns with little to no mean flow rate, exerts oscillatory shear (OS) on the endothelium, which is associated with an atheroprone endothelial phenotype (1, 4–6). Prior research has established the pathophysiologic association of specific waveforms (termed “atheroprone” vs. “atheroprotective”), measured by detailed flow analyses in actual in vivo human arterial geometries that are typically susceptible vs. resistant to atherosclerotic lesion formation (6). This study (6) provided a key link between in vivo pathophysiology and in vitro modeling that strengthens the rationale for the current systems biology approach.
There are several well-defined mechanisms for endothelial responses to different shears. ECs feature several mechanosensors that include vascular endothelial (VE)-cadherin, integrins, and ion channels (7, 8). The up-regulation of Krüppel-like factor 2 (KLF2) is a well-established hallmark of endothelial response to laminar flow (and PS) (9, 10), along with endothelial nitric oxide synthase (eNOS) up-regulation and activity (11). Compared with laminar or pulsatile flow, disturbed flow impairs endothelial homeostasis through three major processes: (i) It induces higher levels of reactive oxygen species (ROS) via the up-regulation of NADPH oxidase (NOX) and dysfunction of mitochondrial respiration chain (4, 5); (ii) it causes a higher rate of endothelial proliferation, in part due to mTOR activation (4, 5); and (iii) it elicits a proinflammatory response through the activation of NF-κB and AP-1 transcription factors (TFs), thereby regulating adhesion molecules such as VCAM-1 and E-selectin and cytokines such as MCP-1 (4, 5).
The mechanisms of EC response to distinct shear stresses have been inferred primarily from signaling and transcriptional measurements (12–16). Transcriptional measurements have been carried out at specific time points after the application of stress, providing only snapshot profiles of altered gene expression (14, 17, 18). To obtain dynamic mechanisms of endothelial response to shear, it is necessary to carry out time-series transcriptomic measurements. In this study, we explore the dynamics using RNA-sequencing (RNA-seq) measurements at several distinct time points followed by temporal longitudinal analysis of the mechanisms of response. We present a dynamical map of endothelial response as well as reconstructing the differences in transcriptional regulation across OS and PS conditions. The analysis of temporally longitudinal data shows the evolution of cellular response to stress, implicating genes representing several cellular and tissue functions including oxidative stress, inflammation, and cell cycle. This study provides a detailed, temporally longitudinal experimental study and systems model of endothelial responses to shear stress.
Methods
Culture conditions of human umbilical vein endothelial cells (HUVECs) and shear stress experiments for OS, PS, and low-flow (static, ST) conditions were performed as previously described (19, 20). See SI Methods for specific details of RNA-seq experiments and data analysis.
SI Methods
Cell Culture.
HUVECs were cultured in medium M199 (Gibco) supplemented with 15% FBS (Omega), 3 ng/mL β-EC growth factor (Sigma), 4 U/mL heparin (Sigma), and 100 U/mL penicillin-streptomycin (19).
Shear Stress Experiments.
PS flow or OS flow was applied to ECs with a shear stress of 12 ± 5 dyn/cm2 or 0.5 ± 5 dyn/cm2, respectively. Samples for RNA-seq analysis were collected at 1, 2, 3, 4, 6, 9, 12, 16, 20, and 24 h after exposure to shear. ECs were also exposed to a low-flow condition, i.e., 0.5 dyn/cm2 laminar flow, which was designated as an ST condition. Samples for RNA-seq analysis were collected at hour 1 for the ST condition. Two biological replicates were collected for each time point and for each shear condition.
RNA Isolation and RNA-Seq Library Preparation.
Total RNA from HUVECs was extracted by using the mirVana miRNA Isolation Kit (catalog no. AM1560; Ambion). The RNA quality was assessed by RNA integrity numbers (RIN), using an Agilent Bioanalyzer; all RNA samples used in this study had a RIN over 9.7 out of 10. The RNAs were polyA-selected, fragmented, and random hexamer primed using the Illumina TruSeq Stranded mRNA Library Preparation Kit. The constructed cDNA library was subjected to single-ended 50-bp sequencing on an Illumina HiSeq 2000 instrument, generating an average of 30 million reads per sample. Data is accessible on GEO (accession no. GSE103672).
RNA-Seq Data Analysis.
RNA-seq fastq files were aligned to the Human Reference Genome (version hg19/Human.B37.3) and converted to raw RefSeq transcript count files (RefGene) using the Omicsoft Sequence Aligner (OSA) (68). Raw RefSeq transcript counts were combined into raw gene counts by summation. Raw gene counts were normalized and analyzed for differential expression using DESeq2 (69). Pairwise comparisons of OS vs. PS, OS vs. ST, and PS vs. ST were performed for each time point. In comparisons against ST, the ST condition was always set to hour 1. In the case of OS vs. PS, data were compared at each respective time point. After completing the differential expression analysis, only the genes with mean normalized read count greater than five were considered for further analysis. A raw P value cutoff of 0.05 was used to determine differential expression of genes across conditions. Adjusted P values were not used for differential expression analysis because of the prohibitively low number of DE genes in the early hours of shear exposure.
Temporal Map of Functional Regulation.
GSEA was used for pathway enrichment analysis and was performed on the log fold-change values of genes between OS vs. PS (70). Pathway enrichment analysis was also conducted through the ConsensusPathDB platform spanning the KEGG, Reactome, and Wikipathways databases (27, 32) on all genes with P value < 0.05. Functional pathways describing temporal activation were constructed through a combination of curated pathways and manual literature search.
Cluster Analysis of TFs.
To study the mechanistic regulation of TFs in ECs under shear, 1,391 putative human TFs were considered based on a previous study (71). These TFs were filtered by Entrez ID. Ensembl IDs were translated to Entrez IDs and gene names using BioMart (downloaded 2016 July 31) (72). Only TFs with a valid Entrez ID were considered for further analysis. TFs with valid Entrez IDs but with gene names that did not match with our data annotation were manually updated to reflect the annotation. TFs were then further filtered by (i) whether the gene existed within our annotation, (ii) their base mean count in our time-series RNA-seq data being greater than five, and (iii) being differentially expressed in OS vs. PS in at least one time point. Five hundred unique TFs were isolated in this way.
The distance matrix for clustering of TFs was calculated using Euclidean distance. Fig. S5A shows the resulting hierarchical clusters. An analysis of the cophenetic distances is provided in Fig. S5B. Based on the size of the distances between clusters, it can be seen that the dendrogram is optimally split at three clusters, with diminishing returns for distinctiveness of clusters beyond k = 3. Fig. S5A also displays the mean log2 fold change for each cluster, defined as the following:
Through this analysis, it was determined that two of the three TF clusters were biased toward down-regulation in OS vs. PS, while the third cluster was approximately unbiased. These two down-regulated clusters, when combined, comprise the 96 TFs that were designated as “distinctly downregulated in OS vs. PS.”
Fig. S5.

(A) Dendrogram of 500 hierarchically clustered TFs that were selected based on their level of expression. The dendrogram was split into three clusters. Displayed are the mean log fold changes per cluster, which is calculated from the log fold change for each TF from each time point. (B) Cluster analysis of the dendrogram. The selection of three clusters was determined by the observed change in the magnitude of the height cutoff between three and four clusters. (C and D) Dendrogram of the largest of the three clusters with mean log fold change 0.047 (C) along with further cluster analysis of this cluster (D). The selection of five clusters was determined by the observed stability of mean log fold change from five clusters to six, in addition to the drop in difference between cutoffs.
The TFs of the remaining third cluster were analyzed further. Cluster analysis was repeated on these TFs exclusively (Fig. S5C). Joint analysis of the cophenetic distance between clusters alongside mean log fold change reveals that a selection of five clusters achieves adequate separation of clusters by expression bias while maintaining high distance between clusters (Fig. S5D). The combination of clusters 4 and 5 (having mean log fold change values of 0.230 and 0.323, respectively) comprises the 101 TFs that are designated as “distinctly upregulated in OS vs. PS.”
Transcriptional Regulatory Network.
Using the TRANSFAC database (version 2015.4) (67), we mapped these TFs to their published transcriptional targets. The identified transcriptional networks, including TFs and their targets, were further filtered based on whether they were significantly differentially expressed in OS vs. PS for at least one time point. In cases where a TF was listed as a protein complex, we manually assessed all subunit genes of the complex and designated the complex to be up-regulated or down-regulated based on the direction of regulation of the majority of genes in the complex. TF complexes with no clear direction in expression among their subunits were omitted from the network analysis.
Results
ECs were exposed to OS, PS, and ST conditions. RNA-seq samples were collected for 10 time points across 24 h [data available at Gene Expression Omnibus (GEO) with accession no. GSE103672]. Fig. S1 summarizes the findings from the differential expression analysis. The number of differentially expressed (DE) genes increases over time across all pairwise conditions. As can be seen in Fig. S1A, a majority of DE genes are common in both OS vs. ST and PS vs. ST. However, among this set of DE genes are hundreds of genes that are exclusively differentially expressed in OS vs. ST but not in PS vs. ST, and vice versa. Fig. S1B shows the number of DE genes in OS vs. PS, further highlighting the importance of the type of shear stress in transcriptomic response. To study the specific impact of the type of shear on endothelial cell gene expression, we focus on OS vs. PS differential expression and its mechanistic and phenotypic consequences. We organize the results in terms of phenotypic responses studied as a function of time.
Fig. S1.

Number of DE genes. (A) Number of DE genes using the ST condition (hour 1) as control. (Upper) The number of up-regulated genes. (Lower) The number of down-regulated genes. In each panel, at each time point, the left and right bars show the number of DE genes for OS vs. ST and for PS vs. ST comparisons, respectively. (B) Number of DE genes in OS vs. PS. In each panel, at each time point, the left and right bars show the number of DE genes that are down-regulated and up-regulated in OS vs. PS, respectively.
Cell Cycle.
Prior work has shown that cell-cycle activity in ECs is higher under OS than PS (21). Our gene set enrichment analysis (GSEA) results show consistent up-regulation of cell-cycle–related pathways under OS vs. PS, with processes related to G1/S phase transition being among the top enriched Reactome pathways (Tables S1–S4). Fig. 1A represents the G1/S transition pathway obtained from integration of our data, legacy pathways, and literature (22–27).
Table S1.
Top enriched pathways through GSEA: The top 10 up-regulated enriched Reactome pathways
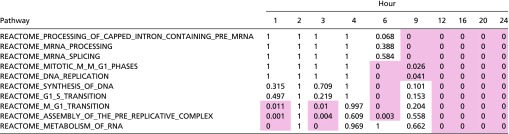 |
The analysis examined log fold changes of genes between OS and PS. Values represent P values that were corrected for familywise error rate with a Bonferroni correction. Values highlighted in red are <0.05. The pathways were sorted by increasing P values, with sorting on the first hour, then the second hour, until reaching the 24th hour.
Table S4.
Top enriched pathways through GSEA: The top 10 down-regulated enriched KEGG pathways
 |
The analysis examined log fold changes of genes between OS and PS. Values represent P values that were corrected for familywise error rate with a Bonferroni correction. Values highlighted in red are <0.05. The pathways were sorted by increasing P values, with sorting on the first hour, then the second hour, until reaching the 24th hour.
Fig. 1.

OS vs. PS log fold-change (LFC) data projected onto the custom pathway consisting of genes and mechanisms exhibiting differential response between OS vs. PS. The heat maps below the gene nodes show the time course of transcriptional changes, representing, from left to right, hours 1, 2, 3, 4, 6, 9, 12, 16, 20, and 24. (A) G1-to-S transition pathway. G1-to-S transition is dependent on the E2F1 activation through RB phosphorylation, which is facilitated in part by CDK2 (bound to cyclin E) and CDK4 (bound to cyclin D). The CDK proteins must be activated by interacting with the CDK-activating kinase. CDKs can also be inhibited by proteins such as CDKN2D. (B) Reconstructed pathway of oxidative stress and superoxide metabolism. Oxygen in the cell is converted to superoxide, hydrogen peroxide, and finally water. Reactive oxygen species are also known to activate HIF1A, a marker of hypoxia. The metallothionein MT1X, which is thought to be hypoxia-responsive, is also shown. (C) AP-1 family of genes and the antioxidant product NQO1. (D) NF-κB and NF-κB target genes.
Table S2.
Top enriched pathways through GSEA: The top 10 down-regulated enriched Reactome pathways
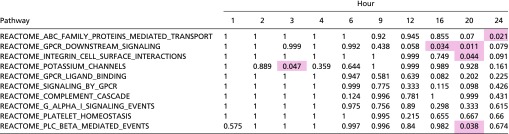 |
The analysis examined log fold changes of genes between OS and PS. Values represent P values that were corrected for familywise error rate with a Bonferroni correction. Values highlighted in red are <0.05. The pathways were sorted by increasing P values, with sorting on the first hour, then the second hour, until reaching the 24th hour.
Most of these genes are up-regulated in OS beginning at hours 4 or 6. The major exceptions are CDKN2D and CCND2. CDKN2D is a repressor of G1/S progression; thus its down-regulation in OS is consistent with literature (28). The cyclin D genes do not show consistent differential expression, but the cyclin E genes, which present an alternative pathway to E2F1 activation, are up-regulated over time. The expression profiles observed in our data are consistent with a previous study by Ohtani et al. (29), which showed that E2F1 overexpression can up-regulate cyclin E but not cyclin D. E2F1-induced cyclin E further activates E2F1, perpetuating G1/S transition, which is reinforced in our data by the similar expression profiles of E2F1 and CCNE2. This is also supported by the dissimilarity between the expression profiles of cyclin D and cyclin E.
E2F1 is a TF activated by CDK-mediated phosphorylation of the retinoblastoma (Rb) protein. It is an essential contributor to the G1/S transition and is responsible for the transcription of various cell-cycle genes, including E2F1 itself (23, 30). E2F1 shows observable up-regulation in OS vs. PS as early as hour 6, achieving statistical significance in hour 24, which supports elevated G1/S transition activity in OS vs. PS. This finding is consistent with a previous finding that the level of phosphorylated Rb protein, which is necessary for the activation of E2F1, decreases in bovine arterial endothelial cells when exposed to laminar shear stress, particularly after 4 h (31).
To further understand the timing of cell-cycle transition in ECs under shear, global pathway analysis through the ConsensusPathDB platform was performed separately for OS vs. ST and PS vs. ST (27, 32). We performed a cluster analysis on the ratio of P values between OS vs. ST and PS vs. ST for all functional pathways. Importantly, starting at hour 6, many pathways specific to cell-cycle progression begin to show differences in enrichment in OS vs. PS (Fig. S2). This finding, combined with the expression profile of E2F1 and the GSEA results shown in Tables S1–S4, suggests that cell-cycle activities in OS and PS begin to differ between hours 4 and 6 after the initial exposure to shear.
Fig. S2.

(A) Clustered heatmap of the log10 ratio of the P values in OS vs. ST and in PS vs. ST. Positive values indicate that PS has a smaller P value than OS; thus the pathway is more significantly enriched in PS. Negative values indicate the opposite. (B) When the heatmap is divided into two clusters (via hierarchical clustering), the smaller cluster shows a distinct difference in enrichment of several cell-cycle pathways starting around hour 6. This is particularly pronounced with many pathways relevant to S phase.
The OS–up-regulated cell-cycle activity is concomitant to the enrichment of other prominent pathways such as ribosomal production and activity. The ribosome Kyoto Encyclopedia of Genes and Genomes (KEGG) pathway is among the most strongly up-regulated pathways, suggesting a global up-regulation of ribosomal proteins (Table S3). The proteasome is also strongly enriched in hours 20 and 24 (Table S3), potentially indicating an increase in protein expression and degradation, which are in concert with the increase of cell-cycle activity and proliferation under OS.
Table S3.
Top enriched pathways through GSEA: The top 10 up-regulated enriched KEGG pathways
 |
The analysis examined log fold changes of genes between OS and PS. Values represent P values that were corrected for familywise error rate with a Bonferroni correction. Values highlighted in red are <0.05. The pathways were sorted by increasing P values, with sorting on the first hour, then the second hour, until reaching the 24th hour.
Oxidative Stress.
ECs under OS are known to undergo greater oxidative stress than those under PS (33–35). Fig. 1B represents a reconstruction of the oxidative stress pathway based on established genes involved in oxidative stress responses (36–40).
The genes that mediate superoxide and hydrogen peroxide production are up-regulated in OS. For example, NOX4 is up-regulated, achieving statistical significance as early as hour 2. SOD1 is not differentially expressed, but mitochondrial SOD2 is distinctly up-regulated in OS from hour 2 to hour 6, peaking at hour 4.
The shear-specific transcriptional response of oxidative stress genes varies in OS vs. PS, both in the identity of genes and the timing of their differential expression. Catalase is statistically significantly down-regulated in OS vs. PS starting at hour 9. Glucose-6-phosphate dehydrogenase (G6PD), a potent antioxidant protein involved in the pentose phosphate pathway, is down-regulated in OS vs. PS in some of the early hours and from hour 12 onward (Table S5). Genes for glutathione peroxidases (GPX1, GPX4, and GPX8) and peroxiredoxins (PRDX2, PRDX4, and PRDX6) were up-regulated in OS vs. PS beginning at hour 20.
Table S5.
Log2 fold change of select DE genes in OS vs. PS across time
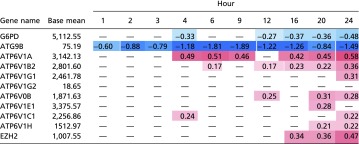 |
Values that achieve statistical significance (raw P < 0.05) are shown. The table displays G6PD, ATG9B, select v-ATPase genes, and EZH2.
NQO1, a gene that produces an antioxidant enzyme (41), is distinctly down-regulated in OS vs. PS starting in hour 9 (Fig. 1C). JUNB, which transcribes NQO1 (42), also has a distinct expression profile, being significantly down-regulated in OS vs. PS starting in hour 4. JUNB is the only member of the AP-1 family of TFs to be continuously down-regulated in OS vs. PS.
The metallothioneins are a family of proteins that are involved in protection from oxidative stress and are also induced by hypoxia (43). Several metallothioneins, particularly MT1X, were strongly up-regulated in OS vs. PS, with MT1X achieving statistical significance in hour 9. The OS vs. PS expression of HIF1A, an hypoxia-inducible factor, is up-regulated with a similar time course and achieves statistical significance at hour 4.
Inflammation.
ECs exposed to OS exhibit proinflammatory phenotypes through the activation of NF-κB and the up-regulation of several proinflammatory cytokines (13, 44). The temporally varying expression profiles of NF-κB targets and canonical proinflammatory genes show a sharp OS vs. PS up-regulation between hours 2 and 6 (Fig. 1D). Peak up-regulation of NF-κB occurs at hour 4, coinciding with the expression peaks for VCAM-1 and E-selectin. MCP-1 (CCL2) and IL8 have clear differences in the magnitude of OS vs. PS differential expression, with both genes exhibiting statistical significance at hours 3, 4, and 6. NF-κB activation has been shown to be influenced by oxidative stress (36, 45). The temporal profile of the OS vs. PS up-regulation of NF-κB target genes is consistent with those of NOX4 and SOD2 beginning in hour 2 (Fig. 1B). SOD2 overexpression is abrogated after hour 6, consistent with the alteration of expression of NF-κB target genes within the same period.
Endothelial–Mesenchymal Transition.
Endothelial-to-mesenchymal transition (Endo-MT) is a contributor to cardiovascular disease and has been observed in atherosclerotic lesions and severe vasculitis (46, 47). We defined an “endothelial marker” gene set and a “mesenchymal marker” gene set from gene lists taken from literature (46). We used these gene sets in GSEA to examine Endo-MT enrichment in OS vs. PS. Fig. S3A shows that endothelial marker genes (e.g., NOS3, VWF, and CD34) are strongly down-regulated as early as hour 6, whereas mesenchymal marker genes (e.g., CDH2, TPM1, and FBLN5) are up-regulated at some time points beginning in hour 12. This suggests that Endo-MT initiation may occur in OS as early as hour 12.
Fig. S3.

Endo-MT and related pathways. (A) Raw P values of custom-made Endo-MT pathways through GSEA. See the main text for the composition of these pathways. (B) TGF-β signaling pathway based on pathways in KEGG and Wikipathways (82).
Oxidative stress, hypoxia, and TGF-β signaling have been shown to drive Endo-MT (46). Genes pertaining to oxidative stress are observed to be up-regulated in OS vs. PS as early as hour 2, while HIF1A is up-regulated as early as hour 4. An investigation of the TGF-β signaling receptors did not reveal a clear direction of regulation in ECs under shear, with a uniform up-regulation of both inhibitors and activators being observed (Fig. S3B).
Putative Endothelial TF Network.
TF-to-gene networks were constructed using the TRANSFAC database and sets of TFs determined to be distinctly down-regulated (Fig. 2A) or up-regulated (Fig. 2B) in OS vs. PS. Higher-resolution versions of these networks can be found in Fig. S4 (see also Fig. S5 and SI Methods). Several highly connected TFs were identified within these networks. Among these highly connected TFs down-regulated in OS vs. PS are KLF4, considered to be one of the fundamental mechanosensitive TF genes (48), and JUNB, described above as a transcriptional regulator of the antioxidant gene NQO1. Among the highly connected TFs up-regulated in OS vs. PS are E2F1, described above as crucial to cell-cycle progression from G1 to S phase, and HIF1A, described above as an important TF in response to oxidative stress. Thus, we are able to identify key regulators of endothelial function as hubs that are involved in important endothelial pathways, while also identifying additional TFs of interest such as CEBPB and EGR1.
Fig. 2.

(A) The largest contiguous portion of the TF-to-target network for TFs that are down-regulated in OS vs. PS. (B) The largest contiguous portion of the TF-to-target network for TFs that are up-regulated in OS vs. PS. Gene targets are shown as unlabeled nodes. TFs were chosen based on cluster analysis of expression data. Gene targets were chosen based on the presence of an entry in TRANSFAC, as well as whether the target was differentially expressed in at least one time point.
Fig. S4.

(A) Higher-resolution version of Fig. 2A with gene target names visible. Largest contiguous portion of TF-to-target network for TFs that are down-regulated in OS vs. PS. (B) Higher-resolution version of Fig. 2B with gene target names visible. Largest contiguous portion of TF-to-target network for TFs that are up-regulated in OS vs. PS. (C) Longest paths in TF-to-gene networks. Pathways were found by observing the longest contiguous TF-to-TF pathways in the networks in A and B. Because RXRA, RARG, and the RXRA:RARG complex all independently appear in the network in A, and all target RARB, it was inferred that an RARG:RXRA complex is a part of this regulatory pathway. RARG:RXRA inhibition of EGR1 was inferred from manual literature curation (50).
Pathway analysis of these networks revealed several TF–TF interactions distinct in OS vs. PS. The results show a KLF2-RARG-RARB regulatory pathway for preferential OS down-regulation and a SRF-EGR1-HIF1A regulatory pathway for preferential OS up-regulation. The expression profiles of KLF2 and RARG indicate that these are strongly down-regulated in OS vs. PS across all time points. The presence of both RXRA and RARG and a RARG:RXRA node targeting RARB suggest that RARG and RXRA form a PS-specific complex for transcriptional regulation through interaction with retinoic acid response elements in the genome (49). Similar to RARG and KLF2, RXRA is significantly down-regulated in OS vs. PS at most time points.
The early up-regulation of EGR1 in the data in hour 1, followed by the up-regulation of HIF1A starting in hour 2 and achieving statistical significance in hour 4, offers evidence to support the regulation of HIF1A by EGR1 in our system. EGR1 has previously been identified as a high-confidence target of retinoic acid receptors (50). The expression profile of EGR1 shows a trend of being inverse to that of RXRA. These suggest that the RARG-RXRA complex may repress EGR1 in PS. A schematic of these pathways and their expression profiles is shown in Fig. S4C.
Functional analysis of these targets reveals that the OS-specific TFs EGR1, HIF1A, and E2F1 regulate genes related to a variety of functions (Table S6). As expected, E2F1 is shown to regulate a variety of cell-cycle genes, while EGR1 and HIF1A regulate several genes pertaining to inflammatory response and cellular adhesion.
Table S6.
Select functional pathways pertaining to relevant endothelial functions under shear and number of their participating genes in the TRANSFAC-derived network displayed in Fig. 2B
| Endothelial function | Pathway name, database | No. of DE gene targets in OS TRANSFAC network | EGR1 targets | HIF1A targets | E2F1 Targets |
| Cell cycle | Cell cycle - Homo sapiens (human), KEGG | 7 | 1 | 0 | 6 |
| G1/S transition, Reactome | 3 | ||||
| G2/M checkpoints, Reactome | 2 | ||||
| M/G1 transition, Reactome | 1 | ||||
| Inflammation | Cytokines and inflammatory response, Wikipathways | 7 | 12 | 5 | 1 |
| Cytokine–cytokine receptor interaction - Homo sapiens (human), KEGG | 23 | ||||
| Inflammatory response pathway, Wikipathways | 4 | ||||
| Cell signaling and stress response | Oxidative stress Wikipathways | 7 | 2 | 1 | 0 |
| Apoptosis, Wikipathways | 9 | 4 | 3 | 2 | |
| Focal adhesion - Homo sapiens (human), KEGG | 20 | 8 | 7 | 2 | |
| VEGF signaling pathway - Homo sapiens (human), KEGG | 3 | 1 | 2 | 0 | |
| Lipid-related processes | SREBP signaling, Wikipathways | 4 | 2 | 2 | 0 |
| ABC transporters in lipid homeostasis, Reactome | 1 | ||||
| Organelle synthesis, cell uptake | Lysosome - Homo sapiens (human), KEGG | 3 | 6 | 5 | 0 |
| Endocytosis - Homo sapiens (human), KEGG | 12 | ||||
| Mitochondrial biogenesis, Wikipathways | 1 | ||||
| Regulation of autophagy - Homo sapiens (human), KEGG | 0 | ||||
| eNOS pathways | eNOS activation and regulation, Reactome | 1 | 3 | 1 | 0 |
| Angiogenesis, Wikipathways | 5 | ||||
| Cell metabolism, transcription, translation | Glycolysis/gluconeogenesis - Homo sapiens (human,- KEGG | 0 | 0 | 1 | 0 |
| Citrate cycle (TCA cycle) - Homo sapiens (human), KEGG | 1 | ||||
| Oxidative phosphorylation - Homo sapiens (human), KEGG | 1 | ||||
| Generic transcription pathway, Reactome | 5 | ||||
| Translation, Reactome | 0 |
These genes were examined for their connection with the most central nodes to the original network, EGR1, HIF1A, and E2F1. The number of differentially expressed targets (OS vs. PS, P < 0.05) of each TF that are also among the listed pathways are listed in the three right-most columns. The numbers in the last three columns are for the whole “Endothelial function” category except for the category “Cell signaling and stress response.”
Discussion
Our study offers a detailed temporal map of EC regulation. Prior studies have examined transcriptional regulation from RNA-seq data of ECs under shear stress, albeit at a single time point postshear (14, 16–18). A 2012 study generated time-series transcriptional profiles of porcine ECs exposed to shear using microarray techniques and provided an initial insight into temporal mechanisms (12). Our study, which uses multiple time-series RNA-seq data collected from human ECs subjected to physiological and pathophysiological flow conditions, examines systematically the functional contexts by which the shear-responsive pathways evolve over time. Our longitudinal analysis shows the dynamics of functional pathways, thus providing insights into the causal relationships between cellular response mechanisms as a function of time.
Secondary Effects of Differential Cell-Cycle Activity.
Several genes in the cell-cycle pathway have functions external to cell-cycle progression. The E2F TFs can modulate many genes relating to apoptosis, posttranslational modifications, and metabolic functions (23, 51, 52). A recent study has implicated E2F1 in autophagy regulation, wherein E2F1 transcriptionally up-regulates v-ATPase, thus promoting the trafficking of lysosomes to the cell periphery, activating mTOR, and inhibiting autophagy (53). This mechanism is consistent with previous findings about mTOR activation under OS (20) and our data on the strong down-regulation of ATG9B in OS vs. PS (Table S5). This is also consistent with the recent finding that laminar shear stress induces autophagy via a SIRT1-dependent mechanism (54). Hence, disturbed flow regulation of E2F1 may have a role in the negative regulation of autophagy. Additionally, repression of autophagy is also associated with Endo-MT (55), which occurs in our study on ECs under OS toward the later hours. The activation of mTOR through E2F1-induced lysosomal trafficking may provide another mechanism by which E2F1 participates in cell-cycle progression in ECs under OS (20). E2F1 up-regulation begins in the midrange hours of our time-series data on OS vs. PS. This association is supported by the finding that several v-ATPase genes are also up-regulated beginning in the midrange hours (Table S5).
The cyclin-dependent kinases have been shown to have roles that are external to the cell cycle. Activated CDK4 has been shown to phosphorylate DNMT1 (56). ECs under disturbed flow have been observed to undergo DNA hypermethylation via DNMT1 (57). The up-regulation of CDK4 in OS vs. PS in the middle hours and onward (Fig. 2A) suggests that DNA hypermethylation may also occur under OS within a similar time frame. It has also been shown that CDK2 can phosphorylate the histone methyltransferase EZH2 (26). EZH2 expression is up-regulated in OS vs. PS in the later hours in our dataset (Table S5). CDK2 has been shown to inhibit FOXO1, a multifunctional TF that is coupled with cellular metabolic and survival pathways (26), and hence we examined the downstream targets of FOXO1 to infer the temporal profile of CDK2 phosphorylation activity in ECs. FOXO1 has been shown to transcribe CDK inhibitors such as CDKN2D and CDKN2B (58). As shown in Fig. 1, we observe that cyclin E, a CDK2 activator, is up-regulated in OS vs. PS through most time points and achieves statistical significance at hour 24. We also observe CDKN2D to be strongly down-regulated in OS vs. PS at most time points. Therefore, we postulate that CDK2 may regulate FOXO1 at the protein level beginning in the early hours. These findings suggest that CDK2 is active and may be activating EZH2. The CDK2-mediated activation of EZH2, along with the CDK4-mediated activation of DNMT1, suggests that DNA hypermethylation in ECs under OS can be explained in part by increased cell-cycle activity under OS. These findings also provide mechanistic links connecting shear stress-regulated cell-cycle activity and epigenetic regulation.
Secondary Effects of Differential Oxidative Stress Activity.
JUNB has been implicated in cell-cycle processes in addition to transcribing antioxidant genes such as NQO1. JUNB, whose protein level is cell-cycle–dependent (59), has been shown to inhibit G1-S phase transition via up-regulation of CDK inhibitors such as CDKN2A, in addition to inhibiting the expression of cyclin D (59). Thus, JUNB expression may have a role in suppressing cell-cycle progression under PS, although these specific effects of JUNB may require additional data to explain. It has been suggested that peroxiredoxin 1 (PRDX1) is a mechanosensitive antioxidant that is up-regulated in laminar shear stress in bovine aortic ECs (60). Although PRDX1 was not significantly regulated in our dataset, PRDX2, PRDX4, and PRDX6 were all up-regulated in OS vs. PS in the later hours. Our observed results with these peroxiredoxin genes are partially corroborated with publicly available HUVEC data in which transcripts measured 72 h after laminar shear stress show a significant down-regulation of PRDX2 and PRDX4 (18). This suggests that the oxidative stress response under OS may involve multiple peroxiredoxin proteins.
TF Network: KLFs as Master Regulators.
KLF4 has been shown to induce CEBPB expression and can bind directly to the CEBPB promoter (61). Time-series ChIP-sequencing (ChIP-seq) studies in mouse liver regeneration systems have shown that mouse Cebpb can bind within 2,000 bp upstream of the mouse JunB transcription start site, with this interaction being strongly observed in hour 3 after a partial hepatectomy (62). In our study, CEBPB down-regulation in OS vs. PS occurs primarily in the early hours, achieving statistical significance in hour 4. This may suggest that CEBPB up-regulation is dependent on the initial imposition of stress on the cell. JUNB is statistically significantly down-regulated in OS vs. PS in hour 4, concurrent with the down-regulation of CEBPB. These findings suggest that a KLF4-CEBPB-JUNB regulatory pathway is activated in the early hours of shear response. Based on our analysis, we postulate that this pathway has functional consequences in cell-cycle suppression and oxidative stress response in the later hours. A previous study has demonstrated that KLF1 can inhibit E2F2 by binding to an intronic enhancer region (63). Hence, we investigated the ability of KLF2 to directly regulate E2F1. HUVEC chromatin state segmentation displayed on the University of California, Santa Cruz (UCSC) genome browser (64–66) predicts an enhancer region within the first intron of E2F1 from the transcription start site. Scanning of this region using available binding motifs for these TFs from TRANSFAC (67) detected KLF4 and KLF2 motifs in both the forward and reverse strands. This raises the possibility that KLF2 and KLF4 regulate and repress E2F1. This repression can be observed at the mid hours in our data set, when E2F1 expression diverges between OS and PS.
Mechanisms Revealed from Distinctly Expressed Genes.
Several genes were found to be PS-distinct (up-regulated in PS vs. ST and down-regulated in both OS vs. ST and OS vs. PS in at least one time point) or OS-distinct (down-regulated in PS vs. ST and up-regulated in both OS vs. ST and OS vs. PS in at least one time point) and are discussed in Fig. S6 and SI Discussion.
Fig. S6.

Proposed mechanosensitive mechanism of regulation of endothelial morphology. DHH, an integral component of the hedgehog signaling pathway, is up-regulated in PS vs. ST while being down-regulated in both OS vs. ST and OS vs. PS. DHH signaling activates the Gli family of TFs. Among the Gli targets is STMN3, a stathmin protein that is involved in microtubule formation and function. The expression profile of STMN3 exhibits strong similarity with the expression profile of DHH, indicating a potential signal transduction from shear to transcriptional regulation.
Combined Gene-TF-Phenotypic Network.
In this study, we present a dynamic view of the response of ECs to differential shear stress. Fig. 3 shows the putative regulatory network derived from this system-wide time-series analysis between OS and PS. Through detailed pathway analysis, we elucidated several key molecular hubs (e.g., TFs) that instigate distinct transcriptomes in ECs subjected to atheroprone OS vs. atheroprotective PS. Our study verifies and extends the previously studied mechanisms and pathways to provide an integrated perspective on the regulation of cellular functions that lead to defined endothelial phenotypes. Further, the transcriptional regulation mechanisms provide insights into causality of mechanisms that lead to stress responses. The kinetic hypotheses derived in this work also serve to define experiments in animal models that can have implications for diseases such as atherosclerosis. The systems biology approach used in this study may well serve as a template for future studies in which the input datasets would be derived via various high-throughput “-omics” techniques. These might provide a window on regulatory events at the epigenetic and posttranslational levels that could have important pathophysiologic implications.
Fig. 3.

Relative differences in gene expression in ECs exposed to OS or PS over time. Pathways and genes in red are up-regulated in OS vs. PS, and those in blue are down-regulated in OS vs. PS. The TGF-β signaling pathway is labeled “mixed” because its genes’ expression directions were mixed. Divergence in cell-cycle activity between OS and PS begins by hour 6 with E2F1 up-regulation in OS. This divergent cell-cycle activity may occur through KLF2- and KLF4-mediated repression of E2F1 expression in PS. E2F1 may up-regulate v-ATPase genes under OS, as observed in the intermediate hours postshear. This promotes lysosomal trafficking to the cell periphery, thus activating mTOR and inhibiting autophagy by hour 20. The activation of mTOR by E2F1 may also contribute to divergence in cell-cycle activity through S6K activation (20). Through CEBPB, KLF4 activates JUNB at hour 4, which may contribute to KLF4-induced inhibition of cell-cycle activity and to antioxidative stress activity in PS. Genes that contribute to ROS production are up-regulated in OS vs. PS by hour 2, and other oxidative stress-related genes exhibit changes up to hour 24. This increased ROS production activates NF-κB and promotes several early-response genes pertaining to inflammation such as MCP-1 and VCAM-1. Inflammation-related genes show changes during hours 2–9. KLF2 transcriptionally activates RARG, which forms a heterodimer with RXRA and may repress EGR1 activity. EGR1, along with ROS production, transcriptionally activates HIF1A, which are all up-regulated in OS vs. PS. HIF1A is observed to be up-regulated beginning in hour 4 and may contribute to angiogenesis and to Endo-MT. Endo-MT may occur in OS beginning in hour 12. Oxidative stress and autophagy repression, both of which occur in OS, also contribute to Endo-MT.
SI Discussion
Mechanisms Revealed from Distinctly Expressed Genes.
Several genes were differentially expressed as PS-distinct (i.e., differentially up-regulated in PS vs. ST and differentially down-regulated in both OS vs. ST and OS vs. PS in at least one time point) or OS-distinct (differentially down-regulated in PS vs. ST and differentially up-regulated in both OS vs. ST and OS vs. PS in at least one time point). One such PS-distinct gene is DHH, which is involved in the hedgehog signaling pathway and activates the GLI family of TFs (73). DHH has previously been shown to be mechanosensitive (74), and our TF-to-gene networks indicate that GLI1 has a role in the PS-specific network together with several DE target genes. Analysis of the expression profiles of these target genes reveals that STMN3, a stathmin protein involved in the function of microtubules, has an expression profile that is strongly down-regulated in OS vs. PS similar to DHH’s expression profile. Therefore we propose that PS can modulate cell morphology directly via the hedgehog signaling pathway through the production of DHH (Fig. S6).
Another PS-distinct gene is C1orf21. A previous proteomics study (75) implicated C1orf21 as interacting with DRAM1, a gene that regulates autophagy via the lysosome (76). Although DRAM1 is not differentially expressed, a future study of C1orf21 and DRAM1 on the protein level could reveal a mechanosensitive mechanism by which endothelial autophagy is modulated via C1orf21 expression. Other PS-distinct genes of potential interest that are not well-studied in shear conditions are GCKR (also known as “GKRP”), an inhibitor of the metabolic protein glucokinase (77), and DUSP4, a phosphatase responsible for activating p38 (78).
Other genes offer a more complex picture of endothelial regulation. CXCR4, which is an OS-distinct gene, is known to be directly inhibited by KLF4 (79) and interacts with the ligand CXCL12. CXCR7, on the other hand, is a PS-distinct gene that shares the same ligand. The CXCR7-CXCR4-CXCL12 axis of regulation is well studied in cancer and is involved in a variety of cellular functions such as proliferation and migration (80, 81). The role of this regulatory axis has not been studied in ECs under shear, despite the distinct expression and mechanosensitivity of these chemokine receptors. A future study that explores the dynamics of these proteins in shear is likely to produce novel insights into mechanisms of atherosclerosis.
Acknowledgments
This work was supported in part by NIH Research Grants R01HL106579 and HL108735 (to S.C., S.S., and J.Y.-J.S.), U01CA198941 (to S.S.), U19AI090023 (to S.S.), and K99/R00HL122368 (to Z.C.) and by National Science Foundation Research Grant CCF0939370 (to S.S.). N.E.A. was supported by NIH Training Grant T32GM8806 (to S.S. as principal investigator).
Footnotes
The authors declare no conflict of interest.
Data deposition: The sequence data reported in this paper have been deposited in the Gene Expression Omnibus (GEO) database, https://www.ncbi.nlm.nih.gov/geo (accession no. GSE103672).
This article contains supporting information online at www.pnas.org/lookup/suppl/doi:10.1073/pnas.1707517114/-/DCSupplemental.
References
- 1.Baeyens N, Bandyopadhyay C, Coon BG, Yun S, Schwartz MA. Endothelial fluid shear stress sensing in vascular health and disease. J Clin Invest. 2016;126:821–828. doi: 10.1172/JCI83083. [DOI] [PMC free article] [PubMed] [Google Scholar]
- 2.Gimbrone MA, Jr, García-Cardeña G. Endothelial cell dysfunction and the pathobiology of atherosclerosis. Circ Res. 2016;118:620–636. doi: 10.1161/CIRCRESAHA.115.306301. [DOI] [PMC free article] [PubMed] [Google Scholar]
- 3.Gimbrone MA, Jr, Garcia-Cardena G. Vascular endothelium, hemodynamics, and the pathobiology of atherosclerosis. Cardiovasc Pathol. 2013;22:9–15. doi: 10.1016/j.carpath.2012.06.006. [DOI] [PMC free article] [PubMed] [Google Scholar]
- 4.Chiu JJ, Chien S. Effects of disturbed flow on vascular endothelium: Pathophysiological basis and clinical perspectives. Physiol Rev. 2011;91:327–387. doi: 10.1152/physrev.00047.2009. [DOI] [PMC free article] [PubMed] [Google Scholar]
- 5.Chistiakov DA, Orekhov AN, Bobryshev YV. Effects of shear stress on endothelial cells: Go with the flow. Acta Physiol (Oxf) 2017;219:382–408. doi: 10.1111/apha.12725. [DOI] [PubMed] [Google Scholar]
- 6.Dai G, et al. Distinct endothelial phenotypes evoked by arterial waveforms derived from atherosclerosis-susceptible and -resistant regions of human vasculature. Proc Natl Acad Sci USA. 2004;101:14871–14876. doi: 10.1073/pnas.0406073101. [DOI] [PMC free article] [PubMed] [Google Scholar]
- 7.Zhou J, Li YS, Chien S. Shear stress-initiated signaling and its regulation of endothelial function. Arterioscler Thromb Vasc Biol. 2014;34:2191–2198. doi: 10.1161/ATVBAHA.114.303422. [DOI] [PMC free article] [PubMed] [Google Scholar]
- 8.Gerhold KA, Schwartz MA. Ion channels in endothelial responses to fluid shear stress. Physiology (Bethesda) 2016;31:359–369. doi: 10.1152/physiol.00007.2016. [DOI] [PMC free article] [PubMed] [Google Scholar]
- 9.Dekker RJ, et al. KLF2 provokes a gene expression pattern that establishes functional quiescent differentiation of the endothelium. Blood. 2006;107:4354–4363. doi: 10.1182/blood-2005-08-3465. [DOI] [PubMed] [Google Scholar]
- 10.Parmar KM, et al. Integration of flow-dependent endothelial phenotypes by Kruppel-like factor 2. J Clin Invest. 2006;116:49–58. doi: 10.1172/JCI24787. [DOI] [PMC free article] [PubMed] [Google Scholar]
- 11.Hecker M, Mülsch A, Bassenge E, Förstermann U, Busse R. Subcellular localization and characterization of nitric oxide synthase(s) in endothelial cells: Physiological implications. Biochem J. 1994;299:247–252. doi: 10.1042/bj2990247. [DOI] [PMC free article] [PubMed] [Google Scholar]
- 12.Zhang J, Friedman MH. Adaptive response of vascular endothelial cells to an acute increase in shear stress magnitude. Am J Physiol Heart Circ Physiol. 2012;302:H983–H991. doi: 10.1152/ajpheart.00168.2011. [DOI] [PMC free article] [PubMed] [Google Scholar]
- 13.Simmons RD, Kumar S, Jo H. The role of endothelial mechanosensitive genes in atherosclerosis and omics approaches. Arch Biochem Biophys. 2016;591:111–131. doi: 10.1016/j.abb.2015.11.005. [DOI] [PMC free article] [PubMed] [Google Scholar]
- 14.Qiao C, et al. Deep transcriptomic profiling reveals the similarity between endothelial cells cultured under static and oscillatory shear stress conditions. Physiol Genomics. 2016;48:660–666. doi: 10.1152/physiolgenomics.00025.2016. [DOI] [PMC free article] [PubMed] [Google Scholar]
- 15.Ohura N, et al. Global analysis of shear stress-responsive genes in vascular endothelial cells. J Atheroscler Thromb. 2003;10:304–313. doi: 10.5551/jat.10.304. [DOI] [PubMed] [Google Scholar]
- 16.Sangwung P, et al. KLF2 and KLF4 control endothelial identity and vascular integrity. JCI insight. 2017;2:e91700. doi: 10.1172/jci.insight.91700. [DOI] [PMC free article] [PubMed] [Google Scholar]
- 17.McCormick ME, et al. Spatial phenotyping of the endocardial endothelium as a function of intracardiac hemodynamic shear stress. J Biomech. 2017;50:11–19. doi: 10.1016/j.jbiomech.2016.11.018. [DOI] [PMC free article] [PubMed] [Google Scholar]
- 18.Maleszewska M, Vanchin B, Harmsen MC, Krenning G. The decrease in histone methyltransferase EZH2 in response to fluid shear stress alters endothelial gene expression and promotes quiescence. Angiogenesis. 2016;19:9–24. doi: 10.1007/s10456-015-9485-2. [DOI] [PMC free article] [PubMed] [Google Scholar]
- 19.Chen Z, et al. Shear stress, SIRT1, and vascular homeostasis. Proc Natl Acad Sci USA. 2010;107:10268–10273. doi: 10.1073/pnas.1003833107. [DOI] [PMC free article] [PubMed] [Google Scholar]
- 20.Guo D, Chien S, Shyy JY. Regulation of endothelial cell cycle by laminar versus oscillatory flow: Distinct modes of interactions of AMP-activated protein kinase and Akt pathways. Circ Res. 2007;100:564–571. doi: 10.1161/01.RES.0000259561.23876.c5. [DOI] [PubMed] [Google Scholar]
- 21.Garcia-Cardeña G, Comander J, Anderson KR, Blackman BR, Gimbrone MA., Jr Biomechanical activation of vascular endothelium as a determinant of its functional phenotype. Proc Natl Acad Sci USA. 2001;98:4478–4485. doi: 10.1073/pnas.071052598. [DOI] [PMC free article] [PubMed] [Google Scholar]
- 22.Sur S, Agrawal DK. Phosphatases and kinases regulating CDC25 activity in the cell cycle: Clinical implications of CDC25 overexpression and potential treatment strategies. Mol Cell Biochem. 2016;416:33–46. doi: 10.1007/s11010-016-2693-2. [DOI] [PMC free article] [PubMed] [Google Scholar]
- 23.Ertosun MG, Hapil FZ, Osman Nidai O. E2F1 transcription factor and its impact on growth factor and cytokine signaling. Cytokine Growth Factor Rev. 2016;31:17–25. doi: 10.1016/j.cytogfr.2016.02.001. [DOI] [PubMed] [Google Scholar]
- 24.Yamaguchi T, et al. Histone deacetylases 1 and 2 act in concert to promote the G1-to-S progression. Genes Dev. 2010;24:455–469. doi: 10.1101/gad.552310. [DOI] [PMC free article] [PubMed] [Google Scholar]
- 25.Lolli G, Johnson LN. CAK-cyclin-dependent activating kinase: A key kinase in cell cycle control and a target for drugs? Cell Cycle. 2005;4:572–577. [PubMed] [Google Scholar]
- 26.Siu KT, Rosner MR, Minella AC. An integrated view of cyclin E function and regulation. Cell Cycle. 2012;11:57–64. doi: 10.4161/cc.11.1.18775. [DOI] [PMC free article] [PubMed] [Google Scholar]
- 27.Kanehisa M, Sato Y, Kawashima M, Furumichi M, Tanabe M. KEGG as a reference resource for gene and protein annotation. Nucleic Acids Res. 2016;44:D457–D462. doi: 10.1093/nar/gkv1070. [DOI] [PMC free article] [PubMed] [Google Scholar]
- 28.Henley SA, Dick FA. The retinoblastoma family of proteins and their regulatory functions in the mammalian cell division cycle. Cell Div. 2012;7:10. doi: 10.1186/1747-1028-7-10. [DOI] [PMC free article] [PubMed] [Google Scholar]
- 29.Ohtani K, DeGregori J, Nevins JR. Regulation of the cyclin E gene by transcription factor E2F1. Proc Natl Acad Sci USA. 1995;92:12146–12150. doi: 10.1073/pnas.92.26.12146. [DOI] [PMC free article] [PubMed] [Google Scholar]
- 30.Calzone L, Gelay A, Zinovyev A, Radvanyi F, Barillot E. A comprehensive modular map of molecular interactions in RB/E2F pathway. Mol Syst Biol. 2008;4:173. doi: 10.1038/msb.2008.7. [DOI] [PMC free article] [PubMed] [Google Scholar]
- 31.Lin K, et al. Molecular mechanism of endothelial growth arrest by laminar shear stress. Proc Natl Acad Sci USA. 2000;97:9385–9389. doi: 10.1073/pnas.170282597. [DOI] [PMC free article] [PubMed] [Google Scholar]
- 32.Kamburov A, et al. ConsensusPathDB: Toward a more complete picture of cell biology. Nucleic Acids Res. 2011;39:D712–D717. doi: 10.1093/nar/gkq1156. [DOI] [PMC free article] [PubMed] [Google Scholar]
- 33.Hsieh HJ, Liu CA, Huang B, Tseng AH, Wang DL. Shear-induced endothelial mechanotransduction: The interplay between reactive oxygen species (ROS) and nitric oxide (NO) and the pathophysiological implications. J Biomed Sci. 2014;21:3. doi: 10.1186/1423-0127-21-3. [DOI] [PMC free article] [PubMed] [Google Scholar]
- 34.Hsiai TK, et al. Hemodynamics influences vascular peroxynitrite formation: Implication for low-density lipoprotein apo-B-100 nitration. Free Radic Biol Med. 2007;42:519–529. doi: 10.1016/j.freeradbiomed.2006.11.017. [DOI] [PMC free article] [PubMed] [Google Scholar]
- 35.De Keulenaer GW, et al. Oscillatory and steady laminar shear stress differentially affect human endothelial redox state: Role of a superoxide-producing NADH oxidase. Circ Res. 1998;82:1094–1101. doi: 10.1161/01.res.82.10.1094. [DOI] [PubMed] [Google Scholar]
- 36.Kim YW, Byzova TV. Oxidative stress in angiogenesis and vascular disease. Blood. 2014;123:625–631. doi: 10.1182/blood-2013-09-512749. [DOI] [PMC free article] [PubMed] [Google Scholar]
- 37.Bhabak KP, Mugesh G. Functional mimics of glutathione peroxidase: Bioinspired synthetic antioxidants. Acc Chem Res. 2010;43:1408–1419. doi: 10.1021/ar100059g. [DOI] [PubMed] [Google Scholar]
- 38.Leopold JA, Zhang YY, Scribner AW, Stanton RC, Loscalzo J. Glucose-6-phosphate dehydrogenase overexpression decreases endothelial cell oxidant stress and increases bioavailable nitric oxide. Arterioscler Thromb Vasc Biol. 2003;23:411–417. doi: 10.1161/01.ATV.0000056744.26901.BA. [DOI] [PubMed] [Google Scholar]
- 39.McDonagh EM, Bautista JM, Youngster I, Altman RB, Klein TE. PharmGKB summary: Methylene blue pathway. Pharmacogenet Genomics. 2013;23:498–508. doi: 10.1097/FPC.0b013e32836498f4. [DOI] [PMC free article] [PubMed] [Google Scholar]
- 40.Reyes I, Hanspers K, Pico A, Rashid K. 2016 Wikipathways: Oxidative Stress (Homo sapiens). Available at www.wikipathways.org/index.php/Pathway:WP408. Accessed December 4, 2016.
- 41.Dinkova-Kostova AT, Talalay P. NAD(P)H:quinone acceptor oxidoreductase 1 (NQO1), a multifunctional antioxidant enzyme and exceptionally versatile cytoprotector. Arch Biochem Biophys. 2010;501:116–123. doi: 10.1016/j.abb.2010.03.019. [DOI] [PMC free article] [PubMed] [Google Scholar]
- 42.Jaiswal AK. Regulation of genes encoding NAD(P)H:quinone oxidoreductases. Free Radic Biol Med. 2000;29:254–262. doi: 10.1016/s0891-5849(00)00306-3. [DOI] [PubMed] [Google Scholar]
- 43.Schulkens IA, et al. Expression, regulation and function of human metallothioneins in endothelial cells. J Vasc Res. 2014;51:231–238. doi: 10.1159/000365550. [DOI] [PubMed] [Google Scholar]
- 44.Szmitko PE, et al. New markers of inflammation and endothelial cell activation: Part I. Circulation. 2003;108:1917–1923. doi: 10.1161/01.CIR.0000089190.95415.9F. [DOI] [PubMed] [Google Scholar]
- 45.Tornatore L, Thotakura AK, Bennett J, Moretti M, Franzoso G. The nuclear factor kappa B signaling pathway: Integrating metabolism with inflammation. Trends Cell Biol. 2012;22:557–566. doi: 10.1016/j.tcb.2012.08.001. [DOI] [PubMed] [Google Scholar]
- 46.Evrard SM, et al. Endothelial to mesenchymal transition is common in atherosclerotic lesions and is associated with plaque instability. Nat Commun. 2016;7:11853. doi: 10.1038/ncomms11853. [DOI] [PMC free article] [PubMed] [Google Scholar]
- 47.He M, et al. miR-483 targeting of CTGF suppresses endothelial-to-mesenchymal transition: Therapeutic implications in Kawasaki disease. Circ Res. 2017;120:354–365. doi: 10.1161/CIRCRESAHA.116.310233. [DOI] [PMC free article] [PubMed] [Google Scholar]
- 48.Hamik A, et al. Kruppel-like factor 4 regulates endothelial inflammation. J Biol Chem. 2007;282:13769–13779. doi: 10.1074/jbc.M700078200. [DOI] [PubMed] [Google Scholar]
- 49.Germain P, et al. International Union of Pharmacology. LX. Retinoic acid receptors. Pharmacol Rev. 2006;58:712–725. doi: 10.1124/pr.58.4.4. [DOI] [PubMed] [Google Scholar]
- 50.Balmer JE, Blomhoff R. Gene expression regulation by retinoic acid. J Lipid Res. 2002;43:1773–1808. doi: 10.1194/jlr.r100015-jlr200. [DOI] [PubMed] [Google Scholar]
- 51.Denechaud PD, et al. E2F1 mediates sustained lipogenesis and contributes to hepatic steatosis. J Clin Invest. 2016;126:137–150. doi: 10.1172/JCI81542. [DOI] [PMC free article] [PubMed] [Google Scholar]
- 52.Muthusamy S, Hong KU, Dassanayaka S, Hamid T, Jones SP. E2F1 transcription factor regulates O-linked N-acetylglucosamine (O-GlcNAc) transferase and O-GlcNAcase expression. J Biol Chem. 2015;290:31013–31024. doi: 10.1074/jbc.M115.677534. [DOI] [PMC free article] [PubMed] [Google Scholar]
- 53.Meo-Evoli N, et al. V-ATPase: A master effector of E2F1-mediated lysosomal trafficking, mTORC1 activation and autophagy. Oncotarget. 2015;6:28057–28070. doi: 10.18632/oncotarget.4812. [DOI] [PMC free article] [PubMed] [Google Scholar]
- 54.Liu J, et al. Shear stress regulates endothelial cell autophagy via redox regulation and Sirt1 expression. Cell Death Dis. 2015;6:e1827. doi: 10.1038/cddis.2015.193. [DOI] [PMC free article] [PubMed] [Google Scholar]
- 55.Singh KK, et al. The essential autophagy gene ATG7 modulates organ fibrosis via regulation of endothelial-to-mesenchymal transition. J Biol Chem. 2015;290:2547–2559. doi: 10.1074/jbc.M114.604603. [DOI] [PMC free article] [PubMed] [Google Scholar]
- 56.Acevedo M, et al. A CDK4/6-dependent epigenetic mechanism protects cancer cells from PML-induced senescence. Cancer Res. 2016;76:3252–3264. doi: 10.1158/0008-5472.CAN-15-2347. [DOI] [PubMed] [Google Scholar]
- 57.Zhou J, Li YS, Wang KC, Chien S. Epigenetic mechanism in regulation of endothelial function by disturbed flow: Induction of DNA hypermethylation by DNMT1. Cell Mol Bioeng. 2014;7:218–224. doi: 10.1007/s12195-014-0325-z. [DOI] [PMC free article] [PubMed] [Google Scholar]
- 58.Katayama K, Nakamura A, Sugimoto Y, Tsuruo T, Fujita N. FOXO transcription factor-dependent p15(INK4b) and p19(INK4d) expression. Oncogene. 2008;27:1677–1686. doi: 10.1038/sj.onc.1210813. [DOI] [PubMed] [Google Scholar]
- 59.Piechaczyk M, Farràs R. Regulation and function of JunB in cell proliferation. Biochem Soc Trans. 2008;36:864–867. doi: 10.1042/BST0360864. [DOI] [PubMed] [Google Scholar]
- 60.Mowbray AL, Kang DH, Rhee SG, Kang SW, Jo H. Laminar shear stress up-regulates peroxiredoxins (PRX) in endothelial cells: PRX 1 as a mechanosensitive antioxidant. J Biol Chem. 2008;283:1622–1627. doi: 10.1074/jbc.M707985200. [DOI] [PubMed] [Google Scholar]
- 61.Birsoy K, Chen Z, Friedman J. Transcriptional regulation of adipogenesis by KLF4. Cell Metab. 2008;7:339–347. doi: 10.1016/j.cmet.2008.02.001. [DOI] [PMC free article] [PubMed] [Google Scholar]
- 62.Jakobsen JS, et al. Temporal mapping of CEBPA and CEBPB binding during liver regeneration reveals dynamic occupancy and specific regulatory codes for homeostatic and cell cycle gene batteries. Genome Res. 2013;23:592–603. doi: 10.1101/gr.146399.112. [DOI] [PMC free article] [PubMed] [Google Scholar]
- 63.Tallack MR, Keys JR, Humbert PO, Perkins AC. EKLF/KLF1 controls cell cycle entry via direct regulation of E2f2. J Biol Chem. 2009;284:20966–20974. doi: 10.1074/jbc.M109.006346. [DOI] [PMC free article] [PubMed] [Google Scholar]
- 64.Rosenbloom KR, et al. ENCODE data in the UCSC genome browser: Year 5 update. Nucleic Acids Res. 2013;41:D56–D63. doi: 10.1093/nar/gks1172. [DOI] [PMC free article] [PubMed] [Google Scholar]
- 65.Ernst J, Kellis M. Discovery and characterization of chromatin states for systematic annotation of the human genome. Nat Biotechnol. 2010;28:817–825. doi: 10.1038/nbt.1662. [DOI] [PMC free article] [PubMed] [Google Scholar]
- 66.Ernst J, et al. Mapping and analysis of chromatin state dynamics in nine human cell types. Nature. 2011;473:43–49. doi: 10.1038/nature09906. [DOI] [PMC free article] [PubMed] [Google Scholar]
- 67.Matys V, et al. TRANSFAC: Transcriptional regulation, from patterns to profiles. Nucleic Acids Res. 2003;31:374–378. doi: 10.1093/nar/gkg108. [DOI] [PMC free article] [PubMed] [Google Scholar]
- 68.Hu J, Ge H, Newman M, Liu K. OSA: A fast and accurate alignment tool for RNA-seq. Bioinformatics. 2012;28:1933–1934. doi: 10.1093/bioinformatics/bts294. [DOI] [PubMed] [Google Scholar]
- 69.Love MI, Huber W, Anders S. Moderated estimation of fold change and dispersion for RNA-seq data with DESeq2. Genome Biol. 2014;15:550. doi: 10.1186/s13059-014-0550-8. [DOI] [PMC free article] [PubMed] [Google Scholar]
- 70.Subramanian A, et al. Gene set enrichment analysis: A knowledge-based approach for interpreting genome-wide expression profiles. Proc Natl Acad Sci USA. 2005;102:15545–15550. doi: 10.1073/pnas.0506580102. [DOI] [PMC free article] [PubMed] [Google Scholar]
- 71.Vaquerizas JM, Kummerfeld SK, Teichmann SA, Luscombe NM. A census of human transcription factors: Function, expression and evolution. Nat Rev Genet. 2009;10:252–263. doi: 10.1038/nrg2538. [DOI] [PubMed] [Google Scholar]
- 72.Smedley D, et al. The BioMart community portal: An innovative alternative to large, centralized data repositories. Nucleic Acids Res. 2015;43:W589–W598. doi: 10.1093/nar/gkv350. [DOI] [PMC free article] [PubMed] [Google Scholar]
- 73.Falkenstein KN, Vokes SA. Transcriptional regulation of graded Hedgehog signaling. Semin Cell Dev Biol. 2014;33:73–80. doi: 10.1016/j.semcdb.2014.05.010. [DOI] [PMC free article] [PubMed] [Google Scholar]
- 74.Ni CW, et al. Discovery of novel mechanosensitive genes in vivo using mouse carotid artery endothelium exposed to disturbed flow. Blood. 2010;116:e66–e73. doi: 10.1182/blood-2010-04-278192. [DOI] [PMC free article] [PubMed] [Google Scholar]
- 75.Rolland T, et al. A proteome-scale map of the human interactome network. Cell. 2014;159:1212–1226. doi: 10.1016/j.cell.2014.10.050. [DOI] [PMC free article] [PubMed] [Google Scholar]
- 76.Zhang XD, Qi L, Wu JC, Qin ZH. DRAM1 regulates autophagy flux through lysosomes. PLoS One. 2013;8:e63245. doi: 10.1371/journal.pone.0063245. [DOI] [PMC free article] [PubMed] [Google Scholar]
- 77.de la Iglesia N, Veiga-da-Cunha M, Van Schaftingen E, Guinovart JJ, Ferrer JC. Glucokinase regulatory protein is essential for the proper subcellular localisation of liver glucokinase. FEBS Lett. 1999;456:332–338. doi: 10.1016/s0014-5793(99)00971-0. [DOI] [PubMed] [Google Scholar]
- 78.Barajas-Espinosa A, Basye A, Angelos MG, Chen CA. Modulation of p38 kinase by DUSP4 is important in regulating cardiovascular function under oxidative stress. Free Radic Biol Med. 2015;89:170–181. doi: 10.1016/j.freeradbiomed.2015.07.013. [DOI] [PMC free article] [PubMed] [Google Scholar]
- 79.Li W, et al. Genome-wide analyses identify KLF4 as an important negative regulator in T-cell acute lymphoblastic leukemia through directly inhibiting T-cell associated genes. Mol Cancer. 2015;14:26. doi: 10.1186/s12943-014-0285-x. [DOI] [PMC free article] [PubMed] [Google Scholar]
- 80.Pozzobon T, Goldoni G, Viola A, Molon B. CXCR4 signaling in health and disease. Immunol Lett. 2016;177:6–15. doi: 10.1016/j.imlet.2016.06.006. [DOI] [PubMed] [Google Scholar]
- 81.Duda DG, et al. CXCL12 (SDF1alpha)-CXCR4/CXCR7 pathway inhibition: An emerging sensitizer for anticancer therapies? Clinical Cancer Res. 2011;17:2074–2080. doi: 10.1158/1078-0432.CCR-10-2636. [DOI] [PMC free article] [PubMed] [Google Scholar]
- 82.Gal N, et al. 2016 TGF-beta Receptor Signaling (Homo sapiens). Available at www.wikipathways.org/index.php/Pathway:WP560. Accessed December 4, 2016.