Abstract
The sense of smell allows chemicals to be perceived as diverse scents. We used single neuron RNA-Sequencing (RNA-Seq) to explore developmental mechanisms that shape this ability as nasal olfactory neurons mature in mice. Most mature neurons expressed only one of the roughly 1000 odorant receptor genes (Olfrs) available, and that at high levels. However, many immature neurons expressed low levels of multiple Olfrs. Coexpressed Olfrs localized to overlapping zones of the nasal epithelium, suggesting regional biases, but not to single genomic loci. A single immature neuron could express Olfrs from up to seven different chromosomes. The mature state in which expression of Olfr genes is restricted to one per neuron emerges over a developmental progression that appears independent of neuronal activity requiring sensory transduction molecules.
Odor detection in mammals is mediated by odorant receptors on olfactory sensory neurons (OSNs) in the nasal olfactory epithelium (1, 2). In mice, approximately 1000 odorant receptor genes (Olfrs) and 350 pseudogenes reside at dozens of distinct loci on 17/21 chromosomes (3–5). Each Olfr is expressed by a small subset of OSNs scattered in one epithelial spatial zone (6–8). Previous studies suggest that each mature OSN expresses one intact Olfr allele, but some coexpress an Olfr pseudogene (9–11). In a prevailing model of “OR (Olfr) gene choice”, the developing OSN selects a single Olfr allele for expression and the encoded receptor provides feedback that prevents expression of other Olfrs (12–17). OSNs are generated from a developmental progression from progenitors to precursors to immature OSNs to mature OSNs (18, 19). Here we investigated when and how the developing OSN selects one Olfr for expression.
We used single cell RNA sequencing (RNA-Seq) (20) to analyze the transcriptomes of single epithelial neurons during development. We first prepared cDNA libraries from single isolated cells (10) and analyzed the libraries for markers of the four stages of OSN development using PCR. We then conducted Illumina sequencing (21) of libraries from multiple cells of each stage, as well as duplicate libraries from some cells. We used TopHat (22) and Cufflinks (23) to identify genes expressed in each cell and estimate their relative mRNA abundances (see Fig. S1 for technical quality metrics).
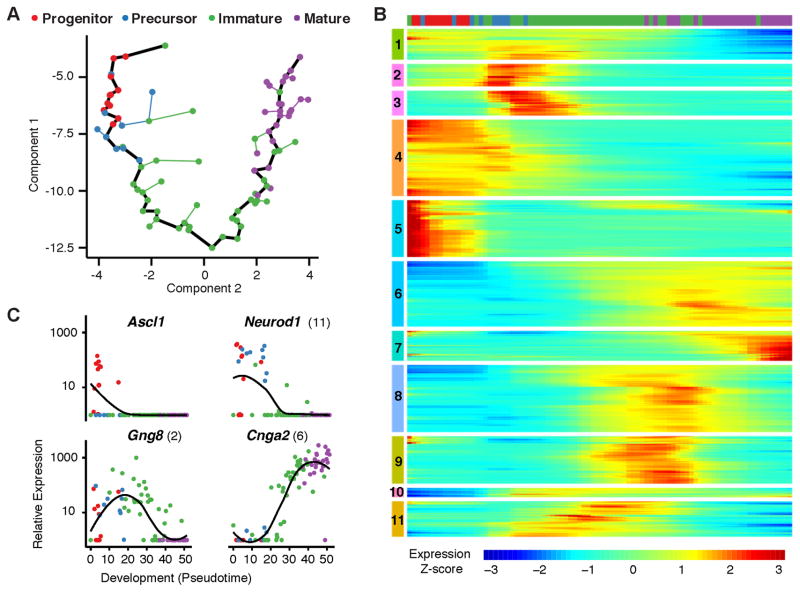
We compared 85 cell transcriptomes using Monocle, an unsupervised algorithm that determines each cell’s stage of differentiation in “pseudotime”, which represents progress through gene expression changes during development (24). Monocle showed a linear, nonbranching trajectory of development (Fig. 1A). Based on cell stage markers in individual transcriptomes, the trajectory reflects the developmental progression from progenitors to precursors to immature OSNs to mature OSNs. The markers used were: Progenitor, Ascl1 (achaete-scute complex homolog 1); Precursor, Neurog1 (neurogenin 1) and/or Neurod1 (neurogenic differentiation 1); Immature OSN, Gap43 (growth associated protein 43) and/or Gng8 (guanine nucleotide binding protein gamma 8); Mature OSN, Omp (olfactory marker protein) and four olfactory sensory transduction molecules downstream of odorant receptors: Gnal (guanine nucleotide binding protein, alpha stimulating, olfactory type), Adcy3 (adenylate cyclase 3), Cnga2 (cyclic nucleotide gated channel alpha 2), and Cnga4 (cyclic nucleotide gated channel alpha 4) (18, 19).
Figure 1. Olfactory neurons exhibit large-scale shifts in gene expression during development.
A. Unsupervised analysis of single cell gene expression profiles with Monocle revealed a linear trajectory (black line) along which cells develop in a dimension referred to as “pseudotime”. Coloring of cells based on the expression of developmental markers shows that the trajectory corresponds to a stepwise development from olfactory progenitors to precursors to immature OSNs to mature OSNs.
B. Global analysis of gene expression kinetics along the trajectory identified 3,830 genes that vary significantly over pseudotime development (FDR < 5% by a Tobit-valued generalized linear model likelihood ratio test; see Methods). Hierarchical clustering of these genes via Ward’s method recovered 11 non-redundant groups that covary over the trajectory. Cluster analysis indicates that multiple large shifts in gene expression occur as neurons progress through development. The bar on top shows the locations of individual cells, colored by stage of development, along this developmental trajectory.
C. Kinetic diagrams show the expression of known markers of different developmental stages over the developmental progression. Parentheses indicate the groups in which genes are found in part B. Dots indicate individual cells colored according to developmental stage. Black lines indicate loess smoothing (span = 0.75, degree = 2) of log-transformed FPKM values over developmental pseudotime.
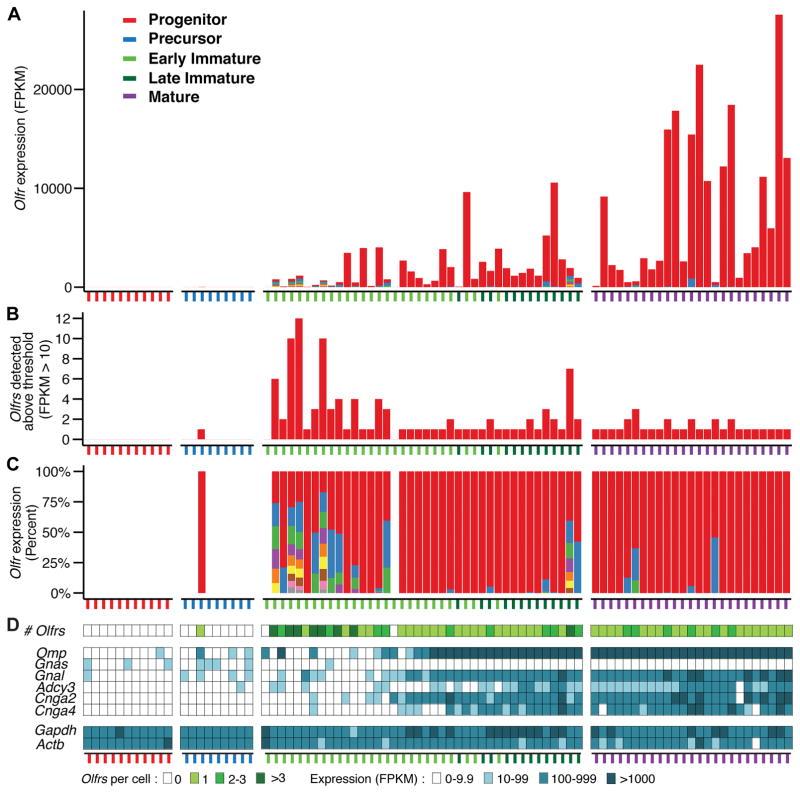
Immature OSNs were further divided into two subsets based on their expression of olfactory sensory transduction molecules. Early immature OSNs lacked one or more olfactory transduction molecules while late immature OSNs expressed all four (Fig. 2D).
Figure 2. Immature neurons can express multiple Olfrs.
A. Neurons assigned to different developmental stages were arranged by developmental progress, as measured in pseudotime. Early versus late immature OSNs are indicated by differently colored ticks. Different Olfrs are represented by different colors in the bars. The total number of Olfr transcripts per cell shows a steady, though variable, increase over development.
B. Multiple different Olfr transcripts were detected in 13/25 early immature, 5/13 late immature, and 6/25 mature OSNs.
C. The number of different Olfr transcripts per cell was highest in early immature OSNs and then declined over development. Early immature OSNs tended to express similar levels of different Olfrs. In contrast, the majority of mature OSNs expressed only one Olfr or high levels of one Olfr and low levels of one or two additional Olfrs. Each color in a bar represents a single Olfr, except gray, which represents >1 Olfr.
D. Olfrs stimulate neuronal activity via mechanisms involving sensory transduction molecules encoded by Gnal (or possible Gnas in immature OSNs), Adcy3, Cnga2, and Cnga4. Five immature and six mature neurons with >1 Olfr expressed all four genes, suggesting that neuronal activity downstream of odorant receptors is not what reduces the number of Olfrs expressed per neuron. Omp, which is highly expressed in mature OSNs, was absent from six early immature OSNs with >1 Olfr, arguing against contamination from mature OSNs. Gapdh and Actb are housekeeping genes.
A total of 3830 genes were differentially expressed over development. Clusters of genes changed in expression during specific developmental periods, suggesting sequential large and coordinated changes in gene expression during OSN development (Fig. 1B and table S1). By gene ontology, most clusters contained genes associated with transcriptional regulation and/or chromatin modification, suggesting potential regulators of development (table S1). In kinetic diagrams, markers of early and late developmental stages show peak expression early and late in the developmental progression, respectively (Fig. 1C and S2).
Olfr expression first appeared at the late precursor to early immature OSN stage (Fig. 2). Olfr transcripts were found in 1/9 precursors, 38/40 immature OSNs, and 25/25 mature OSNs (Fig. 2). None were seen in two non-neuronal epithelial supporting cells or 3 cells of undetermined type. Overall, the number of Olfr transcripts per cell increased over OSN development (Fig. 2A). In early immature, late immature, and mature OSNs, they were detected at an average of 735, 1329, and 6376 FPKM (fragments per kilobase of transcript per million mapped reads), respectively, with median values of 87, 517, and 2635 FPKM.
These studies indicate that the developing OSN can initially express multiple Olfrs. Roughly half (52%, 13/25) of early immature OSNs expressed >1 Olfr. Coexpression of different Olfrs in single neurons declined as development progressed, with 38.5% (5/13) of late immature and 24% (6/25) mature OSNs expressing >1 Olfr. Moreover, single early immature OSNs expressed up to 12 different Olfrs, whereas mature OSNs with >1 Olfr expressed two or at most three (Fig. 2B).
Early immature and mature OSNs with >1 Olfr also differed in the relative abundance of different Olfr transcripts. Most (11/13) of the early immature OSNs had similar low levels of different Olfrs. The most abundant Olfrs were detected at 55–396 FPKM and the next highest at, on average, 63.1% this level (median: 67.3%). However, in 3/6 mature OSNs with >1 Olfr, the most abundant was detected at 14,557–18,056 FPKM, with the next highest, on average, only 3.3% as abundant (median: 0.5%).
In mature OSNs, Olfr and Omp transcripts averaged 6376 and 10,167 FPKM per cell, respectively. However, 6/12 early immature OSNs that expressed >1 Olfr did not express Omp (Fig. 2D), arguing against the possibility that the Olfr transcripts detected were due to contamination from mature OSNs.
Data from 8 duplicate cell samples (technical replicates) were analyzed (Fig. S3–S4). The duplicates confirmed the expression of >1 Olfr in specific OSNs (table S2). The data were consistent with reported stochastic losses of low copy number transcripts in single cell RNA-Seq data. Olfrs present in both replicates tended to be expressed at higher levels and those present in only one replicate at lower levels.
The above results indicated that early immature OSNs can express low levels of multiple Olfrs, but, during subsequent development, two changes typically occur. Expression favors one Olfr by up to 100-fold or more, and the expression of additional Olfrs declines or disappears.
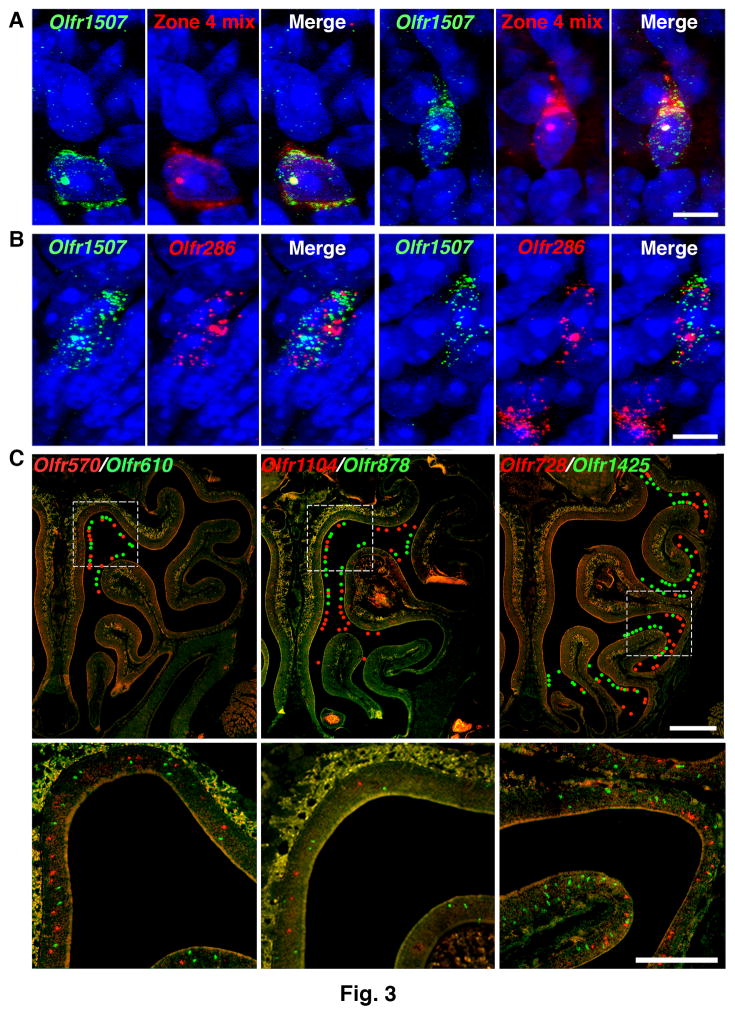
To validate these findings, we used dual fluorescence RNA in situ hybridization (RNA-FISH) with nasal tissue sections. At postnatal day 3 (P3), a peak time of OSN neurogenesis (19, 25), 0.22 ± 0.05 to 0.22 ± 0.12% of neurons labeled for a single Olfr were colabeled with a mix of probes for other Olfrs expressed in the same nasal zone (Fig. 3A and table S3). No colabeled cells were seen in adults, where neurogenesis has decreased. Using a highly sensitive RNA-FISH method with branched DNA signal amplification (26), 0.41 ± 0.10 to 0.60 ± 0.13% of cells labeled for one Olfr were colabeled for another Olfr at P3 and 0.11 ± 0.02 to 0.18 ± 0.05% at P21 (Fig. 3B and table S4). Among neurons labeled for one Olfr, the percentage colabeled for the immature OSN markers Gap43 and Gng8 also changed, respectively, from 80.0 ± 3.1% and 62.8 ± 0.9 % at P3 to 19.5 ± 0.5% and 14.3 ± 1.1% at P21 (table S5). These results confirm that single OSNs can express more than one Olfr and suggest that Olfr coexpression occurs predominantly, if not exclusively, in immature OSNs.
Figure 3. Olfrs expressed in the same neuron belong to a zonal gene set.
A. Dual RNA-FISH of P3 tissue sections using a conventional method showed a small percentage of OSNs colabeled with an Olfr1507 probe and a mix of probes for other Olfrs expressed in the same zone (Zone 4). Cells were counterstained with DAPI (blue). Two colabeled cells are seen here, one at left and the other at right. Scale bar, 5 μm.
B. Dual RNA-FISH of P3 tissue sections using a highly sensitive method showed a small percentage of OSNs coexpressing Olfr1507 and Olfr286. Two colabeled cells are seen here at left and right and a cell labeled with only one probe is also seen at right. Scale bar, 5 μm.
C. Dual RNA-FISH shows that Olfrs coexpressed in single immature OSNs (Cells D200, D197, or D243) are singly expressed in neurons in the same or partially overlapping zones in adult olfactory epithelium sections. This correspondence indicates that Olfr expression in the immature OSN is restricted to a zonally-determined set of Olfr genes. Colored dots indicate the locations of labeled neurons in the upper row. Boxed areas in the upper row are shown at higher magnification in the lower row. Scale bar, 500 μm (upper row), 250 μm (lower row).
To examine whether odorant receptor-induced neuronal activity might be involved in the observed developmental shift in Olfr expression, we analyzed transcriptome data for the expression of olfactory sensory transduction molecules: Gnal (or Gnas, which may substitute for Gnal), Adcy3, Cnga2, and Cnga4. All four molecules were expressed in 5/18 immature OSNs and 6/6 mature OSNs with >1 Olfr (Fig. 2D). Furthermore, one or more were absent in data from 12/20 immature and 3/19 mature OSNs with only one Olfr. These results suggest that odorant-receptor induced neuronal activity is neither necessary nor sufficient for the decline in coexpressed Olfrs during development.
We next asked if the developing OSN is restricted to activating Olfrs expressed in a particular nasal zone. Using dual RNA-FISH, we compared the nasal expression patterns of 12 pairs of Olfrs coexpressed in 7 different OSNs. In every case, the paired Olfrs were expressed in either the same spatial zone or partially overlapping zones (Fig. 3C and table S6). These results indicate that the developing neuron is restricted to the expression of a particular Olfr zonal gene set, which can include Olfrs with only partially overlapping expression patterns in the adult.
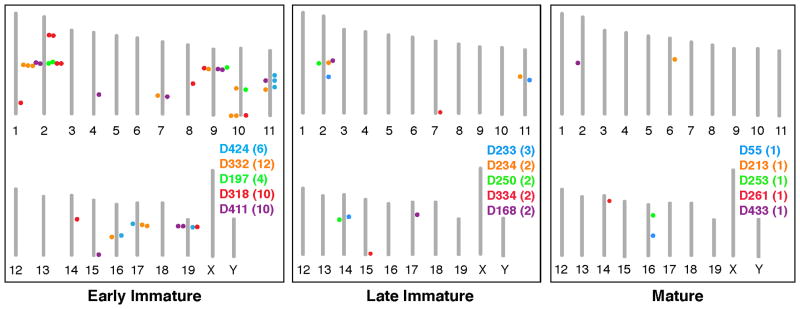
To investigate whether early coexpression of multiple Olfrs could result from chromatin changes at a single genomic locus containing those Olfrs, we determined the chromosome locations of Olfrs coexpressed in individual OSNs (Fig. 4 and table S7). For OSNs expressing 4–12 Olfrs, coexpressed Olfrs mapped to 3–7 different chromosomes and 4–9 distinguishable Olfr gene loci (Fig. 4 and table S7). Thus, the immature OSN is not restricted to expressing Olfrs from a single chromosomal region.
Figure 4. Immature neurons coexpress Olfrs from multiple chromosomal loci.
Diagrams show the chromosomal locations of Olfrs expressed in single OSNs of different stages. Each mouse chromosome is indicated by a vertical bar with its number below. The names of neurons, parenthesized number of Olfrs per neuron, and dots showing the chromosomal locations of those Olfrs are shown in different colors for different neurons.
Odor detection in the mouse nose is mediated by 1000 different odorant receptors, each expressed by a different subset of sensory neurons. We have asked when and how the neuron comes to express a single Olfr. We find that the developing neuron can express low levels of multiple Olfrs. As development proceeds, this ability declines. The mature neuron typically expresses high levels of a single Olfr. Coexpressed Olfrs tend to be expressed by other neurons in the same region of the olfactory epithelium, suggesting regional biases in Olfr gene choice, but they can reside at multiple chromosomal locations.
How does the developing OSN transition from expressing low levels of multiple Olfrs to expressing a high level of a single Olfr? One possibility is a “winner-takes-all” mechanism. In this model, multiple Olfrs are initially expressed, but one becomes dominant, for example by the capture of limiting factors required for high level Olfr expression (Fig. S5). In a second model, selection of a single Olfr for high level expression would occur independently of those initially expressed. In either model, early low level expression of other Olfrs could subside owing to the closing of a developmental time window or to feedback signals generated by the highly expressed Olfr. OSNs expressing multiple Olfrs are probably not pruned by apoptosis, as suggested for OSNs in the nasal septal organ (27), given genetic evidence that some OSNs expressing one Olfr previously expressed another (13). This Olfr “switching” may reflect the early expression of more than one Olfr per immature OSN, as observed in the present studies.
Supplementary Material
Acknowledgments
We thank Jeff Delrow, Andy Marty, and Alyssa Dawson at the Fred Hutchinson Cancer Research Center (FHCRC) Genomics Facility for assistance with RNA-Seq, Matthew Fitzgibbon and Jerry Davidson at the FHCRC Bioinformatics Resource for early assistance with sequence analyses, and Julio Vasquez and the FHCRC Scientific Imaging Facility for help with confocal microscopy. We would also like to thank members of the Buck lab for helpful discussions. This work was supported by the Howard Hughes Medical Institute (HHMI) (L.B.B.), National Institutes of Health Grants R01 DC009324 (L.B.B.) and DP2 HD088158 (C.T), an Alfred P. Sloan Fellowship (C.T), and a Damon Runyon Cancer Research Foundation Dale F. Frey Award for Breakthrough Scientists (C.T.). L.B.B. is on the Board of Directors of International Flavors & Fragrances Inc. Supplement contains additional data.
Footnotes
Author Contributions.
N.K.H., C.T., and L.B.B. designed research. N.K.H. and C.T. performed research, N.K.H., C.T., K.K., Z.L., D.K., X.Y., X.Q., and L.B.B. analyzed data, L.P. provided guidance, and N.K.H, C.T., and L.B.B. wrote the paper.
References
- 1.Buck L, Axel R. Cell. 1991;65:175. doi: 10.1016/0092-8674(91)90418-x. [DOI] [PubMed] [Google Scholar]
- 2.Buck LB, Bargmann C. In: Principles of Neuroscience. Kandel E, Schwartz J, Jessell T, Siegelbaum S, Hudspeth AJ, editors. McGraw-Hill; New York: 2012. pp. 712–742. [Google Scholar]
- 3.Zhang X, Firestein S. Nat Neurosci. 2002;5:124. doi: 10.1038/nn800. [DOI] [PubMed] [Google Scholar]
- 4.Godfrey PA, Malnic B, Buck LB. Proceedings of the National Academy of Sciences of the United States of America. 2004;101:2156. doi: 10.1073/pnas.0308051100. [DOI] [PMC free article] [PubMed] [Google Scholar]
- 5.Niimura Y, Nei M. Gene. 2005;346:13. doi: 10.1016/j.gene.2004.09.025. [DOI] [PubMed] [Google Scholar]
- 6.Ressler KJ, Sullivan SL, Buck LB. Cell. 1993;73:597. doi: 10.1016/0092-8674(93)90145-g. [DOI] [PubMed] [Google Scholar]
- 7.Vassar R, Ngai J, Axel R. Cell. 1993;74:309. doi: 10.1016/0092-8674(93)90422-m. [DOI] [PubMed] [Google Scholar]
- 8.Miyamichi K, Serizawa S, Kimura HM, Sakano H. J Neurosci. 2005;25:3586. doi: 10.1523/JNEUROSCI.0324-05.2005. [DOI] [PMC free article] [PubMed] [Google Scholar]
- 9.Chess A, Simon I, Cedar H, Axel R. Cell. 1994;78:823. doi: 10.1016/s0092-8674(94)90562-2. [DOI] [PubMed] [Google Scholar]
- 10.Malnic B, Hirono J, Sato T, Buck LB. Cell. 1999;96:713. doi: 10.1016/s0092-8674(00)80581-4. [DOI] [PubMed] [Google Scholar]
- 11.Serizawa S, et al. Science. 2003;302:2088. doi: 10.1126/science.1089122. [DOI] [PubMed] [Google Scholar]
- 12.Serizawa S, Miyamichi K, Sakano H. Trends in genetics : TIG. 2004;20:648. doi: 10.1016/j.tig.2004.09.006. [DOI] [PubMed] [Google Scholar]
- 13.Shykind BM, et al. Cell. 2004;117:801. doi: 10.1016/j.cell.2004.05.015. [DOI] [PubMed] [Google Scholar]
- 14.Lewcock JW, Reed RR. Proceedings of the National Academy of Sciences of the United States of America. 2004;101:1069. doi: 10.1073/pnas.0307986100. [DOI] [PMC free article] [PubMed] [Google Scholar]
- 15.Dalton RP, Lyons DB, Lomvardas S. Cell. 2013;155:321. doi: 10.1016/j.cell.2013.09.033. [DOI] [PMC free article] [PubMed] [Google Scholar]
- 16.Nguyen MQ, Zhou Z, Marks CA, Ryba NJ, Belluscio L. Cell. 2007;131:1009. doi: 10.1016/j.cell.2007.10.050. [DOI] [PMC free article] [PubMed] [Google Scholar]
- 17.Dalton RP, Lomvardas S. Annual review of neuroscience. 2015;38:331. doi: 10.1146/annurev-neuro-071714-034145. [DOI] [PMC free article] [PubMed] [Google Scholar]
- 18.Nicolay DJ, Doucette JR, Nazarali AJ. Cellular and molecular neurobiology. 2006;26:803. doi: 10.1007/s10571-006-9058-4. [DOI] [PubMed] [Google Scholar]
- 19.Rodriguez-Gil DJ, et al. Proceedings of the National Academy of Sciences of the United States of America. 2015;112:5821. doi: 10.1073/pnas.1417955112. [DOI] [PMC free article] [PubMed] [Google Scholar]
- 20.Islam S, et al. Genome research. 2011;21:1160. doi: 10.1101/gr.110882.110. [DOI] [PMC free article] [PubMed] [Google Scholar]
- 21.Bentley DR, et al. Nature. 2008;456:53. doi: 10.1038/nature07517. [DOI] [PMC free article] [PubMed] [Google Scholar]
- 22.Kim D, et al. Genome biology. 2013;14:R36. doi: 10.1186/gb-2013-14-4-r36. [DOI] [PMC free article] [PubMed] [Google Scholar]
- 23.Trapnell C, et al. Nature biotechnology. 2010;28:511. doi: 10.1038/nbt.1621. [DOI] [PMC free article] [PubMed] [Google Scholar]
- 24.Trapnell C, et al. Nature biotechnology. 2014;32:381. doi: 10.1038/nbt.2859. [DOI] [PMC free article] [PubMed] [Google Scholar]
- 25.Hinds JW, Hinds PL. The Journal of comparative neurology. 1976;169:15. doi: 10.1002/cne.901690103. [DOI] [PubMed] [Google Scholar]
- 26.Collins ML, et al. Nucleic acids research. 1997;25:2979. doi: 10.1093/nar/25.15.2979. [DOI] [PMC free article] [PubMed] [Google Scholar]
- 27.Tian H, Ma M. Molecular and cellular neurosciences. 2008;38:484. doi: 10.1016/j.mcn.2008.04.006. [DOI] [PMC free article] [PubMed] [Google Scholar]
- 28.Matsunami H, Buck LB. Cell. 1997;90:775. doi: 10.1016/s0092-8674(00)80537-1. [DOI] [PubMed] [Google Scholar]
- 29.Wang L, Wang S, Li W. Bioinformatics. 2012;28:2184. doi: 10.1093/bioinformatics/bts356. [DOI] [PubMed] [Google Scholar]
- 30.Shalek AK, et al. Nature. 2014;510:363. doi: 10.1038/nature13437. [DOI] [PMC free article] [PubMed] [Google Scholar]
- 31.Marinov GK, et al. Genome research. 2014;24:496. doi: 10.1101/gr.161034.113. [DOI] [PMC free article] [PubMed] [Google Scholar]
- 32.Yee TW. R News. 2008;8:28. [Google Scholar]
- 33.Benjamini YHY. Journal of the Royal Statistical Society, Series B (Methodological) 1995;57(1):289. [Google Scholar]
- 34.Ishii T, Omura M, Mombaerts P. Journal of neurocytology. 2004;33:657. doi: 10.1007/s11068-005-3334-y. [DOI] [PubMed] [Google Scholar]
- 35.Liberles SD, Buck LB. Nature. 2006;442:645. doi: 10.1038/nature05066. [DOI] [PubMed] [Google Scholar]
Associated Data
This section collects any data citations, data availability statements, or supplementary materials included in this article.


