

Abstract
RNA constitutes up to 20% of a cell’s dry weight, corresponding to ~20 mg/mL. This high concentration of RNA facilitates low-affinity protein–RNA quinary interactions, which may play an important role in facilitating and regulating biological processes. In the yeast Pichia pastoris, the level of ubiquitin-RNA colocalization increases when cells are grown in the presence of dextrose and methanol instead of methanol as the sole carbon source. Total RNA isolated from cells grown in methanol increases β-galactosidase activity relative to that seen with RNA isolated from cells grown in the presence of dextrose and methanol. Because the total cellular RNA content changes with growth medium, protein–RNA quinary interactions can alter in-cell protein biochemistry and may play an important role in cell adaptation, critical to many physiological and pathological states.
Graphical Abstract
The importance of RNA in biology has extended beyond its key role in the central dogma.1 As a component of ribonucleoprotein (RNP) complexes, RNA has been implicated in diverse processes such as pre-mRNA splicing, RNA methylation, telomerase extension, RNA folding, cargo transport, and a host of others.2–4 Specific high-affinity (sub-micromolar) interactions between protein and RNA in RNPs are critical for proper function and have been studied in great detail.1,2,5 However, the significance of specific low-affinity (micromolar to millimolar) interactions between protein and RNA is not well understood despite the fact that these interactions are omnipresent in the crowded environment of prokaryotic and eukaryotic cells where protein and RNA concentrations can reach 100 and 20 mg/mL, respectively.6–8
We recently demonstrated9 that specific low-affinity protein–RNA interactions, historically called quinary,10,11 can be characterized in-cell by using cross-relaxation-induced polarization transfer (CRIPT) nuclear magnetic resonance (NMR) spectroscopy.12 These interactions have also been detected in highly concentrated cell lysates.13–15 Quinary structures are large transient complexes that affect protein stability16,17 and ligand binding9,18 and can potentially modulate protein function.9,17,19 Because the cellular content of RNA depends on growth conditions,1,20,21 quinary structures have the potential to globally fine-tune diverse biological processes.
Earlier observations of two unrelated proteins, ubiquitin and β-galactosidase, overexpressed from the methanol-induced AOX1 promoter in the yeast P. pastoris, revealed that a change in the carbon source of the growing cells can alter the intracellular distribution of the overexpressed proteins.22 The in-cell NMR spectrum of ubiquitin and the enzymatic activity of β-galactosidase were also dramatically affected.22 Nutrients play a critical role in reorganizing the yeast cytosol. Different carbon sources influence protein expression by enhancing the production of metabolic enzymes necessary for optimal growth. This phenomenon is mediated by changes in the RNA content of the cell. Because both ubiquitin and β-galactosidase have been reported to associate with mRNA23 or ribosomes,24–26 we examined the relation between these changes and the total cellular RNA content of the cells.
EXPERIMENTAL PROCEDURES
Chemicals and Reagents
Restriction enzymes were from NEB. TRIzol RNA extraction reagent was from Ambion, and zymolyase was from MPBiomedicals. All other chemicals used were reagent grade or better.
Preparation of Total Cellular RNA
A glycerol stock of P. pastoris strain X-33 harboring pPic-ScUbq,22 which expresses Saccharomyces cerevisiae ubiquitin under the control of the AOX1 promoter, was plated onto YPD/agar plates supplemented with 300 μg/mL blasticidin. Starting from a single colony, cells were grown overnight at 30 °C in buffered minimal dextrose [BMD; 85 mM potassium phosphate (pH 6.0), 3.4 g/L yeast nitrogen base, 76 mM (NH4)2SO4, 0.5% dextrose, and 0.4 μg/mL biotin]. The cells were centrifuged at 2000g for 10 min at room temperature, washed with 85 mM potassium phosphate (pH 6.0), recentrifuged, and resuspended in 0.5 L of buffered minimal methanol [BMM; 85 mM potassium phosphate (pH 6.0), 3.4 g/L yeast nitrogen base, 76 mM (NH4)2SO4, 1% methanol, and 0.4 μg/mL biotin] or 0.5 L of buffered minimal dextrose methanol [BMDM; 85 mM potassium phosphate (pH 6.0), 3.4 g/L yeast nitrogen base, 76 mM (NH4)2SO4, 0.5% dextrose, 1% methanol, and 0.4 μg/mL biotin] at an OD600 of 0.6 and grown for an additional 24 h at 30 °C. Cell cultures were pelleted and stored as a wet cell pack at −80 °C.
Identical procedures were followed for cells grown in BMM and in BMDM. Cells were resuspended in 25 mL of lysis buffer [50 mM potassium phosphate (pH 7.5) and 10 mM β-ME]; 500 units of zymolyase was added, and the mixture was incubated at 37 °C for 1 h. The cells were lysed by sonication and pelleted at 25000g for 30 min. One molar sodium acetate (pH 5.2) and 10% SDS were added to the clarified supernatant to final concentrations of 0.1 M and 0.1%, respectively. Phenol and chloroform were used to extract the RNA from each sample separately. Briefly, water-saturated phenol was added to an equal volume of lysate. The mixture was incubated at 65 °C for 10 min followed by 10 min on ice. The mixture was centrifuged at 25000g for 10 min. The upper aqueous layer was transferred to a fresh tube. An equal volume of chloroform was added, and the resulting mixture was centrifuged at 25000g. The upper aqueous layer was transferred to a fresh tube, and 3 M sodium acetate (pH 5.2) and 1 mM EDTA were added to final concentrations of 0.3 M and 0.1 mM, respectively; 2.5 volumes of cold 100% ethanol was added, and the mixture was incubated at −80 °C overnight. The samples were centrifuged at 25000g for 25 min at 4 °C, and the pellet was washed four times with 80% ethanol and air-dried. A small portion of each sample was dissolved in DEPC-treated water to check the purity. The OD260/OD280 values of the RNAs extracted from BMM and BMDM were 1.97 and 2.0, respectively.
Agarose Gel Electrophoresis
Agarose gel electrophoresis was performed on total RNA extracted from P. pastoris grown on BMM (RNABMM) and BMDM (RNABMDM) media. The concentration of both RNA preparations was measured by absorbance at 260 nm. The amounts of RNABMM and RNABMDM loaded onto the gel were 364 and 410 ng, respectively. SYBR Gold (Invitrogen) was used to stain the nucleic acids.
Western Blotting
Samples were electrophoresed at 100 V for 1 h on a 16% (ubiquitin) or 10% (β-galactosidase) polyacrylamide gel in Tris-Glycine-SDS buffer using a Mini-PROTEAN 3 (Bio-Rad) apparatus. The gel was washed with Tris-Glycine buffer (Thermo Fisher) containing 20% methanol and transferred to a 0.2 μm nitrocellulose membrane (Bio-Rad) in Tris-Glycine buffer containing 20% methanol using a Mini-PROTEAN 3 (Bio-Rad) apparatus. The membrane was blocked for 2 h at room temperature with 1% bovine serum albumin in Tris-buffered saline containing 0.05% Tween 20 (BSA/TBS-T) and incubated overnight at 4 °C with the primary antibody, HRP-conjugated mouse monoclonal IgG1 [Ub Antibody (P4D1), sc-8017] diluted 1:500 with a BSA/ TBS-T mixture. The membrane was washed with TBS. Western blots were developed by incubating the membrane in Super-Signal West Pico Chemiluminescent Substrate (Thermo Scientific) for 5 min at room temperature, and the resulting chemiluminescence was imaged by using a Chem-iDoc XRS (Bio-Rad) instrument equipped with Quantity One software.
β-Galactosidase Activity Assay
Stock solutions of RNABMM and RNABMDM were prepared at a concentration of 120 mg/mL in reaction buffer [50 mM potassium phosphate (pH 7.5)]. Stock 5-bromo-4-chloro-3-indolyl-β-D-galactopyra-noside (X-Gal) was prepared in DMSO at a concentration of 20 mg/mL. Each 50 μL reaction volume contained 10 μL of the RNA stock solution and 2 μL of X-gal, which was added last. A Synergy H1 plate reader (BioTek) was used to monitor the product of X-gal hydrolysis at 405 nm in parallel for the two reactions.
NMR Spectroscopy
All NMR experiments were performed at room temperature on a 500 MHz Bruker Avance III NMR spectrometer equipped with a TCI cryoprobe. To prepare NMR samples, 30 mg/mL RNABMM or 30 mg/mL RNABMDM was added to 10 μM [U-15N]ubiquitin dissolved in NMR buffer [80 mM potassium phosphate (pH 6.5) in a 10% D2O/90% H2O mixture]. 1H–15N HSQC with Watergate water suppression27 was used to monitor protein chemical shift changes due to RNA binding; 1024 and 128 points in the proton and nitrogen dimensions, respectively, were acquired with 512 transients. The spectra were processed by using Topspin 2.1 (Bruker Inc.).
Immunofluorescence Microscopy
Ubiquitin was over-expressed in the yeast P. pastoris as previously described.22 Slide preparation protocols were adjusted to accommodate the use of SYTO RNASelect Green fluorescent cell stain (Invitrogen). Each well of a 6 mm, 10-well glass slide (HTC supercured green slides, Cell-Line/Erie Scientific, Co.) was treated with 15 μL of 1 mg/mL poly-D-lysine in 0.15 M sodium borate (pH 8.3) and incubated overnight at room temperature in a moist incubation chamber to prevent drying. The slides were rinsed with water and dried thoroughly before use.
Samples (30 mL) of yeast cells were resuspended in 100% methanol at −20 °C and incubated at this temperature for an additional 10 min. The cells were washed with 1 mL of TE buffer [10 mM Tris-HCl (pH 8.0) and 1 mM EDTA], centrifuged, and resuspended in 200 μL of TE containing 0.3% β-ME. After being incubated for 45 min at 28 °C, the cells were centrifuged, resuspended in 1 mL of S buffer [10 mM PIPES (pH 6.5), 1 M sorbitol, and 0.3% β-ME] containing 5 units of zymolyase, and incubated for 60 min at 28 °C. The spheroplasted cells were washed three times with 0.5 mL of S buffer and suspended in 150 μL of the same buffer.
Twenty microliters of spheroplasted cells was spotted into each well and allowed to settle for 10 min. The slides were rinsed with phosphate-buffered saline (PBS) and dried thoroughly. Each well was incubated with 20 μL of 0.01% Triton X for 6 min, rinsed with PBS, and incubated with 20 μL of blocking solution (0.1% BSA in PBS; BSA/PBS) at room temperature for 2 h followed by another PBS rinse. Immobilized spheroplasts were incubated overnight at 4 °C with rabbit polyclonal anti-ubiquitin antibody (Millipore) diluted 1:500 with 0.1% BSA/PBS. Slides were washed with PBS and incubated at room temperature for 2 h with goat anti-rabbit antibody conjugated to Alexa Fluor 633 (Molecular Probes), in 0.1% BSA/PBS. The slides were rinsed with PBS, and spheroplasts were incubated with 20 μL of 500 nM SYTO RNASelect Green Fluorescent Cell Stain (Molecular Probes), freshly prepared in PBS, per well for 20 min at room temperature. The wells were washed three times with PBS and filled with 5 μL of Fluoromount-G (Southern Biotechnology Associates) mounting medium. The slides were covered with coverslips and sealed.
The finished slides were imaged using a Zeiss LSM 710 laser scanning confocal microscope equipped with a 63× oil-immersion objective. Fluorescence images were obtained with laser excitation at 488 and 633 nm. Colocalization of ubiquitin and RNA in the acquired images was analyzed employing the “Squassh” method (segmentation and quantification of subcellular shapes) described by Rizk et al.28 Colocalization values correspond to the fraction of the total signal (volume × intensity) of objects in one channel (RNA or UB) that overlap with objects from the other channel (UB or RNA). The software determines the dimension of the object for a specified channel and calculates the fractional overlap with the other channels. Because each specified channel may have different dimensions, the percentages are not necessarily identical.
RESULTS
To evaluate the changes in cellular RNA in P. pastoris grown using different carbon sources, total yeast RNA was isolated by using a standard protocol.29 Agarose RNA gels stained with an RNA-specific dye were used to visualize various RNA components (Figure 1d). Samples were digested with DNase I to eliminate possible contamination from genomic DNA. RNA isolated from cells grown in buffered methanol medium, RNABMM, contains a large amount of preprocessed mRNA and preprocessed large ribosomal subunit, whereas these species are largely absent in RNA from cells grown using buffered methanol/dextrose medium, RNABMDM.
Figure 1.

Ubiquitin preferentially colocalizes with RNA in cells grown in the presence of dextrose. Colocalization of ubiquitin (red) and RNA (green) in yeast cells grown using (a) methanol or (b) methanol and dextrose as a carbon source. Segmentation distributions of protein and RNA (insets) were generated by using Squassh.28 (c) Colocalization values correspond to the fraction of the total signal (volume × intensity) of objects in one channel (RNA or UB) that overlap with objects from the other channel (UB or RNA). Values of ubiquitin in RNA segments (UB/RNA) are 0.82 ± 0.01 and 0.60 ± 0.03 (p < 0.01) for yeast grown in BMDM and BMM, respectively. Values of RNA in ubiquitin segments (RNA/UB) are 0.64 ± 0.01 and 0.52 ± 0.02 (p < 0.01) for yeast grown in BMDM and BMM, respectively. Statistical analyses28 were performed on 59 cells under each growth condition. (d) RNA from yeast cells grown with methanol, RNABMM, contains an amount of pre-mRNA and pre-rRNA larger than that of RNA from cells grown with a methanol/dextrose carbon source, RNABMDM. DNA MW indicates molecular weight markers.
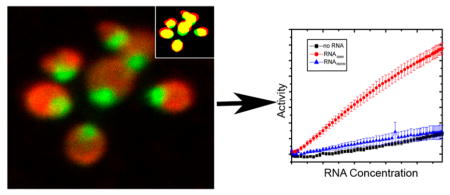
In P. pastoris, the intracellular distribution of ubiquitin depends on the carbon source.22 To examine whether this process is a result of ubiquitin–RNA quinary interactions, immunofluorescence microscopy was used to assess the extent of colocalization between overexpressed ubiquitin and RNA in cells grown using BMM or BMDM. Cells were imaged using an RNA-specific dye and fluorescently tagged anti-ubiquitin antibodies (Figure 1a,b). To minimize the effects of statistical noise and background fluorescence, the segmentation and quantification of subcellular shapes method,28 Squassh, was used instead of pixel-based colocalization analysis. Analysis shows a statistically significant increase in the level of ubiquitin–RNA colocalization in cells grown in the presence of dextrose (Figure 1c).
In-cell NMR studies showed that the 1H–15N HSQC spectrum of ubiquitin is clearly visible in cells grown on methanol but completely broadened in cells grown on methanol and dextrose.22 In vitro NMR spectroscopy was used to determine if interactions between RNABMM and RNABMDM isolated from P. pastoris and ubiquitin are responsible for these observations. RNA constitutes 10–20% of the dry weight of a cell, corresponding to 20–40 mg/mL.30 Adding 30 mg/mL RNABMM to [U-15N]ubiquitin broadened a subset of peaks in the 1H–15N HSQC spectrum (Figure 2a), indicating a specific interaction between ubiquitin and RNA. Adding 30 mg/mL RNABMDM to [U-15N]ubiquitin resulted in the complete disappearance of peaks in the 1H–15N HSQC spectrum (Figure 2b), indicating an increased affinity in ubiquitin–RNA quinary interactions.
Figure 2.

RNA–protein quinary interactions affect protein activity. Overlay of the 1H–15N HSQC spectra of 10 μM [U-15N]ubiquitin in the absence (black) and presence (red) of (a) 30 mg/mL RNABMM and (b) 30 mg/mL RNABMDM. Insets in panel a show broadening of selected residues of free ubiquitin (black) due to interaction with RNABMM (red). Ubiquitin–RNABMM interactions cause extensive peak broadening (a), whereas ubiquitin–RNABMDM interactions lead to complete loss of signal as previously observed in-cell22 (b). (c) Overlay of the 1H–15N HSQC spectra of 50 μM [U-15N]ubiquitin in 10 mM potassium phosphate (pH 6.6) and a 90% H2O/10% D2O mixture without (black) and with (red) 50 mg/mL chondroitin sulfate. As shown in the inset, a chondroitin chain may contain more than 100 individual sugar moieties, denoted by n. There are only minor changes in the chemical shifts of ubiquitin after the addition of chondroitin sulfate; these changes are likely due to a change in the ionic strength of the solution. (d) In the presence of RNABMM, β-galactosidase cleavage of X-Gal is 4–6-fold faster than in the presence of RNABMDM.
To show that broadening of the ubiquitin peaks is due to the unique chemical structure of RNA,13 a linear polyanion, chondroitin sulfate, which mimics the charge distribution of RNA, was used. A chondroitin chain may contain more than 100 individual sugar moieties, comparable to that of a small RNA molecule. Adding 50 mg/mL chondroitin sulfate did not alter the NMR spectrum of ubiquitin (Figure 2c), suggesting that ubiquitin–RNA interactions are mediated by nucleobases. Collectively, the results imply that the redistribution of ubiquitin arising from different growth conditions is due to ubiquitin–RNA interactions, which, in turn, are regulated by the total cellular RNA content.
β-Galactosidase expressed in BMDM is localized into vesicles and exhibits little in-cell activity; when expressed in BMM, the enzyme remains primarily cytosolic and active.22 We speculated22 that the inhibition of β-galactosidase activity when localized to vesicles is due to the inability of the substrate to penetrate into these compartments because the enzyme is active when released from the vesicles. Alternatively, protein–RNA quinary interactions may be responsible for this observation. We employed an in vitro functional assay to investigate the effect of total RNA on the enzymatic activity of β -galactosidase.
In vitro, the level of β-galactosidase activity was 4–6-fold greater in the presence of RNABMM than in the presence of RNABMDM or in control experiments containing no RNA (Figure 2d). The result that RNABMM enhances β-galactosidase activity is in qualitative agreement with in-cell observations. A possible explanation for the enhancement is the presence of preprocessed rRNA and mRNA in RNABMM, which is largely absent in RNABMDM. The inhibition of β-galactosidase activity observed in-cell is likely a combination of the inability of the substrate to penetrate the vesicles and the specific cellular RNA content.
DISCUSSION
Transient, specific low-affinity protein–RNA quinary interactions provide a means of globally regulating cellular processes in living cells. Consistent with in-cell NMR observations,13,31,32 the high concentration of RNA in the cytosol suggests that most proteins participate in these interactions. Ubiquitin and β-galactosidase are examples of such proteins. We showed that in P. pastoris the total cellular RNA content is dramatically altered by growth conditions and that these changes strongly influence the biochemistry of ubiquitin and β-galactosidase. The combination of cellular imaging, in-cell NMR,22 and in vitro biochemical techniques allowed us to characterize this increasingly important mechanism of regulation in detail.
Acknowledgments
Funding
This work was supported by National Institutes of Health Grant 5R01GM085006 to A.S.
ABBREVIATIONS
- AOX1
alcohol oxidase 1 promoter
- β-ME
2-mercaptoethanol
- BMD
buffered minimal dextrose medium
- BMDM
buffered minimal dextrose/methanol medium
- BMM
buffered minimal methanol medium
- BSA
bovine serum albumin
- DEPC
diethyl pyrocarbonate
- EDTA
ethylenediaminetetraacetic acid
- 1H–15N HSQC
heteronuclear single-quantum coherence spectroscopy
- HRP
horseradish peroxidase
- PIPES
piperazine N,N′-bis(2-ethanesulfonic acid)
- PBS
phosphate-buffered saline
- RNABMDM
RNA from cells grown using buffered methanol/dextrose medium
- RNABMM
RNA isolated from cells grown in buffered methanol medium
- SDS
sodium dodecyl sulfate
- TBS
Tris-buffered saline
- TBS-T
Tris-buffered saline containing 0.05% Tween 20
- TE
Tris-EDTA buffer
- Tris
tris(hydroxymethyl)aminomethane
- UB
ubiquitin
- X-gal
5-bromo-4-chloro-3-indolyl-β-D-galactopyranoside
- YPD
yeast extract peptone dextrose medium
Footnotes
Notes
The authors declare no competing financial interest.
References
- 1.Darnell J. RNA:Life’s Indispensible Molecule. 1. Cold Spring Harbor Laboratory Press; Plainview, NY: 2011. [Google Scholar]
- 2.Nagai K, Oubridge C, Ito N, Avis J, Evans P. The RNP domain: a sequence-specific RNA-binding domain involved in processing and transport of RNA. Trends Biochem Sci. 1995;20:235–240. doi: 10.1016/s0968-0004(00)89024-6. [DOI] [PubMed] [Google Scholar]
- 3.Jones S, Daley DT, Luscombe NM, Berman HM, Thornton JM. Protein-RNA interactions: a structural analysis. Nucleic Acids Res. 2001;29:943–954. doi: 10.1093/nar/29.4.943. [DOI] [PMC free article] [PubMed] [Google Scholar]
- 4.Bleichert F, Baserga SJ. Ribonucleoprotein multimers and their functions. Crit Rev Biochem Mol Biol. 2010;45:331–350. doi: 10.3109/10409238.2010.496772. [DOI] [PMC free article] [PubMed] [Google Scholar]
- 5.Burd CG, Dreyfuss G. Conserved structures and diversity of functions of RNA-binding proteins. Science. 1994;265:615–621. doi: 10.1126/science.8036511. [DOI] [PubMed] [Google Scholar]
- 6.Lunde BM, Moore C, Varani G. RNA-binding proteins: modular design for efficient function. Nat Rev Mol Cell Biol. 2007;8:479–490. doi: 10.1038/nrm2178. [DOI] [PMC free article] [PubMed] [Google Scholar]
- 7.Milo R, Jorgensen P, Moran U, Weber G, Springer M. BioNumbers–the database of key numbers in molecular and cell biology. Nucleic Acids Res. 2010;38:D750–753. doi: 10.1093/nar/gkp889. [DOI] [PMC free article] [PubMed] [Google Scholar]
- 8.Kyne C, Crowley PB. Grasping the Nature of the Cell Interior: From Physiological Chemistry to Chemical Biology. FEBS J. 2016 doi: 10.1111/febs.13744. [DOI] [PubMed] [Google Scholar]
- 9.Majumder S, Xue J, DeMott CM, Reverdatto S, Burz DS, Shekhtman A. Probing protein quinary interactions by in-cell nuclear magnetic resonance spectroscopy. Biochemistry. 2015;54:2727–2738. doi: 10.1021/acs.biochem.5b00036. [DOI] [PMC free article] [PubMed] [Google Scholar]
- 10.McConkey EH. Molecular evolution, intracellular organization, and the quinary structure of proteins. Proc Natl Acad Sci U S A. 1982;79:3236–3240. doi: 10.1073/pnas.79.10.3236. [DOI] [PMC free article] [PubMed] [Google Scholar]
- 11.Wirth AJ, Gruebele M. Quinary protein structure and the consequences of crowding in living cells: leaving the test-tube behind. BioEssays. 2013;35:984–993. doi: 10.1002/bies.201300080. [DOI] [PubMed] [Google Scholar]
- 12.Riek R, Wider G, Pervushin K, Wuthrich K. Polarization transfer by cross-correlated relaxation in solution NMR with very large molecules. Proc Natl Acad Sci U S A. 1999;96:4918–4923. doi: 10.1073/pnas.96.9.4918. [DOI] [PMC free article] [PubMed] [Google Scholar]
- 13.Kyne C, Ruhle B, Gautier VW, Crowley PB. Specific ion effects on macromolecular interactions in Escherichia coli extracts. Protein Sci. 2015;24:310. doi: 10.1002/pro.2615. [DOI] [PMC free article] [PubMed] [Google Scholar]
- 14.Ye Y, Liu X, Zhang Z, Wu Q, Jiang B, Jiang L, Zhang X, Liu M, Pielak GJ, Li C. (19) F NMR spectroscopy as a probe of cytoplasmic viscosity and weak protein interactions in living cells. Chem - Eur J. 2013;19:12705–12710. doi: 10.1002/chem.201301657. [DOI] [PubMed] [Google Scholar]
- 15.Barbieri L, Luchinat E, Banci L. Protein interaction patterns in different cellular environments are revealed by in-cell NMR. Sci Rep. 2015;5:14456. doi: 10.1038/srep14456. [DOI] [PMC free article] [PubMed] [Google Scholar]
- 16.Danielsson J, Mu X, Lang L, Wang H, Binolfi A, Theillet FX, Bekei B, Logan DT, Selenko P, Wennerstrom H, Oliveberg M. Thermodynamics of protein destabilization in live cells. Proc Natl Acad Sci U S A. 2015;112:12402–12407. doi: 10.1073/pnas.1511308112. [DOI] [PMC free article] [PubMed] [Google Scholar]
- 17.Monteith WB, Cohen RD, Smith AE, Guzman-Cisneros E, Pielak GJ. Quinary structure modulates protein stability in cells. Proc Natl Acad Sci U S A. 2015;112:1739–1742. doi: 10.1073/pnas.1417415112. [DOI] [PMC free article] [PubMed] [Google Scholar]
- 18.Arnesano F, Banci L, Bertini I, Felli IC, Losacco M, Natile G. Probing the Interaction of Cisplatin with the Human Copper Chaperone Atox1 by Solution and In-Cell NMR Spectroscopy. J Am Chem Soc. 2011;133:18361–18369. doi: 10.1021/ja207346p. [DOI] [PubMed] [Google Scholar]
- 19.Theillet FX, Binolfi A, Bekei B, Martorana A, Rose HM, Stuiver M, Verzini S, Lorenz D, van Rossum M, Goldfarb D, Selenko P. Structural disorder of monomeric alpha-synuclein persists in mammalian cells. Nature. 2016;530:45–50. doi: 10.1038/nature16531. [DOI] [PubMed] [Google Scholar]
- 20.Roeder RG. The role of general initiation factors in transcription by RNA polymerase II. Trends Biochem Sci. 1996;21:327–335. [PubMed] [Google Scholar]
- 21.Pardee AB. Multiple molecular levels of cell cycle regulation. J Cell Biochem. 1994;54:375–378. doi: 10.1002/jcb.240540403. [DOI] [PubMed] [Google Scholar]
- 22.Bertrand K, Reverdatto S, Burz DS, Zitomer R, Shekhtman A. Structure of proteins in eukaryotic compartments. J Am Chem Soc. 2012;134:12798–12806. doi: 10.1021/ja304809s. [DOI] [PMC free article] [PubMed] [Google Scholar]
- 23.Castello A, Fischer B, Eichelbaum K, Horos R, Beckmann BM, Strein C, Davey NE, Humphreys DT, Preiss T, Steinmetz LM, Krijgsveld J, Hentze MW. Insights into RNA biology from an atlas of mammalian mRNA-binding proteins. Cell. 2012;149:1393–1406. doi: 10.1016/j.cell.2012.04.031. [DOI] [PubMed] [Google Scholar]
- 24.Finley D, Bartel B, Varshavsky A. The tails of ubiquitin precursors are ribosomal proteins whose fusion to ubiquitin facilitates ribosome biogenesis. Nature. 1989;338:394–401. doi: 10.1038/338394a0. [DOI] [PubMed] [Google Scholar]
- 25.Bronskill PM, Wong JT. Nature of ribosome-bound beta-galactosidase. J Bacteriol. 1971;105:498–503. doi: 10.1128/jb.105.2.498-503.1971. [DOI] [PMC free article] [PubMed] [Google Scholar]
- 26.Cowie DB, Spiegelman S, Roberts RB, Duerksen JD. Ribosome-bound beta-galactosidase. Proc Natl Acad Sci U S A. 1961;47:114–122. doi: 10.1073/pnas.47.1.114. [DOI] [PMC free article] [PubMed] [Google Scholar]
- 27.Piotto M, Saudek V, Sklenar V. Gradient-tailored excitation for single-quantum NMR spectroscopy of aqueous solutions. J Biomol NMR. 1992;2:661–665. doi: 10.1007/BF02192855. [DOI] [PubMed] [Google Scholar]
- 28.Rizk A, Paul G, Incardona P, Bugarski M, Mansouri M, Niemann A, Ziegler U, Berger P, Sbalzarini IF. Segmentation and quantification of subcellular structures in fluorescence microscopy images using Squassh. Nat Protoc. 2014;9:586–596. doi: 10.1038/nprot.2014.037. [DOI] [PubMed] [Google Scholar]
- 29.Chomczynski P. A reagent for the single-step simultaneous isolation of RNA, DNA and proteins from cell and tissue samples. Biotechniques. 1993;15(532–534):536–537. [PubMed] [Google Scholar]
- 30.Milo R, Philips R. Cell Biology by the Numbers. 1. Garland Science; New York: 2015. [Google Scholar]
- 31.Luh LM, Hansel R, Lohr F, Kirchner DK, Krauskopf K, Pitzius S, Schafer B, Tufar P, Corbeski I, Guntert P, Dotsch V. Molecular crowding drives active pin1 into nonspecific complexes with endogenous proteins prior to substrate recognition. J Am Chem Soc. 2013;135:13796–13803. doi: 10.1021/ja405244v. [DOI] [PubMed] [Google Scholar]
- 32.Li C, Wang GF, Wang Y, Creager-Allen R, Lutz EA, Scronce H, Slade KM, Ruf RA, Mehl RA, Pielak GJ. Protein (19)F NMR in Escherichia coli. J Am Chem Soc. 2010;132:321–327. doi: 10.1021/ja907966n. [DOI] [PMC free article] [PubMed] [Google Scholar]