

ABSTRACT
Purpose
Calorie restriction (CR) improves health span and delays age-related diseases in many species. The multicenter Comprehensive Assessment of Long-term Effects of Reducing Intake of Energy (CALERIE) study was the first randomized controlled trial of CR in nonobese humans. The aim of this investigation was to determine the effects of CR on V˙O2max and muscle strength in the CALERIE trial.
Methods
Healthy, normal-weight, and mildly overweight women and men (n = 218, mean ± SE age = 37.9 ± 0.5 yr) were randomized to 25% CR or an ad libitum (AL) control condition in a 2:1 allocation (143 CR, 75 AL). V˙O2max was determined with an incremental treadmill test; the strength of the knee flexors and extensors was assessed by dynamometry at baseline, 1 yr, and 2 yr.
Results
The CR group achieved an average 11.9% ± 0.7% CR during the 2-yr intervention. Body weight decreased in CR (−7.7 ± 0.4 kg), but not AL (+0.2 ± 0.5 kg). Absolute V˙O2max (L·min−1) decreased at 1 and 2 yr with CR, whereas V˙O2max expressed relative to body mass increased at both time points (1 yr: +2.2 ± 0.4; 2 yr: +1.9 ± 0.5 mL·kg−1·min−1) and relative to AL. The CR group increased their treadmill test time and workload at 1 and 2 yr. Strength results in CR were similar, with decreases in absolute flexor and extensor strength, but increases when expressed relative to body mass. No changes were observed for V˙O2max expressed relative to lean body mass or leg lean mass.
Conclusions
Two years of modest CR without a structured exercise component did not appear to compromise aerobic capacity in healthy nonobese adults. The clinical implications of the observed changes in V˙O2max and muscle strength will be important to explore in future studies.
Key Words: V˙O2max, CR, ENDURANCE, CARDIORESPIRATORY FITNESS
Calorie restriction (CR), characterized by a reduction in energy intake without nutrient deficiency, has been shown to extend health span and life span in a variety of organisms, including nonhuman primates (19). CR is the only known intervention that affects both primary aging (i.e., the inevitable age-related deterioration in tissue structure and function) and secondary aging (i.e., deterioration in tissue structure and function due to adverse lifestyle and environmental factors) (13). A series of observational human studies of adults who have been following a CR diet voluntarily for several years provides intriguing evidence that CR has many health benefits in nonobese humans (7) that are similar to those observed in experimental animal and rodent models. CR is a promising intervention that may enhance cardiovascular health in humans (3).
However, in addition to promoting fat oxidation that causes reductions in adipose tissue with related metabolic health benefits, CR generally induces loss of lean body mass (21,23) because of the catabolism of skeletal muscle and myocardial tissue. There is also some evidence that prolonged CR in humans results in lower physical activity (18), whereas CR in animal models results in preservation of or even increases in physical activity (32). Collectively, these effects of CR on muscle mass and muscle activity in humans may cause adverse changes in cardiorespiratory fitness and muscle strength. On the basis of the well-established association of higher cardiorespiratory fitness and reduced mortality (27), an intervention that adversely affects cardiorespiratory fitness may be cause for concern.
The Comprehensive Assessment of Long-term Effects of Reducing Intake of Energy (CALERIE) study was the first randomized controlled trial of prolonged CR in humans (25). In the CALERIE phase 1 study, we observed that 1 yr of CR in a middle-age (50–60 yr) cohort of nonobese men and women caused reductions in lean body mass, thigh muscle volume, absolute muscle strength, and absolute maximal oxygen uptake (V˙O2max) (30). However, when V˙O2max and muscle strength were expressed relative to whole body mass, lean body mass, or muscle volume, the reductions from baseline were no longer significant. Whether the absolute decrements in aerobic capacity and strength in response to CR are clinically important is unclear. Furthermore, it is unknown whether nonobese younger adults would demonstrate similar decrements in muscle mass, strength, and aerobic capacity during long-term CR.
As part of the CALERIE 2 multicenter study, which explored the effects of 2 yr of CR on various metabolic, physiological, and psychological outcomes in healthy young and middle-age adults (22,25), we sought to determine whether long-term CR adversely affects aerobic capacity and muscle strength in normal weight and mildly overweight individuals.
METHODS
Overview
The CALERIE 2 study was a multicenter, randomized controlled trial of 2 yr of CR versus an ad libitum (AL) control condition. The design and primary outcomes of the study have been described in detail elsewhere (22,25). The focus of the current analysis is on aerobic capacity and strength measures, which were assessed at baseline, 1 yr, and 2 yr.
Subjects
Participants were enrolled at three clinical CALERIE sites: Pennington Biomedical Research Center, Baton Rouge, LA; Tufts University, Boston, MA; and Washington University School of Medicine, St. Louis, MO. Eligibility criteria included body mass index (BMI) of 22.0 to <28.0 kg·m−2, age 21–47 yr for women (to avoid menopause) and 21–50 yr for men, nonsmoking, absence of chronic diseases, low risk for eating disorders, and willingness to be randomized to an intervention or control group for 2 yr. An exclusion criterion was engagement in a regular exercise program of vigorous physical activity for ≥30 min five or more times per week during the past year. After a series of screening assessments and interviews, eligible participants were randomly assigned to the CR intervention or to an AL control group in a 2:1 ratio, with stratification for site, sex, and BMI (i.e., BMI <25.0 vs ≥25.0 kg·m−2). The CR intervention and all study procedures were uniform across the three study sites, and the protocol was approved by the Institutional Review Board at each site. Safety was monitored throughout the trial by a data and safety monitoring board. All participants provided written informed consent.
CR intervention
The CR prescription was set at 25%; the goal was to reduce daily energy intake by 25% relative to daily energy expenditure at baseline and to maintain that intake level for 2 yr. Baseline energy expenditure was determined using the doubly labeled water method during two consecutive 2-wk periods (i.e., 4 wk) of weight stability (22). Thus, the specific calorie prescription was individualized for each participant. The composition of the CR diet was flexible to accommodate individual preferences. During the first 27 d of the 2-yr intervention, participants received three diets (9 d each) of differing macronutrient composition, prepared in the metabolic kitchen at each study site. This strategy promoted early adherence and familiarity with 25% CR using different dietary approaches. Extensive education, counseling, encouragement, and support were provided by registered dietitians, psychologists, and licensed behavior counselors through a structured intervention delivered through a combination of individual and group sessions to facilitate adherence (24). Individual sessions were held weekly (during month 1), twice per month (months 2–12), and monthly (months 13–24); group sessions occurred twice monthly (months 1–6) and monthly (months 7–24). There was no exercise intervention, and no efforts were made to alter participants’ physical activity levels (PAL). However, all CALERIE participants (CR and AL) were informed about the Centers for Disease Control and Prevention’s physical activity guidelines, which at that time recommended at least 30 min of moderate intensity physical activity on at least 5 d·wk−1.
AL control group
Participants in the AL group were instructed to continue their habitual dietary patterns; they did not receive education or counseling from research personnel beyond instructions needed to complete food diaries and physical activity questionnaires. AL group participants completed the same assessments as participants in the CR group.
Whole body mass, lean body mass, and leg lean mass
Whole body mass was measured to the nearest 0.1 kg on a calibrated scale (Scale Tronix 5200, White Plains, NY) in the research centers in the morning in the fasted state, with the participant wearing a preweighed hospital gown. Lean body mass and leg lean mass were assessed by dual-energy x-ray absorptiometry (DXA; Hologic Inc., Bedford, MA) using a standardized protocol to ensure consistent subject positioning and scan mode over time and across the three clinical sites. Analyses of all DXA scans were performed using Hologic software (Apex version 3.3) at the CALERIE DXA reading center (University of California, San Francisco). The average lean mass of the right and left legs was used in the muscle strength analyses.
Physical activity energy expenditure
Energy expended in physical activity was estimated from total daily energy expenditure (TDEE), resting metabolic rate (RMR), and thermic effect of food (TEF) using the following formula: activity energy expenditure (AEE) = TDEE − RMR − TEF. TDEE was assessed during 4 wk at baseline and for 2 wk at the 1- and 2-yr time points using the doubly labeled water method. RMR was assessed by indirect calorimetry with a calibrated Vista-MX metabolic cart (Vacumed, Ventura, CA). TEF was estimated to be 10% of daily energy intake. At baseline, energy intake was assumed to equal TDEE because participants were weight stable; at the 1- and 2-yr time points, energy intake was computed from TDEE and changes in body energy stores based on DXA (20). PAL was computed as TDEE/RMR and used as a relative estimate of physical activity (16) as subjects lost weight.
Dietary protein intake
Daily protein intake was quantified from 6-d food diaries that were analyzed using the University of Minnesota Nutrition Data System for Research dietary analysis program at the CALERIE nutrition reading center (University of Cincinnati). Protein intake was expressed in absolute (g·d−1) and relative (g·kg body mass−1·d−1) quantities.
Aerobic capacity and physiologic responses to maximal treadmill exercise
Maximal oxygen uptake (V˙O2max) was measured using the Cornell incremental treadmill test (28), with the speed and/or grade of the treadmill changing every 2 min (stage 1, 1.7 mph/5% grade; stage 2, 1.7 mph/10%; stage 3, 2.0 mph/10%; stage 4, 2.5 mph/12%; stage 5, 3.0 mph/13%; stage 6, 3.4 mph/14%; stage 7, 3.8 mph/16%; stage 8, 4.2 mph/16%; stage 9, 4.8 mph/17%; stage 10, 5.0 mph/17%; stage 11, 5.0 mph/18%; stage 12, 5.5 mph/18%). Expired gases were collected continuously, and ventilatory variables were calculated at 15-s intervals using a calibrated metabolic cart (TrueOne® 2400 or TrueMax 2400; Parvo Medics, Sandy, UT). The flowmeter was calibrated with a 3-L syringe, and gas calibration was performed with precision-analyzed gas mixtures before and after each test. Participants were instructed not to take medications the morning of the assessment and not to eat or drink beverages other than water for at least 90 min before their treadmill test. Before the baseline test, participants practiced walking on the treadmill without holding onto the handrails. Before each test, participants were familiarized with the testing protocol, the Borg RPE scale (4), and hand signals. HR was monitored continuously throughout the test with 12-lead ECG. Blood pressure (BP) was measured by auscultation at every other workload and at the end of the test. RPE was recorded during the last 30 s of each workload. Research personnel provided verbal encouragement and support to assist participants in reaching a maximal effort.
The two highest consecutive 15-s V˙O2 values during the last 2 min of exercise were averaged to determine V˙O2max if the following three criteria were met: a plateau in V˙O2, defined as an increase of ≤150 mL between the final two workloads (i.e., stages) of the test, RER ≥ 1.10, and HRmax within 10 bpm of age-predicted HRmax. Age-predicted HRmax was computed as 208 − (0.7 × age) (29). Oxygen pulse at maximal exercise was calculated as absolute V˙O2max divided by HRmax. Rate pressure product at maximal exercise was computed as the product of HRmax and maximal systolic BP.
Muscle strength and muscle endurance
Muscle strength and endurance were assessed for knee extensors and knee flexors using Biodex System 3 dynamometers (Biodex Medical Systems, Shirley, NY) at all three sites; a Cybex II Isokinetic Dynamometer (Cybex Division of Lumex, Inc., Ronkonkoma, NY) was used with some participants at the Pennington Biomedical Research Center. The test sequence and procedures were standardized and programmed into the dynamometers. Personnel at all sites followed the same script for explaining the assessments to participants. The V˙O2max and strength tests were performed 1 wk apart at approximately the same time of day at all assessment time points.
The testing series began with a 10-min warm-up on a cycle ergometer (50 W, 70 rpm). The participant was then positioned properly in the dynamometer chair, and the right leg was weighed at 30°. All results were adjusted (by the dynamometer computer) for gravity effect by subtracting the lower leg mass from flexion torque values and adding lower leg mass to extension torque values. Subjects were familiarized with the testing procedures by performing three submaximal repetitions (~75% effort) at each angular velocity. The isokinetic strength tests included five repetitions of concentric knee extension and concentric knee flexion at 60°·s−1, then at 180°·s−1, with a 30-s rest between sets. After a 5-min rest period, muscular endurance was assessed using 30 repetitions of concentric knee extension and flexion at 180°·s−1. Participants were instructed to contract maximally with each repetition rather than to pace themselves. After another 5-min rest period, three 5-s maximal isometric contractions, with a 30-s rest between, were performed at 45° for knee extension and flexion. Within a set, all repetitions were performed continuously, without rest between repetitions. The entire sequence was repeated with the left leg.
Muscular strength was interpreted as peak torque from the isokinetic and isometric tests. Results of the right and left legs were averaged and expressed in absolute terms, relative to whole body mass, and relative to leg lean mass. Muscular endurance was determined from muscle fatigue index, which was computed for both knee extension and knee flexion as the percent decrease in peak torque during the 30-repetition isokinetic sets at 180°·s−1 using the following equation:
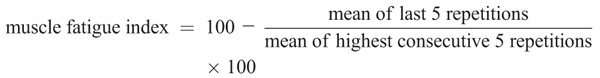
Results from the right and left legs were averaged. A composite muscle fatigue index was computed for knee extension and flexion by averaging those results.
Statistical analyses
Standard intention-to-treat analyses were performed by including all available observations for each time point. Baseline characteristics were compared using the Wilcoxon–Mann–Whitney test for continuous and ordinal variables. Typical for outcomes dependent on maximal exertion, an initial examination of outcome variables revealed numerous outliers. Because of concerns that they could exert undue influence on the results, robust regression procedures (15) were used to evaluate responses to CR. Specifically, M-estimation (14) using the bisquare weight function as implemented in PROC ROBUSTREG in SAS was applied. The advantage is that this method is nearly fully efficient when the data are normally distributed yet provides resistant and stable inference in the presence of outliers. The dependent variable was the change from baseline to 1 yr or 2 yr, with treatment assignment as the between-group factor. Design variables (i.e., site, sex, and BMI stratum) and the baseline value centered about the mean of the outcome were included as covariates. The predicted mean and SE are the adjusted values from this model. Within- and between-group changes from baseline were tested by defining contrasts among the regression parameters. Type I error was controlled at α = 0.05 using the sequentially rejective Bonferroni procedure (12); P values were adjusted using the method of Wright (31). Consistency between the two sexes was evaluated by adding and testing the treatment–sex interaction term. Spearman correlations were used to determine univariate associations. Analyses were performed using SAS Software version 9.2 and higher (SAS Institute, Cary, NC). Data are expressed as means ± SE.
RESULTS
Subjects
As reported in detail previously (22), 218 subjects began the study (143 CR, 75 AL); 69.7% were women. The racial distribution was 77.1% White, 11.9% Black, and 11.0% other; 3.2% were Hispanic. Mean age was 37.9 ± 0.5 yr. Attrition during the 2-yr study resulted in an analysis sample of 201 subjects (130 CR, 71 AL) at 1 yr and 188 subjects (117 CR, 71 AL) at 2 yr. The CR group achieved an average 11.9% ± 0.7% CR during the 2-yr intervention, which was significantly lower than the prescribed 25% CR. No sex differences were observed in the average %CR achieved during year 1 (females, 15.1% ± 0.8%; males, 15.3% ± 1.2%; P = 0.74) or throughout the 2-yr intervention (females, 11.9% ± 0.8%; males, 11.7% ± 1.2%; P = 0.85).
Whole body mass, lean body mass, and leg lean mass
At baseline, 48% of subjects were categorized as normal weight (i.e., BMI, 22.0 to <25.0 kg·m−2) and 52% were overweight (i.e., BMI, 25.0 to <28.0 kg·m−2). As shown in Table 1, whole body mass decreased significantly in the CR group, but not in the AL group, at 1 and 2 yr, with a significant difference between groups at both time points. Likewise, lean body mass and leg lean mass decreased in response to the CR intervention. There was a significant correlation between change in whole body mass and change in lean body mass in the CR group at 2 yr (r = 0.649, P < 0.0001). Comprehensive analyses of body composition changes by treatment and sex are provided by Das et al. (6).
TABLE 1.
Body mass, physical activity, and dietary protein in the CR and AL groups.
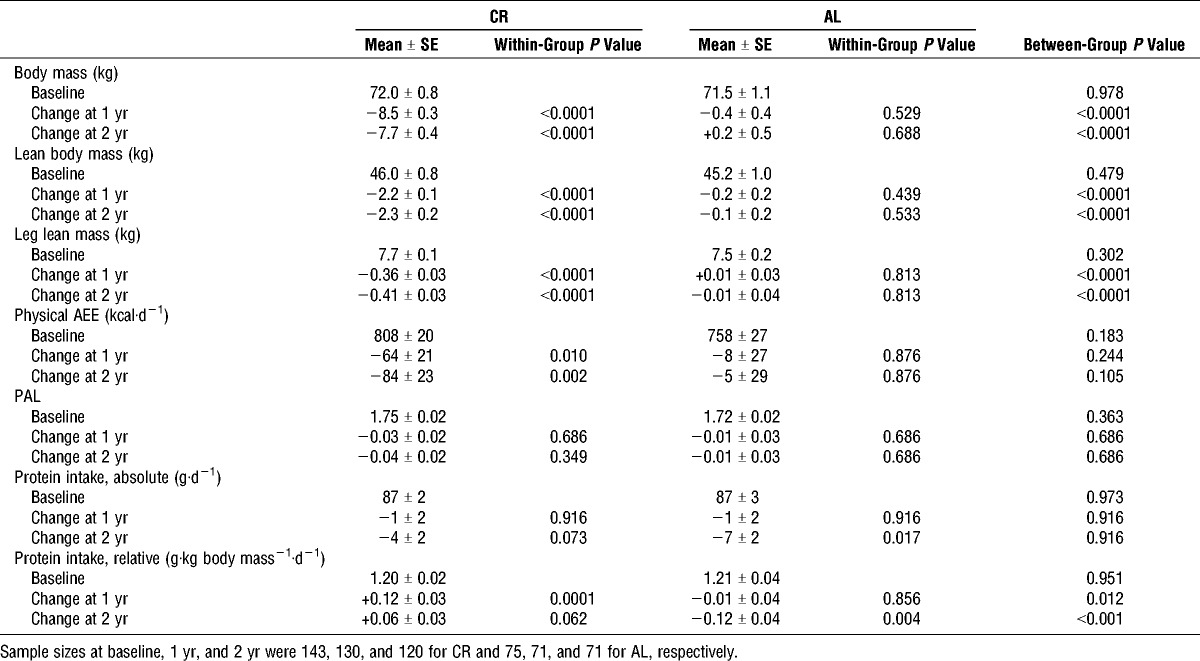
Physical AEE
Absolute AEE (kcal·d−1) decreased significantly in the CR group at 1 and 2 yr (Table 1). In the CR group, this tended to differ by sex (P = 0.055), with decreases observed in females (−129 ± 23 and −142 ± 26 kcal·d−1 at 1 and 2 yr, respectively, both P < 0.0001), but not in males (P = 0.701). When physical activity was expressed in relative terms as PAL, no significant changes were observed in the CR or AL group.
Dietary protein intake
Absolute protein intake (g·d−1) did not differ between groups (Table 1). Relative protein intake exceeded the recommended dietary allowance of 0.8 g·kg body mass−1·d−1 (16) throughout the intervention. The change in lean body mass in the CR group from baseline to 2 yr was not related to absolute protein intake during the intervention (r = −0.062, P = 0.502).
Aerobic capacity and physiologic responses to maximal treadmill exercise
Table 2 presents aerobic capacity results for participants who achieved V˙O2max: n = 195 at baseline (130 CR, 65 AL); n = 158 at 1 yr (101 CR, 57 AL); n = 141 at 2 yr (92 Cr, 49 AL). Treadmill exercise time increased significantly in CR at 1 and 2 yr (baseline 13.0 ± 0.2; 1 yr 14.3 ± 0.3; 2 yr 14.6 ± 0.3 min); the increases were significant relative to AL at both time points (P < 0.001). Absolute V˙O2max (L·min−1), however, decreased significantly in the CR group at 1 and 2 yr; a small nonsignificant decrement was observed in AL at 2 yr. By contrast, V˙O2max expressed relative to body mass increased significantly in CR subjects at both time points relative to baseline and relative to AL. When V˙O2max was expressed relative to lean body mass or lean leg mass, no changes were observed from baseline to 1 yr or 2 yr in the CR or AL group.
TABLE 2.
Aerobic capacity and physiologic responses to maximal treadmill exercise in the CR and AL groups.
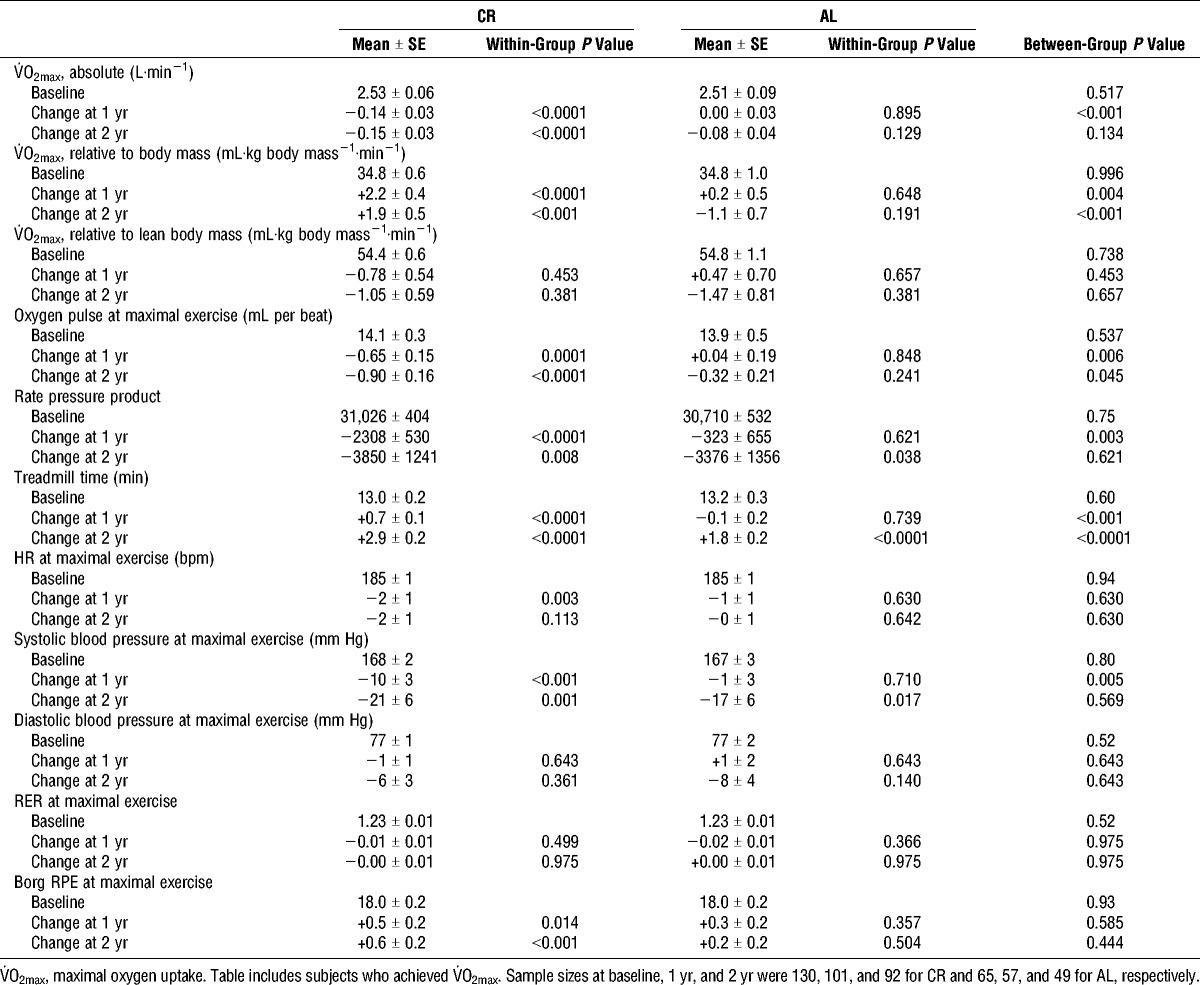
When the analyses were performed using absolute and relative V˙O2peak (i.e., the single highest 15-s V˙O2 value) instead of V˙O2max and included all participants who completed a treadmill test, the overall results and conclusions were not different. Furthermore, changes in absolute and relative V˙O2max in response to 2 yr of CR did not differ between participants who were normal weight or overweight at baseline. Data on oxygen pulse, rate pressure product, HR, BP, RER, and RPE at maximal exercise are presented in Table 2.
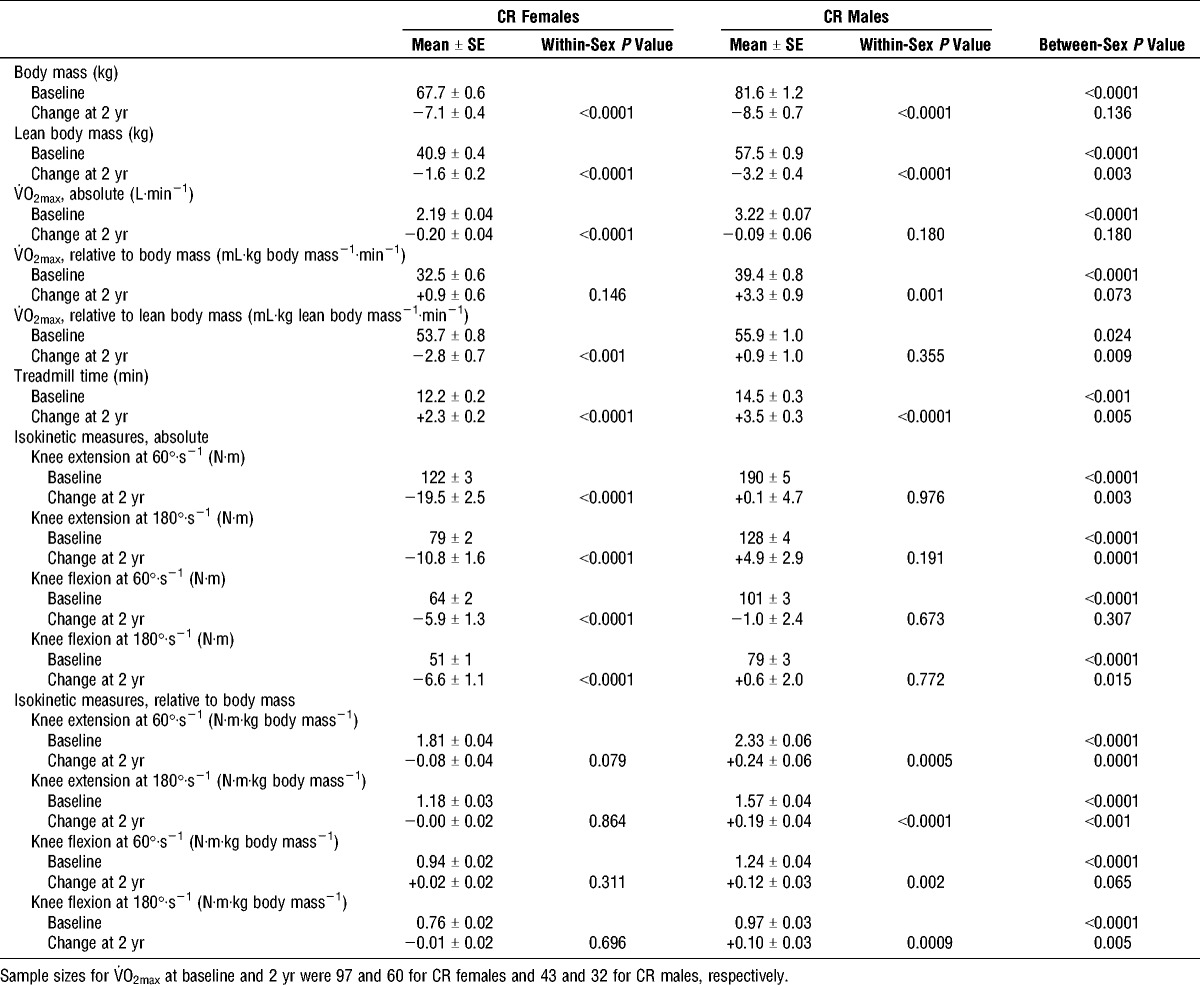
Sex differences in body mass and aerobic capacity in the CR group are shown in Table 3. Men had higher body mass, lean body mass, absolute V˙O2max, and relative V˙O2max values than women at all time points (as expected). Absolute V˙O2max and V˙O2max expressed relative to lean body mass decreased significantly only among females in response to CR. V˙O2max expressed relative to whole body mass tended to increase more among CR males than females. Treadmill test time increased significantly among females and males at both time points; a statistically greater increase was observerd among males after 2 yr of CR. Changes in other exercise test variables in response to CR, such as oxygen pulse at maximal exercise, rate pressure product, HRmax, maximal blood pressure, and peak RER, did not differ by sex (data not shown).
TABLE 3.
Body mass, aerobic capacity, and muscle strength by sex in the CR group.
Figures 1 and 2 show changes in V˙O2max (absolute and relative, respectively) versus changes in body mass at 2 yr for each CR and AL subject, by sex. The change in absolute V˙O2max in the CR group from baseline to 2 yr did not correlate with change in whole body mass (P = 0.569), whereas there was a trend for a weak correlation with change in lean body mass (r = 0.204, P = 0.055).
FIGURE 1.
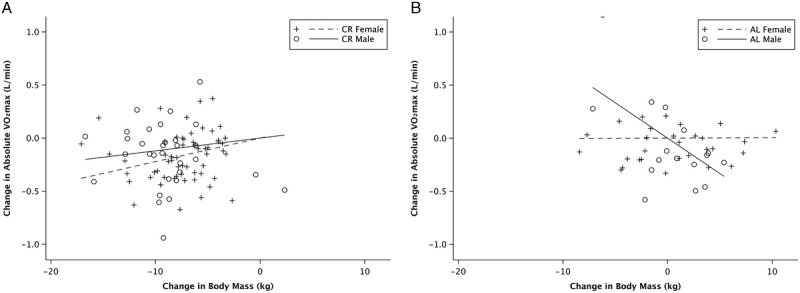
Change in absolute maximal oxygen uptake (V˙O2max, L·min−1) in relation to change in whole body mass from baseline to 2 yr. CR group (A); AL control group (B). Each symbol represents a single subject. Regression lines are shown for females (dashed lines) and males (solid lines). CR females: R2 = 0.3350, P < 0.0001; CR males: R2 = 0.1172, P = 0.040; AL females: R2 = 0.0001, P = 0.957; AL males: R2 = 0.257, P = 0.007.
FIGURE 2.
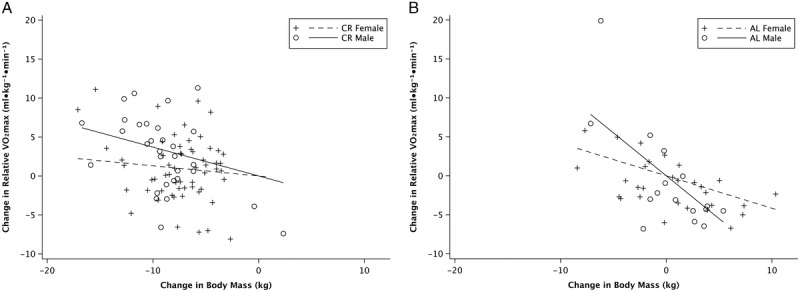
Change in relative maximal oxygen uptake (V˙O2max, mL·kg−1·min−1) in relation to change in whole body mass from baseline to 2 yr. CR group (A); AL control group (B). Each symbol represents a single subject. Regression lines are shown for females (dashed lines) and males (solid lines). CR females: R2 = 0.052, P = 0.049; CR males: R2 = 0.364, P < 0.0001; AL females: R2 = 0.299, P < 0.001; AL males: R2 = 0.374, P < 0.0001.
Muscle strength and muscle endurance
As shown in Table 4, absolute knee extensor and knee flexor strength declined significantly in response to CR; at 2 yr, however, these changes were not statistically different than that in the AL group. When expressed relative to body mass, knee extension and knee flexion torque generally increased in CR compared with AL. No group differences were observed when peak torque was expressed relative to leg lean mass (data not shown). Muscle fatigue index increased comparably in CR and AL at both time points.
TABLE 4.
Muscle strength and muscle endurance in the CR and AL groups.
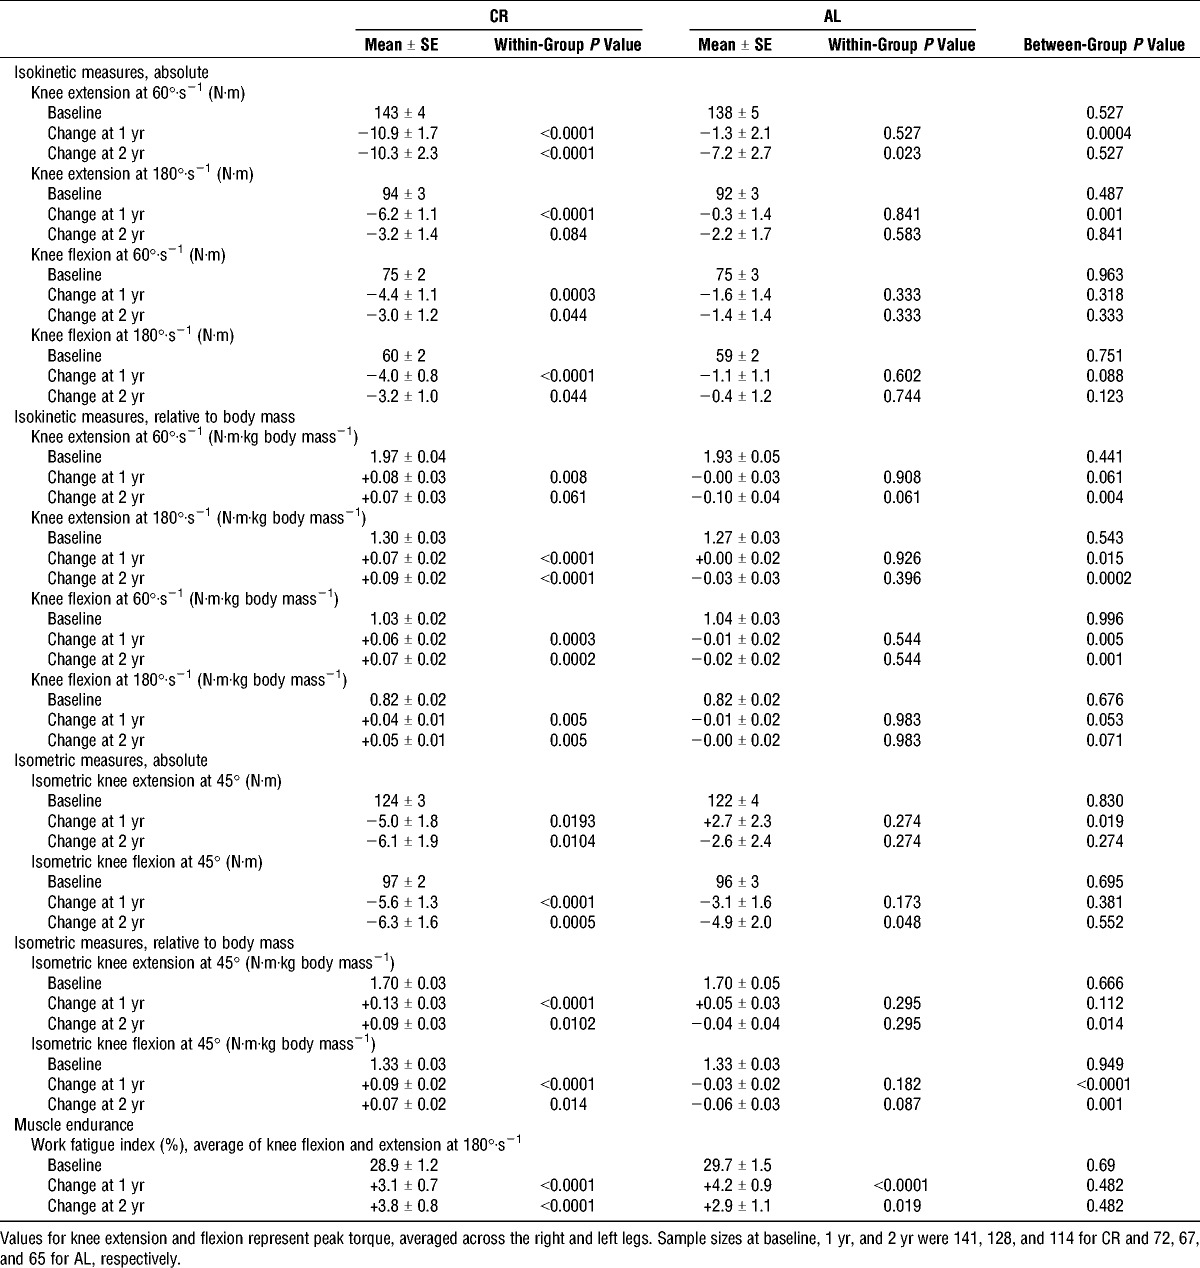
Changes in absolute and relative strength measures in response to 2 yr of CR did not differ between participants who were normal weight or overweight at baseline. Knee extensor and flexor strength measures by sex are shown in Table 3. All strength values were greater for CR males than females, whether expressed in absolute terms or relative to body mass or leg lean mass. Additional sex differences were observed in response to 2 yr of CR. Females had significant decreases in absolute strength and strength expressed relative to leg lean mass, whereas males did not. By contrast, males demonstrated strength increases when expressed relative to body mass. Isometric results were consistent with those of the isokinetic tests (data not shown).
DISCUSSION
This is the first randomized controlled trial to investigate the effects of long-term (i.e., >1 yr) CR on aerobic capacity and muscle strength in nonobese humans. In our population of healthy adults, 2 yr of a modest CR diet resulted in decrements in absolute V˙O2max and strength of the knee extensor and flexor muscles, whereas increases in these parameters were observed when expressed relative to body mass. Importantly, CR participants exercised longer on the treadmill and achieved a higher work rate after 2 yr of ~12% CR. This demonstrates that despite significant reductions in lean body mass, leg strength, and oxygen uptake at maximal exercise, cardiorespiratory fitness was preserved.
V˙O2max is affected primarily by age, sex, and training status in healthy individuals. The reduction in V˙O2max that occurs with normal aging generally averages 10% per decade, as observed in both cross-sectional and longitudinal studies (9), but is highly variable between individuals. The observed decrease in absolute V˙O2max (L·min−1) at 2 yr in our study exceeded the expected age-related decline of approximately 1% per year and was greater in CR than in AL. Vigorous endurance exercise training has been shown to attenuate the age-related decline in V˙O2max (8,26) but was not part of the CR intervention.
Relative V˙O2max (mL·kg body mass−1·min−1), in contrast to absolute V˙O2max, increased in response to CR. Males in our study tended to increase relative V˙O2max to a greater extent than females, which may be explained by the observation that physical AEE was maintained in males, whereas it decreased in females in response to CR. It is noteworthy that CR participants achieved a higher work rate during the graded treadmill test after 2 yr of CR, reaching stage 8 (4.2 mph, 16% grade) at 2 yr, compared with stage 7 (3.8 mph, 16% grade) at baseline. The AL group reached stage 7 at baseline and 2 yr. Therefore, the increase in the CR group does not appear to be a learning effect of repeated testing. Importantly, the American College of Sports Medicine cardiorespiratory fitness categories (1) are based on relative V˙O2max. There is no evidence of which we are aware that a decrease in absolute V˙O2max without a decrease in relative V˙O2max is detrimental or has clinical implications with respect to cardiovascular health or mortality risk. This is an important area of investigation for future CR studies.
The smaller body mass resulting from long-term CR may enable greater economy of movement that likely offsets the lower absolute V˙O2. Long-term CR studies in rhesus monkeys support this view (32). Another intriguing possibility is that skeletal muscle mitochondrial adaptations may occur in response to CR, as reviewed by Hepple (10). Specifically, mitochondrial biogenesis is induced in response to CR in rodents (17) and humans (5); this may be explained by peroxisome proliferator-activated receptor γ coactivator 1α gene expression in skeletal and cardiac muscle with CR, as demonstrated in rodents (11). Peroxisome proliferator-activated receptor γ coactivator 1α is an inducible transcriptional coregulator of mitochondrial function that is activated in response to exercise, cold exposure, and CR (2).
Consistent with the results of our CALERIE phase 1 study (30), absolute muscle strength declined in response to CR in the current study, whereas muscle strength expressed relative to body weight increased. The current multicenter CALERIE 2 results build upon the findings of the earlier, single-center report in which CR was compared with an exercise-induced energy deficit (30). Distinct characteristics of the CALERIE 2 study design include the longer duration of the CR intervention (2 vs 1 yr), greater %CR prescribed (25% vs 16%–20%), younger age range of participants (21–50 vs 50–60 yr), larger study sample size (218 vs 34), and a larger sample of CR participants (143 vs 18). The clinical significance of the observed decrements in absolute strength in these studies is unclear. In the absence of sex- and age-specific muscle strength reference values and their associations with long-term health outcomes, it is difficult to predict whether such changes are deleterious with respect to functional capacity and disease risk. A decline in absolute strength is to be expected after 2 yr of a CR intervention that does not include resistance training; future CR studies should include a structured resistance training component to evaluate its potential in preserving lean body mass and absolute strength.
Interestingly, the changes in strength in response to 2 yr of CR differed significantly by sex, with only the female CR participants demonstrating a decline in absolute strength and only the male participants demonstrating an increase in strength expressed relative to body weight. The explanation for this finding is unclear, particularly in light of the greater loss of lean body mass among male participants. There were no significant relationships observed between changes in absolute leg strength and changes in lean body mass or whole body mass at 2 yr in the overall sample. Likewise, dietary protein did not appear to influence the changes in lean body mass or muscle strength at 2 yr.
A notable limitation of this study is that the average level of CR achieved was substantially less than the 25% prescribed, despite frequent contact and encouragement by research personnel. Therefore, we are unable to determine whether 25% CR would result in deleterious changes in V˙O2max or muscle strength that might impair cardiorespiratory or functional capacity. Additional factors that may have influenced our results include differences in participant demographics at the three clinical sites and variability in diet composition and diet quality among participants. Furthermore, some subjects were unable to complete the V˙O2max or muscle strength tests for orthopedic reasons, some did not meet the criteria for achieving V˙O2max, and others dropped out of the study. Strengths of the CALERIE 2 trial include a relatively large and diverse sample of individuals from three distinct regions of the United States, a long-term CR intervention, common protocols for the CR intervention and all assessments, and a high degree of quality control.
In summary, we observed that 2 yr of CR in nonobese, healthy, young, and middle-age adults resulted in higher relative aerobic capacity, despite significant reductions in absolute V˙O2max, absolute strength, whole body mass, lean body mass, and leg lean mass. In addition, treadmill exercise time and work rate increased after 2 yr of CR, suggesting that long-term, modest CR with adequate nutrient intake does not adversely affect cardiorespiratory function in healthy adults.
Acknowledgments
This project was supported by grants U01AG020478, U01AG020480, U01AG020487, U01AG022132, and U24AG047121 from the National Institute on Aging; grants P30DK056341 and P30DK072476 from the National Institute of Diabetes and Digestive and Kidney Disease. The authors thank the study participants at each site for their dedication to this project and all the research personnel that contributed their expertise and skills. None of the authors or anyone involved with this research had a conflict of interest, and the results of the present study do not constitute endorsement by the American College of Sports Medicine.
On behalf of the CALERIE Study Group, the authors would like to thank the study participants at each site for their dedication to this project and all the research personnel who contributed their expertise and skills.
REFERENCES
- 1.American College of Sports Medicine. ACSM’s Guidelines for Exercise Testing and Prescription. 9th ed Philadelphia, PA: Lippincott Williams & Wilkins; 2014. [Google Scholar]
- 2.Anderson RM, Barger JL, Edwards MG, et al. Dynamic regulation of PGC-1alpha localization and turnover implicates mitochondrial adaptation in calorie restriction and the stress response. Aging Cell. 2008;7(1):101–11. [DOI] [PMC free article] [PubMed] [Google Scholar]
- 3.Bales CR, Kraus WE. Caloric restriction: implications for human cardiometabolic health. J Cardiopulm Rehabil Prev. 2013;33(4):201–8. [DOI] [PMC free article] [PubMed] [Google Scholar]
- 4.Borg G. Perceived exertion as an indicator of somatic stress. Scand J Rehabil Med. 1970;2(2):92–8. [PubMed] [Google Scholar]
- 5.Civitarese AE, Carling S, Heilbronn LK, et al. Calorie restriction increases muscle mitochondrial biogenesis in healthy humans. PLoS Med. 2007;4(3):e76. [DOI] [PMC free article] [PubMed] [Google Scholar]
- 6.Das SK, Roberts SB, Bhapkar MV, et al. Body-composition changes in the Comprehensive Assessment of Long-term Effects of Reducing Intake of Energy (CALERIE)-2 study: a 2-y randomized controlled trial of calorie restriction in nonobese humans. Am J Clin Nutr. 2017;105(4):913–27. [DOI] [PMC free article] [PubMed] [Google Scholar]
- 7.Fontana L, Hu FB. Optimal body weight for health and longevity: bridging basic, clinical, and population research. Aging Cell. 2014;13(3):391–400. [DOI] [PMC free article] [PubMed] [Google Scholar]
- 8.Grimsmo J, Arnesen H, Maehlum S. Changes in cardiorespiratory function in different groups of former and still active male cross-country skiers: a 28–30-year follow-up study. Scand J Med Sci Sports. 2010;20(1):e151–61. [DOI] [PubMed] [Google Scholar]
- 9.Hawkins S, Wiswell R. Rate and mechanism of maximal oxygen consumption decline with aging: implications for exercise training. Sports Med. 2003;33(12):877–88. [DOI] [PubMed] [Google Scholar]
- 10.Hepple RT. Why eating less keeps mitochondria working in aged skeletal muscle. Exerc Sport Sci Rev. 2009;37(1):23–8. [DOI] [PubMed] [Google Scholar]
- 11.Hepple RT, Baker DJ, McConkey M, Murynka T, Norris R. Caloric restriction protects mitochondrial function with aging in skeletal and cardiac muscles. Rejuvenation Res. 2006;9(2):219–22. [DOI] [PubMed] [Google Scholar]
- 12.Hochberg Y. A sharper Bonferroni procedure for multiple tests of significance. Biometrika. 1988;75(4):800–2. [Google Scholar]
- 13.Holloszy JO, Fontana L. Caloric restriction in humans. Exp Gerontol. 2007;42(8):709–12. [DOI] [PMC free article] [PubMed] [Google Scholar]
- 14.Huber PJ. 1972 Wald Memorial Lectures—Robust Regression—Asymptotics, Conjectures and Monte-Carlo. Ann Stat. 1973;1(5):799–821. [Google Scholar]
- 15.Huber PJ, Ronchetti EM. Robust Statistics. 2nd ed Hoboken (NJ): Wiley; 2009. [Google Scholar]
- 16.Institute of Medicine, and Food and Nutrition Board. Dietary Reference Intakes for Energy, Carbohydrate, Fiber, Fat, Fatty Acids, Cholesterol, Protein, and Amino Acids. Washington (DC): The National Academies Press, 2005. [Google Scholar]
- 17.Lopez-Lluch G, Hunt N, Jones B, et al. Calorie restriction induces mitochondrial biogenesis and bioenergetic efficiency. Proc Natl Acad Sci U S A. 2006;103(6):1768–73. [DOI] [PMC free article] [PubMed] [Google Scholar]
- 18.Martin CK, Das SK, Lindblad L, et al. Effect of calorie restriction on the free-living physical activity levels of nonobese humans: results of three randomized trials. J Appl Physiol (1985). 2011;110(4):956–63. [DOI] [PMC free article] [PubMed] [Google Scholar]
- 19.Mattison JA, Colman RJ, Beasley TM, et al. Caloric restriction improves health and survival of rhesus monkeys. Nat Commun. 2017;8:14063. [DOI] [PMC free article] [PubMed] [Google Scholar]
- 20.Racette SB, Das SK, Bhapkar M, et al. Approaches for quantifying energy intake and %calorie restriction during calorie restriction interventions in humans: the multicenter CALERIE study. Am J Physiol Endocrinol Metab. 2012;302(4):E441–8. [DOI] [PMC free article] [PubMed] [Google Scholar]
- 21.Racette SB, Weiss EP, Villareal DT, et al. One year of caloric restriction in humans: feasibility and effects on body composition and abdominal adipose tissue. J Gerontol A Biol Sci Med Sci. 2006;61(9):943–50. [DOI] [PMC free article] [PubMed] [Google Scholar]
- 22.Ravussin E, Redman LM, Rochon J, et al. A 2-year randomized controlled trial of human caloric restriction: feasibility and effects on predictors of health span and longevity. J Gerontol A Biol Sci Med Sci. 2015;70(9):1097–104. [DOI] [PMC free article] [PubMed] [Google Scholar]
- 23.Redman LM, Heilbronn LK, Martin CK, et al. Metabolic and behavioral compensations in response to caloric restriction: implications for the maintenance of weight loss. PLoS One. 2009;4(2):e4377. [DOI] [PMC free article] [PubMed] [Google Scholar]
- 24.Rickman AD, Williamson DA, Martin CK, et al. The CALERIE study: design and methods of an innovative 25% caloric restriction intervention. Contemp Clin Trials. 2011;32(6):874–81. [DOI] [PMC free article] [PubMed] [Google Scholar]
- 25.Rochon J, Bales CW, Ravussin E, et al. Design and conduct of the CALERIE study: comprehensive assessment of the long-term effects of reducing intake of energy. J Gerontol A Biol Sci Med Sci. 2011;66(1):97–108. [DOI] [PMC free article] [PubMed] [Google Scholar]
- 26.Rogers MA, Hagberg JM, Martin WH, 3rd, Ehsani AA, Holloszy JO. Decline in V˙O2max with aging in master athletes and sedentary men. J Appl Physiol (1985). 1990;68(5):2195–9. [DOI] [PubMed] [Google Scholar]
- 27.Ross R, Blair SN, Arena R, et al. ; American Heart Association Physical Activity Committee of the Council on Lifestyle and Cardiometabolic Health; Council on Clinical Cardiology; Council on Epidemiology and Prevention; Council on Cardiovascular and Stroke Nursing; Council on Functional Genomics and Translational Biology; Stroke Council. Importance of assessing cardiorespiratory fitness in clinical practice: a case for fitness as a clinical vital sign: a scientific statement from the American Heart Association. Circulation. 2016;134(24):e653–99. [DOI] [PubMed] [Google Scholar]
- 28.Tamesis B, Stelken A, Byers S, et al. Comparison of the Asymptomatic Cardiac Ischemia Pilot and modified Asymptomatic Cardiac Ischemia Pilot versus Bruce and Cornell exercise protocols. Am J Cardiol. 1993;72(9):715–20. [DOI] [PubMed] [Google Scholar]
- 29.Tanaka H, Monahan KD, Seals DR. Age-predicted maximal heart rate revisited. J Am Coll Cardiol. 2001;37(1):153–6. [DOI] [PubMed] [Google Scholar]
- 30.Weiss EP, Racette SB, Villareal DT, et al. Lower extremity muscle size and strength and aerobic capacity decrease with caloric restriction but not with exercise-induced weight loss. J Appl Physiol (1985). 2007;102(2):634–40. [DOI] [PMC free article] [PubMed] [Google Scholar]
- 31.Wright SP. Adjusted P-values for simultaneous inference. Biometrics. 1992;48:1005–13. [Google Scholar]
- 32.Yamada Y, Colman RJ, Kemnitz JW, et al. Long-term calorie restriction decreases metabolic cost of movement and prevents decrease of physical activity during aging in rhesus monkeys. Exp Gerontol. 2013;48(11):1226–35. [DOI] [PMC free article] [PubMed] [Google Scholar]