

Here, Stapel et al. investigated how stochastic transcription activation can result in uniform expression during development of cellularized embryos. Using smFISH and mathematical modeling, the authors show that during zebrafish embryogenesis, transcription activation is stochastic due to (1) genes acquiring transcriptional competence at different times in different cells, (2) differences in cell cycle stage between cells, and (3) the stochastic nature of transcription.
Keywords: ZGA, smFISH, zebrafish, stochastic transcription, uniform expression
Abstract
Transcription is often stochastic. This is seemingly incompatible with the importance of gene expression during development. Here we show that during zebrafish embryogenesis, transcription activation is stochastic due to (1) genes acquiring transcriptional competence at different times in different cells, (2) differences in cell cycle stage between cells, and (3) the stochastic nature of transcription. Initially, stochastic transcription causes large cell-to-cell differences in transcript levels. However, variability is reduced by lengthening cell cycles and the accumulation of transcription events in each cell. Temporal averaging might provide a general context in which to understand how embryos deal with stochastic transcription.
Transcription is often stochastic, which means that it does not occur in all cells at the same time, even when cells receive the same signals (Elowitz et al. 2002; Blake et al. 2003; Raser and O'Shea 2004; Kærn et al. 2005; Raj et al. 2006; Raj and van Oudenaarden 2008). There are two main causes for this stochasticity. First, productive binding of each of the proteins involved in transcription activation is the result of stochastic interactions, causing what is called “intrinsic noise” (Elowitz et al. 2002; Blake et al. 2003; Raser and O'Shea 2004; Kærn et al. 2005; Elf et al. 2007; Raj and van Oudenaarden 2008; Li and Xie 2011; Mueller et al. 2013). Second, phenotypic differences between cells, such as differences in the abundance of the transcriptional machinery, energy state, or cell cycle stage, can affect the efficiency with which transcription is activated in different cells, causing “extrinsic noise” (Neves et al. 2010; Zopf et al. 2013; Xu et al. 2015). Both noise sources can result in large differences in transcript levels between cells (Raj et al. 2006; Zenklusen et al. 2008; Itzkovitz et al. 2011; Boettiger and Levine 2013), which are often propagated to the protein level (Blake et al. 2003; Bar-Even et al. 2006; Newman et al. 2006). Thus, intrinsic and extrinsic transcription noise can lead to functional differences between cells.
Although cell-to-cell differences might be beneficial in single-cell organisms (Blake et al. 2006; Raj and van Oudenaarden 2008) or in diversifying cell fate during development (Simpson 1997; Wernet et al. 2006; Magklara and Lomvardas 2013), they have been suggested to be disadvantageous when fields of cells need to behave coordinately during development (Raj and van Oudenaarden 2008; Lagha et al. 2012, 2013). Thus, uniform gene expression, defined as the presence of similar transcript levels in a field of cells, might be important during embryonic development. In agreement with this notion, quantification of cellular transcript levels for a handful of genes in the Drosophila embryo revealed that these are uniformly expressed (Boettiger and Levine 2013; Little et al. 2013). Experimental manipulations resulting in cell-to-cell differences in the expression levels of one of these genes (snail, an important regulator of the epithelial-to-mesenchymal transition) disrupt coordinated cell movements during gastrulation, suggesting that uniform transcript levels may be required for development (Lagha et al. 2013). However, it remains unclear how prevalent uniform gene expression is in embryos.
If uniform expression levels are a general feature of developing organisms, this would raise the question of how such uniformity is achieved. In Drosophila, intrinsic noise is reduced by polymerase pausing at the promoter, which reduces the process of transcription activation to a single step of pause release (Boettiger and Levine 2013; Lagha et al. 2013). Spatiotemporal averaging of transcripts in the syncytial blastoderm of the early Drosophila embryo has been shown to further reduce variability caused by intrinsic noise (Little et al. 2013). However, only an estimated 15% of genes contain paused polymerase at their promoters in the Drosophila embryo (Zeitlinger et al. 2007; Boettiger and Levine 2009; Lagha et al. 2012), and spatial averaging cannot contribute to uniform gene expression when cell membranes are present. Furthermore, the effects of extrinsic noise, which is abundantly present in cell culture (Battich et al. 2015), have not yet been assessed during development. Thus, it remains unclear whether and, if so, how uniformity in gene expression is achieved.
Here, we analyzed gene expression at single-cell and single-molecule resolution in zebrafish embryos from the onset of transcription during the midblastula transition (MBT) to the onset of gastrulation. We found that genes are stochastically activated, which results in large cell-to-cell differences in transcript levels. However, this variability is reduced when embryos approach gastrulation. Our results suggest a model in which uniform gene expression is achieved through temporal averaging of gene expression noise.
Results and Discussion
To analyze transcript levels and transcriptional activity quantitatively and at cellular resolution, we used single-molecule fluorescence in situ hybridization (smFISH) on sections of zebrafish embryos (Fig. 1; Stapel et al. 2016). smFISH identifies individual mRNA molecules as well as sites of active transcription where multiple transcripts accumulate (transcription foci) (Raj et al. 2008; Stapel et al. 2016). We costained samples with phalloidin and DAPI and assigned transcripts and transcription foci to individual cells and nuclei by automated image analysis (Fig. 1B; Supplemental Fig. S1; Stapel et al. 2016). To capture changes in gene expression at high temporal resolution, we collected a time series of embryonic stages with 5-min resolution starting before the onset of zygotic genome activation (ZGA; 2.25 h post-fertilization [hpf]) until the onset of gastrulation (4.3 hpf), spanning multiple cell cycles (Fig. 1A). Because the early cell cycles in zebrafish are synchronized cleavage divisions, we could use the distribution of cell cycle stages within embryos to correct for minor errors in staging accuracy (Supplemental Fig. S2). We selected eight genes (Supplemental Fig. S3A) that (1) start to be transcribed during ZGA and for which no transcripts are maternally provided (based on RNA sequencing [RNA-seq] data) (Supplemental Fig. S3B; Pauli et al. 2012) and (2) appear to be ubiquitously expressed in whole-mount ISH at the dome stage (Supplemental Fig. S3C) to maximize the number of cells that we could analyze in our data set. These include genes with a broad range of functions, from metabolic enzymes to transcription factors (Supplemental Fig. S3D). Quantitative analysis of cellular transcript densities (defined as the number of transcripts per cubic micrometer) revealed that low levels of transcripts are present prior to the canonical onset of ZGA for seven out of eight genes. This is in agreement with a recent study in which RNA-seq identified maternal RNAs for those genes (Lee et al. 2013). Thus, although we selected genes based on the absence of maternal RNAs, transcripts are maternally provided at low levels for most genes (Fig. 1B; Supplemental Figs. S1, S4). We used a threshold to distinguish between maternal and zygotic transcripts (Supplemental Fig. S5) and confirmed that all selected genes are induced during ZGA (Fig. 1C). The timing and levels of zygotic transcription differ between genes (Fig. 1C). Moreover, between the first two cell types that are specified in the embryo—the embryonic deep layer (DEL) cells and the extraembryonic cells of the enveloping layer (EVL) (Kimmel et al. 1990)—we observed differences in expression timing and level for individual genes (Fig. 1C). Therefore, we analyzed DEL and EVL independently in this study. Additional positional bias was detected for tbx16, which is expressed at a higher level in the margin of the embryo (Supplemental Fig. S6). Because this positional bias is the consequence of a graded signaling input (Dubrulle et al. 2015) and does not represent noise, we excluded the margin from the analysis of this gene. We conclude that the set of genes that we selected is robustly induced during ZGA and that smFISH provides quantitative information on transcript levels during the time series. Together, this allowed us to analyze whether and how precise gene expression levels are established during embryogenesis.
Figure 1.

Quantitative analysis of transcription from ZGA to gastrulation. (A) Samples for smFISH were collected every 5 min from the canonical onset of ZGA to the onset of gastrulation as well as at three stages prior to ZGA. Stage-specific drawings of representative embryos are adapted from Kimmel et al. (1995) with permission (© 1995 Wiley-Liss, Inc.). (B) smFISH for aldob at the 512-cell, high + 15-min, and dome stages. (Magenta) Detected transcripts; (white) transcription foci; (green) cell outlines; (blue) nuclear outlines. Images are maximum projections of 17 z-slices with a spacing of 0.3 µm. Bars, 10 µm. (C) Mean cellular (cytoplasmic + nuclear [including foci]) transcript densities in DEL and EVL cells over the course of the time series. Values are means of medians of four or more embryos. Error bars represent SD.
Genes are stochastically activated during ZGA
First, to determine whether genes are synchronously or stochastically activated during ZGA, for each gene, we measured how long it took from first observed activation until 50% of the cells had activated transcription (Fig. 2A,B). We considered a cell to have activated transcription of a gene when it contained zygotic transcripts and/or a transcription focus. To make sure that no transcription foci were missed due to cryosectioning of the samples, we analyzed activation only in those cells in which the nucleus was centered in the section (see Stapel et al. 2016 for a description of this approach). We detected significant differences in the rate of activation both between genes and for individual genes between DEL and EVL, with time to 50% activation ranging from 13 to 40 min (Fig. 2A,B; Supplemental Fig. S7). This is slow compared with Drosophila, where synchronous genes are activated in the majority of cells in a matter of minutes (Boettiger and Levine 2009; Lagha et al. 2013). Moreover, activation of transcription in 50% of cells often takes more than one cell cycle (Fig. 2B). Thus, we conclude that genes are stochastically activated during zebrafish ZGA. This suggests that, at least for the genes that we analyzed, no specific mechanisms are in place to ensure synchronous activation of transcription when the zygotic genome first becomes active.
Figure 2.
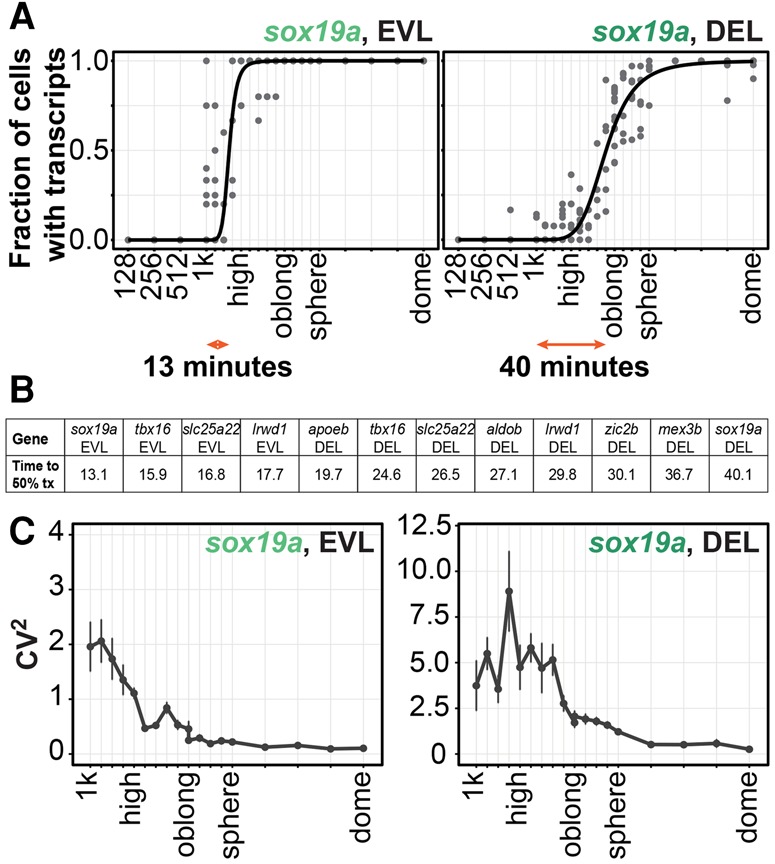
Genes are stochastically activated during ZGA. (A) Proportion of cells that are transcriptionally active at each stage for sox19a in the EVL (fastest activation) and DEL (slowest activation). Each dot represents data for a single embryo. The black line corresponds to the Hill fit of the data. The orange arrows indicate the time from first activation to activation in 50% of cells. (B) Activation rates for all genes, separately for DEL and EVL. (C) Variability in transcript density (CV2) for sox19a over the course of the time series. Values are means of medians of four or more embryos. Error bars represent SEM.
Stochastic activation results in transcript level variability, which is reduced over time
Stochastic transcription can lead to large cell-to-cell differences in transcript levels (Raj et al. 2006; Zenklusen et al. 2008; Itzkovitz et al. 2011; Boettiger and Levine 2013). In agreement with this, we observed large differences in transcript levels between cells when transcription is first activated during zebrafish embryogenesis (Fig. 1B; Supplemental Fig. S1). To quantify this variability and assess whether it changes over time, we determined the squared coefficient of variation (CV2; SD2/µ2) of transcript density per cell from the onset of ZGA to the onset of gastrulation (Fig. 2C; Supplemental Fig. S8). We used cytoplasmic transcripts in this analysis because these can directly affect cellular function. As predicted by the proposed importance of uniform transcript levels in development, transcript variability decreases as embryos approach gastrulation (Fig. 2C; Supplemental Fig. S8). Thus, in spite of the large variability in transcript levels between cells that we observed immediately after ZGA, relatively uniform transcript levels are reached by the time of gastrulation. This provides the first evidence for uniform gene expression in a cellularized embryo.
Extrinsic noise contributes to stochastic transcription during development
To understand how uniform expression patterns can be established in spite of stochastic transcription, we analyzed the sources of transcription noise during zebrafish development. Differences between cells that affect transcriptional competence (extrinsic noise) often affect transcription activation of different genes in the same way (Raser and O'Shea 2004; Neves et al. 2010; Battich et al. 2015). Thus, to assess whether extrinsic noise contributes to stochastic transcription in the embryo, we analyzed the differences in transcriptional activity (presence of transcription foci) for sets of genes that are activated at the same time and in the same cell type by dual-color smFISH (Fig. 3A,B). In the absence of extrinsic noise, transcription foci of two different genes would occur independently of each other. Therefore, the chance that transcription foci of two genes in one nucleus co-occur (pAB) would factorize into pAB = pA × pB, with pA and pB as the chances of observing foci for each of the genes. In the presence of extrinsic noise, activation of the two genes would be correlated such that pAB > pA × pB. We found that pAB > pA × pB for all tested gene combinations (Fig. 3A,B) and conclude that extrinsic noise contributes to stochastic transcription during early zebrafish development.
Figure 3.

Stochastic activation is due to both extrinsic and intrinsic noise. (A) Schematic explanation of extrinsic noise. (Left panel) All cells are equally permissive for transcription. (Right panel) Green cells are more permissive for transcription than orange cells. Transcription foci for two genes are indicated in blue and magenta. (B) Box plot of the observed fraction of nuclei with transcription foci (pAB) divided by the fraction that would be predicted in the absence of extrinsic noise (pA × pB). In the absence of extrinsic noise, this value would be 1 (dashed horizontal line). Analyses were performed on all nuclei (light gray) or nuclei in interphase only (black). (*) P < 0.05; (**) P < 0.01, two-tailed Student's t-test. (C) Schematic explanation of intrinsic noise. Transcription foci for a single gene are indicated in magenta. (D) Correlation of the size of transcription foci for the two alleles of aldob at the sphere and dome stages in the DEL. Each dot represents focus sizes in one nucleus.
During the MBT, cell cycles desychronize (Kane and Kimmel 1993; Kimmel et al. 1995), as is also apparent in our data set (Supplemental Fig. S2). The resulting cell cycle heterogeneity is a likely source of extrinsic noise. To test the contribution of cell cycle heterogeneity to extrinsic noise, we repeated our analysis for cells in interphase only (Fig. 3B; Supplemental Fig. S2). We found that for all gene pairs, pAB was reduced and approached pA × pB. Thus, we conclude that cell cycle heterogeneity is an important source of extrinsic noise in the zebrafish embryo. Because cell cycle heterogeneity is often observed in embryos, this might be a common source of extrinsic noise.
Intrinsic noise contributes to stochastic transcription during development
Noise intrinsic to the transcription process might also contribute to stochastic transcription in the zebrafish embryo. In the absence of intrinsic noise, the two alleles of a given gene would be activated at the same time and to the same extent, resulting in a correlation between transcription focus sizes at the two alleles (Fig. 3C, left; Little et al. 2013; Bothma et al. 2014). The presence of intrinsic noise would reduce this correlation (Fig. 3C, right). We analyzed the correlation in focus sizes between the two alleles of each of the genes for those nuclei in which both alleles are active (Fig. 3D; Supplemental Fig. S9). We analyzed this correlation at each stage separately because mean focus size decreased over time concurrently with a decrease in cell size (Supplemental Fig. S10). We found that the sizes of transcription foci at the two alleles are not correlated (Fig. 3D; Supplemental Fig. S9; data not shown). Thus, in addition to extrinsic noise, intrinsic noise contributes significantly to stochastic transcription during early zebrafish development.
Minimal stochastic model of transcription activation
To understand the effects of extrinsic and intrinsic noise on transcript variability over time (Fig. 2C; Supplemental Fig. S8), we developed a minimal stochastic model of transcription activation in the zebrafish embryo (Fig. 4A,B; see the Supplemental Model for details). In this model, the first step to transcription activation is the acquisition of transcriptional competence of a gene during ZGA. We introduced this step to account for the variability between cells in the time at which they acquire transcriptional competence for a specific gene. This can be considered intrinsic noise, but to distinguish it from the noise that is intrinsic to the transcription process, we refer to this as noise in the time to transcriptional competence. Once a gene is competent for transcription, transcription and mRNA degradation happen stochastically at rates c1 and c2, respectively (intrinsic noise) (Fig. 4A,B; Supplemental Model). The production rate c1 in turn depends on the cell cycle stage (extrinsic noise), which we described by a simple two-state model (mitosis vs. active) (Fig. 4A,B). The latter was calibrated to match the measured proportion of cells in mitosis/interphase over the course of the time series. Apart from the cell cycle model, the parameters of the transcription model were estimated from the transcript densities for each of the eight genes separately using a Bayesian moment-matching procedure (Zechner et al. 2012). To further constrain the parameter search, we measured the mRNA half-lives of the individual genes and provided them to the model as prior information (Supplemental Fig. S11). We found that our minimal model of transcription activation is sufficient to explain the experimentally measured increase in transcript densities and their variability across cells (Fig. 4C; Supplemental Fig. S12).
Figure 4.

Cell-to-cell variability in transcript levels is reduced through temporal averaging of transcription noise. (A) Minimal stochastic model of transcription activation. (c1) Transcription rate; (c2) degradation rate. (B) Schematic of the different noise sources that are captured by the model. (C) The results of the transcription model (blue lines) recapitulate the experimentally measured increase in transcript densities (solid gray line) and its variability (SD; dashed gray lines) across cells. (D) Contribution of the three noise sources to transcript variability (CV2). (Red) intrinsic noise; (green) acquisition of transcriptional competence; (blue) cell cycle noise.
Transcript variability is reduced through temporal averaging of extrinsic and intrinsic noise
We next used the model to analyze the contribution of the different noise sources to transcript variability over time. We found that for all genes, cell-to-cell differences in the acquisition of transcriptional competence contribute significantly to transcript variability when transcription begins (Fig. 4D; Supplemental Fig. S13, green bars). It is currently unclear what underlies these cell-to-cell differences, but we speculate that temporal differences in chromatin remodeling might play a role, especially because dramatic changes in chromatin structure occur during zebrafish ZGA (Vastenhouw et al. 2010; Lindeman et al. 2011; Zhang et al. 2014). The acquisition of transcriptional competence is a one-time event but has long-lasting effects on transcript variability (Fig. 4D; Supplemental Fig. S13). Extrinsic noise stemming from cell cycle heterogeneity contributes to transcript variability (CV2extr) significantly when transcription begins, but its effect decreases over time (Fig. 4D; Supplemental Fig. S13, blue bars). We hypothesize that the contribution of cell cycle heterogeneity is reduced over time because each cell goes through multiple cell divisions and because lengthening of interphases reduces the heterogeneity in cell cycle stages (Kane and Kimmel 1993). The contribution of intrinsic noise to transcript variability is generally high when transcription begins but rapidly approaches zero (Fig. 4D; Supplemental Fig. S13, red bars). This can be explained by the accumulation of multiple transcription events in each cell over time. Facilitated by long transcript half-lives (Supplemental Fig. S11), this results in an increase in transcript density, which buffers the effect of intrinsic noise. Together, this suggests that transcript variability is inversely correlated with the amount of time that cells spend in interphase. Indeed, simulations of the model in which cell cycles are kept short during the complete time series resulted in higher transcript variability at the end stage of the simulation (Supplemental Fig. S14). Thus, our results suggest a model in which uniform gene expression is achieved through temporal averaging of gene expression noise.
Our results suggest that in zebrafish embryos, the functional consequences of transcription noise are limited. When genes are first activated, variability in transcript densities between cells might have limited effects because transcript levels are relatively low. Gene regulatory mechanisms, such as delayed mRNA translation, may further reduce the effects of cell-to-cell differences in transcript density. When the embryo approaches gastrulation, transcript variability is reduced because the effects of transcription noise decrease. Although we studied only eight genes, all of which are ubiquitously expressed, the observation that genes with diverse functions behave similarly suggests that these mechanisms of noise reduction could easily apply to other genes and in different developmental contexts. Thus, our data suggest that in embryos, the functional consequences of stochastic transcription are limited and that mechanisms supporting the synchronous onset of transcription (Boettiger and Levine 2009, 2013; Lagha et al. 2013) are necessary only when there is no time to resolve variability caused by stochastic transcription.
Materials and methods
Zebrafish
Zebrafish were maintained and raised under standard conditions. Wild-type (TLAB) embryos were left to develop to the desired stage at 28°C. Staging was done based on morphology (Kimmel et al. 1995).
smFISH and image processing
Sample preparation, smFISH, image acquisition, and image processing were done as described previously (Stapel et al. 2016), and details are in the Supplemental Material. In brief, 8-µm cryosections of OCT-embedded embryos were stained with smFISH probes as well as DAPI and phalloidin to visualize transcripts, nuclei, and cell outlines, respectively. Image acquisition was done on a DeltaVision epifluorescence system equipped with a 100× 1.4 NA objective. The first 17 optical z-slices (corresponding to ∼5-µm sample thickness) of each sample were used for all image analyses to ensure consistent high-quality results. We segmented cells using a cascaded random forest classifier in KNIME in combination with our Fiji plug-in, PathFinder, for cell tracing. We manually corrected segmentation errors and annotated cell types (DEL vs. EVL) and cell cycle stage using our Fiji cell annotation plug-in. Cell, cell type, and cell cycle stage masks were used as input for the Fiji transcript analysis plug-in together with raw images for smFISH and nuclei to obtain transcript densities in each cell and nucleus as well as the number of transcripts in each transcription focus.
The Random Forest classification pipeline for cell segmentation is available in KNIME (http://tinyurl.com/KNIME-MS-ECS). All Fiji plug-ins are available through the Fiji update site MS-ECS-2D (see http://fiji.sc/MS-ECS-2D).
Supplementary Material
Acknowledgments
We thank the three anonymous reviewers for their constructive feedback; Mykola Markadeiev for help with data processing; Lennart Hilbert for providing cell size data; Lennart Hilbert, Alf Honigmann, Máté Pálfy, Jochen Rink, Jakob Ruess, Jacqueline Tabler, and Pavel Tomancak for critically reading the manuscript; and the following Services and Facilities of the Max Planck Institute of Molecular Cell Biology and Genetics for their support: the Fish Facility and the Light Microscopy Facility. This work was supported by Max Planck Institute of Molecular Cell Biology and Genetics core funding, the Human Frontier Science Program, and a Boehringer Ingelheim Fonds PhD fellowship to L.C.S. L.C.S. and N.L.V. conceived the study. L.C.S. performed and analyzed all experiments. C.Z. developed the model with input from L.C.S. L.C.S. and N.L.V. wrote the manuscript with input from C.Z.
Footnotes
Supplemental material is available for this article.
Article published online ahead of print. Article and publication date are online at http://www.genesdev.org/cgi/doi/10.1101/gad.302935.117.
References
- Bar-Even A, Paulsson J, Maheshri N, Carmi M, O'Shea E, Pilpel Y, Barkai N. 2006. Noise in protein expression scales with natural protein abundance. Nat Genet 38: 636–643. [DOI] [PubMed] [Google Scholar]
- Battich N, Stoeger T, Pelkmans L. 2015. Control of transcript variability in single mammalian cells. Cell 163: 1596–1610. [DOI] [PubMed] [Google Scholar]
- Blake WJ, Kaern M, Cantor CR, Collins JJ. 2003. Noise in eukaryotic gene expression. Nature 422: 633–637. [DOI] [PubMed] [Google Scholar]
- Blake WJ, Balázsi G, Kohanski MA, Isaacs FJ, Murphy KF, Kuang Y, Cantor CR, Walt DR, Collins JJ. 2006. Phenotypic consequences of promoter-mediated transcriptional noise. Mol Cell 24: 853–865. [DOI] [PubMed] [Google Scholar]
- Boettiger AN, Levine M. 2009. Synchronous and stochastic patterns of gene activation in the Drosophila embryo. Science 325: 471–473. [DOI] [PMC free article] [PubMed] [Google Scholar]
- Boettiger AN, Levine M. 2013. Rapid transcription fosters coordinate snail expression in the Drosophila embryo. Cell Rep 3: 8–15. [DOI] [PMC free article] [PubMed] [Google Scholar]
- Bothma JP, Garcia HG, Esposito E, Schlissel G, Gregor T, Levine M. 2014. Dynamic regulation of eve stripe 2 expression reveals transcriptional bursts in living Drosophila embryos. Proc Natl Acad Sci 111: 10598–10603. [DOI] [PMC free article] [PubMed] [Google Scholar]
- Dubrulle J, Jordan BM, Akhmetova L, Farrell JA. 2015. Response to Nodal morphogen gradient is determined by the kinetics of target gene induction. Elife 4: e05042. [DOI] [PMC free article] [PubMed] [Google Scholar]
- Elf J, Li G-W, Xie XS. 2007. Probing transcription factor dynamics at the single-molecule level in a living cell. Science 316: 1191–1194. [DOI] [PMC free article] [PubMed] [Google Scholar]
- Elowitz MB, Levine AJ, Siggia ED, Swain PS. 2002. Stochastic gene expression in a single cell. Science 297: 1183–1186. [DOI] [PubMed] [Google Scholar]
- Itzkovitz S, Lyubimova A, Blat IC, Maynard M, van Es J, Lees J, Jacks T, Clevers H, van Oudenaarden A. 2011. Single-molecule transcript counting of stem-cell markers in the mouse intestine. Nat Cell Biol 14: 106–114. [DOI] [PMC free article] [PubMed] [Google Scholar]
- Kærn M, Elston TC, Blake WJ, Collins JJ. 2005. Stochasticity in gene expression: from theories to phenotypes. Nat Rev Genet 6: 451–464. [DOI] [PubMed] [Google Scholar]
- Kane DA, Kimmel CB. 1993. The zebrafish midblastula transition. Development 119: 447–456. [DOI] [PubMed] [Google Scholar]
- Kimmel CB, Warga RM, Schilling TF. 1990. Origin and organization of the zebrafish fate map. Development 108: 581–594. [DOI] [PubMed] [Google Scholar]
- Kimmel CB, Ballard WW, Kimmel SR, Ullmann B, Schilling TF. 1995. Stages of embryonic development of the zebrafish. Dev Dyn 203: 253–310. [DOI] [PubMed] [Google Scholar]
- Lagha M, Bothma JP, Levine M. 2012. Mechanisms of transcriptional precision in animal development. Trends Genet 28: 409–416. [DOI] [PMC free article] [PubMed] [Google Scholar]
- Lagha M, Bothma JP, Esposito E, Ng S, Stefanik L, Tsui C, Johnston J, Chen K, Gilmour DS, Zeitlinger J, et al. 2013. Paused Pol II coordinates tissue morphogenesisin the Drosophila embryo. Cell 153: 976–987. [DOI] [PMC free article] [PubMed] [Google Scholar]
- Lee MT, Bonneau AR, Takacs CM, Bazzini AA, DiVito KR, Fleming ES, Giraldez AJ. 2013. Nanog, Pou5f1 and SoxB1 activate zygotic gene expression during the maternal-to-zygotic transition. Nature 503: 360–364. [DOI] [PMC free article] [PubMed] [Google Scholar]
- Li G-W, Xie XS. 2011. Central dogma at the single-molecule level in living cells. Nature 475: 308–315. [DOI] [PMC free article] [PubMed] [Google Scholar]
- Lindeman LC, Andersen IS, Reiner AH, Li N, Aanes H, Østrup O, Winata C, Mathavan S, Müller F, Aleström P, et al. 2011. Prepatterning of developmental gene expression by modified histones before zygotic genome activation. Dev Cell 21: 993–1004. [DOI] [PubMed] [Google Scholar]
- Little SC, Tikhonov M, Gregor T. 2013. Precise developmental gene expression arises from globally stochastic transcriptional activity. Cell 154: 789–800. [DOI] [PMC free article] [PubMed] [Google Scholar]
- Magklara A, Lomvardas S. 2013. Stochastic gene expression in mammals: lessons from olfaction. Trends Cell Biol 23: 449–456. [DOI] [PMC free article] [PubMed] [Google Scholar]
- Mueller F, Stasevich TJ, Mazza D, McNally JG. 2013. Quantifying transcription factor kinetics: at work or at play? Crit Rev Biochem Mol Biol 48: 492–514. [DOI] [PubMed] [Google Scholar]
- Neves das RP, Jones NS, Andreu L, Gupta R, Enver T, Iborra FJ. 2010. Connecting variability in global transcription rate to mitochondrial variability. PLoS Biol 8: e1000560. [DOI] [PMC free article] [PubMed] [Google Scholar]
- Newman JRS, Ghaemmaghami S, Ihmels J, Breslow DK, Noble M, DeRisi JL, Weissman JS. 2006. Single-cell proteomic analysis of S. cerevisiae reveals the architecture of biological noise. Nature 441: 840–846. [DOI] [PubMed] [Google Scholar]
- Pauli A, Valen E, Lin MF, Garber M, Vastenhouw NL, Levin JZ, Fan L, Sandelin A, Rinn JL, Regev A, et al. 2012. Systematic identification of long noncoding RNAs expressed during zebrafish embryogenesis. Genome Res 22: 577–591. [DOI] [PMC free article] [PubMed] [Google Scholar]
- Raj A, van Oudenaarden A. 2008. Nature, nurture, or chance: stochastic gene expression and its consequences. Cell 135: 216–226. [DOI] [PMC free article] [PubMed] [Google Scholar]
- Raj A, Peskin CS, Tranchina D, Vargas DY, Tyagi S. 2006. Stochastic mRNA synthesis in mammalian cells. PLoS Biol 4: e309. [DOI] [PMC free article] [PubMed] [Google Scholar]
- Raj A, van den Bogaard P, Rifkin SA, van Oudenaarden A, Tyagi S. 2008. Imaging individual mRNA molecules using multiple singly labeled probes. Nat Methods 5: 877–879. [DOI] [PMC free article] [PubMed] [Google Scholar]
- Raser JM, O'Shea EK. 2004. Control of stochasticity in eukaryotic gene expression. Science 304: 1811–1814. [DOI] [PMC free article] [PubMed] [Google Scholar]
- Simpson P. 1997. Notch signalling in development: on equivalence groups and asymmetric developmental potential. Curr Opin Genet Dev 7: 537–542. [DOI] [PubMed] [Google Scholar]
- Stapel LC, Lombardot B, Broaddus C, Kainmueller D, Jug F, Myers EW, Vastenhouw NL. 2016. Automated detection and quantification of single RNAs at cellular resolution in zebrafish embryos. Development 143: 540–546. [DOI] [PubMed] [Google Scholar]
- Vastenhouw NL, Zhang Y, Woods IG, Imam F, Regev A, Liu XS, Rinn J, Schier AF. 2010. Chromatin signature of embryonic pluripotency is established during genome activation. Nature 464: 922–926. [DOI] [PMC free article] [PubMed] [Google Scholar]
- Wernet MF, Mazzoni EO, Çelik A, Duncan DM, Duncan I, Desplan C. 2006. Stochastic spineless expression creates the retinal mosaic for colour vision. Nature 440: 174–180. [DOI] [PMC free article] [PubMed] [Google Scholar]
- Xu H, Sepúlveda LA, Figard L, Sokac AM, Golding I. 2015. Combining protein and mRNA quantification to decipher transcriptional regulation. Nat Methods 12: 739–742. [DOI] [PMC free article] [PubMed] [Google Scholar]
- Zechner C, Ruess J, Krenn P, Pelet S. 2012. Moment-based inference predicts bimodality in transient gene expression. PNAS 109: 8340–8345. [DOI] [PMC free article] [PubMed] [Google Scholar]
- Zeitlinger J, Stark A, Kellis M, Hong J-W, Nechaev S, Adelman K, Levine M, Young RA. 2007. RNA polymerase stalling at developmental control genes in the Drosophila melanogaster embryo. Nat Genet 39: 1512–1516. [DOI] [PMC free article] [PubMed] [Google Scholar]
- Zenklusen D, Larson DR, Singer RH. 2008. Single-RNA counting reveals alternative modes of gene expression in yeast. Nat Struct Mol Biol 15: 1263–1271. [DOI] [PMC free article] [PubMed] [Google Scholar]
- Zhang Y, Vastenhouw NL, Feng J, Fu K, Wang C, Ge Y, Pauli A, van Hummelen P, Schier AF, Liu XS. 2014. Canonical nucleosome organization at promoters forms during genome activation. Genome Res 24: 260–266. [DOI] [PMC free article] [PubMed] [Google Scholar]
- Zopf CJ, Quinn K, Zeidman J, Maheshri N. 2013. Cell-cycle dependence of transcription dominates noise in gene expression. PLoS Comput Biol 9: e1003161. [DOI] [PMC free article] [PubMed] [Google Scholar]
Associated Data
This section collects any data citations, data availability statements, or supplementary materials included in this article.