ABSTRACT
Previously, we reported that when agar is autoclaved with phosphate buffer, hydrogen peroxide (H2O2) is formed in the resulting medium (PT medium), and the colony count on the medium inoculated with environmental samples becomes much lower than that on a medium in which agar and phosphate are autoclaved separately (PS medium) (T. Tanaka et al., Appl Environ Microbiol 80:7659–7666, 2014, https://doi.org/10.1128/AEM.02741-14). However, the physicochemical mechanisms underlying this observation remain largely unknown. Here, we determined the factors affecting H2O2 formation in agar. The H2O2 formation was pH dependent: H2O2 was formed at high concentrations in an alkaline or neutral phosphate buffer but not in an acidic buffer. Ammonium ions enhanced H2O2 formation, implying the involvement of the Maillard reaction catalyzed by phosphate. We found that other gelling agents (e.g., gellan and κ-carrageenan) also produced H2O2 after being autoclaved with phosphate. We then examined the cultivability of microorganisms from a fresh-water sample to test whether catalase and pyruvate, known as H2O2 scavengers, are effective in yielding high colony counts. The colony count on PT medium was only 5.7% of that on PS medium. Catalase treatment effectively restored the colony count of PT medium (to 106% of that on PS medium). In contrast, pyruvate was not as effective as catalase: the colony count on sodium pyruvate-supplemented PT medium was 58% of that on PS medium. Given that both catalase and pyruvate can remove H2O2 from PT medium, these observations indicate that although H2O2 is the main cause of reduced colony count on PT medium, other unknown growth-inhibiting substances that cannot be removed by pyruvate (but can be by catalase) may also be involved.
IMPORTANCE The majority of bacteria in natural environments are recalcitrant to laboratory culture techniques. Previously, we demonstrated that one reason for this is the formation of high H2O2 levels in media prepared by autoclaving agar and phosphate buffer together (PT medium). In this study, we investigated the factors affecting H2O2 formation from agar. H2O2 formation is pH dependent, and ammonium ions promote this phosphate-catalyzed H2O2 formation. Amendment of catalase or pyruvate, a well-known H2O2-scavenging agent, effectively eliminated H2O2. Yet results suggest that growth-inhibiting factor(s) that cannot be eliminated by pyruvate (but can be by catalase) are present in PT medium.
KEYWORDS: cultivability, uncultured bacteria, agar, phosphate, hydrogen peroxide
INTRODUCTION
Agar was introduced in microbiology in the late 19th century as a gelling agent for solid culture media. Since then it has been used routinely for over 120 years. However, most of the microorganisms found in natural environments cannot grow on conventional agar media (1, 2). Although various reasons are thought to contribute to this recalcitrance (2, 3), we have reported that the interaction between agar and phosphate during medium preparation produces hydrogen peroxide (H2O2), which adversely affects the culturability of bacteria on media (4). We compared two methods of medium preparation: the first was autoclaving phosphate buffer and agar together (PT medium), and the second was autoclaving them separately and then mixing them together right before solidification (PS medium). We evaluated the performance of PT and PS media using environmental samples, i.e., soil, sediment, and river water. Results showed that PS medium gave a markedly higher colony count than PT medium. Furthermore, the bacterial diversity obtained using PS medium was more reflective of the original community in a sample than that obtained using PT medium, suggesting that PS medium is more effective than PT medium for isolating a diverse array of bacteria. We found that the amount of H2O2 formed in PT medium is far higher than the amount formed in PS medium; hence, chemically formed H2O2 is detrimental to the cultivation of environmental microorganisms.
H2O2 is one of the reactive oxygen species (ROS) together with superoxides and hydroxyl radicals. ROS cause oxidative stress that can damage cells, and may even be lethal (5). Microorganisms protect themselves against ROS with their detoxification enzymes, e.g., superoxide dismutase, catalase, peroxidases, and others. Through the activity of superoxide dismutase, superoxide is converted to H2O2, which is subsequently decomposed by catalase into nontoxic molecular oxygen and water. In the presence of transition metal ions such as iron(II), short-lived but highly reactive and destructive hydroxyl radicals are generated from H2O2 through Fenton's reaction (5, 6). ROS are not only formed endogenously as inevitable by-products of aerobic metabolism but also formed chemically by autoxidation or photochemical oxidation of liquid media constituents (e.g., sugars, amino acids, and yeast extract) (7–9). In addition to those findings, we reported that autoclaving agar together with phosphate produces H2O2 (4).
H2O2-scavenging agents such as catalase or pyruvate can improve colony count (10–14). However, the effectiveness of catalase and pyruvate varies from sample to sample (15–19), and their H2O2 degradation effect on freshly prepared culture media remains unknown. Also, factors affecting the extent of H2O2 formation depending on physicochemical conditions are not well understood. In this study, we investigated phosphate-catalyzed H2O2 formation from agar and two other representative gelling agents (gellan and κ-carrageenan) commonly used for the cultivation of organisms. We used freshwater samples as inocula to study the effect of scavenging agents (catalase and pyruvate) on H2O2 removal and bacterial colony count.
RESULTS AND DISCUSSION
H2O2 formation in autoclaved gelling agents.
In our previous study, we reported that when agar is autoclaved in phosphate buffer, H2O2 is formed in the resulting agar medium (4). Although agar is the most commonly used solidifying agent in microbiology, gellan and κ-carrageenan are also used in place of agar (20–26). In particular, gellan has been found to be more effective than agar in supporting the growth of hitherto-uncultivated bacteria (20, 25, 26). We therefore evaluated the H2O2 formation from three gelling agents: agar, gellan, and κ-carrageenan. As shown in Fig. 1, gellan and κ-carrageenan also produced H2O2 when autoclaved with phosphate buffer in a phosphate-concentration-dependent manner. For example, at 3 mM phosphate (pH 7), the H2O2 concentrations in Bacto agar, gellan, and κ-carrageenan were 8.5 ± 0.9, 5.5 ± 0.8, and 9.1 ± 1.6 μM, respectively. It appeared that the H2O2 concentration in gellan was slightly lower than the concentrations in agar and κ-carrageenan in the phosphate concentration range tested (0.5 to 30 mM). Separate autoclaving of a gelling agent and phosphate buffer resulted in much lower H2O2 concentrations than did mixed autoclaving: the H2O2 concentrations in agar and gellan were less than 1 μM, whereas they were constantly around 2 μM in κ-carrageenan at all phosphate concentrations tested (3, 10, and 30 mM).
FIG 1.
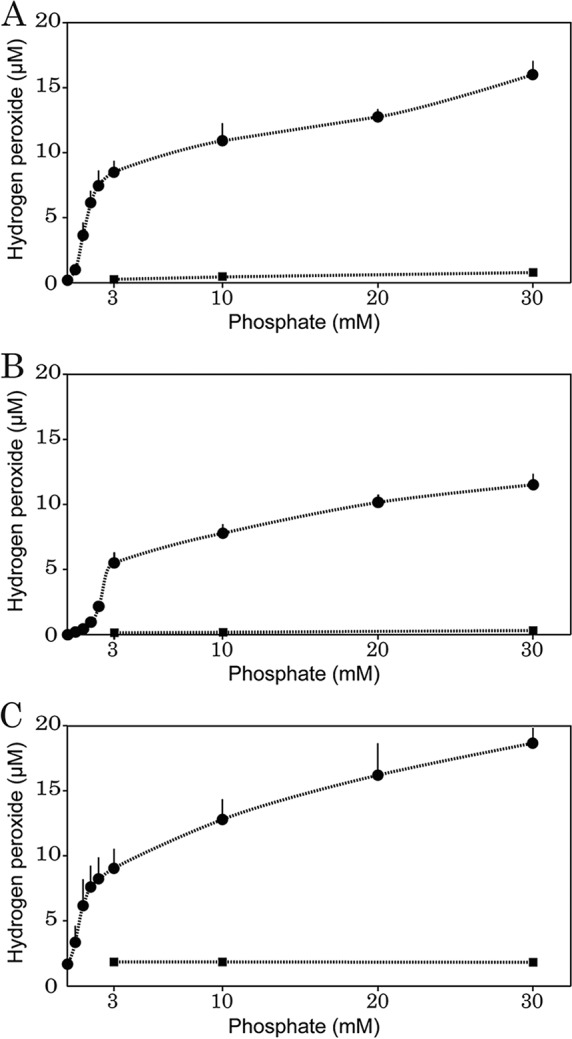
Effect of phosphate concentration on H2O2 formation in autoclaved 1.5% Bacto agar (A), gellan (B), and κ-carrageenan (C). The gelling agent and phosphate buffer (Na2HPO4-KH2PO4 [pH 7.0 ± 0.15]) were autoclaved together (circle) or separately (square). Data are means from five independent experiments ± SD.
We evaluated the effect of autoclaving time on the H2O2 concentration in agar. As shown in Fig. 2, prolonged autoclaving (15 min or 90 min) had no or little effect on the H2O2 concentrations when the phosphate concentration was 0.5 or 3 mM. In contrast, when the phosphate concentration was 20 mM, the H2O2 concentration in agar gel autoclaved for 90 min was 3.9 times higher than that in agar gel autoclaved for 15 min (49.6 ± 9.1 and 12.8 ± 0.6 μM, respectively). H2O2 formation was, therefore, an autoclaving-time-dependent process at relatively high phosphate concentrations.
FIG 2.
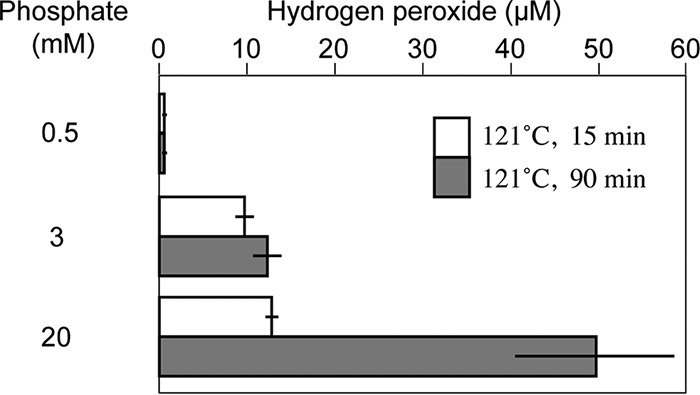
Effect of autoclaving time on H2O2 concentration in autoclaved agar. Bacto agar (15 g liter−1) was autoclaved in 0.5, 3, or 20 mM phosphate buffer (Na2HPO4-KH2PO4 [pH 7.0 ± 0.15]) at 121°C for 15 or 90 min. Data are means from five independent experiments ± SD.
As shown in Fig. 3, H2O2 formation in agar gel was greatly affected by the pH of phosphate buffer; H2O2 was formed at substantially high concentrations when agar was autoclaved with neutral or alkaline phosphate buffer but not when it was autoclaved with acidic phosphate buffer. This result appears to be relevant to the findings reported by Carlsson et al. (7). They demonstrated that H2O2 forms when α-hydroxy carbonyl compounds such as glyceraldehyde or reducing sugars are heated in phosphate buffer, but the formation is pH dependent: H2O2 forms in neutral or alkaline phosphate buffer but not in acidic buffer.
FIG 3.
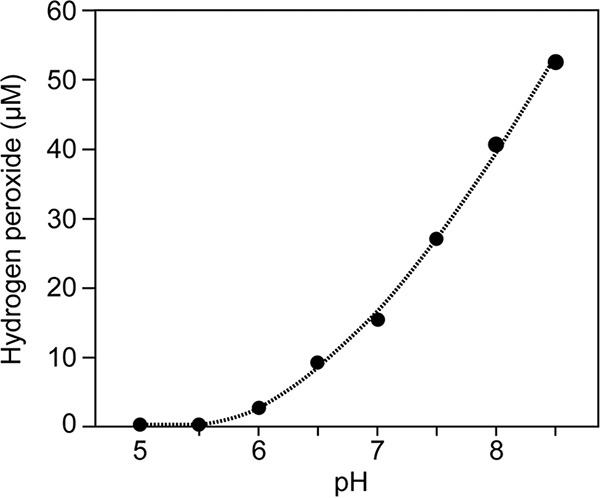
Effect of pH on H2O2 concentration in autoclaved agar. Bacto agar (15 g liter−1) was autoclaved (121°C, 15 min) in 20 mM phosphate buffer (Na2HPO4-KH2PO4) at various pHs.
At least two mechanisms of H2O2 formation from α-hydroxyaldehyde (an α-hydroxy carbonyl compound) are proposed (27). The first mechanism involves the early stages of the Maillard reaction. The Maillard reaction is a complex series of reactions starting with condensation of a carbonyl group of sugars and an amino group of amino compounds. The reaction is important in food processing, because this gives browning and distinctive flavors and textures to foods during the cooking process (28). First, α-hydroxyaldehyde reacts with amino groups to form the Schiff base, followed by an Amadori rearrangement to yield ketoamine (an Amadori product). An enediol intermediate is produced by the enolization of Amadori products. The enediol intermediate is then oxidized by molecular oxygen in the presence of a transition metal such as iron(III), yielding H2O2 and 2,3-dicarbonyl (see Fig. S1 in the supplemental material). It was suggested that phosphate acts as a catalyst for formation of Schiff base or Amadori rearrangement and so increases the rate of the Maillard reaction (29–31).
The second mechanism is related to the autoxidation of α-hydroxyaldehyde, in which no amino compounds are required. The enolization of free α-hydroxyaldehyde compounds is the first step, and the subsequent reactions, which yield H2O2 and 1,2-dicarbonyl in the presence of a transition metal, are similar to those involved in the first mechanism (Fig. S1). It was reported that buffer ions affect the rate of autoxidation of α-hydroxyaldehyde: among HEPES, Tris-HCl, and phosphate buffer, phosphate buffer exhibits the highest autoxidation rate (32). Although the basis for this buffer effect has not been provided yet, it has been reported that phosphate ion catalyzes the degradation of 1,2-dicarbonyl, presumably via a 1,3-cyclic phosphate intermediate (33). Therefore, it is possible that phosphate can accelerate the rate of autoxidation of α-hydroxyaldehyde and H2O2 formation by scavenging 1,2-dicarbonyl from the consecutive reaction, thereby shifting the reaction equilibrium toward the production of 1,2-dicarbonyl (Fig. S1).
Although there is no direct evidence that phosphate is involved in H2O2 formation from these gelling agents by the mechanisms described above, we found that these gelling agents contain a reducing substance(s), as described below.
Presence of reducing moieties in autoclaved gels.
Agar and κ-carrageenan are polysaccharides extracted from certain red algae. Agar is a complex mixture of galactan polysaccharides which basically consists of neutral agarose and charged polysaccharides (34). The latter is collectively called agaropectin. κ-Carrageenan is a straight-chain sulfated galactan polysaccharide (35). Agar and κ-carrageenan basically do not have an α-hydroxy carbonyl moiety in their structure, except for their extreme terminus. Gellan is produced by the bacterium Sphingomonas elodea and is a linear polysaccharide with tetrasaccharide-repeating units that consist of two molecules of d-glucose, d-glucuronate, and d-rhamnose. Native gellan produced by the bacterium has l-glyceryl and l-acetyl groups at O(2) and O(6) of a 3-linked d-glucose molecule in a unit, respectively (36). Consequently, native gellan has the α-hydroxy carbonyl moiety on its 3-linked d-glucose molecule. Although l-glyceryl and l-acetyl groups are removed (deacylated) by alkaline treatment in the commercial production of gellan, the degree of deacylation varies depending on the treatment conditions (37). Therefore, it is very likely that commercial gellan has the α-hydroxy carbonyl moiety.
We speculated that the decomposed products from a gelling agent, impurities in a gelling agent, or the gelling agent itself contains α-hydroxyaldehyde; thus, H2O2 is very likely to be generated by the mechanisms mentioned above (i.e., the Maillard reaction or autoxidation). We examined the presence of reducing compounds (α-hydroxy ketone or α-hydroxy aldehyde) in the fluid extracted from agar, gellan, and κ-carrageenan gels that were each prepared by autoclaving in phosphate buffer (pH 6, 7, or 8) or water. As a result, all samples were found to be positive for reducing compounds in Fehling's test (visible red Cu2O precipitate after centrifugation; see Fig. S2 in the supplemental material). Although agar is readily hydrolyzed under acidic conditions (34), our observations clearly show that autoclaved agar contains reducing compounds, which can be the substrates of the Maillard reaction or autoxidation, regardless of the pH of the medium. Furthermore, agar is not free from iron, which catalyzes oxidation of enediol, yielding H2O2 and dicarbonyl (Fig. S1). According to the manufacturer's manual, the typical iron content of Bacto agar is 0.002% (38). This is equivalent to 5.4 μM iron in 15 g liter−1 agar gel, and seems high enough for iron to act as a catalyst.
Effect of ammonium ions.
Figure 4 shows the effect of ammonium ions on H2O2 formation from agar. In the presence of phosphate buffer, the H2O2 concentration increased with increasing ammonium ion concentrations. Since we detected reducing compounds (α-hydroxy ketone or α-hydroxy aldehyde) in autoclaved agar, as mentioned above, this finding implies that the Maillard reaction between ammonium and reducing compounds occurs during autoclaving. In contrast, in the absence of phosphate buffer, the H2O2 concentrations were low (<0.2 μM) in the ammonium ion concentration range tested, clearly showing that phosphate acts as a catalyst in the reaction. Even when no exogenous ammonium ion was added (0 mM ammonium salt), phosphate-buffered autoclaved agar gel contained 12.8 ± 0.6 μM H2O2. This basal H2O2 formation may be explained by the autoxidation of α-hydroxyaldehyde, in which no amino compounds are involved (Fig. S1).
FIG 4.
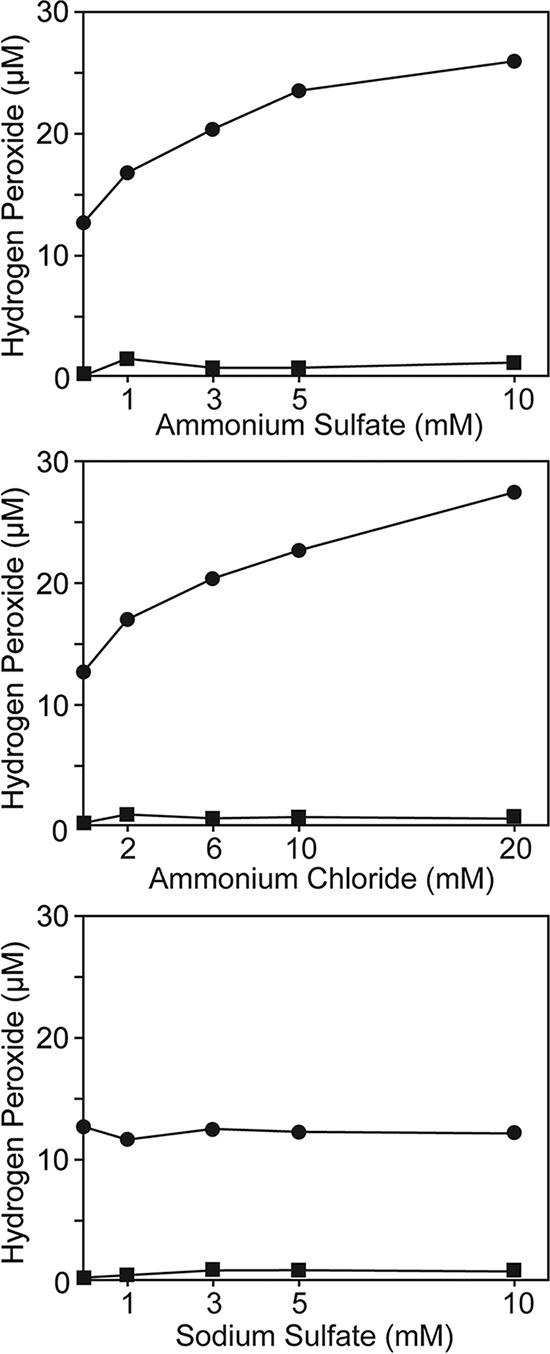
Effect of ammonium ions on H2O2 concentration in autoclaved agar. Bacto agar (15 g liter−1) was autoclaved in ammonium sulfate, ammonium chloride, or sodium sulfate solution with (circle) or without (square) 20 mM phosphate buffer (Na2HPO4-KH2PO4) at 121°C for 15 min. The final pH of solutions was between 6.8 and 7.0 (data not shown). The results in the case of using sodium sulfate as the non-ammonium salt are shown for comparison.
H2O2 concentration in agar media.
We evaluated the H2O2 concentrations in agar media rather than in plain agar gel. The PS and PT media contained 20 mM phosphate buffer and 2.27 mM ammonium sulfate. Figure 5 shows the H2O2 concentrations in these media. As can be expected from the results of plain agar gel (Fig. 1 and 4), the H2O2 concentrations in PS medium were low (<1 μM) and those in PT medium were much higher (29.4 ± 2.9 μM, mean ± SD from three experiments). Furthermore, the H2O2 concentration in PT medium was twice as high as the concentration in plain agar gel that was autoclaved with 20 mM phosphate buffer (12.8 ± 0.6 μM, Fig. 4), clearly showing the effect of the ammonium ion.
FIG 5.
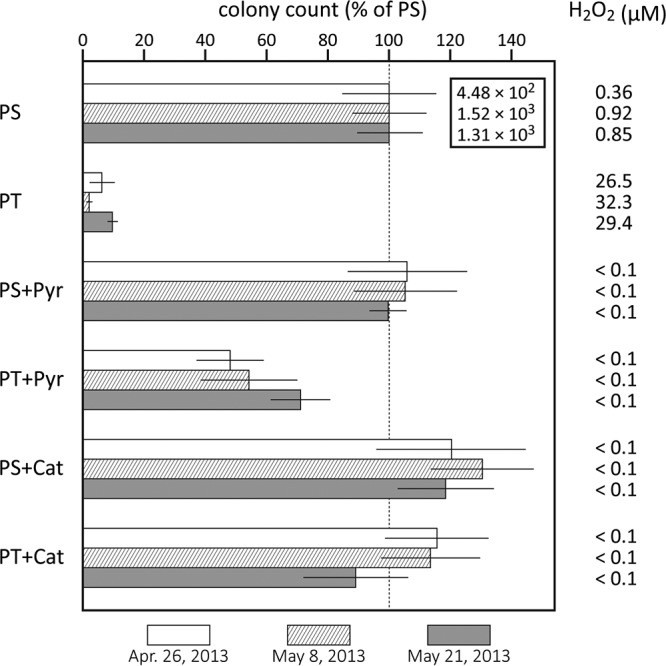
H2O2 concentration in and colony count on various agar media. Colony counts are normalized to the count obtained on PS medium (100%). The average of at least eight plates is shown with standard deviation. CFU (per ml) on PS medium are shown in the inset.
Effect of catalase and pyruvate on colony count.
The effect of H2O2-scavenging agents on the H2O2 concentrations in agar media was evaluated (Fig. 5). Both catalase treatment and sodium pyruvate supplementation effectively degraded H2O2 in PT medium (and also in PS medium). The H2O2 concentrations in the following media were lower than the detection limit (<0.1 μM): PT+Cat (catalase-treated PT medium), PS+Cat (catalase-treated PS medium), PT+Pyr (pyruvate-supplemented PT medium), and PS+Pyr (pyruvate-supplemented PS medium).
We compared the colony count on PT and PS media and their catalase-treated and sodium pyruvate-supplemented derivatives using lake freshwater samples. As shown in Fig. 5, the plate counts on PT medium were significantly lower (P < 0.01 in all three experiments) than those on PS medium (6.1, 1.8, and 9.3% of those on PS medium). This finding is consistent with our previous results, in which soil, sediment, and river water samples were tested (4), although a more marked difference in colony count between PT and PS media was observed here. The colony counts of PT+Cat medium were comparable to those of PS medium (115, 113, and 89% of those on PS medium). Thus, it has been proven that the low colony count on PT medium is attributable to H2O2 formed in agar. The colony counts on PT+Pyr medium were, however, contrary to our expectations. They were only 48, 54, and 71% of that on PS medium (P < 0.01), in spite of the fact that the H2O2 concentration in the medium was lower than the detection limit (0.1 μM). It seemed that sodium pyruvate itself has no inhibitory effect on colony formation at a concentration of 0.3 g liter−1 (2.7 mM), considering the finding that the counts on PS+Pyr medium were comparable to those on PS medium (Fig. 5).
The enhancing effect of sodium pyruvate and catalase on the cultivability of stressed or injured bacteria has been repeatedly reported (e.g., references 10 to 14). These compounds scavenge H2O2 in the media: sodium pyruvate reacts with H2O2 to produce acetic acid, CO2, and H2O (39), and catalase decomposes H2O2 to O2 and H2O through its enzymatic activity. There are several publications in which catalase- and pyruvate-amended agar media were compared in terms of the colony count of bacteria (15–19). From the data provided in those publications, it is likely that catalase and sodium pyruvate are not always equally effective for the colony formation of bacteria. One study showed that catalase was more effective than sodium pyruvate (18), but the opposite was shown in other studies (15, 17). Since none of these studies measured the H2O2 concentration in the agar media used, it remains unknown whether the difference in colony counts between catalase- and sodium pyruvate-amended media is associated with H2O2 concentration. Our results showed that there were significant differences in colony count between PT+Pyr and PT+Cat media even though both media contained no detectable H2O2 (<0.1 μM).
It was possible, however, that constituents in the medium (i.e., glucose, peptone, and yeast extract) were oxidized during cultivation with the consequent formation of H2O2. Therefore, we monitored the H2O2 concentration in these agar media incubated under dark conditions. As a result, the H2O2 concentrations in both PT+Pyr and PT+Cat media were not higher than the detection limit throughout the incubation period (11 days; see Fig. S3). Hence, we concluded that the difference in colony count between PT+Cat and PT+Pyr media was not the result of the difference in H2O2 concentrations between the culture media. A substance (or substances) in PT medium other than H2O2 that adversely affects the cultivability of bacteria remains unknown. Although further study is required, a growth-inhibiting substance(s) that can be degraded by catalase but not by pyruvate might be present in PT medium. Indeed, catalase can oxidize various organic compounds such as phenols, alcohols, formaldehyde, and formate through its peroxidative activity utilizing H2O2 or alkyl hydrogen peroxide as an electron acceptor (40–42). Our present study will provide deeper insights into the pitfalls of solidified medium preparation to isolate or cultivate previously uncultured microorganisms.
MATERIALS AND METHODS
Quantification of H2O2 in autoclaved gelling agents.
Bacto agar (Becton, Dickinson and Company [BD], Franklin Lakes, NJ), gellan (gellan gum for plant tissue culture; Wako Pure Chemical Industries, Osaka, Japan), and κ-carrageenan (Wako) were tested. The autoclaved gelling agents (15 g liter−1) were prepared by two different procedures. First, the gelling agent was suspended in phosphate buffer of various concentrations (0.5 to 30 mM, Na2HPO4-KH2PO4 [pH 7.0 ± 0.15]) or pure water and then autoclaved. Second, the gelling agent was suspended in pure water and autoclaved, and then appropriate volumes of 50 mM phosphate buffer (Na2HPO4-KH2PO4 [pH 6.8]) were added to give final phosphate concentrations of 3, 10, and 30 mM. Sodium chloride was included at a concentration of 0.1 M for gellan and κ-carrageenan to promote gelation. The concentrations of H2O2 in autoclaved gelling agents were determined as described previously (4). Briefly, gels were frozen and thawed, and then fluid from syneresis was used for analysis.
Detection of aldehydes or α-hydroxy ketones in autoclaved gelling agents.
Bacto agar (1.5%) was autoclaved in 20 mM phosphate buffer (Na2HPO4-KH2PO4 [pH 6, 7, or 8]) or in water for 15 min at 121°C. Each gellan (1.5%) and κ-carrageenan (1.5%) gel was autoclaved in 20 mM phosphate buffer (Na2HPO4-KH2PO4) supplemented with 0.1 M NaCl (pH 6, 7, or 8) or in 0.1 M NaCl for 15 min at 121°C. The resulting gels were frozen and thawed, and then the fluid from syneresis was filtered to remove gel debris.
Filtrates (40 ml) were freeze-dried and then dissolved in 8 ml of water. Solutions (1 ml) were tested for the presence of aldehydes or α-hydroxy ketones using Fehling's solution (43).
Culture media.
The PT and PS media have an identical composition but differ in the preparation procedure (4): PT medium was prepared by autoclaving agar and phosphate together, and PS medium was prepared by autoclaving them separately (Fig. 6). The medium constituents were grouped into two (PT medium) or three (PS medium) solutions. Each group was autoclaved (15 min at 121°C) individually and then mixed prior to being poured into a petri dish. Peptone-yeast extract-glucose (PYG; 100× strength) contained 10 g liter−1 each of Bacto peptone (BD), Bacto yeast extract (BD), and glucose. PYG was autoclaved separately from other constituents to prevent glucose from reacting with phosphate during autoclaving (44). A solution of salts (100× strength) contained 227 mM (NH4)2SO4, 20 mM MgSO4, and 4.5 mM CaCl2 and was autoclaved with agar. Phosphate buffer (10× strength [pH 6.8]) consisted of 100 mM (each) KH2PO4 and Na2HPO4 · 12H2O. The sodium pyruvate-supplemented media (PT+Pyr and PS+Pyr) were prepared using the same methods used for PT and PS media, respectively, except that 0.3 g liter−1 sodium pyruvate was added to an agar suspension prior to autoclaving (see Fig. S4 in the supplemental material). The catalase-treated media (PT+Cat and PS+Cat) were prepared using the same methods used for PT and PS media, respectively, except that 1 ml (per liter) of filter-sterilized bovine liver catalase (2 mg ml−1; dissolved in 10 mM phosphate buffer [Na2HPO4-KH2PO4], pH 7.0) was added to autoclaved medium that had been cooled to 42°C (Fig. S4).
FIG 6.
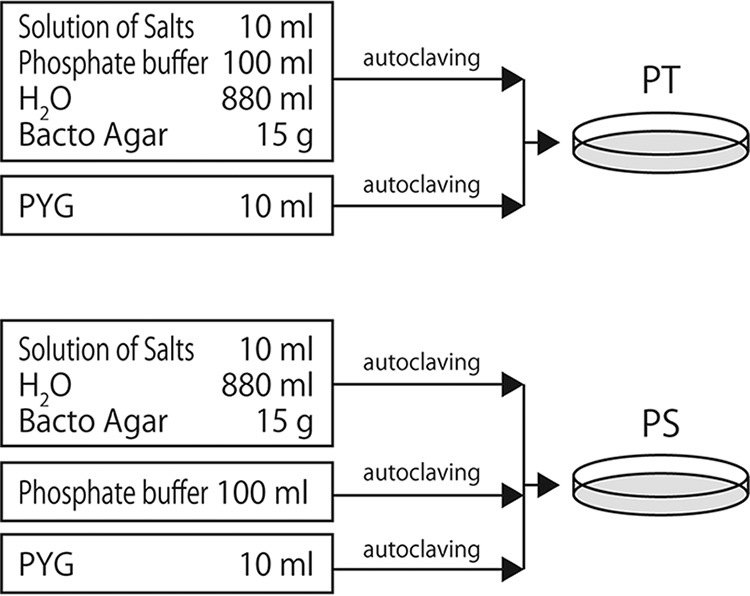
Preparation procedure of PT and PS agar media. The constituent groups (indicated in boxes) were autoclaved separately at 121°C for 15 min and then mixed together. See Fig. S4 in the supplemental material for the preparation procedures of various other media.
All plates were allowed to sit at room temperature in the dark overnight prior to use. Sodium pyruvate and bovine liver catalase (11,900 U mg−1) were obtained from Wako Pure Chemical Industries. The H2O2 concentrations in agar media were determined as described previously (4).
Water sample collection and culture.
Lake Shikotsu is an oligotrophic freshwater lake located in Hokkaido Prefecture, Japan. The water samples were collected at the shore of the lake (42°47′53.5″N, 141°19′33.5″E) on April 26, May 8, and May 22, 2013, and had temperatures of 3.2, 8.2, and 10.2°C, respectively. The samples were collected in sterile bottles and transported to the laboratory on ice within 2 h after sampling. They were then filtered through 10-μm-pore-size membrane filters to remove coarse particles. Aliquots of filtrate (100 μl) were spread onto agar plates (9-cm diameter) without dilution and incubated at 20°C in the dark for 11 days.
Supplementary Material
Footnotes
Supplemental material for this article may be found at https://doi.org/10.1128/AEM.01366-17.
REFERENCES
- 1.Amann RI, Ludwig W, Schleifer KH. 1995. Phylogenetic identification and in situ detection of individual microbial cells without cultivation. Microbiol Rev 59:143–169. [DOI] [PMC free article] [PubMed] [Google Scholar]
- 2.Vartoukian SR, Palmer RM, Wade WG. 2010. Strategies for culture of ‘unculturable’ bacteria. FEMS Microbiol Lett 309:1–7. doi: 10.1111/j.1574-6968.2010.02000.x. [DOI] [PubMed] [Google Scholar]
- 3.Puspita ID, Kamagata Y, Tanaka M, Asano K, Nakatsu CH. 2012. Are uncultivated bacteria really uncultivable? Microbes Environ 27:356–366. doi: 10.1264/jsme2.ME12092. [DOI] [PMC free article] [PubMed] [Google Scholar]
- 4.Tanaka T, Kawasaki K, Daimon S, Kitagawa W, Tamaki H, Tanaka M, Nakatsu CH, Kamagata Y. 2014. A hidden pitfall in agar media preparation undermines culturability of microorganisms. Appl Environ Microbiol 80:7659–7666. doi: 10.1128/AEM.02741-14. [DOI] [PMC free article] [PubMed] [Google Scholar]
- 5.Imlay JA. 2013. The molecular mechanisms and physiological consequences of oxidative stress: lessons from a model bacterium. Nat Rev Microbiol 11:443–454. doi: 10.1038/nrmicro3032. [DOI] [PMC free article] [PubMed] [Google Scholar]
- 6.Winterbourn CC. 1995. Toxicity of iron and hydrogen peroxide: the Fenton reaction. Toxicol Lett 82-83:969–974. doi: 10.1016/0378-4274(95)03532-X. [DOI] [PubMed] [Google Scholar]
- 7.Carlsson J, Nyberg G, Wrethén J. 1978. Hydrogen peroxide and superoxide radical formation in anaerobic broth media exposed to atmospheric oxygen. Appl Environ Microbiol 36:223–229. [DOI] [PMC free article] [PubMed] [Google Scholar]
- 8.Carlsson J, Granberg GPD, Nyberg GK, Edlund MK. 1979. Bactericidal effect of cysteine exposed to atmospheric oxygen. Appl Environ Microbiol 37:383–390. [DOI] [PMC free article] [PubMed] [Google Scholar]
- 9.Hoffman PS, Pine L, Bell S. 1983. Production of superoxide and hydrogen peroxide in medium used to culture Legionella pneumophila: catalytic decomposition by charcoal. Appl Environ Microbiol 45:784–791. [DOI] [PMC free article] [PubMed] [Google Scholar]
- 10.Martin SE, Flowers RS, Ordal ZJ. 1976. Catalase: its effect on microbial enumeration. Appl Environ Microbiol 32:731–734. [DOI] [PMC free article] [PubMed] [Google Scholar]
- 11.Harmon SM, Kautter DA. 1976. Beneficial effect of catalase treatment on growth of Clostridium perfringens. Appl Environ Microbiol 32:409–416. [DOI] [PMC free article] [PubMed] [Google Scholar]
- 12.Flowers RS, Martin SE, Brewer DG, Ordal ZJ. 1977. Catalase and enumeration of stressed Staphylococcus aureus cells. Appl Environ Microbiol 33:1112–1117. [DOI] [PMC free article] [PubMed] [Google Scholar]
- 13.Rayman MK, Aris B, El Derea HB. 1978. The effect of compounds which degrade hydrogen peroxide on the enumeration of heat-stressed cells of Salmonella senftenberg. Can J Microbiol 24:883–885. doi: 10.1139/m78-146. [DOI] [PubMed] [Google Scholar]
- 14.Imazaki I, Kobori Y. 2010. Improving the culturability of freshwater bacteria using FW70, a low-nutrient solid medium amended with sodium pyruvate. Can J Microbiol 56:333–341. doi: 10.1139/W10-019. [DOI] [PubMed] [Google Scholar]
- 15.McDonald LC, Hackney CR, Ray B. 1983. Enhanced recovery of injured Escherichia coli by compounds that degrade hydrogen peroxide or block its formation. Appl Environ Microbiol 45:360–365. [DOI] [PMC free article] [PubMed] [Google Scholar]
- 16.Calabrese JP, Bissonnette GK. 1990. Improved membrane filtration method incorporating catalase and sodium pyruvate for detection of chlorine-stressed coliform bacteria. Appl Environ Microbiol 56:3558–3564. [DOI] [PMC free article] [PubMed] [Google Scholar]
- 17.Calabrese JP, Bissonnette GK. 1990. Improved detection of acid mine water stressed coliform bacteria on media containing catalase and sodium pyruvate. Can J Microbiol 36:544–550. doi: 10.1139/m90-095. [DOI] [PubMed] [Google Scholar]
- 18.Mizunoe Y, Wai SN, Takade A, Yoshida S. 1999. Restoration of culturability of starvation-stressed and low-temperature-stressed Escherichia coli O157 cells by using H2O2-degrading compounds. Arch Microbiol 172:63–67. doi: 10.1007/s002030050741. [DOI] [PubMed] [Google Scholar]
- 19.Olson JB, Lord CC, McCarthy PJ. 2000. Improved recoverability of microbial colonies from marine sponge samples. Microb Ecol 40:139–147. doi: 10.1007/s002480000058. [DOI] [PubMed] [Google Scholar]
- 20.Tamaki H, Hanada S, Sekiguchi Y, Tanaka Y, Kamagata Y. 2009. Effect of gelling agent on colony formation in solid cultivation of microbial community in lake sediment. Environ Microbiol 11:1827–1834. doi: 10.1111/j.1462-2920.2009.01907.x. [DOI] [PubMed] [Google Scholar]
- 21.Abbott IA, Chapman FA. 1981. Evaluation of kappa carrageenan as a substitute for agar in microbiological media. Arch Microbiol 128:355–359. doi: 10.1007/BF00405912. [DOI] [PubMed] [Google Scholar]
- 22.Shungu D, Valiant M, Tutlane V, Weinberg E, Weissberger B, Koupal L, Gadebusch H, Stapley E. 1983. GELRITE as an agar substitute in bacteriological media. Appl Environ Microbiol 46:840–845. [DOI] [PMC free article] [PubMed] [Google Scholar]
- 23.Lin CC, Casida LE. 1984. GELRITE as a gelling agent in media for the growth of thermophilic microorganisms. Appl Environ Microbiol 47:427–429. [DOI] [PMC free article] [PubMed] [Google Scholar]
- 24.Harris JE. 1985. GELRITE as an agar substitute for the cultivation of mesophilic Methanobacterium and Methanobrevibacter species. Appl Environ Microbiol 50:1107–1109. [DOI] [PMC free article] [PubMed] [Google Scholar]
- 25.Janssen PH, Yates PS, Grinton BE, Taylor PM, Sait M. 2002. Improved culturability of soil bacteria and isolation in pure culture of novel members of the divisions Acidobacteria, Actinobacteria, Proteobacteria, and Verrucomicrobia. Appl Environ Microbiol 68:2391–2396. doi: 10.1128/AEM.68.5.2391-2396.2002. [DOI] [PMC free article] [PubMed] [Google Scholar]
- 26.Tamaki H, Sekiguchi Y, Hanada S, Nakamura K, Nomura N, Matsumura M, Kamagata Y. 2005. Comparative analysis of bacterial diversity in freshwater sediment of a shallow eutrophic lake by molecular and improved cultivation-based techniques. Appl Environ Microbiol 71:2162–2169. doi: 10.1128/AEM.71.4.2162-2169.2005. [DOI] [PMC free article] [PubMed] [Google Scholar]
- 27.Hunt JV, Bottoms MA, Mitchinson MJ. 1993. Oxidative alterations in the experimental glycation model of diabetes mellitus are due to protein-glucose adduct oxidation. Biochem J 291:529–535. doi: 10.1042/bj2910529. [DOI] [PMC free article] [PubMed] [Google Scholar]
- 28.Hellwig M, Henle T. 2014. Baking, ageing, diabetes: a short history of the Maillard reaction. Angew Chem Int Ed Engl 53:10316–10329. doi: 10.1002/anie.201308808. [DOI] [PubMed] [Google Scholar]
- 29.Potman RP, van Wijk TA. 1989. Mechanistic studies of the Maillard reaction with emphasis on phosphate-mediated catalysis, p 182–195. In Parliment TH, McGorrin RJ, Ho CT (ed), Thermal generation of aromas. ACS Symposium Series. American Chemical Society, Washington, DC. doi: 10.1021/bk-1989-0409.ch017. [DOI] [Google Scholar]
- 30.Bell LN. 1997. Maillard reaction as influenced by buffer type and concentration. Food Chem 59:143–147. doi: 10.1016/S0308-8146(96)00257-9. [DOI] [Google Scholar]
- 31.Watkins NG, Neglia-Fischer CI, Dyer DG, Thorpe SR, Baynes JW. 1987. Effect of phosphate on the kinetics and specificity of glycation of protein. J Biol Chem 262:7207–7212. [PubMed] [Google Scholar]
- 32.Thornalley P, Wolff S, Crabbe J, Stern A. 1984. The autoxidation of glyceraldehyde and other simple monosaccharides under physiological conditions catalysed by buffer ions. Biochim Biophys Acta 797:276–287. doi: 10.1016/0304-4165(84)90131-4. [DOI] [PubMed] [Google Scholar]
- 33.Zhang W, Serianni AS. 2012. Phosphate-catalyzed degradation of D-glucosone in aqueous solution is accompanied by C1–C2 transposition. J Am Chem Soc 134:11511–11524. doi: 10.1021/ja3020296. [DOI] [PubMed] [Google Scholar]
- 34.Armisén R, Galatas F. 1987. Production, properties and uses of agar, p 1–58. In McHugh DJ. (ed), Production and utilization of products from commercial seaweeds. FAO Fisheries Technical Paper 288. Food and Agricultural Organization of the United Nations, Rome, Italy. [Google Scholar]
- 35.Stanley N. 1987. Production, properties and uses of carrageenan, p 116–146. In McHugh DJ. (ed), Production and utilization of products from commercial seaweed. FAO Fisheries Technical Paper 288. Food and Agricultural Organization of the United Nations, Rome, Italy. [Google Scholar]
- 36.Morris ER, Nishinari K, Rinaudo M. 2012. Gelation of gellan – a review. Food Hydrocoll 28:373–411. doi: 10.1016/j.foodhyd.2012.01.004. [DOI] [Google Scholar]
- 37.Chang HC, Kobzeff JM. March 1993. High-glyceryl, low-acetyl gellan gum for non-brittle gels. US patent 5,190,927.
- 38.Becton Dickinson and Company. 2009. Difco & BBL Manual, manual of microbiological culture media, 2nd edition Becton, Dickinson and Company, Sparks, MD. [Google Scholar]
- 39.Bunton CA. 1949. Oxidation of α-diketones and α-keto-acids by hydrogen peroxide. Nature 163:444. doi: 10.1038/163444a0.18115097 [DOI] [Google Scholar]
- 40.Chance B. 1948. The enzyme-substrate compounds of catalase and peroxides. Nature 161:914–917. doi: 10.1038/161914a0. [DOI] [PubMed] [Google Scholar]
- 41.Chance B. 1950. On the reaction of catalase peroxides with acceptors. J Biol Chem 182:649–658. [Google Scholar]
- 42.Sichak SP, Dounce AL. 1986. Analysis of the peroxidatic mode of action of catalase. Arch Biochem Biophys 249:286–295. doi: 10.1016/0003-9861(86)90004-4. [DOI] [PubMed] [Google Scholar]
- 43.Scales FM. 1915. The determination of reducing sugars: a volumetric method for determining cuprous oxide without removal from Fehling's solution. J Biol Chem 23:81–87. [Google Scholar]
- 44.Finkelstein RA, Lankford CE. 1957. A bacteriotoxic substance in autoclaved culture media containing glucose and phosphate. Appl Microbiol 5:74–79. [DOI] [PMC free article] [PubMed] [Google Scholar]
Associated Data
This section collects any data citations, data availability statements, or supplementary materials included in this article.


