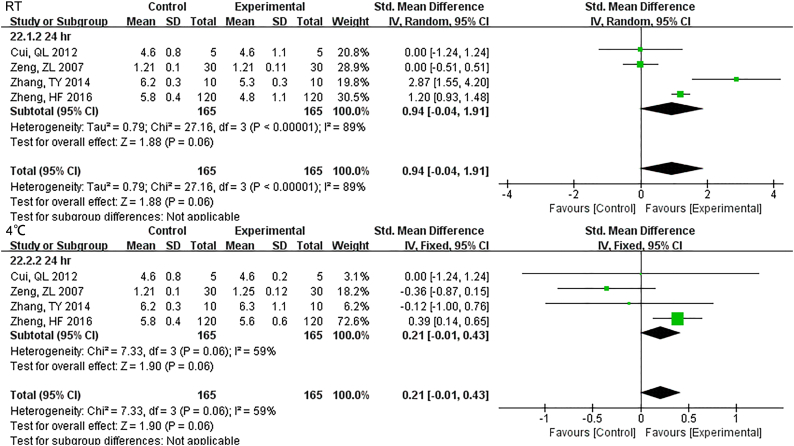
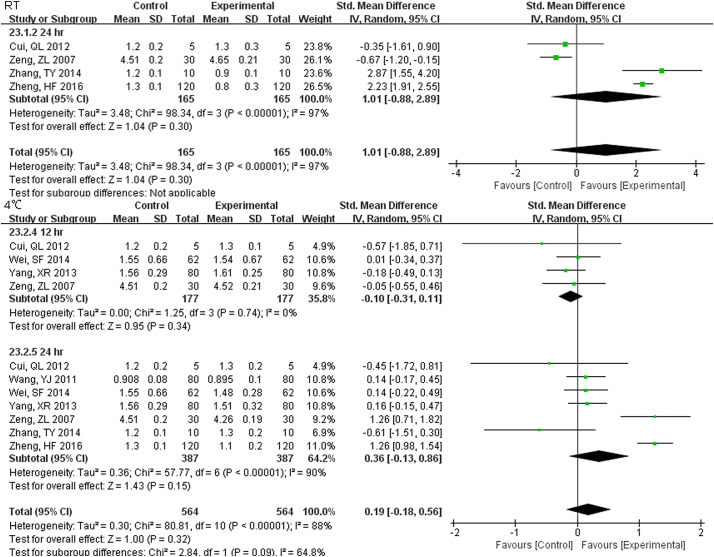
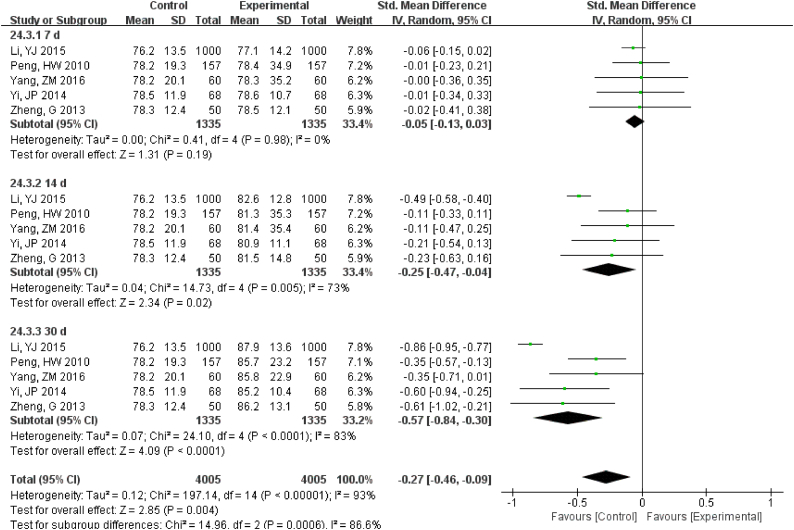
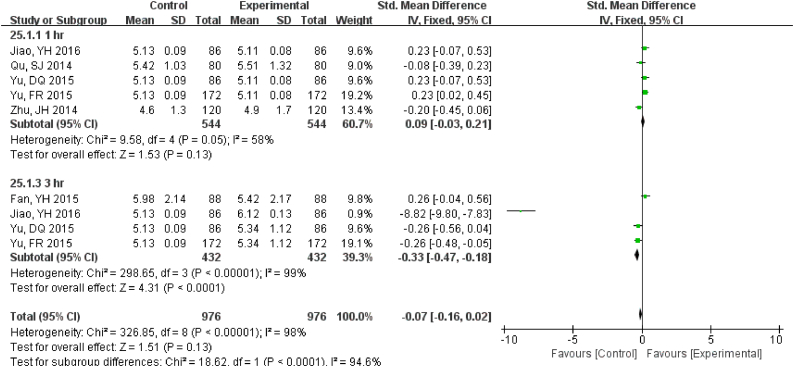
Abstract
Objective
To assess the effect of storage time and temperature on complete blood count (CBC) and comprehensive metabolic panel (CMP) testing.
Methods
PubMed, EMBASE, the Cochrane Library of Systematic Reviews, Web of Science (WOS), China National Knowledge Infrastructure (CNKI), WanFang databases and SinoMed databases were searched up to May 2017. Clinical trials with adult whole blood samples were identified. Paired reviewers independently screened, extracted data and evaluated the quality of evidence (MINORS tool). Analyses were conducted using Revman 5.3 and Stata 14.0.
Results
A total of 89 studies were confirmed. For CBC, except MPV, most parameters were stable at least for 24 h. Some indices, such as WBC, PLt, HCT, HGB and MCH were stable up to 3 d. However, stable CMP test results could only be acquired within 12 h. at 4 °C, including GLU, AST, ALT, Na, ALB, Cl, DBIL, TC, TG and ALP. Values were less stable when stored at RT.
Conclusions
Specimens stored > 12 h. for CMP may generate unreliable results. For CBC, samples could reliably be stored for 24 h. For longer storage, refrigeration (at 4 °C) would be a better choice.
Keywords: Blood sample storage, Complete blood count (CBC), Comprehensive metabolic panel (CMP) testing, Meta-analysis
Highlights
-
•
For CMP, > 12 h. storage generate unreliable results.
-
•
For CBC, samples could reliably be stored for 24 h.
-
•
For longer storage, 4 °C would be a better choice.
Blood tests are the most common laboratory tests giving basic and valuable information. But in most cases, we cannot analysis immediately, so how and how long can we keep samples to get reliable results need to be known for both laboratory staffs and clinicians. As shown in our results, complete blood count results are more stable than comprehensive metabolic panel testing and can get reliable results even 24 h. storage; the advantages of refrigerator store (4 °C) are clear for longer storage. We think this could help standardize blood samples storage and get reliable test results.
1. Introduction
Delayed sample analysis for organizational, technical reasons or questionable results that need to be verified are not rare in clinical practice (Lippi and Simundic, 2012). Besides, the reorganization of laboratory services around the globe entails the consolidation of small laboratories into larger facilities in the era of new public health initiatives. A large number of specimens are dispatched from peripheral centers to a centralized laboratory over long distances where a delay of 12–24 h or more occurred. Moreover, at weekends, this interval may exceed 36 h due to closure of the laboratory (Lippi and Simundic, 2012). The significant delay and poor storage specimens could lead to imprecise, inaccurate and unreliable results (Briggs et al., 2014; Imeri et al., 2008; Zini, 2014) which adversely affect clinical decisions ultimately (Zandecki et al., 2007).
Complete blood count (CBC) and comprehensive metabolic panel (CMP) testing are the most routinely done laboratory tests giving basic and valuable information not only in facilitating the diagnosis and directing further testing but also in monitoring the patient(Plebani and Lippi, 2010). This is especially true for those who need transfusion. Since blood tests are commoner than testing other biological fluids, it is important to determine the suitable temperature and duration of storage (Mosca et al., 2009). Various articles focusing on this have been published, but results are often contradictory which could be a result of differences in sample sizes and other factors, such as the different analyzers. Unfortunately, evidence-based confirmation by large-scale clinical trials is still lacking. Therefore, we conducted this meta-analysis to quantitatively inspect the influence of storage time and temperature on CBC and CMP testing.
2. Materials and Methods
This review is reported according to Preferred Reporting Items for Systematic Reviews statement for reporting systematic reviews and meta-analyses (Moher et al., 2009).
2.1. Data Sources and Searches
PubMed, EMBASE, the Cochrane Library of Systematic Reviews, Web of Science, China National Knowledge Infrastructure, WanFang databases and SinoMed databases were searched by using different combinations of free text and database specific index terms related to the topics (Appendix 1.). The studies were not restricted by date, language, or publication status. The following combined search term was used: (Storage, store, cryopreservation), (complete blood count, CBC, Hemogram) AND (Comprehensive Metabolic Pane, CMP, Chemistry Panel, chemistry Screen).
2.2. Study Selection
Titles, abstracts, and full-text articles were screened independently by 2 reviewers, with discrepancies discussed with the research group. We used the following inclusion criteria:
-
1)
Published or unpublished clinical trials in English or Chinese with the full text available;
-
2)
Analysis were performed at once (0 h.);
-
3)
Sample was anticoagulated whole blood without any pretreatment (residual leucocyte, PAS, Pathogen reduction, etc);
-
4)
Sample was stored under − 20 °C, 4 °C, or RT;
-
5)
Participants were adults.
And criteria for excluding studies were:
-
1)
No data in humans
-
2)
No original research (reviews, editorials, non-research letters, protocols)
-
3)
Sample was stored in open container;
2.3. Data Extraction
Paired reviewers independently and in duplicate screened full texts for eligible articles, extracted data from each eligible study and assessed the quality of evidence using MINORS tool. Discrepancies were reconciled after discussion. For each eligible study, information on baseline population characteristics was retrieved, including location, cases, sex and age distribution, collection volume and storage condition. If information was present only in figures, we planned to contact authors.
2.4. Outcome Measures
When 4 or more studies assessed the same outcome, it will be included. The final included CBC outcomes were WBC, PLt, MPV, RBC, HGB, MCHC, RDW, HCT, MCV, MCH. CMP outcomes were GLU, K, Na, Cl, LDH, AST, ALT, TP, ALB, TBIL, DBIL, TC, TG, Cr, BUN, ALP.
2.5. Statistical Analysis
Meta-analyses were conducted with the software Revman 5.3 and Stata 14.0. Studies were pooled within outcome measures, and standardized mean difference (SMD) and 95% CIs were constructed using fixed- or random-effects meta-analysis. Random effects were presented given the heterogeneity among studies where I2 statistic > 50% (Higgins et al., 2003). Sensitive analysis was also performed to evaluate the influences of individual studies on the final effect. The Begg rank correlation (Begg and Mazumdar, 1994) and Egger regression asymmetry test (Egger et al., 1997) were used to examine publication bias. If publication bias was confirmed, a trim-and-fill method developed by Duval and Tweedie was implemented to adjust for this bias. Then, we replicated the funnel plot with their “missing” counterparts around the adjusted summary estimate.
3. Results
3.1. Literature Search
A total of 1980 studies were identified, and 1213 studies were excluded because of duplication. After reading the titles and abstracts, 608 studies were excluded. 159 possible full text studies were carefully reviewed (no data for 0 h. [n = 35]; animal studies [n = 24]; review and meta-analysis [n = 11]). Finally, 89 trials were included for quantitative analysis (Fig. 1). Their characteristics are summarized in Table 1.
Fig. 1.
Flow chart showing the meta-analysis studies selection.
A total of 1980 studies were identified, and 1213 studies were excluded because of duplication. After reading the titles and abstracts, 608 studies were excluded. 159 possible full text studies were carefully reviewed (no data for 0 h. [n = 35]; animal studies [n = 24]; review and meta-analysis [n = 11]). Finally, 89 trials were included for quantitative analysis.
Table 1.
Characteristics of eligible studies.
| First author (year) | Cases | Male/Female | age | Sample collection | Sample storage | Parameter | MINORS |
|---|---|---|---|---|---|---|---|
| Ai, WJ 2015 | 82 | 46/36 | 27.8 ± 2.8 | 6 | 4 °C, RT, 35 °C | HCT, HGB, MCHC, PLt, RBC, RDW, WBC | 22 |
| Bian, S 2014 | 50 | U | U | U | − 20 °C, 4 °C, RT | ALB, ALT, AST, CK, Cl, GLU, K, LDH, Na | 22 |
| Cai, J 2017 | 200 | 111/89 | 38.32 ± 6.46 | 1.5 | RT | GLU | 22 |
| Chen, C 2004 | 40 | 33/7 | 22–50 | U | RT | PLt, RBC, WBC | 22 |
| Cui, LN 2016 | 50 | 25/25 | 30.8 ± 7.7 | U | − 20 °C, 4 °C, RT | ALB, ALT, AST, CK, CO2, GLU, K, LDH, Na, TP | 22 |
| Cui, QL 2012 | 5 | U | U | U | 4 °C, RT | ALB, ALT, AST, BUN, CK, DBIL, GLU, TBIL, TC, TG, TP, UA | 22 |
| Cui, RG 2013 | 150 | 87/63 | 19–40 | 4 | RT | Ca, Cl, CO2CP, K, Na | 22 |
| Daves, M 2015 | 16 | 11/5 | 35–89 | U | 4 °C, RT, 35 °C | MCHC, MCV, MPV, PLt, RBC, RDW, WBC | 22 |
| Deng, ZK 2012 | 30 | U | U | U | − 20 °C, 4 °C, RT | ALB, ALT, AST, CK, Cl, CO2, GLU, K, LDH, Na, TP | 22 |
| Dong LM 2014 | 200 | 100/100 | 38.7 ± 6.5 | 5 | RT | HGB, MCHC, MCV, PLt, RBC, WBC | 22 |
| Fan, YH 2015 | 88 | 56/32 | 37.2 ± 4.7 | 6 | RT | ALT, BUN, Cl, Cr, DBIL, GLU, K, Na, TBIL | 22 |
| Gao, HE 2015 | 86 | 44/42 | 37.5 ± 3.2 | 2 | RT | PLt, WBC | 22 |
| Gao, YH 2016 | 126 | 83/43 | 44.1412.93 | 8 | − 20 °C, 4 °C, RT | ALB, ALT, AST, CK, Cl, GLU, K, LDH, Na | 22 |
| Ge, LF 2009 | 50 | 25/25 | 34.5 | 2 | 4 °C | HCT, MCV, MPV, PLt, RBC, WBC | 22 |
| Gong, QH 2013 | 91 | 29/62 | 28–50 | 2 | 4 °C, RT | HCT, HGB, MCHC, MCV, PLt, RBC, RDW, WBC | 22 |
| Guo, HX 2017 | 200 | U | 51.6 ± 2.3 | U | RT | ALT, AST, CK, CK-MB, α-HBDH, GLU, LDH | 22 |
| Han, JP 2015 | 300 | 121/179 | 16–68 | U | RT | HGB, PLt, RBC, WBC | 22 |
| Hu, HJ 2013 | 10 | U | U | U | RT | ALP, ALT, AST, GGT, LDH | 22 |
| Hu, HY 2015 | 240 | U | U | U | RT | HGB, PLt, RBC, WBC | 22 |
| Huang, CQ 2013 | 200 | U | U | 2 | 4 °C, RT | HGB, PLt, RBC, WBC | 22 |
| Huang, SF 2014 | 160 | 80/80 | 31.2 ± 4.3 | 5 | RT | HCT, HGB, MCHC, MCV, PLt, RBC, RDW, WBC | 22 |
| Huang, XR 2012 | 40 | U | U | 4 | 4 °C | HCT, HGB, MCH, MCHC, MCV, MPV, PLt, RBC, RDW, WBC | 22 |
| Jia, DP 2016 | 90 | 55/35 | 30 ± 0.5 | U | 4 °C | HGB, PLt, RBC, WBC | 22 |
| Jiang, RR 2013 | 30 | U | U | 4 | 4 °C, RT | HCT, HGB, MCHC, MCV, PLt, RBC, RDW, WBC | 22 |
| Jiao, YH 2016 | 86 | 47/39 | 29.58 ± 7.15 | 20 | RT | ALT, AST, BUN, DBIL, GLU, K, Na, TBIL | 22 |
| Jin, LY 2011 | 30 | 13/17 | 20–60 | U | RT | HCT, HGB, MCH, MCHC, MCV, PLt, RBC, WBC | 22 |
| Kang, LX 2016 | 76 | U | U | RT | AST, CK, CK-MB, α-HBDH, GLU | 22 | |
| Li, M 2016 | 124 | 74/50 | 37.4 ± 8.2 | 2 | RT | ALT, AST, BUN, Ca, GLU, P, TBIL, TP | 22 |
| Li, N 2015 | 40 | 20/20 | 14–62 | 2 | 4 °C | HCT, HGB, MCHC, MCV, PLt, RBC, RDW, WBC | 22 |
| Li, QZ 2011 | 60 | 35/25 | 32.3 ± 8.3 | U | 4 °C, RT | RBC, Hb, HCT, WBC, PLt, RDW | 22 |
| Li, Y 2012 | 40 | U | U | 8 | − 20 °C, 4 °C, RT, − 80 °C | ALT | 22 |
| Li, YF 2015 | 160 | 94/66 | 35.11 ± 10.64 | 0.6 | RT | HGB, PLt, RBC, WBC | 22 |
| Li, YJ 2015 | 1000 | 500/500 | 31.57 ± 3.24 | U | − 20 °C | ALT, UA, ALB, BUN, TP, CR, TBIL, TC, CK | 22 |
| Li, ZS 2014 | 76 | 31/45 | 43.2 ± 11.8 | U | RT | PLt,WBC | 22 |
| Liang, Q 2004 | 40 | 16/24 | 45.7 | 2 | 4 °C, RT | HCT, HGB, MPV, PLt, RBC, RDW, WBC | 22 |
| Liu, HS 2006 | 20 | U | U | 4 | 4 °C | HCT, HGB, MCH, MCHC, MCV, MPV, PLt, RBC, RDW, WBC | 22 |
| Liu, QY 2008 | 60 | U | U | 2 | 4 °C | HCT, HGB, MCHC, MCV, PLt, RBC, RDW, WBC | 22 |
| Liu, W 2015 | 136 | 75/61 | 39.5 ± 6.5 | 3 | RT | WBC, RBC, PLt, Hb | 22 |
| Long, HX 2006 | 60 | 28/32 | 13–71 | U | 4 °C | HCT, HGB, MCH, MCHC, MCV, MPV, PLt, RBC, RDW | 22 |
| Ma, L 2013 | 30 | 18/12 | 22 ± 3 | 2 | 4 °C, RT, 35 °C | HCT, MCHC, RDW | 22 |
| Peng, HW 2010 | 157 | U | U | 5 | − 20 °C | ALB, ALT, AST, BUN, Cr, GLU, TBIL, TP, UA | 22 |
| Qian, M 2011 | 15 | U | U | U | RT | HCT, HGB, MCH, MCHC, MCV, MPV, PLt, RBC, RDW, WBC | 22 |
| Qu, SJ 2014 | 80 | 49/31 | 39.57 ± 3.67 | 10 | − 20 °C, RT, | BUN, Cl, Cr, α-HBDH, GLU, K, Na, PLt, TBIL | 22 |
| Rui, F 2015 | 120 | 86/52 | 33.75 ± 7.67 | U | RT | HGB, PLt, RBC, WBC | 22 |
| Shi, ZZ 2006 | 5 | U | U | 5 | 4 °C, RT | ALB, Cl, GLU, K, Na, TC, TG, TP, UA | 22 |
| Sirdah, MM 2013 | 25 | 25/0 | 18–20 | 20 | 4 °C, RT | HCT, HGB, MCHC, MCV, PLt, RBC, RDW, WBC | 22 |
| Su, QJ 2007 | 47 | 26/21 | 29.6 ± 8.4 | U | 4 °C, RT | HCT, HGB, MPV, PLt, RBC, RDW, WBC | 22 |
| Su, YH 2011 | 33 | U | U | U | RT | GLU | 22 |
| Sun, DJ 2015 | 160 | 89/71 | 46.3 ± 2.7 | 2 | RT | HCT, HGB, MCH, MCHC, MCV, MPV, PLt, RBC, WBC | 22 |
| Tan, FS 2011 | 35 | 23/12 | 19–68 | 1 | RT | HGB, PLt, RBC, WBC | 22 |
| Tian ML 2015 | 100 | U | U | U | − 20 °C, 4 °C, RT | ALB, ALP, AST, CK-MB, DBIL, LDH, TBIL | 22 |
| Wang, J 2016 | 200 | 100/100 | 39.0 ± 9.6 | 5 | 4 °C, RT | HGB, PLt, RBC, WBC | 22 |
| Wang, LL 2016 | 30 | 13/17 | 18–43 | U | 4 °C, RT | HCT, HGB, MCHC, MCV, PLt, RBC, RDW, WBC | 22 |
| Wang, QP 2006 | 50 | 28/22 | 16–60 | U | 4 °C | HCT, HGB, MCH, MCHC, MCV, MPV, PLt, RBC, RDW, WBC | 22 |
| Wang, WS 2016 | 80 | 45/35 | 24–54 | 2 | RT | PLt, WBC | 22 |
| Wang, Y 2009 | 40 | 33/7 | 22–50 | U | RT | PLt, RBC, WBC | 22 |
| Wang, YG 2014 | 30 | 18/12 | U | 4 | 4 °C, RT | HGB, PLt, RBC, WBC | 22 |
| Wang, YJ 2011 | 80 | 40/40 | 19–40 | 5 | 4 °C | ALB, ALP, ALT, AST, BUN, Ca, Cl, GGT, GLU, K, Na, P, TBIL, TC, TG, TP | 22 |
| Wei, SF 2014 | 150 | 78/72 | U | U | 4 °C | ALP, ALT, AST, BUN, Ca, GGT, GLU, P, TBIL | 22 |
| Wei, SJ 2016 | 71 | 33/38 | 50.85 ± 5.85 | 2 | 4 °C, RT | HGB, PLt, RBC, WBC | 22 |
| Wen, XM 2008 | 10 | U | U | 5.5 | 4 °C, RT | HCT, HGB, MCH, MCHC, MCV, PLt, RBC, RDW, WBC | 22 |
| Wood, B L 1999 | 252 | U | U | U | 4 °C, RT | HCT, HGB, MCH, MCHC, MCV, PLt, RBC, WBC | 22 |
| Wu, HL 2011 | 33 | 15/18 | 18–68 | 3 | 4 °C | HCT, HGB, MCV, MPV, PLt, RBC, WBC | 22 |
| Wu, YY 2006 | 30 | 15/15 | 21–45 | 2 | 4 °C, RT | HCT, HGB, MCV, PLt, RBC, WBC | 22 |
| Xiao, XY 2013 | 70 | 45/25 | 23–26 | 2 | 4 °C, RT, 35 °C | HCT, MCHC, RDW | 22 |
| Xu, JF 2012 | 120 | 60/60 | 18–65 | U | 4 °C | ALB, ALP, ALT, AST, BUN, Ca, Cl, GGT, GLU, K, Na, P, TBIL, TC, TG, TP | 22 |
| Yan, F 2015 | 53 | 30/23 | 32.20 ± 5.45 | 10 | 4 °C, RT | ALB, GLU, K, TP, UA, | 22 |
| Yang, XR 2013 | 80 | 32/48 | 36.3 ± 3.9 | 4 | 4 °C | ALB, ALP, ALT, AST, TBIL, TG, TP | 22 |
| Yang, YM 2015 | 120 | U | U | U | 4 °C | ALP, ALT, AST, CK-MB, GLU, LDH | 22 |
| Yang, ZM 2016 | 60 | U | U | U | − 20 °C | ALB, ALT, AST, BUN, Cr, GLU, TBIL, TP, UA | 22 |
| Yao, L 2015 | 290 | 155/135 | 37.6 ± 6.5 | 1.5 | RT | GLU | 22 |
| Yi, JP 2014 | 68 | 37/31 | 43.7 ± 12.6 | U | − 20 °C | ALB, ALT, AST, BUN, Cr, GLU, TBIL, TP, UA | 22 |
| Yu, DQ 2015 | 86 | 47/39 | 29.58 ± 7.15 | 20 | RT | ALT, AST, BUN, DBIL, GLU, K, Na, TBIL | 22 |
| Yu, FR 2015 | 172 | 94/78 | U | 20 | RT | ALT, AST, BUN, DBIL, GLU, K, Na, TBIL | 22 |
| Yu, SQ 2003 | 60 | 34/26 | 19–65 | 0.5 | RT | HGB, PLt, RBC, WBC | 22 |
| Zeng, ZL 2007 | 30 | U | U | 5 | 4 °C, RT | ALB, ALP, ALT, AST, CK, Cr, DBIL, GLU, TBIL, TC, TG, TP, UA | 22 |
| Zhang, JS 2015 | 200 | 60/40 | 46.0 ± 2.0 | U | RT | ALT, AST, CK, CK-MB, C, Cr, α-HBDH, GLU, K, LDH, Na, TBIL, UA | 22 |
| Zhang, TY 2014 | 10 | U | U | 3 | 4 °C, RT | ALB, ALT, AST, BUN, CK, Cl, Cr, DBIL, α-HBDH, GLU, K, Na, TBIL, TC, TG, TP, UA | 22 |
| Zhang, YM 2014 | 86 | U | U | 2 | RT | ALT, AST, DBIL, TBIL | 22 |
| Zhang, ZQ 2005 | 10 | U | U | 15 | RT | Cl, CO2CP, GLU, K, Na | 22 |
| Zheng, G 2013 | 50 | U | U | U | − 20 °C | ALB, ALT, AST, BUN, Cr, GLU, TBIL, TP, UA | 22 |
| Zheng, HF 2016 | 120 | 60/60 | 29.6 ± 3.7 | U | 4 °C, RT | ALB, ALT, AST, BUN, CK, GLU, TBIL, TC, TG, TP | 22 |
| Zhou, YJ 2013 | 40 | U | U | U | 4 °C, RT | HGB, PLt, RBC, WBC | 22 |
| Zhou, YX 2006 | 50 | 18/32 | 14–70 | U | 4 °C | HCT, HGB, MCH, MCHC, MCV, MPV, PLt, RBC, RDW | 22 |
| Zhu, JH 2014 | 120 | 64/56 | 30.3 ± 2.1 | U | 4 °C, RT | ALB, ALT, AST, BUN, CK, GLU, TC, TP | 22 |
| Zhu, Q 2012 | 100 | 61/39 | 19.5 ± 8.5 | 8 | 4 °C, RT | GLU | 22 |
| Zhu, TL 2014 | 330 | U | 40.27 ± 11.06 | 3 | RT | ALT, AST, γ-GGT, TBIL | 22 |
| Zhu, WY 2011 | 86 | 40/46 | 4–82 | 2.5 | RT | HCT, HGB, MCH, MCHC, MCV, MPV, PLt, RBC, RDW, WBC | 22 |
| Zou, HY 2016 | 70 | 37/33 | 21–61 | 2 | RT | HGB, PLt, RBC, WBC | 22 |
Note: HCT: hematocrit; HGB: hemoglobin; MCH: mean corpuscular hemoglobin; MCHC: mean corpuscular hemoglobin concentration; MCV: mean corpuscular volume; MPV: mean platelet volume; PLt: platelet count; RBC: red blood cell count; RDW: RBC distribution width; WBC: white blood cell count; ALB: albumin; ALP: alkaline phosphatase; ALT: alanine amino transferase; AST: aspartate amino transferase; BUN: blood urea nitrogen; Ca: Calcium; CK: creatine kinase; CK-MB: creatine kinase isoenzymes; Cl: Chloride; CO2: carbon dioxide; Cr: creatinine; DBIL: direct bilirubin; α-HBDH: α- hydroxybutyrate; GGT: γ − -glutamyl transferase; GLU: glucose; K: potassium; LDH: lactate dehydrogenase; Na: sodium; P: phosphorus; TBIL: total bilirubin; TC: total cholesterol; TG: triglyceride; TP: total protein; UA: uric acid; MINORS: Methodological index for non-randomized studies.
3.2. CBC
3.2.1. WBC Count
33 studies (17,407 samples, Fig. S1) under RT and 22 studies (10,982 samples, Fig. 2) under 4 °C were enrolled. WBC count was relatively stable and the results had no significant change up to 3 d regardless of the storage temperature. For 5 d, differences were seen at 4 °C but had no data at RT.
Fig. S1.
Forest plot of store effect on WBC count under RT.
33 studies (17407 samples) under RT were enrolled. WBC count was relatively stable and the results had no significant change up to 3 d under RT.
Fig. 2.
Forest plot of store effect on WBC count under 4 °C.
22 studies (10,982 samples) under 4 °C were enrolled. WBC count was relatively stable and the results had no significant change up to 3 d. For 5 d, differences were seen.
3.2.2. Platelet Related Measurements
35 studies (18,012 samples, Fig. S2) at RT and 19 studies (7549 samples, Fig. 3) under 4 °C measured PLt count. At RT, even though tested 2 d later, there were no differences. Interestingly, at some time-points (1, 2 and 4 h.), PLt count was a little lower. Storage at 4 °C showed much more stability. Except 8 h., there were no statistical changes up to 3 d. MPV was not a very stable measurement for samples stored over time. It changed at the first compared time (1 h.) and no had differences for storage temperature (Fig. S3).
Fig. S2.
Forest plot of store effect on PLT under RT
35 studies (18012 samples) at RT measured PLt. At RT, even though tested 2 d later, there were no differences. Interestingly, at some time-points (1, 2 and 4 hr.), PLt count was a little lower.
Fig. 3.
Forest plot of store effect on PLt count under 4 °C.
19 studies (7549 samples) under 4 °C measured PLt count. Storage at 4 °C showed much more stability than at RT. Except 8 h., there were no statistically significant changes up to 3 d but changed at 4 d.
Fig. S3.

Forest plot of store effect on MPV
MPV was not a very stable measurement for samples stored over time or temperature. It changed at the first compared time (1 hr.) and no differences for storage temperature. At 2 hr. and 8 hr. under 4 °C there was no change.
3.2.3. RBC Related Measurements
We included 31 studies (19,310 samples, Fig. 4) under RT and 22 studies (10,142 samples, Fig. S4) under 4 °C in the RBC count meta-analysis. The sample was stable for 24 h. at RT. However, even just 12 h. later, the results had changed at 4 °C. For MCHC, the specimens stored at 4 °C were stable < 12 h., but if at RT, 24 h. showed no difference (Fig. S5). HGB comparison of 1 h., 2 h. and 4 h. were statistically significant, but exhibited no difference over time (up to 3 d) under RT. Samples were significantly different from 2 d onwards at 4 °C (Fig. S6). There was no statistically significant until 12 h. under RT for RDW which decreased dramatically from 24 h., but was limited when stored at (4 °C) (Fig. S7). HCT was also a parameter that changed approximately at 8 h. at RT and were greatly dependent on storage temperature. Even though the sample had been stored for 5 d under 4 °C, it still exhibited no significant difference (Fig. S8). 8 h. after collection, MCV changed significantly in samples at RT. And 4 °C samples were significantly different only at 24 h. but not for 2 d or more (Fig. S9). During 3 d, we did not observe any differences for MCH (Fig. S10).
Fig. 4.
Forest plot of store effect on RBC count under RT.
We included 31 studies (19,310 samples) under RT in the RBC count meta-analysis. The sample was stable for 24 h. at RT.
Fig. S4.
Forest plot of store effect on RBC under 4 °C
We included 22 studies (10142 samples) under 4°C in the RBC count meta-analysis. Even just 12 hr. later, the results had changed at 4°C.
Fig. S5.

Forest plot of store effect on MCHC
For MCHC, the specimens stored at 4°C were stable less than 12 hr., but if at RT, 24 hr. showed no difference.
Fig. S6.

Forest plot of store effect on HGB
HGB comparison of 1 hr., 2 hr. and 4 hr. were statistically significant, but exhibited no difference over time (up to 3 d) under RT. Samples were significantly different from 2 d onwards at 4°C.
Fig. S7.

Forest plot of store effect on RDW
Except for 8 hr., there was no statistically significant until 12 hr. under RT for RDW which decreased dramatically from 24 hr. if samples were kept at RT, but was limited when stored at (4°C).
Fig. S8.

Forest plot of store effect on HCT
HCT was also a parameter that changed approximately at 8 hr. at RT and were greatly dependent on storage temperature. Even though the sample had been stored for 5 d under 4°C, it still exhibited no significant difference.
Fig. S9.
Forest plot of store effect on MCV
8 hr. after collection, MCV changed significantly in samples at RT. And 4°C samples were significantly different only at 24 hr. but not for 2 d or more.
Fig. S10.
Forest plot of store effect on MCH
During 3 d, we did not observe any differences for MCH.
3.3. CMP
3.3.1. GLU
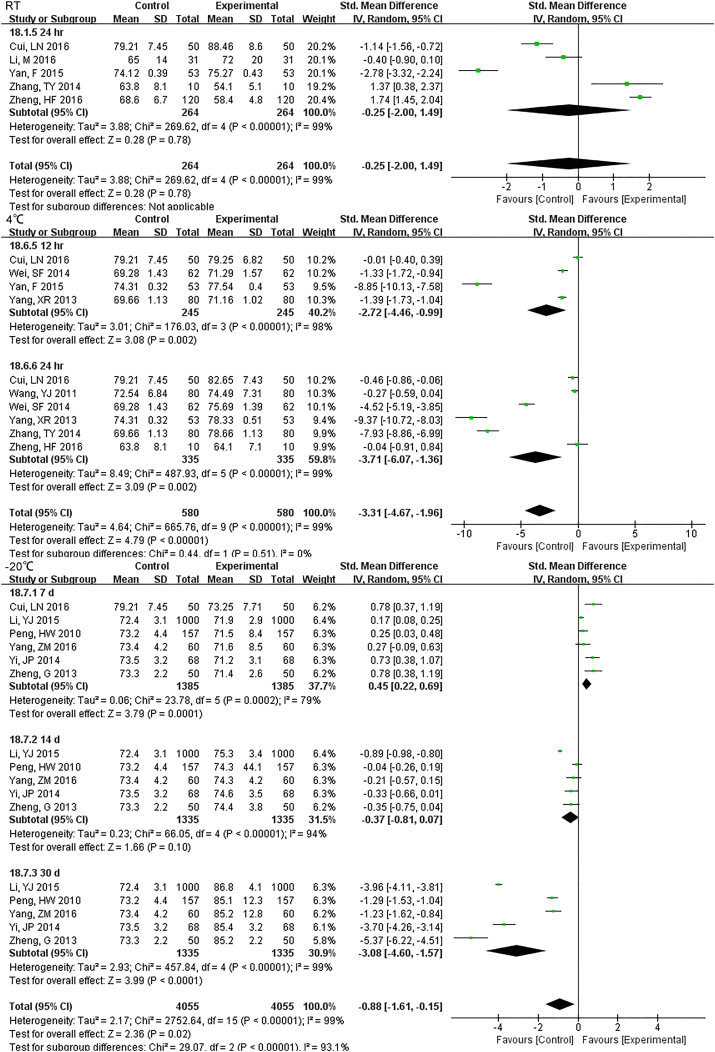
22 studies (9814 samples, Fig. S11) under RT, 11 studies (2638 samples, Fig. 5) under 4 °C and 8 studies (1852 samples, Fig. S12) under − 20 °C measured GLU. Even the sample was stored for only 1 h at RT, the stability was unsatisfactory. Storage at 4 °C was much better and was stable up to 24 h. At 7 d storage there was stability but not for 14 d at − 20 °C.
Fig. S11.
Forest plot of store effect on GLU under RT
22 studies (9814 samples) under RT measured GLU. Even the sample was stored for only one hour at RT, the stability was unsatisfactory.
Fig. 5.
Forest plot of store effect on GLU under 4 °C.
11 studies (2638 samples) under 4 °C measured GLU. Storage at 4 °C was much better than at RT and was stable up to 24 h.
Fig. S12.
Forest plot of store effect on GLU under -20 °C
8 studies (1852 samples) under -20°C measured GLU. At 7 d storage there was stability but not for 14 d at 20°C.
3.3.2. Electrolyte
The sample potassium was not very stable under RT and 1 h. storage had differences (Fig. S13). The results of Na changed at 12 h. under RT, and remained unchanged up to 24 h. under 4 °C (Fig. S14). For Cl, two-day under 4 °C were stable while 24 h. under RT had a difference (Fig. S15).
Fig. S13.
Forest plot of store effect on K
The sample potassium was not very stable under RT and 1 hr. storage with differences.
Fig. S14.
Forest plot of store effect on Na
The results of Na changed at 12 hr. under RT, remained unchanged up to 24 hr. under 4°C.
Fig. S15.
Forest plot of store effect on Cl
For Cl two-day under 4°C were stable while 24 hr. under RT had a difference.
3.3.3. Enzyme and Protein
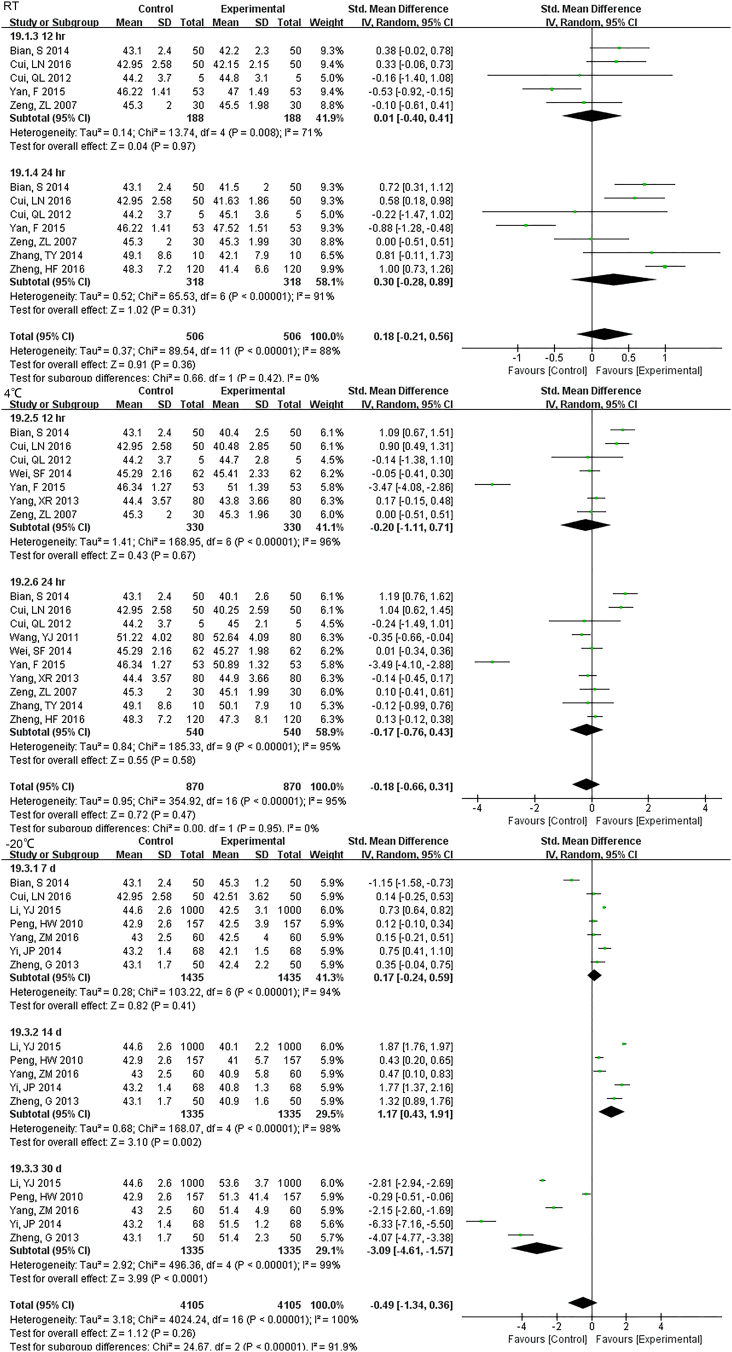
For 12 h., samples LDH under RT were statistically different, but the results were much better if stored under 4 °C (Fig. S16). Samples for AST had no difference for 24 h. for both RT and 4 °C. Storage for 7 d under − 20 °C demonstrated statistical differences (Fig. S17), so was ALT (Fig. S18). ALP was stable for 24 h. under both RT and 4 °C (Fig. S19). TP was no difference up to 24 h. under RT but the results had changed for 12 h. under 4 °C (Fig. S20). ALB had stable results up to 24 h. under RT or 4 °C and could be stored for at least for 7 d under − 20 °C(Fig. S21).
Fig. S16.
Forest plot of store effect on LDH
For 12 hr., samples LDH under RT were statistically different, but the results were much better if stored under 4°C.
Fig. S17.
Forest plot of store effect on AST
Samples for AST had no difference for 24 hr. for both RT and 4°C. Storage for 7 d under -20°C demonstrated statistical differences.
Fig. S18.
Forest plot of store effect on ALT
Samples for ALT had no difference for 24 hr. for both RT and 4°C. Storage for 7 d under -20°C demonstrated statistical differences, just like AST did.
Fig. S19.
Forest plot of store effect on ALP
ALP were stable both for 24 hr. at RT and 4°C.
Fig. S20.
Forest plot of store effect on TP
TP was no difference up to 24 hr. under RT but the results had changed for 12 hr. under 4°C.
Fig. S21.
Forest plot of store effect on ALB
ALB had stable results up to 24 hr. under RT or 4°C and could be stored for at least for 7 d under -20°C.
3.3.4. Other Parameters
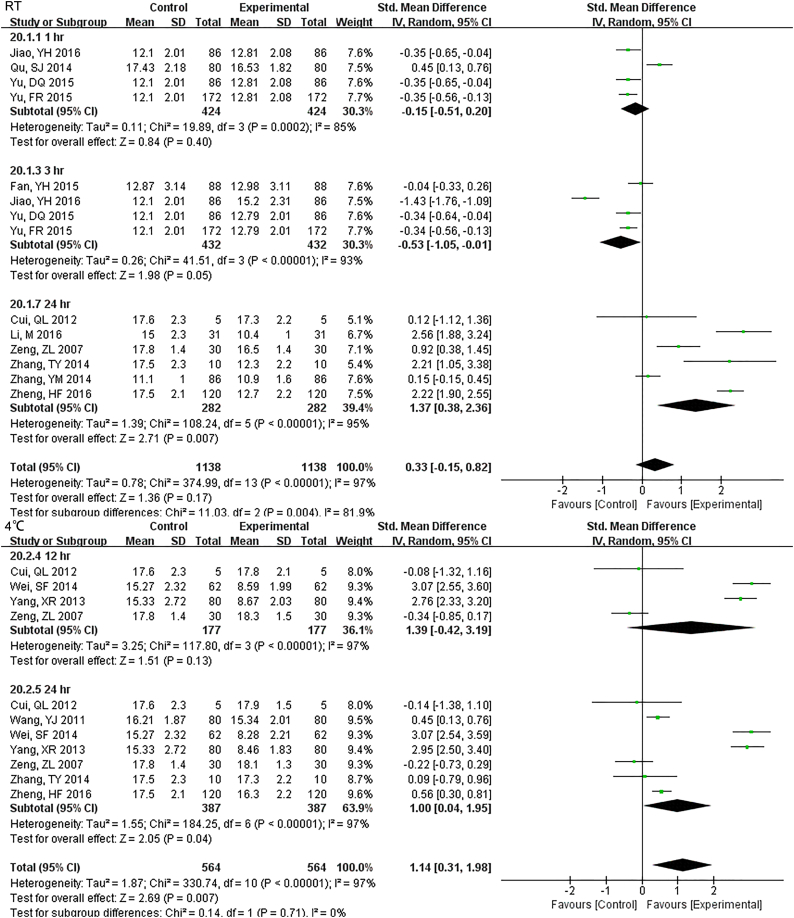
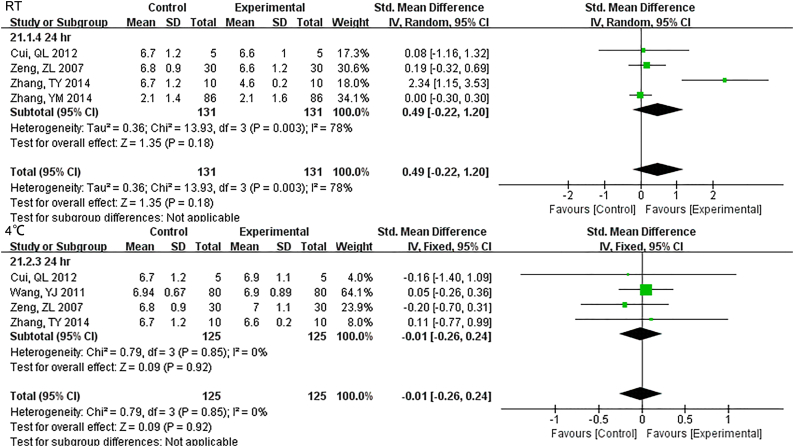
Samples stored at 4 °C were stable up to 12 h., while 3 h. under RT showed differences for TBIL (Fig. S22). DBIL were stable both for 24 h. at RT and 4 °C(Fig. S23), so as TC (Fig. S24)and TG (Fig. S25). Sample Cr were no changes at least for 7 d at − 20 °C (Fig. S26) and BUN exhibited differences 3 h. at RT (Fig. S27).
Fig. S22.
Forest plot of store effect on TBIL
Samples stored in 4°C were stable up to 12 hr., while 3 hr. under RT showed differences for TBIL.
Fig. S23.
Forest plot of store effect on DBIL
DBIL were stable both for 24 hr. at RT and 4°C.
Fig. S24.
Forest plot of store effect on TC
TC were stable both for 24 hr. at RT and 4°C.
Fig. S25.
Forest plot of store effect on TG
TG were stable both for 24 hr. at RT and 4°C.
Fig. S26.
Forest plot of store effect on Cr
Sample Cr were no changes at least for 7 d at -20°C.
Fig. S27.
Forest plot of store effect on BUN
BUN exhibited differences 3 hr. at RT.
3.4. Sensitivity Analysis and Publication Bias
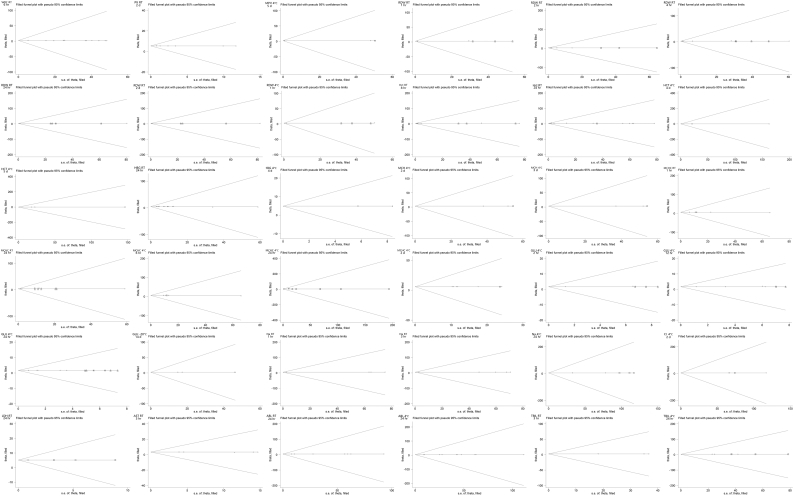
Except HCT 4 °C 2 d, MCHC 4 °C 8 h., AST RT 24 h. and TP RT 24 h., sensitive analysis results were consistent (S Table 1), which indicates our results are stable and reliable. Egger test was applied to test publication bias. By trim and fill method, both the results of fixed and random effects model are just the same with original result (Appendix 2, Fig. S28 for funnel plot for trim-and-fill method).
Fig. S28.
Funnel plot for trim-and-fill method
The results of replicating the funnel plot with their “missing” counterparts around the adjusted summary estimate for parameters with publication bias.
4. Discussion
Several lines of evidence attest that the vast of laboratory errors (70%) emerge from the pre-analytical phase rather than from the analytical and post-analytical phases (Lippi et al., 2006). In the pre-analytic phase, reliable specimen storage is fundamental to high-quality test results (Narayanan, 2000). Inappropriate storage conditions would pose a tangible challenge for the sample quality (Adcock et al., 2012).
The CBC or hemogram is a routine laboratory test that evaluates number, size, morphology and related indices of the blood: WBC, platelet and RBC. Significant time-and temperature-dependent changes can occur when the storage of blood is prolonged (Hedberg and Lehto, 2009; Jobes et al., 2011). Earlier studies have reported acceptable stability after 24 h. of storage for basic parameters, such as RBC count, WBC count and platelet count, HGB, MCH and MCHC (Lewis SM, 1975). More recently, different authors have reported that some measurements are stable up to 72 h. after collection if stored at 4 °C refrigerated (Ashenden et al., 2013; Robinson et al., 2011; Voss et al., 2008) and our results confirmed this. Storage time and temperature may have a small influence on WBC count. Although it hadn't analyzed in our study, there were studies reflect that WBC differential count was not stable over time (Hill et al., 2009). Although one study reported a better stability of the PLt count at room temperature (Imeri et al., 2008), we had no evidence to support this. Sample was stable after 2 d storage at 4 °C and RT. Four days at 4 °C had changed the PLt count which might be attributed to alterations in platelet morphology, movement and aggregation (Mahmoodi et al., 2006). Another parameter reflects the propriety of platelet is MPV. From our results, it changed at the first compared point-in-time (1 h.). The reliable MPV might have something to do with time- and concentration-related changes in platelet shape from discoid to spherical and swelling. Some red blood cell related parameters, such as RBC count, HGB, and MCHC, were less stable when stored at 4 °C, which may be affected by initial freezing followed by refrigeration (Lombardi et al., 2011). Those raise an important concern that refrigeration of specimens may not be satisfactory as previously believed. As the time gone, RBC has been shown to significantly drop because of hemolysis. Increased cell permeability would be found by the increment of MCV, an index reflected to the swelling of the RBC. The change in HCT and MCHC are clearly the consequence of change in MCV because those parameters are partially derived from MCV (Buoro et al., 2016; Daves et al., 2015; Gunawardena et al., 2017).
Parameters of CMP should also be considered for the time- and temperature- dependent change, although studies focused on this was relatively few. All in all, the reasons that may be responsible for change are as follows: firstly, self-consumption. Studies have found that blood glucose decrease by 5% ~ 7% (0.4 mmol/L) per hour after venipuncture because of erythrocyte glycolysis, WBC degeneration and contamination by bacteria (Gunawardena et al., 2017). What we could see was that even by 1 h. at RT, blood glucose showed a statistical difference. Secondly, increased permeability of blood cells, influencing Na, K, Cl, TBIL and even some enzymes LDH, AST, ALT, and ALP. The importance of normal blood potassium cannot be overemphasized and < 3.5 mmol/L or > 5.5 mmol/L could induce serious, even lethal arrhythmia. Nevertheless, our results showed that a sharp increase of blood potassium had occurred at the first hour under RT. Whether refrigerator storage made a difference, requires more clinical trials. Thirdly, influenced by environment factors. TBIL was a parameter increased by hemolysis and decreased by longtime exposure under sunshine, so it is not stable and changes at 3 h. under RT. DBIL was relatively stable for 24 h. as it is produced by the liver using unconjugated bilirubin. Although hemolysis leading to increased TBIL, no more DBIL was generated. BUN was another index influenced by exposure, as a result, it changed even at 3 h. under RT. ALB is an important part of plasma colloid osmotic pressure and was stable for 24 h. under RT or 4 °C and 7 d at − 20 °C.
Overall, when it came to the influence of temperature, the stability appeared better when samples were stored at 4 °C compared to RT and this was much more obvious in CMP testing.
To our knowledge, this meta-analysis is the first study which systematically estimates the effect of storage conditions on CBC and CMP testing and identified that time and temperature of storage can indeed have an impact on the quality of testing. The most important implication of this study is the need to define reliable time and means of sample storage, help establish of centralized hematological services or biobanks and benefit transfusion.
The following are the supplementary data related to this article.
Supplementary material
Acknowledgments
Acknowledgments
We are grateful to David R. Jobes, MD, Department of Anesthesiology and Critical Care Medicine from The Children's Hospital of Philadelphia for helpful hints in native expression.
Funding Sources
No Funding.
Conflicts of Interest
The authors declare that they have no conflict of interests.
Author Contributions
Dong-wen Wu: designed the research; searched the lecture; wrote the paper. Yu-meng Li: screened and evaluated the quality of evidence; extracted data; helped write the paper. Fen Wang: screened and evaluated the quality of evidence; extracted data.
Supplementary data
Supplementary material 1
Supplementary material 2
References
- Adcock F.D., Lippi G., Favaloro E.J. Quality standards for sample processing, transportation, and storage in hemostasis testing. Semin. Thromb. Hemost. 2012;38:576–585. doi: 10.1055/s-0032-1319768. [DOI] [PubMed] [Google Scholar]
- Ashenden M., Clarke A., Sharpe K., D'Onofrio G., Plowman J., Gore C.J. Stability of athlete passport parameters during extended storage. Int. J. Lab. Hematol. 2013;35:183–192. doi: 10.1111/ijlh.12014. [DOI] [PubMed] [Google Scholar]
- Begg C.B., Mazumdar M. Operating characteristics of a rank correlation test for publication bias. Biometrics. 1994;50:1088–1101. [PubMed] [Google Scholar]
- Briggs C., Culp N., Davis B., D'Onofrio G., Zini G., Machin S.J. ICSH guidelines for the evaluation of blood cell analysers including those used for differential leucocyte and reticulocyte counting. Int. J. Lab. Hematol. 2014;36:613–627. doi: 10.1111/ijlh.12201. [DOI] [PubMed] [Google Scholar]
- Buoro S., Mecca T., Seghezzi M., Manenti B., Cerutti L., Dominoni P., Napolitano G., Resmini S., Crippa A., Ottomano C. Assessment of blood sample stability for complete blood count using the Sysmex XN-9000 and Mindray BC-6800 analyzers. Rev. Bras. Hematol. Hemoter. 2016;38:225–239. doi: 10.1016/j.bjhh.2016.05.010. [DOI] [PMC free article] [PubMed] [Google Scholar]
- Daves M., Zagler E.M., Cemin R., Gnech F., Joos A., Platzgummer S., Lippi G. Sample stability for complete blood cell count using the Sysmex XN haematological analyser. Blood Transfus. 2015;13:576–582. doi: 10.2450/2015.0007-15. [DOI] [PMC free article] [PubMed] [Google Scholar]
- Egger M., Davey S.G., Schneider M., Minder C. Bias in meta-analysis detected by a simple, graphical test. BMJ. 1997;315:629–634. doi: 10.1136/bmj.315.7109.629. [DOI] [PMC free article] [PubMed] [Google Scholar]
- Gunawardena D., Jayaweera S., Madhubhashini G., Lokumarakkala D.D., Senanayake S.J. Reliability of parameters of complete blood count with different storage conditions. J. Clin. Lab. Anal. 2017;31 doi: 10.1002/jcla.22042. [DOI] [PMC free article] [PubMed] [Google Scholar]
- Hedberg P., Lehto T. Aging stability of complete blood count and white blood cell differential parameters analyzed by Abbott CELL-DYN Sapphire hematology analyzer. Int. J. Lab. Hematol. 2009;31:87–96. doi: 10.1111/j.1751-553X.2007.01009.x. [DOI] [PubMed] [Google Scholar]
- Higgins J.P., Thompson S.G., Deeks J.J., Altman D.G. Measuring inconsistency in meta-analyses. BMJ. 2003;327:557–560. doi: 10.1136/bmj.327.7414.557. [DOI] [PMC free article] [PubMed] [Google Scholar]
- Hill V.L., Simpson V.Z., Higgins J.M., Hu Z., Stevens R.A., Metcalf J.A., Baseler M. Evaluation of the performance of the Sysmex XT-2000i hematology analyzer with whole bloods stored at room temperature. Lab. Med. 2009;40:709–718. doi: 10.1309/T0FJYP2RBXEHX4. [DOI] [PMC free article] [PubMed] [Google Scholar]
- Imeri F., Herklotz R., Risch L., Arbetsleitner C., Zerlauth M., Risch G.M., Huber A.R. Stability of hematological analytes depends on the hematology analyser used: a stability study with Bayer Advia 120, Beckman Coulter LH 750 and Sysmex XE 2100. Clin. Chim. Acta. 2008;397:68–71. doi: 10.1016/j.cca.2008.07.018. [DOI] [PubMed] [Google Scholar]
- Jobes D., Wolfe Y., O'Neill D., Calder J., Jones L., Sesok-Pizzini D., Zheng X.L. Toward a definition of “fresh” whole blood: an in vitro characterization of coagulation properties in refrigerated whole blood for transfusion. Transfusion. 2011;51:43–51. doi: 10.1111/j.1537-2995.2010.02772.x. [DOI] [PMC free article] [PubMed] [Google Scholar]
- Lippi G., Simundic A.M. Laboratory networking and sample quality: a still relevant issue for patient safety. Clin. Chem. Lab. Med. 2012;50:1703–1705. doi: 10.1515/cclm-2012-0245. [DOI] [PubMed] [Google Scholar]
- Lippi G., Guidi G.C., Mattiuzzi C., Plebani M. Preanalytical variability: the dark side of the moon in laboratory testing. Clin. Chem. Lab. Med. 2006;44:358–365. doi: 10.1515/CCLM.2006.073. [DOI] [PubMed] [Google Scholar]
- Lombardi G., Lanteri P., Colombini A., Lippi G., Banfi G. Stability of haematological parameters and its relevance on the athlete's biological passport model. Sports Med. 2011;41:1033–1042. doi: 10.2165/11591460-000000000-00000. [DOI] [PubMed] [Google Scholar]
- Mahmoodi M., Hajizadeh M., Rashidinejad H., Asadikaram G., Khaksari M., Mirzaee M., Seyedi N., Rahnema A., Sayadi A. Survey of changes in complete blood count and red cell indices of whole blood incubated in vitro at different temperatures up to 48 hours. J. Ayub. Med. Coll. Abbottabad. 2006;18:14–16. [PubMed] [Google Scholar]
- Moher D., Liberati A., Tetzlaff J., Altman D.G. Preferred reporting items for systematic reviews and meta-analyses: the PRISMA statement. BMJ. 2009;339:b2535. doi: 10.1136/bmj.b2535. [DOI] [PMC free article] [PubMed] [Google Scholar]
- Mosca A., Paleari R., Ivaldi G., Galanello R., Giordano P.C. The role of haemoglobin A(2) testing in the diagnosis of thalassaemias and related haemoglobinopathies. J. Clin. Pathol. 2009;62:13–17. doi: 10.1136/jcp.2008.056945. [DOI] [PubMed] [Google Scholar]
- Narayanan S. The preanalytic phase. An important component of laboratory medicine. Am. J. Clin. Pathol. 2000;113:429–452. doi: 10.1309/C0NM-Q7R0-LL2E-B3UY. [DOI] [PubMed] [Google Scholar]
- Plebani M., Lippi G. Is laboratory medicine a dying profession? Blessed are those who have not seen and yet have believed. Clin. Biochem. 2010;43:939–941. doi: 10.1016/j.clinbiochem.2010.05.015. [DOI] [PubMed] [Google Scholar]
- Robinson N., Sottas P.E., Pottgiesser T., Schumacher Y.O., Saugy M. Stability and robustness of blood variables in an antidoping context. Int. J. Lab. Hematol. 2011;33:146–153. doi: 10.1111/j.1751-553X.2010.01256.x. [DOI] [PubMed] [Google Scholar]
- Voss S.C., Flenker U., Majer B., Schanzer W. Stability tests for hematological parameters in antidoping analyses. Lab. Hematol. 2008;14:24–29. doi: 10.1532/LH96.08005. [DOI] [PubMed] [Google Scholar]
- Zandecki M., Genevieve F., Gerard J., Godon A. Spurious counts and spurious results on haematology analysers: a review. Part II: white blood cells, red blood cells, haemoglobin, red cell indices and reticulocytes. Int. J. Lab. Hematol. 2007;29:21–41. doi: 10.1111/j.1365-2257.2006.00871.x. [DOI] [PubMed] [Google Scholar]
- Zini G. Stability of complete blood count parameters with storage: toward defined specifications for different diagnostic applications. Int. J. Lab. Hematol. 2014;36:111–113. doi: 10.1111/ijlh.12181. [DOI] [PubMed] [Google Scholar]
Associated Data
This section collects any data citations, data availability statements, or supplementary materials included in this article.
Supplementary Materials
Supplementary material


