

Abstract
Tissue engineering (TE) approaches strive to regenerate or replace an organ or tissue. The successful development and subsequent integration of a TE construct is contingent on a series of in vitro and in vivo events that result in an optimal construct for implantation. Current widely used methods for evaluation of constructs are incapable of providing an accurate compositional assessment without destruction of the construct. In this review, we discuss the contributions of vibrational spectroscopic assessment for evaluation of tissue engineered construct composition, both during development and post-implantation. Fourier transform infrared (FTIR) spectroscopy in the mid and near-infrared range, as well as Raman spectroscopy, are intrinsically label free, can be non-destructive, and provide specific information on the chemical composition of tissues. Overall, we examine the contribution that vibrational spectroscopy via fiber optics and imaging have to tissue engineering approaches.
Table of Contents Entry
We review applications of vibrational spectroscopy for tissue engineering applications.
1 Background: Tissue Engineering
In 1993, Robert Langer and Joseph Vacanti published “Tissue Engineering” in Science, introducing the new field as a potential solution for damaged organs or tissues1. Langer and Vacanti described tissue engineering (TE) as a multidisciplinary field of biology and engineering in which cells and materials are used in combination to restore damaged tissue to their original functionality. Since its inception, tissue engineering has progressed from theory to practice. Tissue engineering is an attractive alternative to transplants as human tissue can be produced without a donor requirement. According to the United Network for Organ Sharing (UNOS), 22 people die each day while waiting for a transplant2, and successful tissue engineering has the potential to bridge the gap between organ demand and supply.
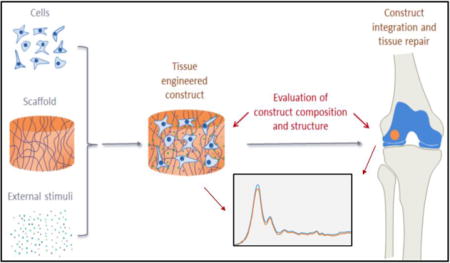
Numerous methodologies are used to fabricate tissue engineered constructs and organs. The general approach typically involves deposition of cells onto a natural or synthetic (polymeric) extracellular matrix (ECM) or scaffold, followed by incubation of the cells and scaffold construct in media with appropriate growth factors, and eventually clinical implantation (Figure 1). Once implanted, the scaffolds, which are generally biodegradable, will degrade over time, and native tissue ECM will replace the scaffold. The decellularization approach, a method which aims to leave the ECM of whole organs intact while primary cells and nucleic material are removed through a series of detergent washes3, 4, has also been investigated. Decellularized organs are coveted scaffolds for tissue engineering because they ensure a desirable in vivo-like microenvironment for regeneration while maintaining low immunogenicity5. Nonetheless, there are many challenges to successful decellularization, and thus synthetic and natural polymers, primarily collagen-based, currently serve as the most widely used platforms for tissue engineering. The properties of polymers, e.g., porosity, degradation time, and mechanical characteristics, are readily manipulated and can be scaled up to produce large homogenous batches of material6, 7. In contrast to naturally derived polymers, such as collagen, gelatin and silk, synthetic polymers mount truncated immune responses upon implantation and maintain structural integrity. Due to its biodegradability and biocompatibility, the synthetic copolymer poly(lactide-co-glycolide) (PLGA) is frequently used. PLGA is one of the few synthetic polymers to be approved by the U.S. Food and Drug Administration (FDA)8.
Figure 1.
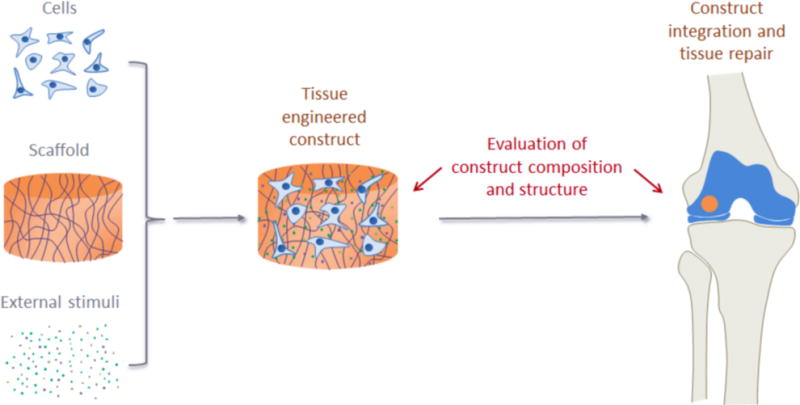
Schematic representation of typical tissue engineering procedures. Cells, scaffolds, and external stimuli (such as growth factors, cytokines, and mechanical forces) are combined to produce tissue engineered constructs. Important compositional and structural parameters of the constructs need to be carefully evaluated to increase the chance of successful tissue repair.
Ceramics are another material that are commonly used in tissue engineering, primarily for bone9. In 2007, Marcacci et al.10 published the results of a 7-year clinical pilot study where the integration of an adult stem cell seeded porous hydroxyapatite (HA) ceramic scaffold into bone was evaluated. Patients were assessed at various post-surgery time points, and no major complications occurred in early or late postoperative periods, making the study a preliminary success story for tissue engineered bone. Currently, scaffolds for clinical use for bone repair include Bio-Oss® by Geistlich Pharma which is sourced from Australian bovine bone tissue and designed for dental regeneration11. In addition, DBX® Demineralized Bone Matrix, an osteoconductive bone void filler by DePuy Synthes, is a clinically used tissue engineered construct for bone repair12, 13.
Hydrogels are favorable for soft tissue engineering because of their compositional and structural similarities to natural extracellular matrix and their ability to support cellular proliferation and viability14, 15. Cartilage tissue engineering efforts have demonstrated progress through hydrogels in several studies. Snyder et al.16 achieved exploratory pre-clinical success with a fibrin/M-hyaluronic acid hydrogel to deliver mesenchymal stem cells for articular cartilage repair, and Chung et al.17 successfully generated a MSC-laden hyaluronic acid hydrogel that supports chondrogenesis of human mesenchymal stem cells.
Tissue engineered scaffolds that have been widely used for clinical applications are also available for skin repair. These include tissue engineered products that range from a collagen matrix for plastic and reconstructive surgery (SurgiMend PRS, Integra Life Sciences) to an acellular dermal matrix (HuMend, Integra Life Sciences) made to support soft tissue integration18. In 2014, Nair et al.19, published a pre-clinical study in rabbits on an electrospun biodegradable dermal substitute. Fibroblasts were grown on the dermal substitute and allowed to progress through epithelialization. They demonstrated that the dermal scaffold could support fibroblast proliferation, extracellular matrix deposition (collagen and elastin), polymer degradation and mechanical strength. Although this was a preclinical study, the results are encouraging for future clinical TE repair.
Despite the relative youth of the field, tissue engineering is a cornerstone of the future of medicine. As the general population continues to age, tissue engineering and regenerative medicine will be in high demand. This will result in a great need for methodologies for characterization of engineered constructs in vitro and in vivo, pre-and post-implantation.
2 Challenges and Approaches for Evaluation of Tissue Engineered (TE) Constructs
Tissue engineered constructs are typically validated through a series of in vitro and in vivo characterizations. Important parameters are obtained from biocompatibility, biochemical and mechanical property evaluations, which can indicate the potential for in vivo success, and from histological analysis, which serves as an indicator of ECM formation pre and post implantation, and of tissue integration post implantation (Figure 1). Here, we focus on assessment of ECM, which can be performed either in a destructive manner on the bulk construct, or by histological/immunohistochemical (IHC) analysis, or electron microscopy, on thin tissue sections.
When ECM deposition by cells is evaluated by biochemical assays, constructs are typically digested with papain or protease-K, and lyophilized prior to assay20. Sulfated glycosaminoglycan (GAG) content is determined spectrophotometrically by Dimethylmethylene Blue dye binding21, and total collagen content is determined spectrophotometrically from hydroxyproline content after acid hydrolysis and reaction with p-dimethylaminobenzaldehyde and chloramine-T22. Quantitative ELISA of procollagen I carboxyterminal peptide (PICP) and procollagen III aminoterminal peptide (PIIINP) culture medium markers for the biosynthesis of types I and III collagen, respectively, can be performed23, as well as inhibition ELISA for quantification of Type II collagen content20. The presence of other collagens (e.g., I, IX, X) can be semi-quantitatively measured by SDS-PAGE and Western blot24. For histologic assessment, engineered constructs are fixed in aldehyde-based fixatives (light and electron microscopy); embedded in paraffin (light microscopy), OCT (cryofixation) or resin (electron microscopy), and sectioned for staining and analysis25. Engineered tissue sections are stained with hematoxylin and eosin (H&E) for many non-specific cells, picrosirius red or trichrome staining for differentiating collagen from other ECM components, safranin-O or alcian blue for GAGs, and monoclonal antibodies for collagen types I, II, IX, and X20, 24, 26. Engineered cardiac tissue sections are stained with H&E for cells and monoclonal antibodies for sarcomeric α-actin, cardiac troponin I, sarcomeric tropomyosin, and connexin 4326, 27. Similarly, for nerve regeneration, the sample sections are stained with monoclonal antibodies for Schwann Cells (GFAP, S-100 protein), axonal regrowth (β-III tubulin, neurofilaments and GAP-43, PGP9.5) and Myelin (myelin basic protein) (Carriel et al. 2014, 1657–1660). For quantification of the proteins of interest, components are assessed by image analysis, which can involve thresholding and segmentation based on specific staining28–30. Scanning and transmission electron microscopy (SEM, TEM) are frequently performed on engineered constructs for evaluation of nanometer and micron level structural features, such as collagen fibril size and progressive tissue formation during cultivation25, 26, 31.
The techniques described above provide a significant amount of compositional information on engineered constructs, but have several limitations. Biochemical and histologic analysis require either sample destruction or processing, and thus cannot be performed on an individual construct that is being considered for clinical implantation. Instead, additional constructs have to be grown and analyzed, and the construct of interest is then assumed to have a similar composition to those actually evaluated. Further, multiple special stains for evaluation of various tissue components are required for histology and IHC, and identification of the scaffold in the construct can still be challenging. Finally, none of the aforementioned modalities permit evaluation of the composition of an engineered construct both in vitro and in vivo, such that appropriate compositional endpoints for implantation can be defined, as well as matrix changes that occur as a result of remodeling of the construct.
Nondestructive methods based on magnetic resonance imaging (MRI)32, optical imaging33, ultrasound imaging34, and X-ray imaging35, are possible alternatives. Many MRI studies have successfully imaged matrix content in tissues36, including in engineered constructs32, 37. However, a limiting factor of these techniques include lack of accessibility due to high equipment costs. Contrast-enhanced micro CT can also non-destructively asses matrix content38, but the addition of an external contrast agent is required. Further, the use of ionizing radiation (e.g., X-ray imaging), still raises concerns about damage to the tissue39. Accordingly, here, we present applications of vibrational spectroscopy for tissue engineering investigations.
3 Applications of Fourier transform infrared spectroscopy and imaging for tissue engineering
Fourier transform infrared (FTIR) spectroscopy and imaging stand out as a potential solution for evaluation of engineered tissue composition. FTIR microscopy and imaging have been successfully applied to investigate the composition and structure of tissue and other biological systems for many years40–44. Unique to this method, FTIR analysis can provide a rich and detailed range of information using a nondestructive, label-free approach. Vibrational spectroscopy in the mid-infrared (MIR) (400–4000 cm−1) and near-infrared (NIR) (4000–12500 cm−1) range can provide specific information about molecular vibrations within functional groups, which results in characteristic absorptions bands in the spectra that are correlated to composition. In the MIR range, the bands are more intense and specific, whereas in NIR they are typically weaker, broader, and overlapping, corresponding to overtones and combinations of fundamental vibrations seen in the MIR spectra45–47. The absorbances in the MIR range arise from fundamental molecular vibrations, where the frequency of the vibration is specific to the molecular species, and the integrated absorbance of the peak is related to the concentration of a molecular component. Together, MIR and NIR spectral analysis provides a variety of qualitative and quantitative information related to the composition and structure of tissues. In the tissue engineering field, MIR spectroscopy has been used for characterizing biomaterials and scaffolds, and ECM. This includes constructs designed for articular cartilage48–50, bone51, 52, heart53, 54, skin55, 56, cornea57, 58, and bladder59. However, the use of MIR to evaluate ECM produced by cells on engineered tissue constructs has focused primarily on studies of articular cartilage and bone, which is what we focus on here.
3.1 Articular cartilage tissue engineering
3.1.1 Composition and structure
Articular cartilage is a highly-specialized connective tissue that lines the ends of long bones to provide smooth joint surfaces while withstanding substantial mechanical loads. The function of articular cartilage is dependent on its organized composition and structure, and is directly associated with its abundant extracellular matrix. Cartilage ECM is composed primarily of water, collagen, and proteoglycans, with other non-collagenous proteins and glycoproteins also present in smaller amounts60, 61. The most abundant component of articular cartilage is water which accounts for up to 80% of its wet weight. Type II collagen represents the majority of the collagen in the matrix, forming fibrils and fibers that intertwine with proteoglycan aggregates. The main constituent of these proteoglycans is aggrecan, presenting more than 100 chondroitin sulfate and keratin sulfate chains and the ability to interact with hyaluronan to form large aggregates. These components are distributed in a very specific way throughout articular cartilage, characterizing its unique zonal heterogeneity41, 60, 61. In the superficial zone, the outer layer of cartilage has densely packed type II collagen fibrils oriented parallel to the surface, a small amount of proteoglycans and high-water content. The middle transitional zone has lower water content, higher concentration of proteoglycans, and a lower concentration of collagen fibrils, which display a random orientation. The deep zone contains radially oriented collagen fibrils, the highest concentration of proteoglycans, and lowest percentage of water compared to the other zones.
3.1.2 Analytical challenges in articular cartilage tissue engineering
Tissue engineering approaches for cartilage aim to repair an inherently heterogeneous tissue and preserve mechanical integrity. Paramount to ensuring clinical success is evaluation of the microscopic compositional variations in constructs, assessment of scaffold degradation, and determination of the “readiness” of constructs for implantation, as non-optimal constructs can lead to implant failure. The use of vibrational spectroscopy for the evaluation of articular cartilage has been recently reviewed by Rieppo et al.62, with a comprehensive description of spectral bands assigned to specific components of the native tissue.
3.1.3 Applications of MIR to evaluation of engineered cartilage
Infrared spectral imaging in the MIR range was first used to assess the molecular composition of histological tissue sections in native cartilage by Camacho et al.63 This study delineated the specific molecular components of cartilage that contribute to MIR spectrum throughout tissue zones. They described how the integrated area of the amide I band (1710–1595 cm−1) and of the 1338 cm−1 peak, related to collagen side chain vibrations, correlated with collagen concentration, and the ratio of the integrated area of the proteoglycan sugar ring C–O band (1185–960 cm−1) to the amide I area correlated to the quantity of proteoglycan. Moreover, they showed how polarized MIR imaging could be performed to determine the spatial distribution of collagen orientation in the different cartilage zones, using the amide I/amide II ratio as a spectral marker of collagen orientation. This study was closely followed by Potter et al.64, who used spectral imaging to quantify collagen and chondroitin sulfate in native and engineered cartilage. MIR spectral imaging has proven to be useful in evaluating the composition and organization of engineered constructs in several studies. For instance, Kim et al. have used MIR to assess proteoglycan content in the ECM produced by chondrocytes within a hollow fiber bioreactor (HFBR)65 and the effects of transient exposure to transforming growth factor-beta3 (TGF-β3) in the production of collagen by mesenchymal stem cells in hyaluronic acid scaffolds66. Moreover, Kim et al.67 used MIR spectral imaging to evaluate EMC growth on poly(lactic-co-glycolic acid) (PLGA) scaffolds doped with synthetic thrombin peptide (TP-508), after implantation in osteochondral defects in rabbits, assessing collagen, proteoglycan and PLGA content, and collagen integrity and orientation after 3 and 6 weeks (Figure 2).
Figure 2.
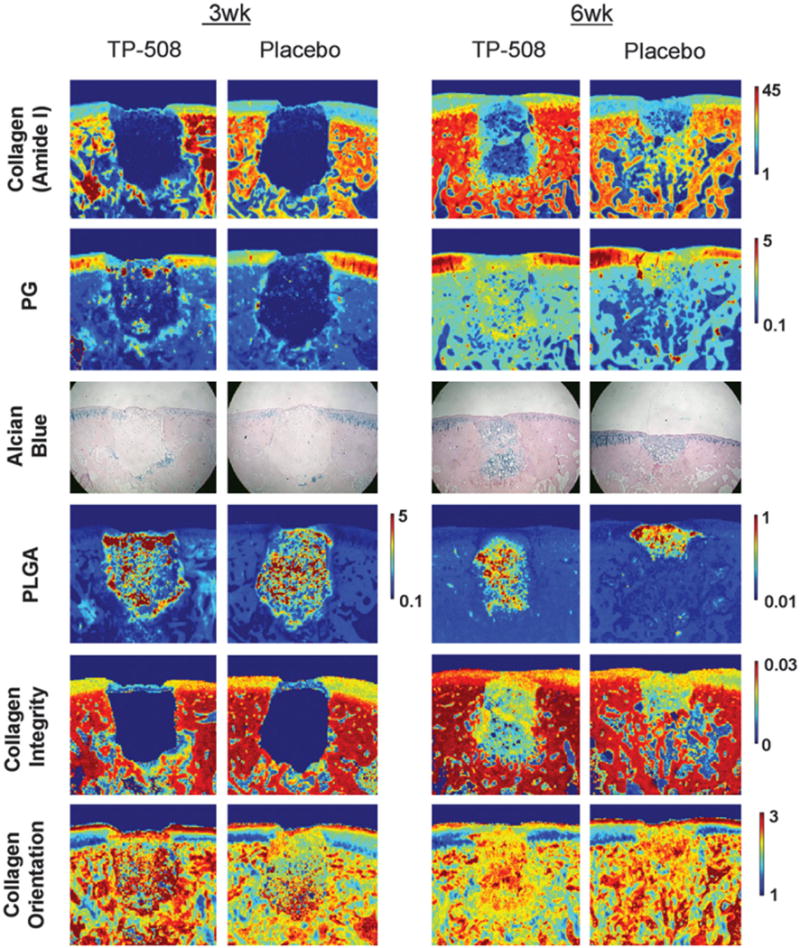
Application of mid-infrared (MIR) spectral imaging for evaluation of engineered cartilage and cartilage repair. The image from Kim et al.67 illustrates the use of MIR imaging to evaluate cartilage growth on poly(lactic-co-glycolic acid) (PLGA) scaffolds doped with synthetic thrombin peptide (TP-508) after implantation into osteochondral defects in rabbits. The authors show the use of MIR to assess collagen, proteoglycan (PG) and PLGA content, and collagen integrity and orientation, after 3 and 6 weeks in TP-508 and placebo groups. Note how MIR spectral imaging data permits a variety of information to be obtained from the same tissue section. Note also the strong correlation between the PG MIR images and the histological alcian blue stain for PG.
The MIR spectral imaging technique, although very powerful for chemical mapping, is hampered by its limited penetration depth. Non-destructive MIR measurements can only be performed with an attenuated total reflection (ATR) probe, where penetration depth is limited to approximately 2–10 μm through a sample68, making it an inherently surface biased technique. Considering the zonal heterogeneity of articular cartilage and the heterogeneous composition within engineered constructs69, 70, it is clearly desirable to have a nondestructive technique that can probe the entire thickness of the construct, and NIR spectroscopy potentially fulfills this requirement.
3.1.4 Applications of NIR to evaluation of engineered cartilage
NIR spectroscopy is based on higher energy photons than MIR and yields a greater penetration depth71, 72. Spectral signals that arise from NIR radiation are not as specific as those observed using MIR spectroscopy, and analysis of NIR data typically requires more complex methods. Previous MIR studies have successfully characterized cartilage composition using univariate or bivariate methods, e.g. intensity of a proteoglycan peak, or the ratio of the intensity of the proteoglycan peak to the intensity of the protein amide I peak. Analytical NIR spectroscopy generally requires multivariate analysis, e.g. principal component analysis (PCA) or partial least squares (PLS) regression. The absorption bands in the NIR region are overtones and combinations of the MIR fundamental vibrations of C–H, C–O, O–H and N–H bonds and are therefore appropriate for monitoring water, lipids, proteins and sugars. The main components of the cartilage ECM— water, collagen, and chondroitin sulfate (from proteoglycan) — have been identified and quantified using NIR spectroscopy with strong correlations to gold standard methods73–75. Palukuru et al.74 ascribed the peaks at 4050, 4260, 4610 and 4890 cm−1 to collagen, the peaks at 4020 and 4310 cm−1 to the sugar component of proteoglycans, and the peak at 4350–4375 cm−1 to chondroitin sulfate. They used a PLS model to predict collagen and chondroitin sulfate content of cartilage to within 8% of the values obtained by biochemical assessment. In another study, Padalkar et al.73 analyzed cartilage water, ascribing the peaks at 5200 cm−1 and 6890 cm−1 to a combination of free and bound water, and to free water only, respectively.
In the first application of NIR to engineered cartilage, Baykal et al.76 used NIR to evaluate matrix development in cartilage constructs of bovine chondrocytes grown in collagen gels by finding a positive correlation between the water peak at 5190 cm−1 and an increase in proteoglycan content based on the peak at 850 cm−1 in the MIR spectral region. Subsequently, McGoverin et al.77 demonstrated the applicability of NIR fiber optics to non-destructively monitor the growth of engineered cartilage constructs of bovine chondrocytes seeded in polyglycolic acid (PGA) scaffolds. Second derivative peak heights at 5200, 4610 and 4310 cm−1 were used to quantify water, collagen and proteoglycan content, respectively, for six weeks (Figure 3). Additionally, PLS models were established to predict component magnitudes to within 6–9% of the values obtained from gravimetric and biochemical analysis. Very recently, NIR spectroscopy was used an assessment tool for mechanical properties of engineered cartilage. Hanifi et al.78 found a significant correlation between the water, collagen and proteoglycan content quantified by NIR and the dynamic stiffness of the constructs of bovine chondrocytes grown in polyglycolic acid (PGA) scaffolds, and a negative correlation between a NIR-derived PGA peak and stiffness (Figure 4). Yousefi et al.79 used a PLS analysis of NIR spectral data to predict the dynamic modulus of developing constructs of bovine chondrocytes in hyaluronic acid scaffolds with an error of 10%. They also identified the peak centered at 4443 cm−1 as a marker of cartilage matrix formation. Moreover, the authors found that the maturation rate of the growing constructs can be assessed by the first derivative analysis of sigmoidal curve fits of NIR data for cartilage matrix content and predicted dynamic moduli.
Figure 3.
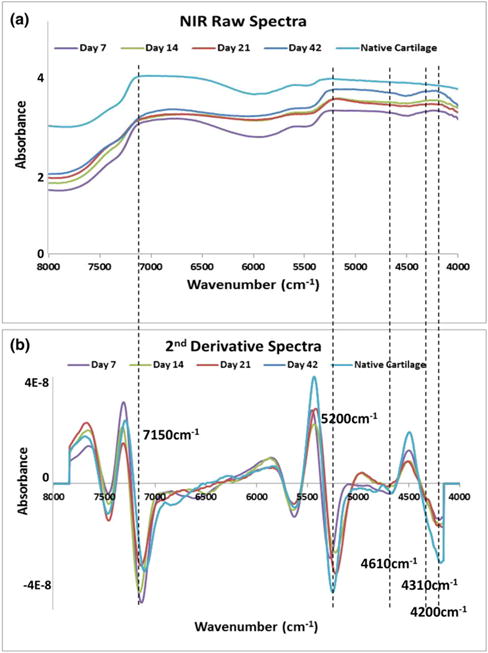
Application of NIR spectroscopy to assessment of composition of engineered cartilage. In the work from McGoverin et al.77, the authors show how NIR fiber optics can non-destructively monitor the development of engineered cartilage constructs of bovine chondrocytes seeded in polyglycolic acid (PGA) scaffolds. The authors followed the same scaffolds grown in culture for 42 days, and collected NIR spectra through the entire thickness of the scaffolds. (a) Raw NIR spectra. (b) Second derivative spectra. Peak heights at 5200, 4610 and 4310 cm−1 were used to quantify water, collagen and proteoglycan content, respectively. Spectra from native cartilage was used for comparison.
Figure 4.
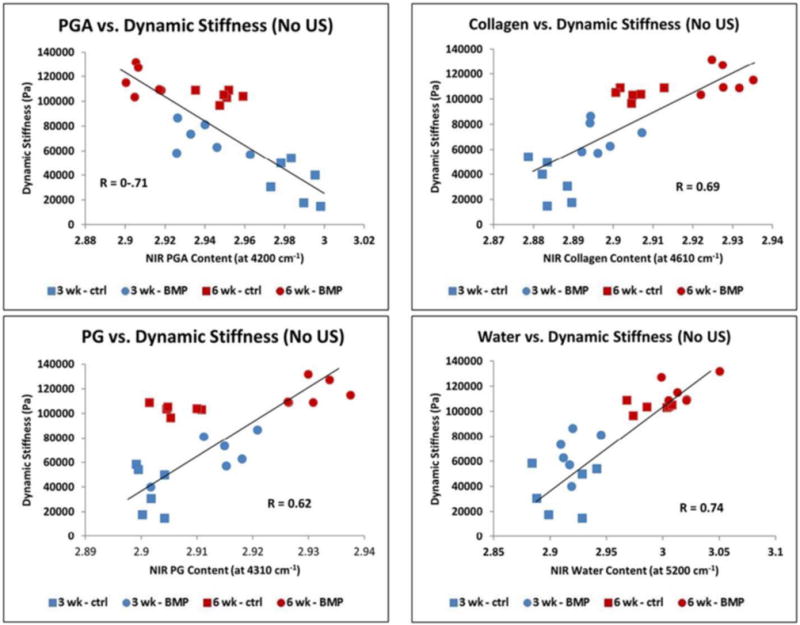
Application of NIR spectroscopy to assessment of mechanical properties of engineered cartilage. Hanifi et al.78 recently showed that NIR spectral data can non-destructively assess mechanical properties of cartilage constructs of bovine chondrocytes grown in polyglycolic acid (PGA) scaffolds. The authors found a significant positive correlation between the water, collagen and proteoglycan content quantified based on the NIR spectra and the dynamic stiffness of the constructs measured by standard mechanical testing. They also showed a negative correlation with the NIR peak of the PGA scaffold and dynamic stiffness.
The aforementioned studies highlight the effectiveness of NIR spectroscopy to nondestructively monitor the development of tissue engineered cartilage. NIR is capable of evaluating compositional and mechanical properties from growing constructs, which may be useful in prediction of the optimal implantation time. Identifying construct “readiness” will promote proper integration, functionality and successful clinical outcomes.
3.2 Bone tissue engineering
3.2.1 Composition and structure
The hallmark of bone tissue is its mineralized extracellular matrix which comprises an organic framework in intimate association with a mineral phase80, 81. The major component of the organic framework is type I collagen, with a large variety of non-collagenous proteins also present in the matrix. The mineral phase found in bone is a calcium phosphate of the apatite family, which may be seen as a biological analog of stoichiometric hydroxyapatite, whose chemical formula is Ca10(PO4)6(OH)2. Bone apatite has a series of key features that allow the proper functionality of the bones. Briefly, bone apatite may be described as a nanostructured hydroxyapatite that is poorly crystalline and non-stoichiometric, contains carbonate, HPO4, and lattice vacancies, and is deficient in Ca and OH80, 82–84. The presence of carbonate substitutions can be found in sites of OH (type A substitution) and phosphate (type B substitution). Water is also a major component of the bone matrix. The presence of water in bone mineral has been described both within the apatite crystal lattice85, 86 and on the surface of the crystals, possibly forming a hydrated layer with labile ions83, 87. In fact, this hydrated layer was shown to comprise an amorphous calcium phosphate-like phase that coats the apatite crystalline core and plays a role in bone nanostructure88, 89.
3.2.2 Analytical challenges in bone tissue engineering
Bone formation on tissue engineering scaffolds is generally evaluated by histological staining. Although staining methods can assess the presence of mineralization, they cannot identify the mineral phase composition. For instance, the von Kossa and Alizarin Red stains, the two most commonly used staining methods for bone mineral deposits, are not specific to apatite90–92. Further, the formation of non-osteogenic dystrophic bone matrix may be directed by several aspects involved in tissue engineering approaches, such as cell sources, scaffolds, and presence of inflammatory cytokines and ions in the environment93–97. Thus, it is critical to evaluate the bone mineral and matrix using more specific molecular assays, particularly in tissue engineering constructs, where the nature of the mineral and matrix phases will impact the function, osseointegration, and success of the implants.
3.2.3 Applications of MIR to evaluation of engineered bone
The use of MIR spectroscopy and imaging may be considered a key approach in the evaluation of engineered bone tissue constructs. Several detailed features of bone mineral and matrix can be readily accessed by the peaks in the MIR spectra. For instance, the presence of typical bone apatite in the matrix can be identified by specific peaks of phosphate and carbonate98–100. The triply degenerate ν3PO4 domain appears as a broad band with a maxima around 1030 cm−1 and a discrete shoulder around 1095 cm−1; the nondegenerate ν1PO4 domain is seen as a weak peak around 961 cm−1, partially overlapped with the ν3PO4 band; and the triply degenerate ν4PO4 domain is partially resolved into two distinct peaks around 604 and 563 cm−1. Carbonate domains appeared as noticeable bands for ν3CO3 with peaks from around 1550–1414 cm−1 and ν2CO3 around 875 cm−1, which have been shown to increase with tissue age41. Due to the poorly crystalline nature of bone apatite, most of these peaks are broad and somewhat overlapped, but can be resolved by taking the second derivative of the spectra or by processing them by curve-fitting or deconvolution. With a better resolution of the peaks, further features of bone mineral can be accessed. An immature bone apatite will show the ν3PO4 peak maxima closer to 1020 cm−1 and a more pronounced peak of HPO4 around 1110 cm−1, which are associated with nonstoichiometric apatite present in early stages of bone formation98, 101. The presence of carbonate substitutions types A and B in the mineral can be verified by specific peaks in the carbonate bands, such as 879 and 1550 cm−1 for type A and 871 and 1414 cm−1 for type B. Other than peaks from the mineral phase, peptide bonds from bone matrix proteins can also be seen in the MIR spectra, with peaks of amide I, II, and III appearing around 1650, 1540, and 1240 cm−1, respectively. The presence of collagen can be specifically seen by the peak from CH2 side chain vibrations at 1338 cm−1 102. Peaks of OH are generally not observed in the MIR spectra of bone apatite, possible due to the significant OH deficiency of the mineral and its nanocrystalline structure103, 104.
In addition to identification of bone mineral and matrix components, several other important features of bone tissue can be quantified and imaged based on the MIR peaks41, 100, 105. The mineral content of the matrix, which reflects its degree of mineralization, can be measured by the integrated intensity of the phosphate peak relative to that of the amide peak. Similarly, the content of carbonate and HPO4 in bone apatite can be evaluated by the ratio of those specific peaks to that of phosphate. Based on the relative amount of HPO4, an index for mineral maturity may be calculated by the 1030/1110 cm−1 peak area ratio101. The crystallinity of the mineral may be accessed by different approaches, such as measuring the 1030/1020 cm−1 peak area ratio41, the splitting factor of the ν4PO4 peaks106, or the broadening of the 604 cm−1 phosphate peak101. Collagen content can be analyzed based on the intensity of the 1338 cm−1 peak, while collagen maturity may be estimated by the 1660/1690 cm−1 area ratio of the sub-bands of the amide I peak41. The standard method to analyze enzymatic cross-links is high performance liquid chromatography (HPLC), which requires the tissues to be digested and homogenized, whereas MIR spectroscopy and imaging show an important advantage in allowing a spatial distribution of collagen maturity to be obtained in the mineralized bone tissue. The distribution of collagen orientation can also be mapped based on MIR peaks, with the amide I/amide II peak area ratio used to indicate the alignment of the fibril arrays107, which is essential in the hierarchal structure of bone81.
MIR spectroscopy and imaging show great potential to reveal essential features of the mineralized bone matrix produced by cells in engineered constructs. Although this approach has yet to become widespread in tissue engineering, several groups have applied MIR analysis to evaluate details of the mineral and matrix produced in engineered bone tissue and constructs. For instance, MIR methods have been used to evaluate the bioactivity of acellular scaffolds by accessing the degree of apatite precipitation on them after immersion in physiological solutions, based on the presence and relative intensity of the ν3PO4 band108–111. MIR spectroscopy has also been shown as a valuable analytical tool to reveal several properties of the mineralized matrix produced by osteogenic cells in cell culture systems112–115. This also includes the analyses of the mineral and matrix produced during treatment with osteogenic factors and drugs116–119. Interestingly, MIR analyses have also made significant contributions to the evaluation of the bone matrix produced by cells grown on bone tissue engineering scaffolds and substrates. For instance, MIR spectroscopy was a valuable tool to evaluate how the matrix could be affected by different surface topographies of Ti substrates during osteogenic treatment with dexamethasone or BMP-2120 or strontium ranelate121. In particular, Boyan et al.120 showed by MIR imaging that in some substrates there was the formation of bone-like apatite, and that the mineral was closely associated with the matrix, whereas in other substrates, there was a dystrophic mineralization without apatite formation, and the mineral was not associated with the matrix. MIR spectroscopy has also been a valuable method to analyze the formation and degree of mineralization of bone matrix in different types of 3D scaffolds, based on the intensity of the ν3PO4 band (Figure 5)122–125. For instance, FTIR spectroscopy and imaging have been used to detect bone-like mineralization formed by embryonic stem cells grown in 3D alginate constructs under osteogenic conditions126, 127. In addition, MIR analyses have also been useful to evaluate bone formation and mineralization on scaffolds after implantation in animals. For example, Rossi et al.128 used MIR spectroscopy to analyze changes caused by the biological environment in hydroxyapatite-alginate spheres after implantation in bone defects in rats, while Miri et al.111 used it to describe the progressive mineralization potential of dense collagen-Bioglass gel scaffolds injected subcutaneously in rats. Sroka-Bartnicka et al.129 showed several features of the bone tissue formed around carbon hydroxyapatite/β-glucan scaffolds after implantation in rabbit bone defects, such as the spatial distribution of amides, lipids, phosphate, and collagen cross-linking maturity, using MIR spectral imaging (Figure 6).
Figure 5.
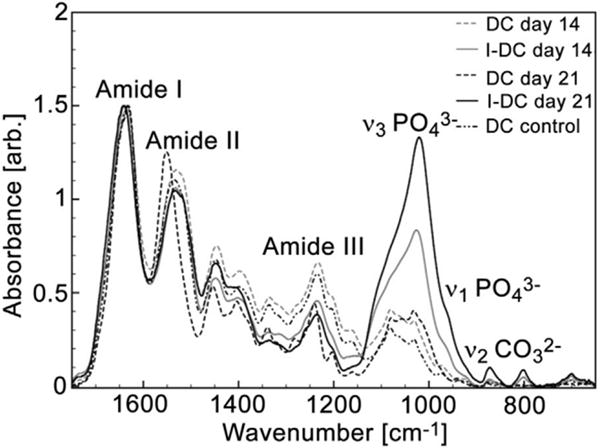
Application of MIR spectroscopy to bone tissue engineering. The image from Marelli et al.125 shows the use of MIR spectroscopy to analyze the bone matrix produced by murine mesenchymal stem cells grown in dense collagen (DC) and injectable dense collagen (I-DC) hydrogels. The authors used MIR in attenuated total reflection (ATR) mode to evaluate the intensity of the ν3PO4 band (relative to amide I) as an indication of bone mineral formation. The spectra show the absence of mineral peaks in DC scaffolds and a progressive mineralization in I-DC scaffolds after 14 and 21 days of cell culture.
Figure 6.
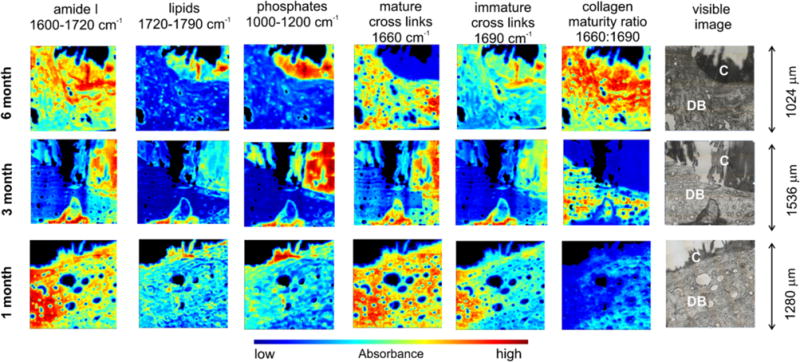
Application of MIR spectral imaging to bone tissue engineering. Sroka-Bartnicka et al.129 demonstrated the usefulness of MIR spectral imaging to quantify and image several features of bone tissue formed around engineered constructs. The authors analyzed the tissue formed around carbon hydroxyapatite/β-glucan scaffolds after implantation into rabbit bone defects for different lengths of time. The spatial distribution of proteins, lipids, phosphate, and collagen cross-linking maturity was assessed. In the visible image, C is the construct and DB is the surrounding demineralized bone.
4 Raman spectroscopy and tissue engineering
Complementary to MIR and NIR spectroscopy, Raman spectroscopy holds considerable potential as both a qualitative and quantitative biochemical analysis tool for tissue engineering in view of its non-destructive nature and minimal to no sample preparation. The Raman effect, otherwise known as inelastic light scattering, to be very useful for obtaining chemical and compositional information from biological samples130. A primary advantage of Raman for tissue engineering applications is the ability to be used for non-invasive characterization, which arises in part from its physiologically relevant penetration depth. However, due to the weak signal strength inherent to most biological samples, the primary disadvantage of Raman spectroscopy is the need for high laser power and long exposure times, which are potentially harmful to the samples. Additionally, it is paramount to use TE scaffolds that do not generate high fluorescence and unwanted background peaks, as the choice of biomaterial influences the spectral quality and detection accuracy of Raman spectroscopy131.
The Raman absorbances that are prominent in bone and cartilage are described by Morris and Mandair132 for bone and by Mansfield et al.133, Bonifacio et al.134 and Esmonde-White135 for articular cartilage. Similar to the MIR, the primary Raman scattering intensities arise from proteins, lipids and mineral. However, applications to tissue engineering are fewer compared to those that utilize MIR for analysis. Liao et al.136 published a study on spatially offset Raman spectroscopy (SORS) for in vitro monitoring of bone tissue engineered scaffolds. The authors used SORS to assess hydroxyapatite (HA) deposition on two commonly used scaffolds in bone tissue engineering: (i) bioactive glass foams (IEIC16) and (ii) 3D printed poly(lactic-co-glycolic acid) scaffolds (PLGA). Spectral depth profiles of intact scaffolds were collected, and to mimic transcutaneous in vivo studies, the scaffolds were layered with fresh chicken skin. They achieved non-destructive measures and localization of HA by examining the intensity of the Raman bands corresponding to the scaffolds and HA. The most intense band in the Raman spectrum for HA corresponded to the PO4 symmetric stretching at 962 cm−1, for the PLGA scaffold the C−COO stretch vibration at 872 cm−1, and for the bioactive glass foam scaffold, the spectra were dominated by a broad photoluminescence band in the 1200–2000 cm−1 range136. The formation of a hydroxyapatite layer is a precursor to bone bonding, and thus HA deposition can be used a measure of success for bone tissue engineering.
Recently, Borkowski et al.137 published a study in which tissue engineered bone was evaluated post-implantation in rabbits’ tibiae. Raman spectroscopy was used to investigate non-decalcified bone/implant sections and determine the presence of amides, lipids and assign areas of newly formed bone tissue. The tissue engineered bone was made on a novel ceramic-polymer composite of carbonate-substituted hydroxyapatite (CHAP) and β-1,3-glucan implanted on a critical size defect 4 mm in diameter and 6 mm in length. For Raman, 2-mm sections were made between the newly formed tissue and implanted composite and used to collect spectra from non-decalcified bones. Borkowski et al.137 found that newly formed bone mineralized from the edge of the defect inward. Spectra collected from this area were used to estimate the degree of mineralization using the relative intensity of PO4 at 960 cm−1 which revealed differences in phosphate content. Moreover, they described that the new bone formed adjacent to the native cortical bone presented a higher band at 1003 cm−1, indicative of HPO4 in the immature recently formed tissue. The layer immediately following this new bone exhibited only bands assigned for collagen at 1000–1260 cm−1 (amide III) and 1656 cm−1 (amide I) and for lipids at 1744 cm−1. The discussed publications emphasize the potential for Raman spectroscopy as an analysis tool in bone tissue engineering.
Bergholt et al.138 published a study in which Raman spectroscopy was used to gain insight on the extracellular matrix arrangement of tissue engineered articular cartilage. Articular cartilage constructs were generated by culturing bovine chondrocytes in hydrophilic polytetrafluoroethylene (PTFE) membranes, and constructs were evaluated by Raman spectroscopy, using multivariate curve resolution (MCR) analysis to extract pure Raman spectra for water, GAG and collagen, based primarily on the peaks at 3400, 1410, and 1245 cm−1, respectively. Standard histological assessment of hematoxylin and eosin (H&E), alcian blue for sulfated GAG, and picrosirius red for collagen was also done for comparison. The authors reported the use of Raman spectroscopy to quantify and image collagen, GAG and water distributions in the engineered constructs (Figure 7). Kunstar et al.139 reported on the use of Raman for monitoring extracellular matrix components in tissue engineered cartilage in addition to biochemical and histological analysis. Poly (ethylene oxide terephthalate)/poly (butylene terephthalate) scaffolds were seeded with primary bovine chondrocytes and evaluated at 7 and 21 days of culture. Constructs were subdivided for either a semiconfocal/confocal Raman microspectroscopy study or a fiber-optic Raman study to investigate single cell versus microaggregate cell seeding conditions and subsequent ECM production. Mean Raman spectra indicated increased intensities at bands 937 and 1062 cm−1 from day 7 to day 21 culture time, which correspond to collagen and proteoglycans within the pores of the three-dimensional tissue engineered construct.
Figure 7.
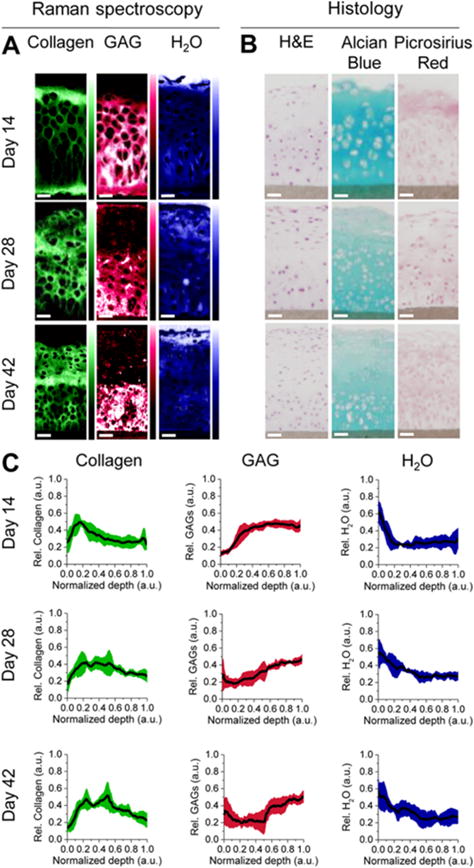
Raman spectroscopy in tissue engineering. The image from Bergholt et al.138 shows how Raman spectroscopy and imaging can be used to analyze engineered cartilage constructs of bovine chondrocytes cultured in hydrophilic polytetrafluoroethylene (PTFE) membranes. (A) Raman spectroscopy was used to image the distribution of collagen, glycosaminoglycans (GAG) and water in the constructs, using multivariate curve resolution (MCR) analysis to extract pure Raman spectra for water, GAG and collagen, based primarily on the peaks at 3400, 1410, and 1245 cm−1, respectively. (B) The constructs were also analyzed by standard histological staining of hematoxylin and eosin (H&E), alcian blue for sulfated GAG, and picrosirius red for collagen, for comparison. (C) The depth profiles of relative content of collagen, GAG and water can also be determined based on the Raman imaging of the engineered constructs.
The examples presented herein illustrate the practical use of Raman spectroscopy as an assessment tool for tissue engineered constructs both for in vivo and in vitro assessments.
5 Concluding remarks
This review described some of the challenges in tissue engineering, limitations of current methods for tissue engineered construct evaluation, and the role of vibrational spectroscopy methods (mid-infrared, near-infrared and Raman) for assessment of construct composition both pre- and post-implantation. Spectroscopic analysis modalities are a compelling alternative to standard evaluations due to their inherent contrast-free nature, the ability to investigate extracellular matrix and scaffold remodeling, and the potential for non-destructive evaluations in some applications. To date, vibrational spectroscopy has primarily been used for engineered cartilage and bone applications, but clearly has great potential for use in development of many other engineered tissues. The main challenge in the use of FTIR and Raman spectroscopy for tissue engineering applications is related to the acquisition and processing of large data sets, which can be complex and require advanced expertise and analytical approaches. In particular, the choice of experimental settings, sampling mode, and data analysis are not always straightforward, and need to be optimized and validated to obtain high quality spectra and reliable data. The development of advanced variants of vibrational spectroscopy, such as mid-infrared quantum cascade lasers (QCLs)140, near-infrared spatially resolved spectroscopy (SRS)141, and coherent anti-Stokes Raman spectroscopy (CARS)142, may in the future lead to even greater advances to the use of vibrational spectroscopy in the tissue engineering field.
Acknowledgments
This work was supported by NIH R01AR056145
References
- 1.Langer R, Vacanti JP. Science. 1993;260:920–926. doi: 10.1126/science.8493529. [DOI] [PubMed] [Google Scholar]
- 2.U.-U. N. f. O. Sharing. UNOS annual report. https://www.unos.org/about/annual-report/, (accessed June 14 2017, 2017)
- 3.Song LJ, Murphy SV, Yang B, Xu YM, Zhang YY, Atala A. Tissue Engineering Part B-Reviews. 2014;20:163–172. doi: 10.1089/ten.TEB.2013.0103. [DOI] [PubMed] [Google Scholar]
- 4.Kawecki M, Łabuś W, Klama-Baryla A, Kitala D, Kraut M, Glik J, Misiuga M, Nowak M, Bielecki T, Kasperczyk A. J Biomed Mater Res B Appl Biomater. 2017 doi: 10.1002/jbm.b.33865. [DOI] [PubMed] [Google Scholar]
- 5.Consolo F, Brizzola S, Tremolada G, Grieco V, Riva F, Acocella F, Fiore GB, Soncini M. Journal of Tissue Engineering and Regenerative Medicine. 2016;10:E101–E112. doi: 10.1002/term.1767. [DOI] [PubMed] [Google Scholar]
- 6.Gunatillake P, Mayadunne R, Adhikari R. Biotechnology Annual Review, Vol 12. 2006;12:301–347. doi: 10.1016/S1387-2656(06)12009-8. [DOI] [PubMed] [Google Scholar]
- 7.Dhandayuthapani B, Yoshida Y, Maekawa T, Kumar DS. International Journal of Polymer Science. 2011 [Google Scholar]
- 8.Doty AC, Weinstein DG, Hirota K, Olsen KF, Ackermann R, Wang Y, Choi S, Schwendeman SP. J Control Release. 2017;256:19–25. doi: 10.1016/j.jconrel.2017.03.031. [DOI] [PubMed] [Google Scholar]
- 9.Hench LL. Journal of Materials Science-Materials in Medicine. 2015:26. doi: 10.1007/s10856-015-5425-3. [DOI] [PubMed] [Google Scholar]
- 10.Marcacci M, Kon E, Moukhachev V, Lavroukov A, Kutepov S, Quarto R, Mastrogiacomo M, Cancedda R. Tissue Engineering. 2007;13:947–955. doi: 10.1089/ten.2006.0271. [DOI] [PubMed] [Google Scholar]
- 11.Geistlich and P. N. A. Inc. Bone substitute devices. https://www.geistlich-na.com/en-us/about-us/north-america/quality-safety/bone-substitute-devices/, (accessed June 14 2017, 2017)
- 12.Synthes D. DBX® Demineralized Bone Matrix - Trauma. https://www.depuysynthes.com/hcp/biomaterials/products/qs/dbx-demineralized-bone-matrix, (accessed June 14 2014, 2017)
- 13.Oryan A, Alidadi S, Moshiri A, Maffulli N. Journal of Orthopaedic Surgery and Research. 2014:9. doi: 10.1186/1749-799X-9-18. [DOI] [PMC free article] [PubMed] [Google Scholar]
- 14.El-Sherbiny IM, Yacoub MH. Glob Cardiol Sci Pract. 2013;2013:316–342. doi: 10.5339/gcsp.2013.38. [DOI] [PMC free article] [PubMed] [Google Scholar]
- 15.Vega SL, Kwon MY, Burdick JA. European Cells & Materials. 2017;33:59–75. doi: 10.22203/eCM.v033a05. [DOI] [PMC free article] [PubMed] [Google Scholar]
- 16.Snyder TN, Madhavan K, Intrator M, Dregalla RC, Park D. Journal of Biological Engineering. 2014:8. doi: 10.1186/1754-1611-8-10. [DOI] [PMC free article] [PubMed] [Google Scholar]
- 17.Chung C, Burdick JA. Tissue Engineering Part A. 2009;15:243–254. doi: 10.1089/ten.tea.2008.0067. [DOI] [PMC free article] [PubMed] [Google Scholar]
- 18.I. LifeSciences. Product catalog. http://www.integralife.com/index.aspx?redir=products, (accessed June 14 2017, 2017)
- 19.Nair RP, Joseph J, Harikrishnan VS, Krishnan VK, Krishnan L. Biores Open Access. 2014;3:217–225. doi: 10.1089/biores.2014.0023. [DOI] [PMC free article] [PubMed] [Google Scholar]
- 20.Freed LE, Vunjak-Novakovic G, Biron RJ, Eagles DB, Lesnoy DC, Barlow SK, Langer R. Biotechnology. 1994;12:689. doi: 10.1038/nbt0794-689. [DOI] [PubMed] [Google Scholar]
- 21.Farndale RW, Buttle DJ, Barrett AJ. Biochimica et Biophysica Acta (BBA) - General Subjects. 1986;883:173. doi: 10.1016/0304-4165(86)90306-5. [DOI] [PubMed] [Google Scholar]
- 22.Woessner JF., Jr Archives of Biochemistry and Biophysics. 1961;93:440. doi: 10.1016/0003-9861(61)90291-0. [DOI] [PubMed] [Google Scholar]
- 23.Tuemen M, Nguyen DVA, Raffius J, Flanagan TC, Dietrich M, Frese J, Schmitz-Rode T, Jockenhoevel S. Annals of Biomedical Engineering. 2013;41:883. doi: 10.1007/s10439-012-0734-x. [DOI] [PubMed] [Google Scholar]
- 24.Riesle J, Hollander AP, Langer R, Freed LE, Vunjak-Novakovic G. Journal of Cellular Biochemistry. 1998;71:313. doi: 10.1002/(sici)1097-4644(19981201)71:3<313::aid-jcb1>3.0.co;2-c. [DOI] [PubMed] [Google Scholar]
- 25.Kiernan JA. Histological and Histochemical Methods: Theory and Practice, Scion Publishing Limited. 2008 [Google Scholar]
- 26.Vunjak-Novakovic G, Freshney RI. Culture of Cells for Tissue Engineering, John Wiley & Sons Inc. 2006 [Google Scholar]
- 27.Radisic M, Yang L, Boublik J, Cohen RJ, Langer R, Freed LE, Vunjak-Novakovic G. Am J Physiol Heart Circ Physiol. 2004;286:H507. doi: 10.1152/ajpheart.00171.2003. [DOI] [PubMed] [Google Scholar]
- 28.Armstrong JPK, Shakur R, Horne JP, Dickinson SC, Armstrong CT, Lau K, Kadiwala J, Lowe R, Seddon A, Mann S, Anderson JLR, Perriman AW, Hollander AP. 2015;6:7405. doi: 10.1038/ncomms8405. [DOI] [PMC free article] [PubMed] [Google Scholar]
- 29.Jayash SN, Hashim NM, Misran M, Baharuddin NA. Journal of Biomedical Materials Research Part A. 2017;105:398. doi: 10.1002/jbm.a.35919. [DOI] [PubMed] [Google Scholar]
- 30.Jensen EC. The Anatomical Record. 2013;296:378. doi: 10.1002/ar.22641. [DOI] [PubMed] [Google Scholar]
- 31.Kadner A, Zund G, Maurus C, Breymann C, Yakarisik S, Kadner G, Turina M, Hoerstrup SP. European Journal of Cardio-Thoracic Surgery. 2004;25:635. doi: 10.1016/j.ejcts.2003.12.038. [DOI] [PubMed] [Google Scholar]
- 32.Irrechukwu ON, Lin PC, Fritton K, Doty S, Pleshko N, Spencer RG. Tissue Engineering Part A. 2011;17:407–415. doi: 10.1089/ten.tea.2010.0187. [DOI] [PMC free article] [PubMed] [Google Scholar]
- 33.Georgakoudi I, Rice WL, Hronik-Tupaj M, Kaplan DL. Tissue Engineering Part B-Reviews. 2008;14:321–340. doi: 10.1089/ten.teb.2008.0248. [DOI] [PMC free article] [PubMed] [Google Scholar]
- 34.Xuan JW, Bygrave M, Jiang HY, Valiyeva F, Dunmore-Buyze J, Holdsworth DW, Izawa JI, Bauman G, Moussa M, Winter SF, Greenberg NM, Chin JL, Drangova M, Fenster A, Lacefield JC. Cancer Research. 2007;67:2830–2839. doi: 10.1158/0008-5472.CAN-06-3944. [DOI] [PubMed] [Google Scholar]
- 35.Muller B, Beckmann F, Huser M, Maspero F, Szekely G, Ruffieux K, Thurner P, Wintermantel E. Biomolecular Engineering. 2002;19:73–78. doi: 10.1016/s1389-0344(02)00014-x. [DOI] [PubMed] [Google Scholar]
- 36.Potter HG, Black BR, Chong LR. Clinics in Sports Medicine. 2009;28:77–+. doi: 10.1016/j.csm.2008.08.004. [DOI] [PubMed] [Google Scholar]
- 37.Reiter DA, Irrechukwu O, Lin PC, Moghadam S, Von Thaer S, Pleshko N, Spencer RG. Nmr in Biomedicine. 2012;25:476–488. doi: 10.1002/nbm.1804. [DOI] [PMC free article] [PubMed] [Google Scholar]
- 38.Mahmoudifar N, Doran PM. Trends in Biotechnology. 2012;30:166–176. doi: 10.1016/j.tibtech.2011.09.002. [DOI] [PubMed] [Google Scholar]
- 39.Appel AA, Anastasio MA, Larson JC, Brey EM. Biomaterials. 2013;34:6615–6630. doi: 10.1016/j.biomaterials.2013.05.033. [DOI] [PMC free article] [PubMed] [Google Scholar]
- 40.Diem M, Romeo M, Boydston-White S, Miljkovic M, Matthaus C. Analyst. 2004;129:880–885. doi: 10.1039/b408952a. [DOI] [PMC free article] [PubMed] [Google Scholar]
- 41.Boskey A, Camacho NP. Biomaterials. 2007;28:2465–2478. doi: 10.1016/j.biomaterials.2006.11.043. [DOI] [PMC free article] [PubMed] [Google Scholar]
- 42.Miller LM, Dumas P. Current Opinion in Structural Biology. 2010;20:649–656. doi: 10.1016/j.sbi.2010.07.007. [DOI] [PMC free article] [PubMed] [Google Scholar]
- 43.Baker MJ, Trevisan J, Bassan P, Bhargava R, Butler HJ, Dorling KM, Fielden PR, Fogarty SW, Fullwood NJ, Heys KA, Hughes C, Lasch P, Martin-Hirsch PL, Obinaju B, Sockalingum GD, Sule-Suso J, Strong RJ, Walsh MJ, Wood BR, Gardner P, Martin FL. Nature Protocols. 2014;9:1771–1791. doi: 10.1038/nprot.2014.110. [DOI] [PMC free article] [PubMed] [Google Scholar]
- 44.Chan KLA, Kazarian SG. Chemical Society Reviews. 2016;45:1850–1864. doi: 10.1039/c5cs00515a. [DOI] [PubMed] [Google Scholar]
- 45.O Y, Siesler HW, Kawata S, H H. Near-infrared spectroscopy: principles, instruments, applications. John Wiley & Sons; 2008. [Google Scholar]
- 46.K D, Aenugu HPR, Parthiban SN, Ghosh S, Banji D. Int J ChemTech Res. 2011;3:11. [Google Scholar]
- 47.Turker-Kaya S, Huck CW. Molecules. 2017:22. doi: 10.3390/molecules22010168. [DOI] [PMC free article] [PubMed] [Google Scholar]
- 48.Karbasi S, Fekrat F, Semnani D, Razavi S, Zargar EN. Adv Biomed Res. 2016;5:180. doi: 10.4103/2277-9175.194802. [DOI] [PMC free article] [PubMed] [Google Scholar]
- 49.Revati R, Majid MSA, Ridzuan MM, Normahira M, Nasir NFM, Rahman YMN, Gibson AG. Materials Science & Engineering C-Materials for Biological Applications. 2017;75:752–759. doi: 10.1016/j.msec.2017.02.127. [DOI] [PubMed] [Google Scholar]
- 50.Lynch B, Crawford K, Baruti O, Abdulahad A, Webster M, Puetzer J, Ryu C, Bonassar LJ, Mendenhall J. J Biomed Mater Res B Appl Biomater. 2016 doi: 10.1002/jbm.b.33705. [DOI] [PubMed] [Google Scholar]
- 51.Shi P, Wang Q, Yu C, Fan F, Liu M, Tu M, Lu W, Du M. Colloids Surf B Biointerfaces. 2017;155:477–486. doi: 10.1016/j.colsurfb.2017.04.042. [DOI] [PubMed] [Google Scholar]
- 52.Beladi F, Saber-Samandari S. Materials Science & Engineering C-Materials for Biological Applications. 2017;75:385–392. doi: 10.1016/j.msec.2017.02.040. [DOI] [PubMed] [Google Scholar]
- 53.Rai R, Tallawi M, Barbani N, Frati C, Madeddu D, Cavalli S, Graiani G, Quaini F, Roether JA, Schubert DW, Rosellini E, Boccaccini AR. Materials Science & Engineering C-Materials for Biological Applications. 2013;33:3677–3687. doi: 10.1016/j.msec.2013.04.058. [DOI] [PubMed] [Google Scholar]
- 54.Qazi TH, Rai R, Dippold D, Roether JE, Schubert DW, Rosellini E, Barbani N, Boccaccini AR. Acta Biomaterialia. 2014;10:2434–2445. doi: 10.1016/j.actbio.2014.02.023. [DOI] [PubMed] [Google Scholar]
- 55.Nayak KK, Gupta P. International Journal of Biological Macromolecules. 2015;81:1–10. doi: 10.1016/j.ijbiomac.2015.07.025. [DOI] [PubMed] [Google Scholar]
- 56.Park YR, Ju HW, Lee JM, Kim DK, Lee OJ, Moon BM, Park HJ, Jeong JY, Yeon YK, Park CH. International Journal of Biological Macromolecules. 2016;93:1567–1574. doi: 10.1016/j.ijbiomac.2016.07.047. [DOI] [PubMed] [Google Scholar]
- 57.Liu Y, Lv HL, Ren L, Xue GH, Wang YJ. Journal of Biomaterials Science-Polymer Edition. 2016;27:758–772. doi: 10.1080/09205063.2016.1160561. [DOI] [PubMed] [Google Scholar]
- 58.Kim DK, Sim BR, Khang G. Acs Applied Materials & Interfaces. 2016;8:15160–15168. doi: 10.1021/acsami.6b04901. [DOI] [PubMed] [Google Scholar]
- 59.Rohman G, Pettit JJ, Isaure F, Cameron NR, Southgate J. Biomaterials. 2007;28:2264–2274. doi: 10.1016/j.biomaterials.2007.01.032. [DOI] [PubMed] [Google Scholar]
- 60.Poole AR, Kojima T, Yasuda T, Mwale F, Kobayashi M, Laverty S. Clinical Orthopaedics and Related Research. 2001:S26–S33. doi: 10.1097/00003086-200110001-00004. [DOI] [PubMed] [Google Scholar]
- 61.Sophia Fox AJ, Bedi A, Rodeo SA. Sports Health. 2009;1:461–468. doi: 10.1177/1941738109350438. [DOI] [PMC free article] [PubMed] [Google Scholar]
- 62.Rieppo L, Toyras J, Saarakkala S. Applied Spectroscopy Reviews. 2017;52:249–266. [Google Scholar]
- 63.Camacho NP, West P, Torzilli PA, Mendelsohn R. Biopolymers. 2001;62:1–8. doi: 10.1002/1097-0282(2001)62:1<1::AID-BIP10>3.0.CO;2-O. [DOI] [PubMed] [Google Scholar]
- 64.Potter K, Kidder LH, Levin IW, Lewis EN, Spencer RGS. Arthritis and Rheumatism. 2001;44:846–855. doi: 10.1002/1529-0131(200104)44:4<846::AID-ANR141>3.0.CO;2-E. [DOI] [PubMed] [Google Scholar]
- 65.Kim M, Bi XH, Horton WE, Spencer RG, Camacho NP. Journal of Biomedical Optics. 2005:10. doi: 10.1117/1.1922329. [DOI] [PubMed] [Google Scholar]
- 66.Kim M, Erickson IE, Choudhury M, Pleshko N, Mauck RL. Journal of the Mechanical Behavior of Biomedical Materials. 2012;11:92–101. doi: 10.1016/j.jmbbm.2012.03.006. [DOI] [PMC free article] [PubMed] [Google Scholar]
- 67.Kim M, Foo LF, Uggen C, Lyman S, Ryaby JT, Moynihan DP, Grande DA, Potter HG, Pleshko N. Tissue Engineering Part C-Methods. 2010;16:355–364. doi: 10.1089/ten.tec.2009.0020. [DOI] [PMC free article] [PubMed] [Google Scholar]
- 68.O’Brien MP, Penmatsa M, Palukuru U, West P, Yang X, Bostrom MPG, Freeman T, Pleshko N. Cartilage. 2015;6:174–184. doi: 10.1177/1947603515572874. [DOI] [PMC free article] [PubMed] [Google Scholar]
- 69.Bursac PM, Freed LE, Biron RJ, Vunjak-Novakovic G. Tissue Eng. 1996;2:141–150. doi: 10.1089/ten.1996.2.141. [DOI] [PubMed] [Google Scholar]
- 70.Khan AA, Suits JMT, Kandel RA, Waldman SD. Biotechnology Progress. 2009;25:508–515. doi: 10.1002/btpr.108. [DOI] [PubMed] [Google Scholar]
- 71.Afara I, Singh S, Oloyede A. Medical Engineering & Physics. 2013;35:88–95. doi: 10.1016/j.medengphy.2012.04.003. [DOI] [PubMed] [Google Scholar]
- 72.Padalkar MV, Pleshko N. Analyst. 2015;140:2093–2100. doi: 10.1039/c4an01987c. [DOI] [PMC free article] [PubMed] [Google Scholar]
- 73.Padalkar MV, Spencer RG, Pleshko N. Annals of Biomedical Engineering. 2013;41:2426–2436. doi: 10.1007/s10439-013-0844-0. [DOI] [PMC free article] [PubMed] [Google Scholar]
- 74.Palukuru UP, McGoverin CM, Pleshko N. Matrix Biology. 2014;38:3–11. doi: 10.1016/j.matbio.2014.07.007. [DOI] [PubMed] [Google Scholar]
- 75.Palukuru UP, Hanifi A, McGoverin CM, Devlin S, Lelkes PI, Pleshko N. Analytica Chimica Acta. 2016;926:79–87. doi: 10.1016/j.aca.2016.04.031. [DOI] [PMC free article] [PubMed] [Google Scholar]
- 76.Baykal D, Irrechukwu O, Lin PC, Fritton K, Spencer RG, Pleshko N. Applied Spectroscopy. 2010;64:1160–1166. doi: 10.1366/000370210792973604. [DOI] [PMC free article] [PubMed] [Google Scholar]
- 77.McGoverin CM, Hanifi A, Palukuru UP, Yousefi F, Glenn PBM, Shockley M, Spencer RG, Pleshko N. Annals of Biomedical Engineering. 2016;44:680. doi: 10.1007/s10439-015-1536-8. [DOI] [PMC free article] [PubMed] [Google Scholar]
- 78.Hanifi A, Palukuru U, McGoverin C, Shockley M, Frank E, Grodzinsky A, Spencer RG, Pleshko N. Analyst. 2017;142:1320–1332. doi: 10.1039/c6an02167k. [DOI] [PMC free article] [PubMed] [Google Scholar]
- 79.Yousefi F, Kim M, Nahri SY, Mauck RL, Pleshko N. Tissue Eng Part A. 2017 doi: 10.1089/ten.tea.2017.0035. [DOI] [PMC free article] [PubMed] [Google Scholar]
- 80.Pasteris JD, Wopenka B, Valsami-Jones E. Elements. 2008;4:97–104. [Google Scholar]
- 81.Reznikov N, Shahar R, Weiner S. Acta Biomaterialia. 2014;10:3815–3826. doi: 10.1016/j.actbio.2014.05.024. [DOI] [PubMed] [Google Scholar]
- 82.Wopenka B, Pasteris JD. Materials Science & Engineering C-Biomimetic and Supramolecular Systems. 2005;25:131–143. [Google Scholar]
- 83.Rey C, Combes C, Drouet C, Glimcher MJ. Osteoporosis International. 2009;20:1013–1021. doi: 10.1007/s00198-009-0860-y. [DOI] [PMC free article] [PubMed] [Google Scholar]
- 84.Dorozhkin SV. Progress in Biomaterials. 2016;5:9–70. doi: 10.1007/s40204-015-0045-z. [DOI] [PMC free article] [PubMed] [Google Scholar]
- 85.Wilson EE, Awonusi A, Morris MD, Kohn DH, Tecklenburg MMJ, Beck LW. Biophysical Journal. 2006;90:3722–3731. doi: 10.1529/biophysj.105.070243. [DOI] [PMC free article] [PubMed] [Google Scholar]
- 86.Pasteris JD, Yoder CH, Wopenka B. American Mineralogist. 2014;99:16–27. doi: 10.2138/am.2014.4571. [DOI] [PMC free article] [PubMed] [Google Scholar]
- 87.Cazalbou S, Combes C, Eichert D, Rey C. Journal of Materials Chemistry. 2004;14:2148–2153. [Google Scholar]
- 88.Wang Y, Von Euw S, Fernandes FM, Cassaignon S, Selmane M, Laurent G, Pehau-Arnaudet G, Coelho C, Bonhomme-Coury L, Giraud-Guille MM, Babonneau F, Azais T, Nassif N. Nature Materials. 2013;12:1144–1153. doi: 10.1038/nmat3787. [DOI] [PubMed] [Google Scholar]
- 89.Duer M, Veis A. Nature Materials. 2013;12:1081–1082. doi: 10.1038/nmat3822. [DOI] [PubMed] [Google Scholar]
- 90.Puchtler H, Meloan SN, Terry MS. J Histochem Cytochem. 1969;17:110–124. doi: 10.1177/17.2.110. [DOI] [PubMed] [Google Scholar]
- 91.P H, Meloan SN. Journal of Histotechnology. :11. [Google Scholar]
- 92.Bonewald LF, Harris SE, Rosser J, Dallas MR, Dallas SL, Camacho NP, Boyan B, Boskey A. Calcified Tissue International. 2003;72:537–547. doi: 10.1007/s00223-002-1057-y. [DOI] [PubMed] [Google Scholar]
- 93.Andre-Frei V, Chevallay B, Orly I, Boudeulle M, Huc A, Herbage D. Calcified Tissue International. 2000;66:204–211. doi: 10.1007/s002230010041. [DOI] [PubMed] [Google Scholar]
- 94.Robey PG. Tissue Engineering Part B-Reviews. 2011;17:423–430. doi: 10.1089/ten.teb.2011.0199. [DOI] [PMC free article] [PubMed] [Google Scholar]
- 95.de Peppo GM, Marcos-Campos I, Kahler DJ, Alsalman D, Shang LS, Vunjak-Novakovic G, Marolt D. Proceedings of the National Academy of Sciences of the United States of America. 2013;110:8680–8685. doi: 10.1073/pnas.1301190110. [DOI] [PMC free article] [PubMed] [Google Scholar]
- 96.Ferreira E, Porter RM, Wehling N, O’Sullivan RP, Liu FJ, Boskey A, Estok DM, Harris MB, Vrahas MS, Evans CH, Wells JW. Journal of Biological Chemistry. 2013;288:29494–29505. doi: 10.1074/jbc.M113.471268. [DOI] [PMC free article] [PubMed] [Google Scholar]
- 97.Langenbach F, Handschel J. Stem Cell Research & Therapy. 2013:4. doi: 10.1186/scrt328. [DOI] [PMC free article] [PubMed] [Google Scholar]
- 98.Rey C, Shimizu M, Collins B, Glimcher MJ. Calcified Tissue International. 1991;49:383–388. doi: 10.1007/BF02555847. [DOI] [PubMed] [Google Scholar]
- 99.Koutsopoulos S. Journal of Biomedical Materials Research. 2002;62:600–612. doi: 10.1002/jbm.10280. [DOI] [PubMed] [Google Scholar]
- 100.Figueiredo GJ, M M, AG M. In: Infrared Spectroscopy - Life and Biomedical Sciences. Theophanides T, editor. InTech; 2012. [Google Scholar]
- 101.Farlay D, Panczer G, Rey C, Delmas PD, Boivin G. Journal of Bone and Mineral Metabolism. 2010;28:433–445. doi: 10.1007/s00774-009-0146-7. [DOI] [PMC free article] [PubMed] [Google Scholar]
- 102.West PA, Bostrom MPG, Torzilli PA, Camacho NP. Applied Spectroscopy. 2004;58:376–381. doi: 10.1366/000370204773580194. [DOI] [PubMed] [Google Scholar]
- 103.Rey C, Miquel JL, Facchini L, Legrand AP, Glimcher MJ. Bone. 1995;16:583–586. doi: 10.1016/8756-3282(95)00101-i. [DOI] [PubMed] [Google Scholar]
- 104.Pasteris JD, Wopenka B, Freeman JJ, Rogers K, Valsami-Jones E, van der Houwen JAM, Silva MJ. Biomaterials. 2004;25:229–238. doi: 10.1016/s0142-9612(03)00487-3. [DOI] [PubMed] [Google Scholar]
- 105.Masci M, Wang M, Imbert L, Barnes AM, Spevak L, Lukashova L, Huang YH, Ma Y, Marini JC, Jacobsen CM, Warman ML, Boskey AL. Bone. 2016;87:120–129. doi: 10.1016/j.bone.2016.04.011. [DOI] [PMC free article] [PubMed] [Google Scholar]
- 106.Shemesh A. Geochimica Et Cosmochimica Acta. 1990;54:2433–2438. [Google Scholar]
- 107.Bi X, Li G, Doty SB, Camacho NP. Osteoarthritis and Cartilage. 2005;13:1050–1058. doi: 10.1016/j.joca.2005.07.008. [DOI] [PubMed] [Google Scholar]
- 108.Kazarian SG, Chan KLA, Maquet V, Boccaccini AR. Biomaterials. 2004;25:3931–3938. doi: 10.1016/j.biomaterials.2003.10.099. [DOI] [PubMed] [Google Scholar]
- 109.Marelli B, Ghezzi CE, Barralet JE, Boccaccini AR, Nazhat SN. Biomacromolecules. 2010;11:1470–1479. doi: 10.1021/bm1001087. [DOI] [PubMed] [Google Scholar]
- 110.Marelli B, Ghezzi CE, Mohn D, Stark WJ, Barralet JE, Boccaccini AR, Nazhat SN. Biomaterials. 2011;32:8915–8926. doi: 10.1016/j.biomaterials.2011.08.016. [DOI] [PubMed] [Google Scholar]
- 111.Miri AK, Muja N, Kamranpour NO, Lepry WC, Boccaccini AR, Clarke SA, Nazhat SN. Biomaterials. 2016;85:128–141. doi: 10.1016/j.biomaterials.2016.01.047. [DOI] [PubMed] [Google Scholar]
- 112.Kato Y, Boskey K, Spevak L, Dallas M, Hori M, Bonewald LF. Journal of Bone and Mineral Research. 2001;16:1622–1633. doi: 10.1359/jbmr.2001.16.9.1622. [DOI] [PubMed] [Google Scholar]
- 113.Aydin HM, Hu B, Suso JS, El Haj A, Yang Y. Analyst. 2011;136:775–780. doi: 10.1039/c0an00530d. [DOI] [PubMed] [Google Scholar]
- 114.Querido W, Abracado LG, Rossi AL, Campos APC, Rossi AM, Gil RAS, Borojevic R, Balduino A, Farina M. Calcified Tissue International. 2011;89:358–371. doi: 10.1007/s00223-011-9526-9. [DOI] [PubMed] [Google Scholar]
- 115.Addison WN, Nelea V, Chicatun F, Chien YC, Tran-Khanh N, Buschmann MD, Nazhat SN, Kaartinen MT, Vali H, Tecklenburg MM, Franceschi RT, McKee MD. Bone. 2015;71:244–256. doi: 10.1016/j.bone.2014.11.003. [DOI] [PMC free article] [PubMed] [Google Scholar]
- 116.Boskey AL, Paschalis EP, Binderman I, Doty SB. Journal of Cellular Biochemistry. 2002;84:509–519. [PubMed] [Google Scholar]
- 117.Roy R, Kudryashov V, Doty SB, Binderman I, Boskey AL. Differentiation. 2010;79:211–217. doi: 10.1016/j.diff.2010.03.003. [DOI] [PMC free article] [PubMed] [Google Scholar]
- 118.Querido W, Farina M. Cell and Tissue Research. 2013;354:573–580. doi: 10.1007/s00441-013-1669-8. [DOI] [PubMed] [Google Scholar]
- 119.Querido W, Campos APC, Ferreira EHM, Gil R, Rossi AM, Farina M. Cell and Tissue Research. 2014;357:793–801. doi: 10.1007/s00441-014-1901-1. [DOI] [PubMed] [Google Scholar]
- 120.Boyan BD, Bonewald LF, Paschalis EP, Lohmann CH, Rosser J, Cochran DL, Dean DD, Schwartz Z, Boskey AL. Calcified Tissue International. 2002;71:519–529. doi: 10.1007/s00223-001-1114-y. [DOI] [PubMed] [Google Scholar]
- 121.Querido W, Farina M, Anselme K. Biomatter. 2015;5:e1027847. doi: 10.1080/21592535.2015.1027847. [DOI] [PMC free article] [PubMed] [Google Scholar]
- 122.Pedraza CE, Marelli B, Chicatun F, McKee MD, Nazhat SN. Tissue Engineering Part A. 2010;16:781–793. doi: 10.1089/ten.TEA.2009.0351. [DOI] [PubMed] [Google Scholar]
- 123.Chicatun F, Pedraza CE, Ghezzi CE, Marelli B, Kaartinen MT, McKee MD, Nazhat SN. Biomacromolecules. 2011;12:2946–2956. doi: 10.1021/bm200528z. [DOI] [PubMed] [Google Scholar]
- 124.Coyac BR, Chicatun F, Hoac B, Nelea V, Chaussain C, Nazhat SN, McKee MD. Journal of Dental Research. 2013;92:648–654. doi: 10.1177/0022034513488599. [DOI] [PubMed] [Google Scholar]
- 125.Marelli B, Ghezzi CE, James-Bhasin M, Nazhat SN. Biomaterials. 2015;37:183–193. doi: 10.1016/j.biomaterials.2014.10.019. [DOI] [PubMed] [Google Scholar]
- 126.Randle WL, Cha JM, Hwang YS, Chan KLA, Kazarian SG, Polak JM, Mantalaris A. Tissue Engineering. 2007;13:2957–2970. doi: 10.1089/ten.2007.0072. [DOI] [PubMed] [Google Scholar]
- 127.Hwang YS, Cho J, Tay F, Heng JYY, Ho R, Kazarian SG, Williams DR, Boccaccini AR, Polak JM, Mantalaris A. Biomaterials. 2009;30:499–507. doi: 10.1016/j.biomaterials.2008.07.028. [DOI] [PubMed] [Google Scholar]
- 128.Rossi AL, Barreto IC, Maciel WQ, Rosa FP, Rocha-Leao MH, Werckmann J, Rossi AM, Borojevic R, Farina M. Bone. 2012;50:301–310. doi: 10.1016/j.bone.2011.10.022. [DOI] [PubMed] [Google Scholar]
- 129.Sroka-Bartnicka A, Kimber JA, Borkowski L, Pawlowska M, Polkowska I, Kalisz G, Belcarz A, Jozwiak K, Ginalska G, Kazarian SG. Analytical and Bioanalytical Chemistry. 2015;407:7775–7785. doi: 10.1007/s00216-015-8943-4. [DOI] [PubMed] [Google Scholar]
- 130.Butler HJ, Ashton L, Bird B, Cinque G, Curtis K, Dorney J, Esmonde-White K, Fullwood NJ, Gardner B, Martin-Hirsch PL, Walsh MJ, McAinsh MR, Stone N, Martin FL. Nature Protocols. 2016;11:664–687. doi: 10.1038/nprot.2016.036. [DOI] [PubMed] [Google Scholar]
- 131.Perlaki CM, Liu Q, Lim M. Applied Spectroscopy Reviews. 2014;49:513–532. [Google Scholar]
- 132.Morris MD, Mandair GS. Clinical Orthopaedics and Related Research. 2011;469:2160–2169. doi: 10.1007/s11999-010-1692-y. [DOI] [PMC free article] [PubMed] [Google Scholar]
- 133.Mansfield J, Yu J, Attenburrow D, Moger J, Tirlapur U, Urban J, Cui ZF, Winlove P. Journal of Anatomy. 2009;215:682–691. doi: 10.1111/j.1469-7580.2009.01149.x. [DOI] [PMC free article] [PubMed] [Google Scholar]
- 134.Bonifacio A, Beleites C, Vittur F, Marsich E, Semeraro S, Paoletti S, Sergo V. Analyst. 2010;135:3193–3204. doi: 10.1039/c0an00459f. [DOI] [PubMed] [Google Scholar]
- 135.Esmonde-White K. Applied Spectroscopy. 2014;68:1203–1218. doi: 10.1366/14-07592. [DOI] [PMC free article] [PubMed] [Google Scholar]
- 136.Liao ZY, Sinjab F, Nommeots-Nomm A, Jones J, Ruiz-Cantu L, Yang J, Rose F, Notingher I. Analytical Chemistry. 2017;89:847–853. doi: 10.1021/acs.analchem.6b03785. [DOI] [PubMed] [Google Scholar]
- 137.Borkowski L, Sroka-Bartnicka A, Polkowska I, Pawlowska M, Palka K, Zieba E, Slosarczyk A, Jozwiak K, Ginalska G. Anal Bioanal Chem. 2017 doi: 10.1007/s00216-017-0518-0. [DOI] [PMC free article] [PubMed] [Google Scholar]
- 138.Bergholt MS, St-Pierre JP, Offeddu GS, Parmar PA, Albro MB, Puetzer JL, Oyen ML, Stevens MM. Acs Central Science. 2016;2:885–895. doi: 10.1021/acscentsci.6b00222. [DOI] [PMC free article] [PubMed] [Google Scholar]
- 139.Kunstar A, Leferink AM, Okagbare PI, Morris MD, Roessler BJ, Otto C, Karperien M, Van Blitterswijk CA, Moroni L, van Apeldoorn AA. Journal of the Royal Society Interface. 2013:10. doi: 10.1098/rsif.2013.0464. [DOI] [PMC free article] [PubMed] [Google Scholar]
- 140.Pilling MJ, Henderson A, Gardner P. Analytical chemistry. 2017 doi: 10.1021/acs.analchem.7b00426. [DOI] [PubMed] [Google Scholar]
- 141.Steimers A, Vafiadou M, Koukourakis G, Geraskin D, Neary P, Kohl-Bareis M. Advances in experimental medicine and biology. 2016;876:41–47. doi: 10.1007/978-1-4939-3023-4_5. [DOI] [PubMed] [Google Scholar]
- 142.Krafft C, Dietzek B, Popp J. The Analyst. 2009;134:1046–1057. doi: 10.1039/b822354h. [DOI] [PubMed] [Google Scholar]