

Abstract
Touch spray mass spectrometry using medical swabs is an ambient ionization technique (ionization of unprocessed sample in the open air) that has potential intraoperative application in quickly identifying the disease state of tissue and in better characterizing the resection margin. To explore this potential, we studied 29 human brain tumor specimens and obtained evidence that this technique can provide diagnostic molecular information that is relevant to brain cancer. Touch spray using medical swabs involves the physical sampling of tissue using a medical swab on a spatial scale of a few mm2 with subsequent ionization occurring directly from the swab tip upon addition of solvent and application of a high voltage. Using a tertiary mixture of acetonitrile, N,N-dimethylformamide, and ethanol, membrane-derived phospholipids and oncometabolites are extracted from the tissue, incorporated into the sprayed microdroplets, vacuumed into the mass spectrometer, and characterized in the resulting mass spectra. The tumor cell load was assessed from the complex phospholipid pattern in the mass spectra and also separately by measurement of N-acetyl-aspartate. Mutation status of the isocitrate dehydrogenase gene was determined via detection of the oncometabolite 2-hydroxyglutarate. The lack of sample pretreatment makes touch spray mass spectrometry using medical swabs a feasible intraoperative strategy for rapid surgical assessment.
Keywords: Electrospray, Lipids, NAA, 2HG, IDH Mutation, Tumor Infiltration, Molecular Pathology, Mass Spectrometry, Cancer
Introduction
We describe the rapid analysis of neurological tissue by touch spray mass spectrometry with medical swabs (i.e., swab TS-MS). Swab TS-MS is envisioned as a tool for molecular diagnosis of gliomas in which tissue is sampled in vivo along the surface of the resection cavity, and then analyzed intraoperatively but ex vivo to provide rapid feedback on the pathological state of the tissue and to guide surgical maneuvers for maximal tumor excision. Added diagnostic information for surgical margin assessment is provided by these chemical measurements to complement standard intraoperative histopathology. Intraoperative histopathology, as currently performed during neurosurgical tumor resection, identifies tumor type and grade from tumor core tissue, but it is not used for assessment of surgical margins. Surgical margins are defined based on the surgeon’s experience, visual and tactile observation of the tissue during surgery, and neuronavigation according to preoperative MRI.1–4 No intraoperative molecular measurement indicative of tissue pathology is currently made to assist in surgical decision-making.
Here we present the swab TS-MS methodology for analysis of neurological tissue and provide proof-of-concept data of its diagnostic utility from 29 human brain specimens selected for their known histopathology. Swab TS-MS is an ambient ionization method in which a minute amount of sample (e.g., tissue) is transferred to a swab tip by a gentle touch, and subsequently ionized with the application of solvent to the swab tip and a high voltage directly to the swab shaft.5, 6 Sampling is minimally invasive, analysis is straightforward and requires no other sample handling or pretreatment, making it highly appropriate for clinical testing in hospitals.7 Swabs are used both as sampling devices and as electrospray emitters for MS analysis. Rapid evaporative ionization mass spectrometry (REIMS) combines tissue sampling and ionization in an online approach to provide quasi real-time feedback.8 In REIMS, a modified monopolar cutting electrode is used for both tissue removal and for collection of the surgical smoke produced from electrocauterization.8 We envision swabs as a tool to maximize analysis throughput while removing the need for positioning the MS instrument close to the surgical field or requiring a transfer line to interface the ionization source to the mass spectrometer. We consider an offline approach, where tissue sampling is performed remotely from the mass spectrometer, to best suit neurosurgery needs while limiting deviations from current surgical procedures.
Swab touch spray is based on the ambient ionization method of paper spray mass spectrometry9 which has proven successful in biofluids analysis. Applications of swab TS-MS that have been presented so far include the detection of microbial lipids from culture5 and from human skin, and illicit drug detection in oral fluid.6 The development of swab TS-MS follows that of TS and probe electrospray ionization (PESI), two methods that use metallic teasing probes for tissue sampling. TS in this previous form has been investigated for prostate and kidney cancer detection10–12 while PESI has been tested for detection of renal cell carcinoma and metabolite profiling in mouse brain.13, 14 Differently from metal probe TS and PESI, swab TS utilizes swabs that are already commercialized as probes for in vivo sampling of deep surgical wounds, body orifices and surfaces, facilitating the translation of this tool into surgical application. Electrospray ionization occurs readily from the porous material of the swab tip, similarly to paper spray15, 16 and biocompatible solid phase micro-extraction fibers.17, 18
Three items of information were sought from the mass spectra obtained using swab TS-MS: (i) tissue type was assessed by monitoring the expression of complex phospholipids; (ii) tumor infiltration was measured as percentage of tumor cells (TCP; relative percentage of tumor cells compared with parenchyma) by monitoring the abundance of N-acetylaspartate (NAA); and (iii) isocitrate dehydrogenase (IDH) mutation status was assessed by monitoring the presence of the oncometabolite 2-hydroxyglutarate (2HG). Previous studies using desorption electrospray ionization-mass spectrometry (DESI-MS) demonstrated that all three items of diagnostic information are achievable by electrospray-based ambient ionization MS19–22 and that this technology can be used for intraoperative molecular pathology.23–25 DESI-MS is emerging as a molecular diagnostic intraoperative tool for analysis ex vivo of biopsied tissue smears. Phospholipid profiles, as detected by DESI-MS, change dynamically with the density of the tumor and with the composition of the infiltrated brain parenchyma (i.e., grey matter, white matter, or a mixture of both). NAA signal intensities in DESI mass spectra decrease proportionally with the degree of tumor infiltration, measured as TCP.20, 21, 23 The oncometabolite 2HG accumulates in glioma tissue carrying IDH mutations.26 Its presence has been determined using DESI-MS and the data compared well with clinical genetic tests carried out post-operatively.22 The development of swab TS-MS, also an electrospray-based method, represents an additional step towards the use of intraoperative MS and it provides the neurosurgeon with a simple manual tool for in vivo tissue sampling and direct chemical evaluation of tissue pathology.
Experimental
Study protocol
Cryopreserved human neurological specimens were obtained from 29 patients through the Biorepository of the Methodist Research Institute (Purdue IRB #1410015344). The list of specimens analyzed in this study is reported in Table S1. Tissue specimens were stored at −80 °C before analysis. For each specimen, a few tissue sections (15-μm thickness) were cut using a cryotome (Cryotome™ FSE Cryostats, Thermo Fisher Scientific, San Jose, CA) in order to obtain a flat open surface of the tissue. The last tissue section cut was H&E stained for blind pathological examination. The tissue sample was then allowed to thaw at room temperature, and the flat surface of the tissue, adjacent to the section that was stained, was touched with the swab (approximately an area of 6 mm2) to perform the TS-MS experiments. Multiple touches were performed for most of the samples that showed macroscopically-heterogeneous areas, as detailed in Table S1. For all the specimens used in this study, another tissue biopsy had been previously used for preparation of tissue sections and smears and analyzed by DESI-MS imaging. Results are reported elsewhere.19, 20 Mouse brain (Purdue IRB #1704001561) was used for the initial stages of method development.
Chemicals
Electrospray was generated using a mixture of acetonitrile-dimethylformamide-ethanol (ACN-DMF-EtOH) in a ratio of 45:5:50 % v/v, doped with octyl β-D-glucopyranoside (non-ionic surfactant, ≥98% pure) and the internal standard NAA-d3, (10 μg/mL). All solvents and standards were purchased from Sigma Aldrich (Minneapolis, MN).
Medical swabs
Sterile medical swabs were purchased from Copan Diagnostics Inc. (Murietta, CA). The swabs have an aluminum handle and rayon mini tip of fused shape and largest diameter of ~2.4 mm (Fig. S1). The swabs are packaged in individual tubes for easy transport and storage. They are mounted in a plastic cap that serves as a convenient holder. Each tube and cap assembly is sealed with a tamperproof label for assurance of sterility and chain of custody. These swabs are commercialized for purposes other than ESI probes for MS analysis. They have been used with no modification from their commercial form.
Swab touch spray mass spectrometry
Swab touch spray experiments were performed by touching gently a region of interest of a sample and rotating the swab on its shaft to transfer minute quantities of tissue on the swab tip. Each swab was weighed before and after the touch to measure tissue quantity transferred to the swab tip (Tissue Weight, Table S1), and then submitted to MS analysis with no further treatment.
MS experiments were performed using a linear ion trap mass spectrometer (Finnigan LTQ, Thermo Fisher Scientific). The ion source was custom-built to allow positioning the swab vertically with respect to the mass spectrometer; a configuration similar to that used in commercial electrospray sources. The use of an extended MS inlet capillary, bent 90° upwards and held directly underneath the swab tip, improved stability of the swab electrospray despite ion transmission losses (Fig. S2). The absence of carry-over using a bent inlet capillary was tested by spraying concentrated mouse brain extracts (1 mg/mL in ACN-DMF-EtOH 45-5-50 % v/v) using a clean swab as probe substrate, in alternation with blank solvent. The swab tip was positioned 5–8 mm above the inlet. A precision motion control system was used to adjust the position of the swab whenever necessary. A silica capillary was used to deliver the solvent to the swab tip using an external syringe pump. The silica capillary was held in a fixed position in such a way that the end of the capillary directly touched the surface of the swab tip once positioned. Electrospray was generated using ACN-DMF-EtOH 45:5:50 % v/v as solvent system. The solvent was doped with 250 ng/mL of octyl β-D-glucopyranoside to facilitate solvent flow on the probe, and 10 μg/mL of the internal standard NAA-d3. Electrospray was initiated after addition of solvent directly on the swab tip via a fused silica capillary and external syringe pump. The syringe pump flow rate was set at 50 μL/min for about 30 s, accounting for dead volume and wetting the swab tip. When the swab tip was visibly wet, high voltage (−6.5 kV) was applied directly to the metallic handle. Solvent flow rate was changed to 25 μL/min. It was possible to generate an electrospray from all the swabs analyzed. In only a couple of instances fibers distend from the body of the swab tip during data acquisition compromising the stability of the electrospray; these swabs had to be disregarded and the experiments repeated.
Full scan mass spectra over the range m/z 700–1000 were acquired in negative ion mode first; a second acquisition over the mass range m/z 80–200 was performed in negative ion mode. After this, collision-induced dissociation MS/MS product ion scans were acquired to measure NAA (precursor ion m/z 174 [M-H]−) and NAA-d3 (precursor ion m/z 177 [M-H]−), followed by MS3 sequential product ion scans of 2HG (precursor ion m/z 147 [M-H]−). Total acquisition time was 1.2 min; approximately 15 seconds were acquired for each mode so that spray and signal stability could be evaluated. MSn spectra other than for NAA and 2HG were acquired separately when additional structural information was needed for compound identification. The automatic gain control was always activated to adjust for variable ion flux. The MS instrumental settings are reported in Table S2. Signal-to-noise ratios were calculated using ion intensity at maximum peak height and signal intensity at peak onset.
Microscopic videography
For each swab tested, videos of the spray plume were recorded to observe the electrospray behavior. A Watec WAT-704R camera was used to acquire the videos; the software Cyberlink PowerDirector v.14 (www.cyberlink.com) was used to record them; Adobe Premier Pro CC (www.adobe.com) was used for video editing. The spray plume was illuminated with a red laser pointer as shown in Fig. S2.
Data analysis and chemical diagnosis
Data were exported from XCalibur 2.0 (Thermo Fisher Scientific) and imported into MATLAB (The Matworks Inc., Natick MA) for elaboration. Full scan mass spectra were used to provide molecular diagnosis of the tissue via comparison with a reference spectral library acquired by DESI-MS. Spectral profiles were used comprehensively to classify the tissue as either glioma, white matter, or grey matter. The methodology is based on multivariate pattern recognition and is described extensively elsewhere.20, 21 The abundance of NAA, detected using tandem MS (m/z 174→114) and normalized to the intensity of the internal standard NAA-d3 (m/z 177→116), was plotted in relation to tumor infiltration (low, medium, and high as evaluated by histopathology). Box-plots were created using MATLAB. The Krushall-Wallis non-parametric test was used to compare population medians. P values <0.05 were considered significant. The signal intensity of 2HG, detected using MS3 (m/z 147→129→101) and normalized to the intensity of the internal standard NAA-d3 (m/z 177→116), was plotted against the IDH mutation status (wild-type vs IDH mutant) to monitor differential distribution. The receiver operating characteristic (ROC) curve analysis was used to determine the ability of 2HG measurement to assess IDH mutation of gliomas. The predicting ability was considered strong when the area under the curve (AUC) exceeded 0.8 (80%). Receiver operating characteristic (ROC) curve analysis and Kruskal-Wallis test were performed using SPSS v.22 (SPSS Inc. IBM Corp, Chicago, IL).
Adobe Photoshop (Adobe Systems Inc., San Jose, CA) was used to produce publication-quality figures.
H&E staining
Tissue staining was performed as described elsewhere.20
Histopathology
An expert neuropathologist (E.M.H.) identified regions of interest as glioma (G) or infiltrated tissue (IT), further specifying grey matter (GM), white matter (WM), a mixture of both, or infiltrated tissue not otherwise specified (NOS). Estimation of tumor cell percentage was roughly provided in the categories of low (<33%), medium (34–67%), or high (>67%) simply by visual observation. Immunohistochemistry for assessment of IDH mutation was performed on separate tissue biopsies than those analyzed by swab TS-MS. Analysis was conducted from an independent pathology laboratory. Results were provided from the Biorepository of the Methodist Research Institute as dichotomous answer (immunoreactive vs. non-immunoreactive, Purdue IRB #1410015344).
Results
Instrumental set-up and analytical considerations
Swab TS-MS was performed in such a way as to mimic one foreseeable implementation: collection of tissue in vivo along the surface of the resection cavity, followed by placement of the swab probe in front of a mass spectrometer located in the operating room and direct MS analysis (Fig. 1). Analysis required a few minutes with the current methodology; this time was equally divided between swab positioning onto a custom-built source and MS data acquisition, while tissue sampling was immediate. MS data acquisition was prolonged for over a minute to test electrospray and signal stability but could be shortened to a few seconds for each mode of data acquisition, since the entire tissue sampled on the swab is interrogated by the constantly-flowing solvent, leading to a chemical profile that is stable over time and represents the average signature arising from the heterogeneous morphological features sampled. The analysis can be multiplexed easily, as done in this study, to specifically monitor particular biomarkers and oncometabolites. In this study, cryopreserved tissue biopsies served as a proxy for in vivo sampling. Swab TS-MS incorporates a manual user-guided method of collecting minute amounts of tissue with direct MS analysis from the sampling device. A current drawback of this approach is the lack of control over the quantity of tissue transferred on the swab tip by touch. The average quantity for the specimens analyzed in this study was 3.1 mg but acceptable signal-to-noise ratios (>3) for the diagnostic peaks in the mass spectra were obtained for as little as 1.0 mg. Tissue quantities are minimal and smaller than those of a typical tissue biopsy resected for pathological examination. The minute amount of sample collected emphasizes the value of MS methods in which ionization is generated directly from the sampling device; viz., no sample loss and higher signal intensity resulting from minimal solvent consumption (flow rate ~25 μL per minute). Table S1 gives the signal-to-noise ratios calculated on the most intense peak of the lipid profile mass spectra. As already observed using DESI-MS,21, 28 the absolute signal intensity changed with the quantity of tissue sampled, as well as with its composition and cellularity. High-grade and high-density tumor tissue provided lower absolute signal compared to low-infiltrated tissue, partly due to the presence of calcified, hemorrhagic, and necrotic tissue. Note that an internal standard added to the extraction solvent normalizes variations of absolute ion counts due to swab positioning and instability of the electrospray, but cannot correct for matrix differences. Importantly, the relative spectral profiles (i.e., relative intensity of ions within a scan) used as a diagnostic fingerprint of the tissue were grossly uninfluenced by global intensity variations which allowed us to obtain accurate diagnostic information from the mass spectra despite the lack of control over the absolute quantity of tissue analyzed. We monitored the spectral profiles repeatedly over a total period of 10 minutes in both low- and high-glioma infiltrated samples and changes in their respective spectral profiles were minimal (relative standard deviations <15% for diagnostic ions, Fig. S3). The absolute signal decreased monotonically over time, which is typical of a continuous extraction process (Fig. S4).
Fig. 1. Swab TS-MS experiment.
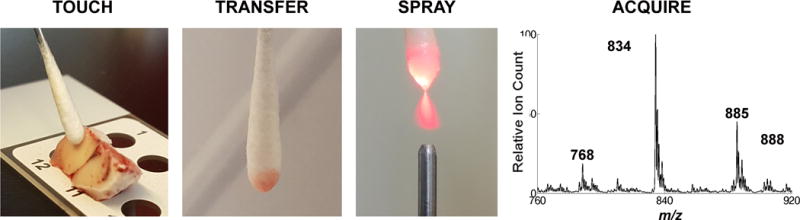
(Left to right) Tissue is touched with the swab tip and transferred by rotating the swab on its shaft. The swab is positioned in front of a mass spectrometer and an electrospray is generated directly from the swab tip upon application of solvent and a high voltage, which allows mass spectra to be recorded.
Different extraction solvents (methanol, ACN, DMF, EtOH, dichloromethane, and acetone) were tested during method development based on previous experience with DESI-MS.27 The system empirically chosen for these analyses (ACN-DMF-EtOH, 45:5:50 v/v%) is the result of an optimization process meant to select a mixture of organic solvents that would provide a chemical fingerprint of the tissue similar to that obtained using DESI-MS (which uses ACN-DMF 50:50 v/v% as solvent system) but one that would also generate an electrospray from the swab tip. Video S1 shows the generation of the electrospray plume from the swab and its remarkable stability. The caption describes briefly the swab electrospray process (Supplementary Material, Video S1). The use of the original ACN-DMF DESI solvent was not acceptable because of poor spray behavior observed in the negative ionization mode for swab TS-MS. The addition of ethanol and a non-ionic surfactant to the solvent system significantly decreases the surface tension of the solvent mixture, thereby facilitating electrospray plume formation from the swab tip and improving signal stability.
Assessment of glioma presence and estimation of tumor infiltration
The lipid profiles detected by swab TS-MS resembled those detected by DESI-MS.20 They indicated the presence of tumor when present and could distinguish the type of normal tissue into which the tumor infiltrated (i.e., grey matter or white matter); an information not always assessable by histopathology as tumors efface the morphology of normal brain parenchyma. The main MS feature characterizing grey matter is m/z 834.5, the deprotonated ion of phosphatidylserine 40:6 (Fig. 2A). The main MS features characteristic of white matter are m/z 888.6 and 904.5, deprotonated ions for (3′-sulfo)GalCer 24:1 and (3′-sulfo)GalCer 24:1(OH) (Fig. 2B). For gliomas, the characteristic ions are m/z 768.4, the chlorinated adduct of phosphatidylcholine 32:0, m/z 794.5, chlorinated adduct of phosphatidylcholine 34:1, and m/z 885.5, the deprotonated phosphatidylinositol 38:4 (Fig. 2C). Figure S5 shows spectra for these categories of samples acquired by DESI-MS for comparison. The similarity between the lipid profiles acquired by DESI-MS and swab TS-MS for the same subjects (from different portions of tissue biopsies) was measured in terms of spectral correlation using canonical correlation analysis12, 20 and the correlation coefficient was equal to 0.9.
Fig. 2. Full-scan mass spectra in negative ion mode over m/z 760–920.
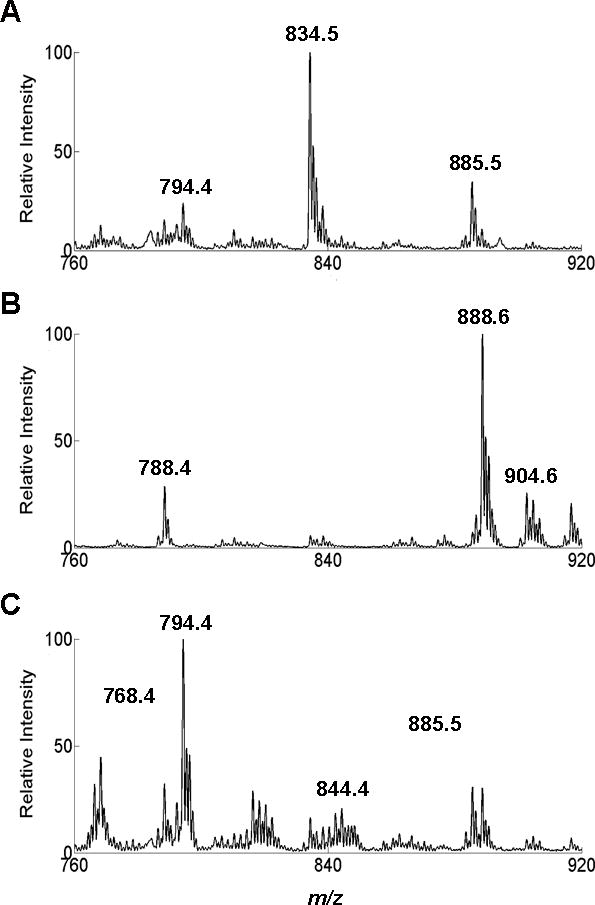
(A) Sample #24; pathological assignment: grey matter with low TCP. (B) Sample # 1; pathological assignment: white matter with low TCP. (C) Sample #20; pathological assignment: glioma with high TCP. Y-axes are normalized to the base peak (m/z 834, 888, and 794, respectively) in the mass range m/z 760–920. TIC values are 7.98·106, 6.71·106, and 2.22·105 respectively for A, B, and C.
High-resolution MS and MS2 experiments have been previously recorded using DESI-MS for structural identification.20 These experiments were repeated using swab TS-MS and confirmed the structural assignments (Fig. S6). Increased intensity of m/z 810.4, corresponding to phosphatidylserine 38:4 was observed in a few specimens. We attribute it to blood absorption on the swab tip as this lipid is a major membrane constituent of erythrocytes. This interference did not compromise our ability to determine the presence of tumor in the tissue but further evaluation is needed from specimens collected in vivo.
The neurometabolite NAA is one of the most abundant in healthy human brain tissue. However, its abundance (i.e. relative signal) observed in swab TS mass spectra decreased as the TCP (i.e., tumor cells relative to normal cells) increased (Fig. 3). Population medians are statistically different (p values=0.0046 using Kruskal-Wallis non-parametric test). NAA measurement provides an estimate of tumor infiltration within the tissue, and corroborates prior DESI-MS observations made on tissue sections and smears,20, 21, 23 as well as literature reports regarding the inhibited expression of the biosynthetic enzyme L-aspartate N-acetyltransferase in glioma cells.29 For validation, we confirmed that the decreased signal abundance of NAA in the swab TS-MS spectra corresponded to decreased concentrations of NAA in the specimens. We quantified NAA in the same specimens using an independent protocol, which is described elsewhere.30 Briefly, an adjacent portion of the tissue to that sampled by swab TS-MS was removed and extracted using methanol-water (3:2 v/v). The solution was analyzed by traditional electrospray ionization triple quadrupole MS operated in the multiple reaction monitoring (MRM) mode. NAA concentrations decreased proportionally with increasing fraction of tumor cells (averages for low, medium, and high TCP were equal to 797, 406, and 42 ng/mg, respectively), hence validating the trend we observed qualitatively in swab TS mass spectra (see results in Table S3). A more accurate regression analysis to estimate tumor infiltration is yet to be developed, as is assessment of a detection limit for the minimal and maximum amounts of infiltrating cells discernable via NAA measurements. The use of controlled cell cultures and mixtures is foreseen as a possible strategy to address such issues.
Fig. 3. Box and whisker plot.
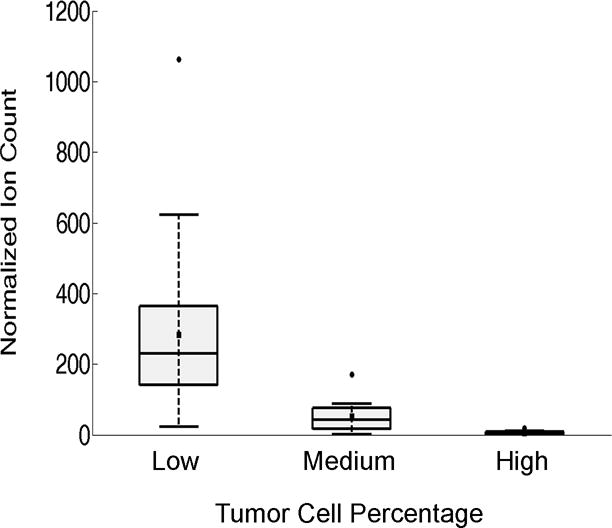
NAA abundance in tissue was categorized as low (<34%, n=24), medium (34–67%, n=12) or high (>67%, n=11) TCP as visually assessed by histopathology. Note, multiple touches from the same specimens were considered independent measurements as the neuropathologist annotated the presence of heterogeneous areas in adjacent tissue sections (Table S1). The ion counts correspond to the signal intensity of the transition m/z 174→114 normalized to the ion counts of the transition m/z 177→116 (NAA-d3, the internal standard). The box represents the interquartile range with a median line and whiskers at ±1.5 SD. Squares represent the mean value. Circles represent outliers. Zero intensity was assigned to Sample #13 in which no NAA signal was detected (Table S1).
Overall, the changes in the lipid and NAA features in swab TS-MS spectra reflect the known complexity and heterogeneity of gliomas that diffusely infiltrate into the surrounding brain parenchyma, as corroborated by pathological examination of the tissue (Table S1). Figure 4 depicts an example of such dynamic yet diagnostic changes. Three regions of interest were sampled from Case #19. The touch spray at the first spot (Sample #31) showed a low abundance of NAA (indicative of high TCP) and a lipid profile indicative of glioma tissue infiltrating grey matter (Fig. 4A and 4B). The second spot touched (Sample #32) showed low abundance of NAA as well but the lipid profile was indicative of glioma invading a mixture of white and grey matter (Fig. 4D and 4E). The third touch (Sample #33) showed higher intensity of NAA (lower tumor infiltration) into prevalently grey matter, as indicated by the lipid profile dominated by m/z 834.5 (Fig. 4G and 4H). Pathological examinations matched with the swab TS-MS results (Table S1).
Fig. 4. Case #19.
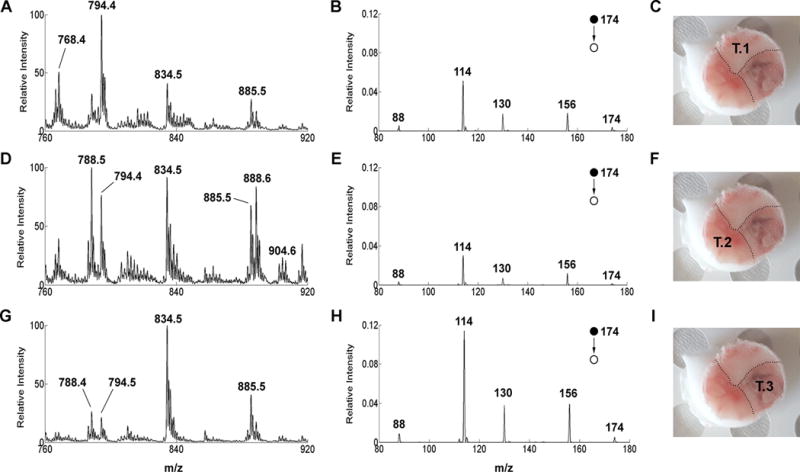
(On the left) Negative ion mode full-scan mass spectra over m/z 760–920 of (A) Sample #31, pathological assignment: glioma 70% TCP. (D) Sample #32, pathological assignment: glioma 70% TCP (G) Sample #33, pathological assignment, grey matter with 40% TCP. Lipid profile spectra are normalized to the base peak (m/z 794, 788, and 834, respectively) over the mass range m/z 760–920. (Middle column) Negative ion mode product ion scan for NAA of (B) Sample #31, (E) Sample #32, (H) Sample #33. MS/MS product ion spectra are normalized to the signal of the signal intensity of the internal standard NAA-d3 (transition m/z 177→116). (On the right) Picture of Specimen #19 with superimposed annotation of the touch number for swab TS-MS analysis (C) Touch #1. (F) Touch #2. (I) Touch #3. The tissue was allowed to thaw at room temperature before performing the swab TS-MS analysis.
Assessment of IDH mutation via 2HG measurement
IDH mutations result in accumulation of 2HG in glioma cells by conversion of alpha ketoglutarate via NADPH oxidation. We detected a 50-fold increase in the average 2HG normalized signal intensity between wild-type gliomas and IDH-mutant gliomas (Fig. 5A). A wide range in 2HG signal intensity was detected for the IDH-mutant gliomas and can be attributed to differences in tissue cellularity and the known heterogeneity of tumor density in the samples. We averaged the 2HG measurements of multiple touches from the same specimens to avoid bias due to sample size (N=29). The possibility that other compounds give ions that interfere with the signal for 2HG in the full scan mass spectrum led us to increase specificity by using the MS3 collision-induced dissociation sequence m/z 147→129→101. A sequential product ion scan spectrum from an IDH-mutant glioma is shown in Figure S7. A relative signal intensity of 2HG (signal intensity of the sequential product ion m/z 147→129→101 normalized to the signal intensity of the internal standard NAA-d3 m/z 174→114) equal to 1.02 is a cut-off that discriminates this set of IDH-mutant gliomas and wild-type gliomas with 100% accuracy (using ROC curve analysis). This observation was confirmed by quantitation of 2HG in adjacent tissue of the same specimens, performed as described above for NAA (N=28; Case #29 was excluded because insufficient tissue was available to perform both experiments). A cut-off of 45 ng/mg for the 2HG concentrations was found to discriminate IDH-mutant and wild-type tumors with 100% accuracy.30 Concentrations of 2-HG are reported in Table S3 for validation. Figure 5B shows complete agreement between the qualitative swab TS-MS measurements and the concentrations determined by ESI-MS (i.e. all IDH mutant samples show swab TS-MS intensity and ESI-MS concentrations of 2HG above the set cut-offs, while wild-type tumors show values below such cut-offs). There is also agreement with intraoperative DESI-MS measurements reported recently.23
Fig. 5. 2HG expression.
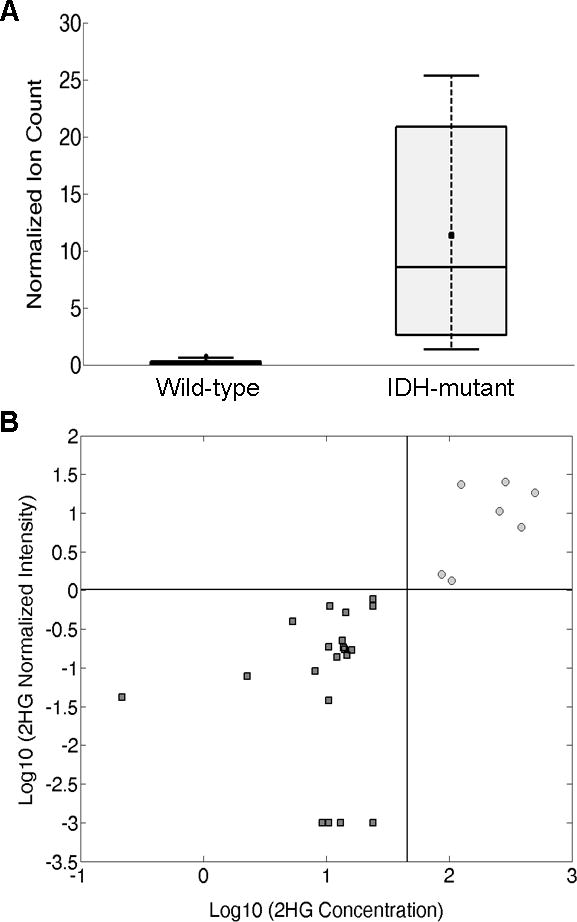
(A) Box and whisker plot for 2HG in tissue analyzed by swab TS-MS. Wild-type, n=21; IDH-mutant gliomas, n=8. Normalized ion counts correspond to the signal intensity of the transition m/z 147→129→101 normalized to the signal intensity of the internal standard NAA-d3 (transition m/z 177→116). The box represents the interquartile range with a median line and whiskers at ±1.5 SD. Squares represent the mean value. (B) 2HG concentration (ng/mg tissue) from tissue extracts by ESI-MS versus 2HG normalized signal from swab TS-MS for 28 cases (Case #29 was of insufficient quantity to perform the quantitative measurement). Dark grey squares, wild-type gliomas; light grey circles, IDH-mutant gliomas; black lines represent the cut-offs for the Logarithmic 2HG normalized signal intensity (horizontal line) and for the Logarithmic 2HG concentration (45 ng/mg, vertical line). The value of 0.001 was assigned to samples in which no 2HG signal was detected in order to compute the logarithm (−3). 2HG concentrations are reported in Table S3 for validation.
Discussion
In this study, we demonstrated the feasibility of obtaining accurate diagnostic information (Table S4) by touching tissue using a medical swab followed by direct MS analysis from the sampling device. Rapid analysis and minimally invasive sampling are major advantages of swab TS-MS. A larger cohort of samples is certainly needed to validate the findings described herein and to evaluate its use in routine clinical practice. Nonetheless, we consider this technique to be worth investigating as a strategy to implement chemical pathology into the standard intraoperative diagnostic consultation. The collection of tissue remotely to the mass spectrometer using a medical swab is a simple process. Changes to the swab design and the source interface could improve automation and reduce analysis time. MS analysis of neurological tissue directly from the sampling device can be performed inside the operating room with no interference with surgical practice. Commercial MS instruments and ESI sources can easily be adapted to allocate the swab as probe rather than the conventional ESI needle. Rapid analysis of tissue should allow assessment of the surgical margin status in multiple locations selected by the neurosurgeon as tumor resection is executed. The diagnostic feedback can provide guidance on further surgical maneuvers to maximize safe tumor resection, especially in proximity of critical anatomical structures. Neurosurgeons are already familiar with the use of swabs and absorbent pads and the device we are describing to touch neurological tissue would be used no differently. A fit-for-purpose swab design is wanted, however, for optimal MS performance. The medical swab we used in this study is commercialized as a class IIA device for surgical invasive transient use (i.e., contact with tissue for less than 60 min). The swab has a sterile mini rayon tip with a fused shape. It is sufficiently small to sample minute amounts of tissue by gentle touch and minimize the invasiveness of the sampling procedure but tip dimensions could be reduced further and the shape of the tip changed to a conical geometry to improve upon electrospray formation. The stiffness and the crevasses in the tip hold the tissue during sample transfer and MS analysis, but different biocompatible functionalized surfaces could be designed to improve tissue transfer, reduce chemical noise, and enhance extraction and recovery of target compounds. The aluminum handle is conductive and allows the generation of the electrospray directly from the swab upon application of a high voltage; a different design of the swab with hollowed handles could facilitate the delivery of solvent and allow for the development of a swab probe that is easier to interface with commercial ESI sources.
The spectra obtained from swab TS-MS recapitulate previously reported DESI-MS spectra and pathology. The lipid signature provides information as to the disease state of the tissue. The oncometabolite NAA provides estimate of tumor infiltration which is of utmost importance when attempting to maximize glioma resection, an outcome that is favorably prognostic for glioma patients. Our results support the hypothesis that tumor infiltration can be monitored through neuronal cell damage in its path by measuring NAA depletion.31 Estimation of tumor infiltration directly from points of interest along the resection margins can guide further tumor excision, assisting and validating neurosurgeons’ decisions; keeping in mind that complete tumor resection is unachievable, and safe removal of tissue with high tumor infiltration is a primary goal of neurosurgery, whereas areas of low infiltration are more likely to be the target of coadjuvant postsurgical therapies. In the current surgical practice, the amount of residual tumor near the resection margins is not pathologically assessed during surgery. Neuronavigation with preoperative MRI images is typically used to judge extent of resection but several studies have highlighted the limitations and the subjectivity of such a practice as tumor infiltration can extend beyond MRI contrast-enhanced areas, and the enhancement itself poorly correlates to tissue histopathology.3, 4 In our parallel work using DESI-MS, we were able to detect variable and even large amounts of residual tumor via NAA measurements at the resection margins, even when they appeared clear and non-enhanced by postoperative MRI,23 remarking the utility of such a measurement.
In addition to tumor presence and infiltration, we can monitor the oncometabolite 2HG to assess the IDH mutation status of the tumor which is clinically relevant and a strong prognostic marker.26, 32 IDH mutation status is normally assessed postoperatively as it relies on laborious immunohistochemistry or genetic assays on biopsied tissue; however, its intraoperative assessment via MS measurement of 2HG could influence surgical decisions. An increasing body of evidence shows that more aggressive resection of IDH-mutant gliomas improves overall and progression-free survival, while more aggressive resection of wild-type tumors does not.33, 34 Furthermore, the assessment of IDH mutation is required for tumor diagnosis following the 2016 WHO diagnostic criteria for central nervous system tumors.35 Intraoperative testing could benefit neuropathologists by providing a more accurate diagnostic consultation, for example, achieving an unequivocal diagnosis of diffuse glioma intraoperatively, particularly at the edge of a tumor. This is very challenging by pathology and often results in a nonspecific diagnosis. Having concurrent access to supporting molecular information should bolster the diagnostic yield. In addition, it is conceivable that emerging intraoperative therapies (e.g., BCNU wafers)36 may require better classification of diffuse gliomas intraoperatively to guide better decision making.
Supplementary Material
S1 File. Table S1 and S2. Figures S1–S7. Video S1. (PDF)
Acknowledgments
We thank Dr. Zane Baird for assembling the swab touch spray interface. The research was supported by the National Institute of Biomedical Imaging and Bioengineering, NIH grant R21EB015722, and the Purdue University Center for Cancer Research.
References
- 1.Hervey-Jumper SL, Berger MS. J Neurooncol. 2016;130:269–282. doi: 10.1007/s11060-016-2110-4. [DOI] [PubMed] [Google Scholar]
- 2.Young RM, Jamshidi A, Davis G, Sherman JH. Ann Transl Med. 2015;3:121. doi: 10.3978/j.issn.2305-5839.2015.05.10. [DOI] [PMC free article] [PubMed] [Google Scholar]
- 3.Eidel O, Burth S, Neumann JO, Kieslich PJ, Sahm F, Jungk C, Kickingereder P, Bickelhaupt S, Mundiyanapurath S, Bäumer P, Wick W, Schlemmer H-P, Kiening K, Radbruch A. PLoS One. 2017;12:e0169292. doi: 10.1371/journal.pone.0169292. [DOI] [PMC free article] [PubMed] [Google Scholar]
- 4.Orringer D, Lau D, Khatri S, Zamora-Berridi GJ, Zhang K, Wu C, Chaudhary N, Sagher O. J Neurosurg. 2012;117:851–859. doi: 10.3171/2012.8.JNS12234. [DOI] [PubMed] [Google Scholar]
- 5.Jarmusch AK, Pirro V, Kerian KS, Cooks RG. Analyst. 2014;139:4785–9. doi: 10.1039/c4an00959b. [DOI] [PMC free article] [PubMed] [Google Scholar]
- 6.Pirro V, Jarmusch AK, Vincenti M, Cooks RG. Anal Chim Acta. 2015;861:47–54. doi: 10.1016/j.aca.2015.01.008. [DOI] [PMC free article] [PubMed] [Google Scholar]
- 7.Nemes P, Vertes A. Trends Anal Chem. 2011;34:22–33. [Google Scholar]
- 8.Balog J, Sasi-Szabó L, Kinross J, Lewis MR, Muirhead LJ, Veselkov K, Mirnezami R, Dezső B, Damjanovich L, Darzi A, Nicholson JK, Takáts Z. Sci Transl Med. 2013;5:194ra93. doi: 10.1126/scitranslmed.3005623. [DOI] [PubMed] [Google Scholar]
- 9.Liu J, Wang H, Manicke NE, Lin JM, Cooks RG, Ouyang Z. Anal Chem. 2010;82:2463–2471. doi: 10.1021/ac902854g. [DOI] [PubMed] [Google Scholar]
- 10.Kerian KS, Jarmusch AK, Cooks RG. Analyst. 2014;139:2714–20. doi: 10.1039/c4an00548a. [DOI] [PMC free article] [PubMed] [Google Scholar]
- 11.Alfaro CM, Jarmusch AK, Pirro V, Kerian KS, Masterson TA, Cheng L, Cooks RG. Anal Bioanal Chem. 2016;408:5407–14. doi: 10.1007/s00216-016-9627-4. [DOI] [PMC free article] [PubMed] [Google Scholar]
- 12.Kerian KS, Jarmusch AK, Pirro V, Koch MO, Masterson TA, Cheng L, Cooks RG. Analyst. 2015;140:1090–8. doi: 10.1039/c4an02039a. [DOI] [PMC free article] [PubMed] [Google Scholar]
- 13.Yoshimura K, Chen LC, Mandal MK, Nakazawa T, Yu Z, Uchiyama T, Hori H, Tanabe K, Kubota T, Fujii H, Katoh R, Hiraoka K, Takeda S. J Am Soc Mass Spectrom. 2012;23:1741–9. doi: 10.1007/s13361-012-0447-2. [DOI] [PubMed] [Google Scholar]
- 14.Hayashi Y, Zaitsu K, Murata T, Ohara T, Moreau S, Kusano M, Tanihata H, Tsuchihashi H, Kishii A, Ishikawa T. Anal Chim Acta. 2017 doi: 10.1016/j.aca.2017.06.047. [DOI] [PubMed] [Google Scholar]
- 15.Yang Q, Wang H, Maas JD, Chappell WJ, Manicke NE, Cooks RG, Ouyang Z. Int J Mass Spectrom. 2012;312:201–7. doi: 10.1016/j.ijms.2011.05.013. [DOI] [PMC free article] [PubMed] [Google Scholar]
- 16.Manicke NE, Bills BJ, Zhang C. Bioanalysis. 2016;8:589–606. doi: 10.4155/bio-2015-0018. [DOI] [PubMed] [Google Scholar]
- 17.Gómez-Ríos GA, Liu C, Tascon M, Reyes-Garcés N, Arnold DW, Covey TR, Pawliszyn J. Anal Chem. 2017;89:3805–09. doi: 10.1021/acs.analchem.6b04737. [DOI] [PubMed] [Google Scholar]
- 18.Gómez-Ríos GA, Reyes-Garcés N, Bojko B, Pawliszyn J. Anal Chem. 2016;88:1259–65. doi: 10.1021/acs.analchem.5b03668. [DOI] [PubMed] [Google Scholar]
- 19.Cooks RG, Ouyang Z, Takats Z, Wiseman JW. Science. 2006;311:1566–70. doi: 10.1126/science.1119426. [DOI] [PubMed] [Google Scholar]
- 20.Jarmusch AK, Pirro V, Baird Z, Hattab EM, Cohen-Gadol AA, Cooks RG. Proc Natl Acad Sci U S A. 2016;113:1486–91. doi: 10.1073/pnas.1523306113. [DOI] [PMC free article] [PubMed] [Google Scholar]
- 21.Pirro V, Jarmusch AK, Alfaro CM, Hattab EM, Cohen-Gadol AA, Cooks RG. Analyst. 2017;142:449–54. doi: 10.1039/c6an02645a. [DOI] [PubMed] [Google Scholar]
- 22.Santagata S, Eberlin LS, Norton I, Calligaris D, Feldman DR, Ide JL, Liu X, Wiley JS, Vestal ML, Ramkissoon SH, Orringer DA, Gill KK, Dunn IF, Dias-Santagata D, Ligon KL, Jolesz FA, Golby AJ, Cooks RG, Agar NY. Proc Natl Acad Sci U S A. 2014;111:11121–6. doi: 10.1073/pnas.1404724111. [DOI] [PMC free article] [PubMed] [Google Scholar]
- 23.Pirro V, Alfaro CM, Jarmusch AK, Hattab EM, Cohen-Gadol AA, Cooks RG. Proc Natl Acad Sci U S A. 2017 doi: 10.1073/pnas.1706459114. [DOI] [PMC free article] [PubMed] [Google Scholar]
- 24.Eberlin LS, Tibshirani RJ, Zhang J, Longacre TA, Berry GJ, Bingham DB, Norton JA, Zare RN, Poultsides GA. Proc Natl Acad Sci U S A. 2014;111:2436–41. doi: 10.1073/pnas.1400274111. [DOI] [PMC free article] [PubMed] [Google Scholar]
- 25.Eberlin LS, Margulis K, Planell-Mendez I, Zare RN, Tibshirani R, Longacre TA, Jalali M, Norton JA, Poultsides GA. PLoS Med. 2016;13:e1002108. doi: 10.1371/journal.pmed.1002108. [DOI] [PMC free article] [PubMed] [Google Scholar]
- 26.Cohen AL, Holmen SL, Colman H. IDH1 and IDH2 mutations in gliomas. Curr Neurol Neurosci Rep. 2013;13:345. doi: 10.1007/s11910-013-0345-4. [DOI] [PMC free article] [PubMed] [Google Scholar]
- 27.Eberlin LS, Ferreira CR, Dill AL, Ifa DR, Cheng L, Cooks RG. Chembiochem. 2011;12:2129–32. doi: 10.1002/cbic.201100411. [DOI] [PMC free article] [PubMed] [Google Scholar]
- 28.Woolman M, Tata A, Bluemke E, Dara D, Ginsberg HJ, Zarrine-Afsar A. J Am Soc Mass Spectrom. 2017;28:145–53. doi: 10.1007/s13361-016-1506-x. [DOI] [PubMed] [Google Scholar]
- 29.Moffett JR, Ross B, Arun P, Madhavarao CN, Namboodiri AM. Prog Neurobiol. 2007;81:89–131. doi: 10.1016/j.pneurobio.2006.12.003. [DOI] [PMC free article] [PubMed] [Google Scholar]
- 30.Yannell KE, Smith K, Alfaro CM, Jarmusch AK, Pirro V, Cooks RG. Clin Chem. 2017 doi: 10.1373/clinchem.2017.279364. accepted. [DOI] [PubMed] [Google Scholar]
- 31.Cohen BA, Knopp EA, Rusinek H, Babb JS, Zagzag D, Gonen O. Am J Neuroradiol. 2005;26:2170–7. [PMC free article] [PubMed] [Google Scholar]
- 32.Xu W, Yang H, Liu Y, Yang Y, Wang P, Kim SH, Ito S, Yang C, Wang P, Xiao MT, Liu LX, Jiang WQ, Liu J, Zhang JY, Wang B, Frye S, Zhang Y, Xu YH, Lei QY, Guan KL, Zhao SM, Xiong Y. Cancer Cell. 2011;19:17–30. doi: 10.1016/j.ccr.2010.12.014. [DOI] [PMC free article] [PubMed] [Google Scholar]
- 33.Tietze A, Choi C, Mickey B, Maher EA, Parm Ulhøi B, Sangill R, Lassen-Ramshad Y, Lukacova S, Østergaard L, von Oettingen G. J Neurosurg. 2017;3:1–8. doi: 10.3171/2016.10.JNS161793. [DOI] [PubMed] [Google Scholar]
- 34.Beiko J, Suki D, Hess KR, Fox BD, Cheung V, Cabral M, Shonka N, Gilbert MR, Sawaya R, Prabhu SS, Weinberg J, Lang FF, Aldape KD, Sulman EP, Rao G, McCutcheon IE, Cahill DP. Neuro Oncol. 2014;16:81–91. doi: 10.1093/neuonc/not159. [DOI] [PMC free article] [PubMed] [Google Scholar]
- 35.Louis DN, Perry A, Reifenberger G, von Deimling A, Figarella-Branger D, Cavenee WK, Ohgaki H, Wiestler OD, Kleihues P, Ellison DW. Acta Neuropathol. 2016;131:803–820. doi: 10.1007/s00401-016-1545-1. [DOI] [PubMed] [Google Scholar]
- 36.Urbschat S, Sippl C, Engelhardt J, Kammers K, Oertel J, Ketter R. Mol Cytogenet. 2017;10:16. doi: 10.1186/s13039-017-0317-5. [DOI] [PMC free article] [PubMed] [Google Scholar]
Associated Data
This section collects any data citations, data availability statements, or supplementary materials included in this article.
Supplementary Materials
S1 File. Table S1 and S2. Figures S1–S7. Video S1. (PDF)