Introduction
Since the initial prototype of a resting functional magnetic resonance (fMR) imaging analysis pipeline by Biswal and colleagues1 in 1995, it has been known that fMR imaging data capture spontaneous fluctuations that have an interesting structure (eg, lateralization that closely corresponds with functionally known regions such as motor cortex) representing brain activity. Extant approaches typically assume little about the temporal evolution of the signal or causal circuits, primarily looking only for evidence of coupling between time courses, instantiated in statistical correlations. In this realm, data-driven approaches are greatly needed to enabling the identification of novel relationships that were not predicted a priori. This article discusses 3 different domains: a spatial domain, a temporal domain, and a group (subject) domain, considering a spectrum of data-drivenness along temporal and spatial domains (Fig. 1). In the spatial domain, models at the most deterministic end of the spectrum define a specific region of interest or use a predetermined atlas to investigate activation. A more flexible approach is to start with an atlas and perform a constrained clustering to allow the data at hand to inform parcellation of activations. In addition, at the least predetermined end of the spectrum, fully data-driven discovery of activation patterns can be performed. In the temporal domain, a fixed time course can be assumed (as in seed-based connectivity) that is driven by the data at hand but takes a rigid approach by assuming the time course has a specific shape. Alternatively, the focus can be on an indirect measure such as amplitude of low-frequency fluctuation.2 The most flexible approach is to perform data-driven discovery of underlying temporal covariance between brain locations. At the subject domain, assumptions can be made about subject labels (eg, diagnosis) to create a priori groups, but these may be challenged by instability within qualitative criteria,3 poor segregation between features of interest (eg, genetic and neuropsychiatric characteristics), or subjects with overlapping phenotypes (eg, diagnostic comorbidity). Alternatively, investigators can allow for outliers by examining subjects for whom the data suggest that a different category may be more appropriate, by using available information to constrain the interpretation.4 In addition, fully data-driven discovery of subject groups can be performed.5,6
Fig. 1.
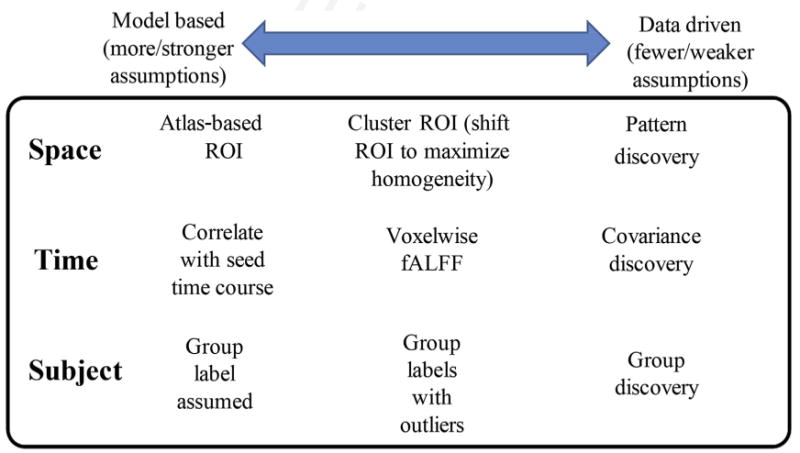
A spectrum of data-drivenness.
One of the most widely used data-driven approaches applied to fMR imaging data is independent component analysis (ICA), which enables fully data-driven discovery of spatial patterns, temporal covariance, and even groups, as discussed in this article. ICA is exceptionally well suited to fMR imaging analysis given its robustness to artifacts, minimal assumptions on the shape of the time course or the spatial patterns, and ease of estimation.
The Basics of Independent Component Analysis Applied to Functional Magnetic Resonance Imaging Data
ICA of fMR imaging is most commonly implemented as spatial ICA, in which fMR imaging data are separated into a set of maximally spatially independent maps and their associated time courses. Here, “map” denotes the collective signal associated with neuronal masses with a similar activation pattern, although they may be spatially distant, and the time course of the signal from their aggregated voxels over the course of the scan. ICA is a type of matrix decomposition.
Here, the fMR imaging data organized as time by voxels are represented as a matrix X, and the ICA decomposition is represented as X = A, where A is the unmixing matrix containing the time courses, and the rows of S contain the sources (spatial maps). There are several key benefits to this approach that have led to the widespread use of ICA. First, it does not require an assumption about the shape or nature of the time course for each component. Second, each spatial map has a value at each voxel, thus it provides a spatial filtering aspect that can be used to1 separate artifactual signal from good signal, or2 separate overlapping but distinct patterns arising from the same voxel,3 identify multiple networks that may have overlapping nodes. Third, it provides a data-driven, functional parcellation of the brain, thereby reducing bias and allowing more flexibility in the consideration of subjects who may vary from standard atlases.
The multisubject extension of ICA (group ICA) was first proposed at the turn of the century7 and has since become the dominant ICA approach for fMR imaging data.8 Group ICA uses the fMR imaging data from all subjects to estimate aggregate components (maps that are present in all subjects), then subsequently performs an approach called back-reconstruction to estimate single-subject maps and time courses. There are multiple ways to perform back-reconstruction, ranging from regression-based approaches (eg, spatiotemporal or dual regression) to inversion-based approaches, which are discussed and compared in detail in a previous work.9 A newer approach to back-reconstruction called group information-guided ICA (GIG-ICA), is a fully automated approach that estimates ICA first on the group level, then reoptimizes the ICA for each subject. It has been shown to be more sensitive to group differences and is better able to capture artifacts.10,11
There have been several more general reviews of ICA of fMR imaging over the years that discuss the basic concepts.8,12–14 This article takes a different approach, expanding on 10 observations that highlight various aspects of the practical use of ICA in analysis that the authors think will be of use to readers. The examples provided are largely from our own work, but this article draws on other citations in order to represent the extensive amount of work performed related to ICA of fMR imaging (eg, querying “independent component” and “fMR imaging” in PubMed shows that approximately 2000 articles have been published).
One of the most scientifically appealing attributes of ICA is its ability to extract components from the mixed fMR imaging signal that represents large-scale neural networks.
These components are highly tractable to subsequent approaches examining many features of their temporal, spatial, and dynamic structures. For example, our own software platform GIFT (http://mialab.mrn.org/software/gift/) makes whole-brain networks available to view and analyze on a subject, component, or multi-network basis, including grouping into the primary neurocognitive functions (Fig. 2), as desired. A wide array of brain function measures, ranging from basic individual intranetwork integrity to averaged functional connectivity to complex features of internetwork brain dynamism, may be analyzed using the extracted components, in tandem with behavioral, psychiatric, demographic, genetic, or other subject characteristics. Tools provided in GIFT show the breadth and depth of ICA techniques for analyzing single or multiple subjects and static or dynamic connectivity, and providing more than a dozen ICA algorithms, including standard algorithms such as infomax15 and fastICA16; advanced and more flexible algorithms, such as entropy-bound minimization17; and additional advanced algorithms, including independent vector analysis18 and constrained ICA.19,20 There are many visualization tools, including single-component or multi-component viewing tools, statistical analysis of maps and/or time courses, and toolboxes for dynamic connectivity and advanced statistical analysis.
Fig. 2.
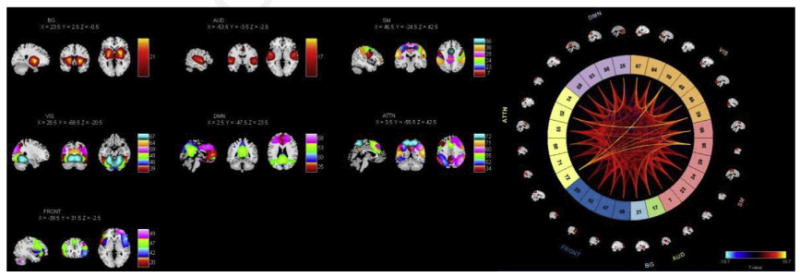
Examples of graphical output from the GIFT ICA software.
Number 1: Independent Component Analysis Approaches are Robust to Artifacts
One of the benefits of data-driven approaches is they fit the data better because there are more flexible. This flexibility means they fit not only signals of interest but also the artifacts. Although this can be a negative issue (eg, fitting outliers in the data better could imply overfitting to noise), in the case of blind source separation approaches like ICA, the goal is to separate the signals or sources from one another. This separation can be leveraged in several ways; for example, ICA can be used to denoise the data (for use in a subsequent analysis; eg, by a general linear model [GLM] approach) or this benefit can be exploited directly by further analyzing the good components in the context of an ICA analysis. As discussed in more detail later, there are now multiple strategies in use, including the use of single-subject21-23 or group-level10 ICA denoising. One of the benefits of the GIG-ICA approach is that it can robustly remove the impact of artifacts but does not require time-consuming training.10 Another benefit is it gives researchers a second opportunity to remove motion artifact after the initial data preprocessing. An example of this approach in which ground truth maps are compared with the estimated components for several approaches in GIG-ICA is shown in Fig. 3.
Fig. 3.
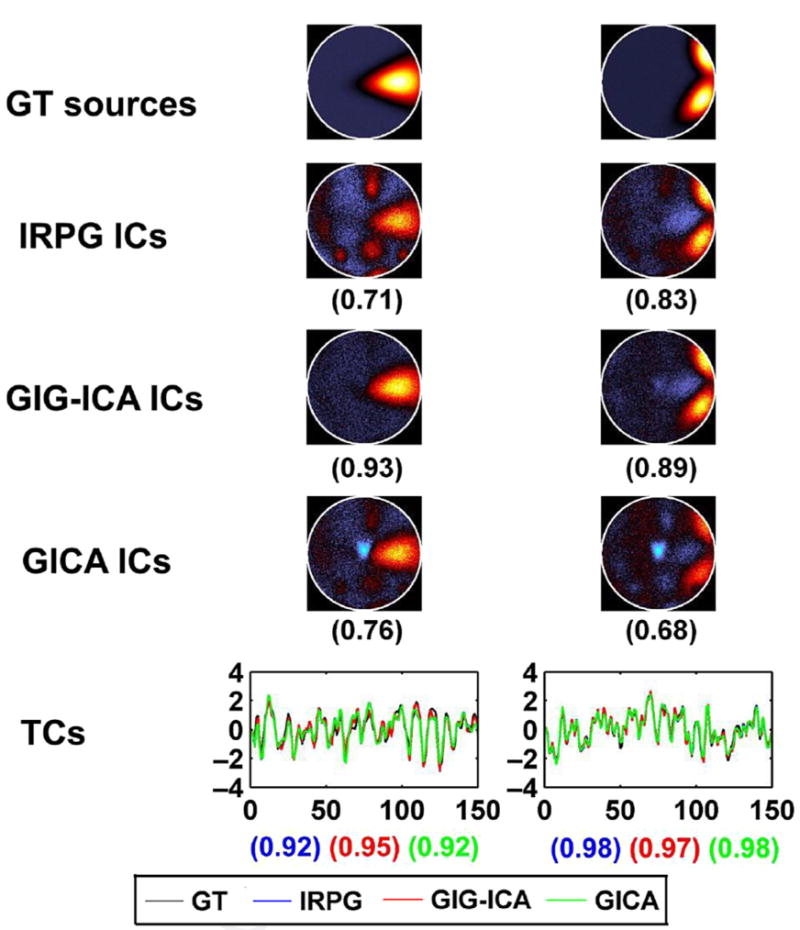
GIG-ICA for artifact removal. Individual independent components (ICs) and time courses (TCs) for 1 subject obtained from Individual ICA Artifact Removal Plus Group ICA (IRPG), GIG-ICA, and standard group ICA (GICA). The values in parentheses under each estimated IC are the relevant correlation coefficients between the IC and the ground truth (GT) source. The last row shows related TCs. The correlation values under TCs from left to right correspond with IRPG, GIG-ICA, and GICA, respectively. Note that only the nonartifact ICs/TCs are shown. (Modified from Du YH, Allen EA, He H, et al. Artifact removal in the context of group ICA: a comparison of single-subject and group approaches. Hum Brain Mapp 2016;37(3):1005–25.)
Importantly, because the components have a value at every voxel, this results in a type of spatial filtering (in contrast with approaches based on hard sparsity that move voxels to zero for regions not strongly contributing). This spatial filtering enables ICA to both separate artifacts from signals of interest10,22 and also separate task-related events that are overlapping (and in some cases may even cancel out within a single voxel).24,25 As such, ICA is not a pure parcellation scheme in that it requires thresholding to split the brain into separate regions, hence straddling the line between lumping and'splitting.26 ICA can be used to evaluate the degree to which the fMR imaging response to a task is positive, negative, or neutral (Fig. 4).24
Fig. 4.
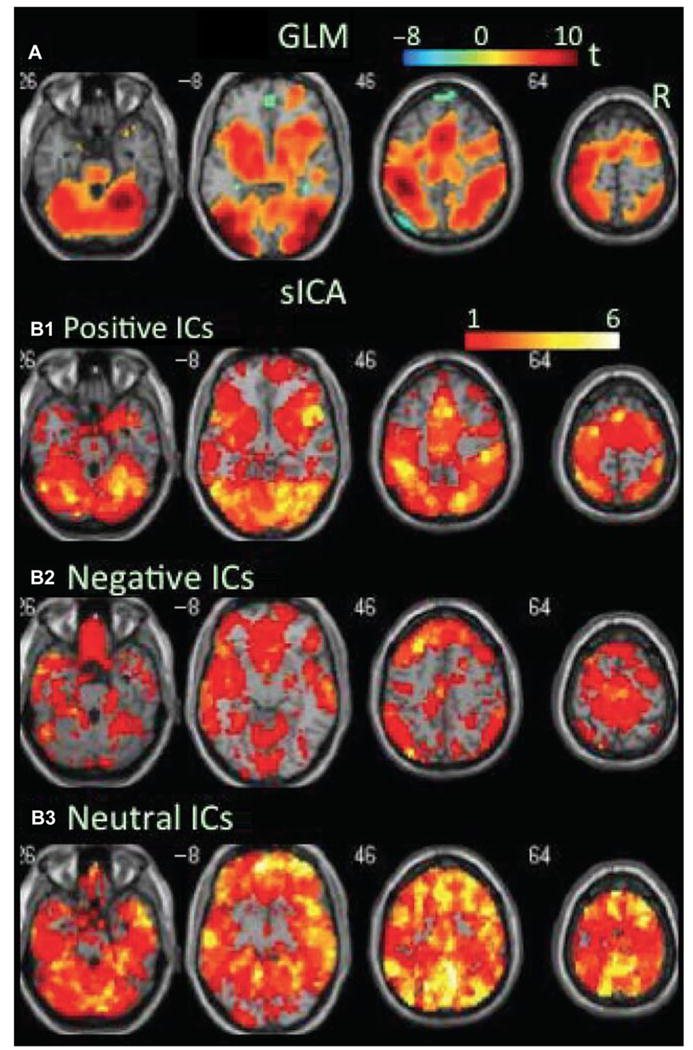
Task-related modulation in blood oxygenation level-dependent (BOLD) signal during the congruent condition of the flanker task. (A) Color on the brain images shows task-related increases and decreases in BOLD signal as revealed by GLM-based analyses. The color bar indicates t values. (B1–B3) Color on the brain images shows regions covered by positive, negative, and neutral ICs, respectively. The color bar indicates the number of overlapping ICs. (Modified from Xu JS, Calhoun VD, Worhunsky PD, et al. Functional network overlap as revealed by fMRI using sICA and its potential relationships with functional heterogeneity, balanced excitation and inhibition, and sparseness of neuron activity. PLoS One 2015;10(2):e0117029.)
Number 2: Independent Component Analysis is Agnostic to the Temporal Evolution of Brain Activity Signals
One of the early applications of ICA was to analyze task-related fMR imaging data without requiring a specific temporal model. In the early ICA studies of task-based designs, transient task-related activity was captured by independent components enabling investigators to better understand how the brain is responding in regions where activity does not perfectly temporally correspond with the task.27,28 This property is likely one of the main reasons ICA is so widely used on resting fMR imaging data, because in this case there is no temporal model available because the subject is resting quietly without the presence of an externally controlled stimulus. ICA is free of assumptions about the temporal evolution of the data. Subject time courses can be unknown, not synchronized across individuals, and ICA extracts components that show considerable anatomic and functional structure, with some showing bilateral or anterior/posterior symmetry (Fig. 5). This benefit is a direct result of the blind source separation (BSS) approach originally motivated by the cocktail party problem, in which multiple microphones are recording sound from multiple conversations in a room: the goal of BSS is to take the multiple microphone recordings and unmix them to get to the original sources without knowing how those sources were generated. This process finds a strong parallel in resting-state fMR imaging, in which there is a mixed signal from the whole brain arising from many brain areas.
Fig. 5.
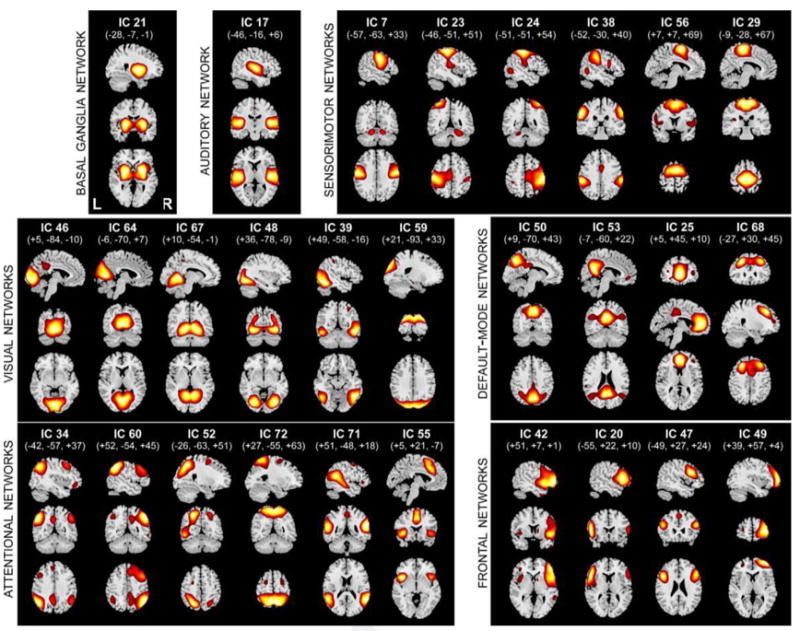
Example ICA component spatial maps from rest fMR imaging data. (Modified from Allen EA, Erhardt EB, Damaraju E, et al. A baseline for the multivariate comparison of resting-state networks. Front Syst Neurosci 2011;5(2):2.)
Number 3: Independent Component Analysis Components can be Coupled to One Another Spatially and Temporally
Importantly, maximal independence does not remove all information about spatial coupling between different components. The linear unmixing assumption identifies components that highlight regions showing strong temporal correlation (within network connectivity); however, there can still be considerable temporal correlation between components. This correlation is known as functional network connectivity (FNC) or among network connectivity.29 It is one of the most powerful ways to use ICA, in that it can provide information about which components are fluctuating together, which are anticorrelated with one another, and which are not correlated at all; this provides a wealth of information about the functional relationships between large-scale neural networks. The observations from an FNC analysis also show face validity in that separate components with similar primary neurocognitive functions tend to be highly correlated with one another. For example, different components may be extracted that are all primarily associated with visual function, and these are highly correlated with each other, and it is similar for motor or default mode components. These attributes open up the opportunity to examine functional connectivity patterns within neurocognitive domains containing multiple networks. In addition, default mode components tend to be seen as weakly negatively correlated with other networks, also consistent, but extending, early observations about the default mode network (Fig. 6 less than). FNC has also been widely used to identify group differences or even individual subject classification,30–32 and differences in FNC can profitably be analyzed for associations with symptoms or quantitative characteristics.
Fig. 6.
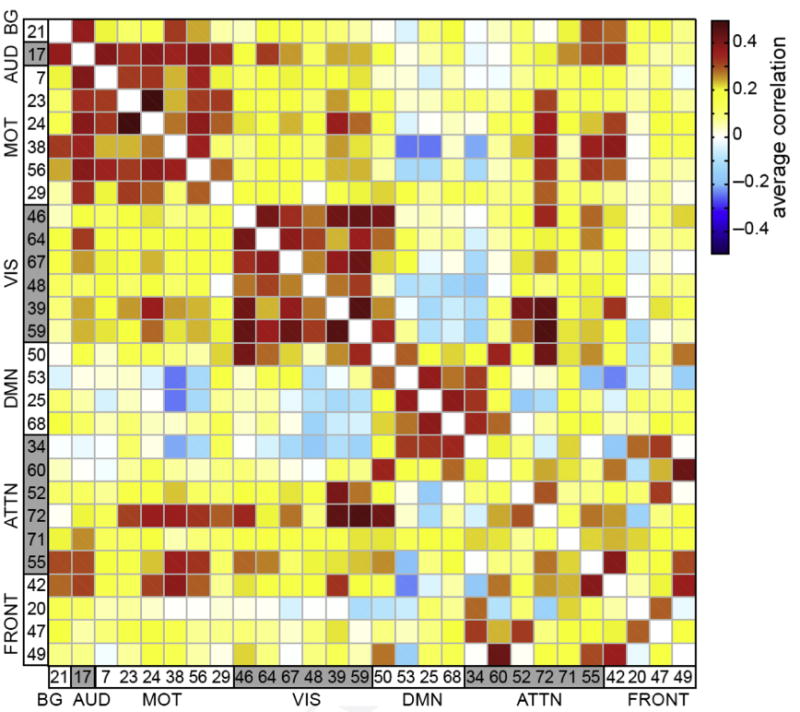
Example of FNC. The component maps are ordered as shown in Fig. 5. Considerable modularity is observable within the matrix; for example, visual and motor regions tend to be most highly correlated with themselves and the default mode network is showing anticorrelation with multiple other networks. (Modified from Allen EA, Erhardt EB, Damaraju E, et al. A baseline for the multivariate comparison of resting-state networks. Front Syst Neurosci 2011;5(2):2.)
Previous work has also shown that, despite spatial independence being maximized using mutual information, spatial coupling among the components can still be identified, revealing interesting hierarchical structure to network relationships33 even across neurocognitive domains. When working with ICA components it can be informative to evaluate not only the time courses and spatial maps but also their temporal and spatial coupling. Temporal FNC and spatial FNC, both dynamic and static, have grown to be among the most widely used ways of querying the results from an ICA of fMR imaging analysis.
Number 4: Independent Component Analysis may be Data Driven but it is also useful for Hypothesis-Based Studies
This observation may be obvious given the large amount of work on the topic, but an important point to keep in mind is that, although ICA represents a data-driven approach for parcellating the brain into components, this does not preclude the use of ICA for hypothesis testing. In these schemata, ICA acts as an efficient, robust, and flexible way to extract brain networks and time courses to test specific, formulated hypotheses. This can be done in many ways, by generating a hypothesis to test before the analysis regarding specific widely identified networks (such as default mode34) or by deciding a priori to only test components that have large contributions from specific regions. Network maps can also be taken from a previous analysis and used to reconstruct components from a new data set.19,20,35 These approaches are very useful when trying to use ICA for single-subject prediction, because they ensure that the data on which the analysis is predicted are completely separate from the data that were used to generate the maps and the prediction algorithm.32
Assumptions of Independent Component Analysis
Importantly, ICA also has several embedded assumptions. For example, ICA is most widely used in its linear form (ie, linear mixing of the components). As such, it can be mathematically described as the multiplication of 2 matrices, exactly as in the GLM approach. In this case, after ICA has estimated the maps and time courses, it can be considered to be very similar to a seed-based approach in which the map represents the connectivity associated with the time courses (after accounting for the other component time courses),36 with the added benefit that the ICA-derived map is data driven. Another important assumption is that the sources can be separated by assuming that they are spatially independent. This assumption, although perhaps not perfectly satisfying, has worked extremely well in fMR imaging data because networks are typically found that are not systematically overlapping.
Number 5: There is No Perfect Number of Components
One of the often-asked questions about ICA is how many components should be selected. The choice here is between high-order models with larger numbers of components, and low-order models with fewer. Higher model orders do more splitting and produce more focal components, whereas lower model orders produce larger networks. This difference is sometimes addressed by visually comparing results from multiple component numbers.37 Available software tools (eg, GIFT, MELODIC) have algorithms for estimating the number of components and multiple articles have proposed different approaches for solving this order selection problem.38–40 Typically, such approaches estimate somewhere between 20 and 50 components, although recently there has been a trend to estimate higher model orders (eg, 100 or 120 components or more). The benefit of this is that the resulting components are more focal, and it also allows researchers to estimate the FNC between subnodes within a given domain (eg, default mode network subnodes).
Note that a low-order model designed to estimate 20 components will include a set of good components (ie, networks) as well as noise components that will ultimately be discarded from the analysis. As a general rule, the authors typically find that 50% to 70% of components survive as networks. If the ICA produces ∼10 networks, it may prove challenging to isolate specific known functional networks of interest in the study design, depending on the degree of granularity the researcher requires. For example, in a low-order model, the frontoparietal network (also called the central executive network) will be present as a single network rather than as lateralized left and right frontoparietal networks.41 Thus, for researchers interested in the functional properties of individual networks, a higher order model may also be preferred to differentiate more networks. The authors generally find that a model order of ∼75 to 100 components results in 30 to 50 networks in which the major identified networks are present as well as multiple subnetworks in neurocognitive domains such as vision, attention, or the default mode networks.
Importantly, there is a hierarchical relationship between low and high model order analyses, and this is clearly visible in the modular structure of the FNC matrix in Fig. 6, which shows, for example, that visual components tend to be more highly correlated to themselves. These correlated components are then more likely to group together at lower model orders. The authors have recently shown that a low model order ICA can be predicted almost perfectly from a high model order ICA (Rachakonda S, Du Y, Calhoun VD, model order prediction in ICA, submitted for publication). This property makes it possible to zoom up and down in the data to see how the maps split or stay together at different levels or granularity (Fig. 7).
Fig. 7.
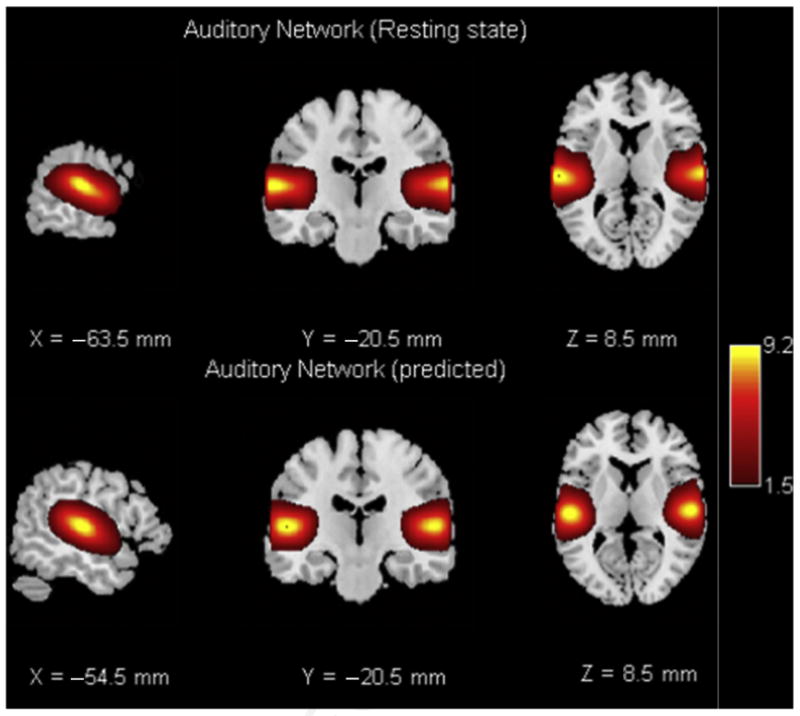
The top row shows a temporal lobe component from resting-state analysis and the bottom row is a predicted temporal lobe component from a different data set.
Number 6: Independent Component Analysis Results are Robust to False-Positives and Spatial Autocorrelation Assumptions Compared with General Linear Model Analyses
It has been pointed out recently to the brain imaging community that some data preprocessing steps can induce inflated false-positive rates when using cluster-wise tests based on parametric statistical methods. Specifically, spatial smoothing changes the autocorrelation structure of the data, potentially incrementing the number of false-positive results. This problem has long been known as a potential pitfall in the analysis of fMR imaging time series. A recent publication, although polemic and exaggerated in its claims, highlights problems related to data preprocessing and suggests that many fMR imaging studies may be affected.42 In this circumstance, it is critical to reevaluate the methods used to preprocess and analyze neuroimaging data.
One characteristic of ICA is the goal of finding components with maximal statistical independence that tend to diminish spatial cross-correlations. Another important characteristic in ICA is the use of high-order statistics; for example, through entropy or kurtosis measures, which allows a more comprehensive estimation of independent signal sources and reduced influence of artifacts that may arise during preprocessing. Based on these characteristics, the authors argue that ICA offers advantages that might reduce the problem of inflated false-positives caused by data preprocessing. Through empirical testing, the authors evaluated the false-positive rates in the context of ICA. Results indicate false-positive rates less than 5% for P-value thresholds of .05 after false-discovery-rate correction. As anticipated, based on an argued resilience to preprocessing artifacts, ICA delivered low false-positive rates, even when using standard parametric testing. These results suggest that findings from ICA tend to be statistically conservative, providing further evidence for the validity of results obtained using ICA (Fig. 8).
Fig. 8.
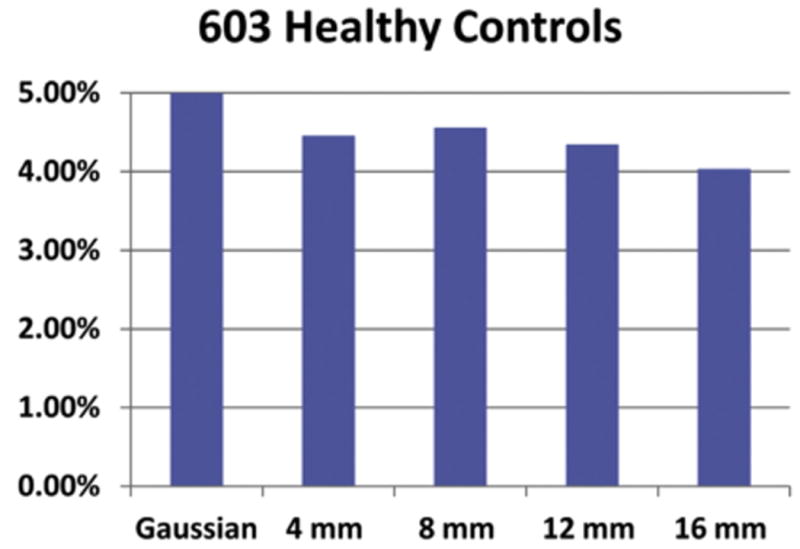
Ratio of false-positives found for group ICA with 28 components on a population of 603 healthy subjects. One million iterations were performed to estimate the false-positive ratio by randomly assigning healthy subjects to 1 of 2 groups.
Number 7: The Mantra of “Garbage in Garbage Out” Rings True, but with Independent Component Analysis One Person's Garbage may be Another's Gold
The history of ICA with fMR imaging is replete with examples of studies using it to identify new and interesting aspects of the data that researchers did not know to look for before. For example, the initial use of ICA modeled the ICA time courses using a task-based approach, but then so-called transient task-related effects were observed,7,27,43,44 including an early example of the now widely studied default mode network.28 The use of ICA also identified spatially structured but non-task-related components within task-fMR imaging data and shortly thereafter in resting-state fMR imaging data.
Another interesting example of this is in results that advance the important research topic of how resting-state and task-based networks and activation patterns relate to each other. Here, ICA was used to identify structure in covariation among task activation maps, again yielding intrinsic networks that look very similar to those now widely studied in resting fMR imaging data.45 The goal was to explicitly compare the networks obtained from a first-level ICA (ICA on the spatiotemporal fMR imaging data) with those from a second-level ICA (ICA on computed features or second-level maps rather than on the first-level fMR imaging data). Convergent results from simulations, task-fMR imaging data, and resting-state fMR imaging data show that a second-level analysis, although slightly noisier than the first-level analysis, yields strikingly similar patterns of intrinsic networks (spatial correlations as high as 0.85 for task data and 0.65 for rest data, considerably greater than the empirical null). Second-level ICA results also largely preserve the relationship of these networks with other variables, such as age (eg, default mode network regions tended to show decreased low-frequency power for first-level analyses and decreased loading parameters for second-level analyses). Results comparing the 2 approaches are shown in Fig. 9. The feature-based ICA approach has also been used on smoothed peaks from a meta-analytical database, again revealing results that resemble the widely identified resting networks.41
Fig. 9.
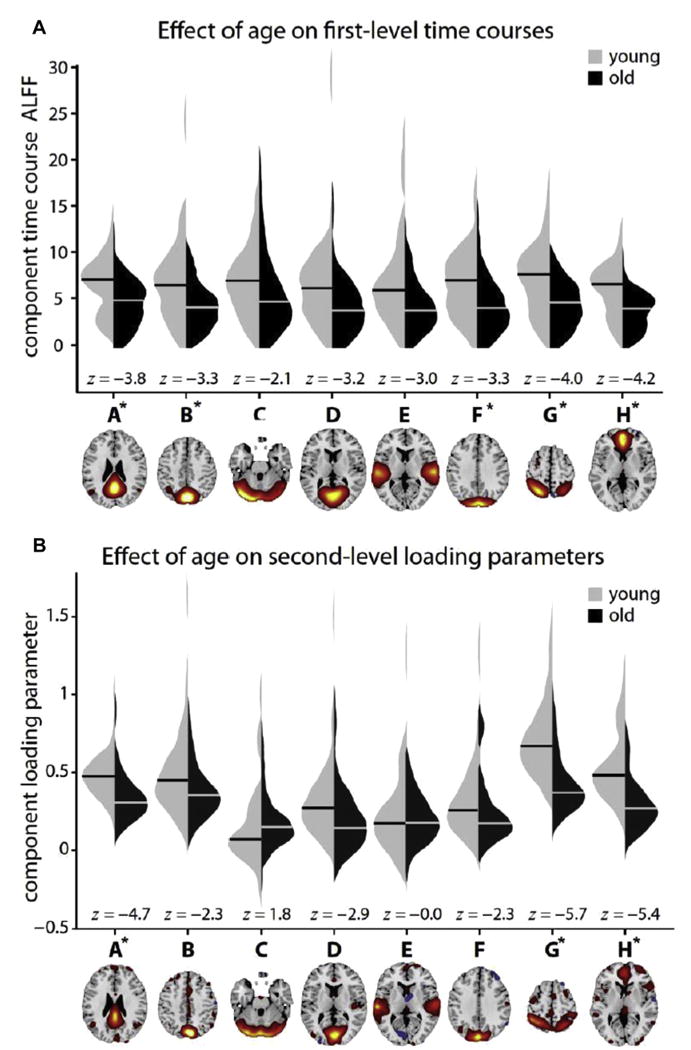
Effect of age on the amplitude of low-frequency fluctuations (ALFF). Violin plots show the distributions of ALFF estimates for young (left) and old (right) subjects (40 in each group) based on the first-level (A) and second-level (B) analyses. For the first-level analysis, ALFF values are calculated from the subject-specific TCs; for second-level analysis, ALFF values are the subject loading parameters from the ICA mixing matrix (matrix in Fig. 1B). Horizontal bars indicate the medians for each group. Because data are skewed, group differences are assessed with the nonparametric Wilcoxon rank sum test for equal medians (z-statistics are based on approximate normal distribution). Asterisks denote significantly different medians at P<.001, uncorrected. (From Calhoun VD, Allen E. Extracting intrinsic functional networks with feature-based group independent component analysis. Psychometrika 2013;78(2):243–59.)
More intriguingly, an ICA analysis of the (typically discarded) variance captured by motion covariates in an fMR imaging study also yields similar functional network patterns, suggesting that the noise removal process also captures variance of interest.46 Regression of noise and motion is aggressive for fMR imaging, for good reason, but such studies highlight that there is a cost when using such a strategy. Future studies should continue to focus on improving ways of separating artifact from noise in a more precise manner.
One of the reasons ICA is so widely used is that it pushes many of the stronger assumptions to later in the analytical pipeline. ICA benefits from many existing approaches that have strong assumptions. For example, GLM approaches are often used to perform testing on the data-driven component time courses or maps (eg, to identify task-related components47–49). In essence, ICA is used to extract spatial maps and time courses from the data that can act as a fertile analytical substrate to be evaluated or tested in multiple ways using preferred frameworks. Testing on the time course is perhaps the most common, including performing GLM analysis on the time courses.50,51 Other approaches for analyzing the time courses include graph theory52–55 and effective connectivity analysis using dynamic causal modeling.56–58 The spatial maps can also be analyzed in several ways, including performing a GLM analysis on individual components,8,51 but ICA component maps have also been used as input into classification algorithms.59
Number 8: Labeling the Independent Component Analysis Components is Still Largely Manual, but Automation Approaches Continue to Improve
One of the challenges with working with ICA is labeling/identifying the components. Perhaps the most important category is whether the components are artifacts (non–blood oxygenation level dependent [BOLD]) or should be considered intrinsic networks. Many investigators, ourselves among them, have used a semimanual approach in which visual inspection of the spatial maps, time course signal, and component spectra are combined with calculation of the low-frequency/ high-frequency power ratio. Intrinsic networks tend to have anatomically reasonable activation patterns, smoother signals and spectra, and higher power ratios. Fig. 10 compares an intrinsic network output from ICA with a noise component as an example of this. This approach is partly reliant on experience and the human eye, and often there are a few cusp components that pose challenges. Thus, further automation to improve standardization and comparability across studies is desirable. Several approaches have been proposed to automatically identify artifacts. These approaches include models that require training and running a classifier (eg, a support vector machine)21,22,60 as well as those based on a set of predefined metrics.10,23,61 They can be run either at the group level or the single-subject level.10,22 However, despite the success of such approaches, they are not perfect and there can be a cost to misclassification.10 A more recent approach using GIG-ICA is intended to avoid this noisy categorization and focus instead on the estimation of the individual components at the group level. Results are similar in the case in which the single-subject ICA artifact removal process is perfect and are improved when (inevitable) errors are made at the single-subject level.
Fig. 10.
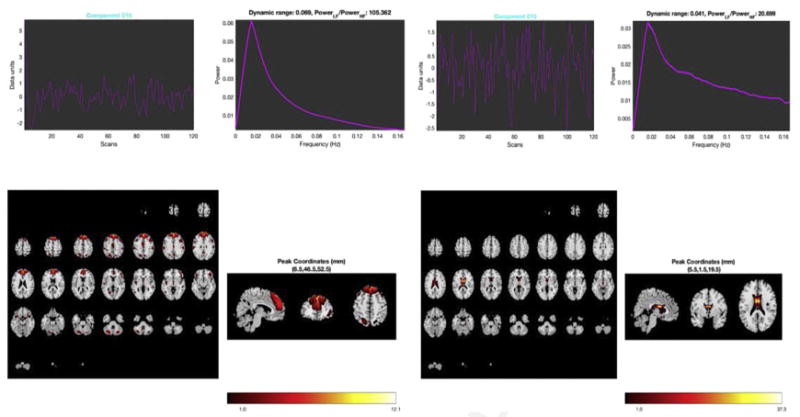
Comparison of components extracted from 75 component ICA performed on resting-state data with 120 time points in 1190 neurotypical young adults. On the left is an intrinsic network or good component. Note the smooth shape to the power spectra (dynamic range) and high low-frequency to high-frequency power ratio. The brain activation pattern is spatially aggregated and clearly in frontal gray matter areas. On the right is a bad component. Here, there is a shallow, ridged appearance to the spectra and low power ratio. Activation is restricted to the ventricles. Likely this component represents artifact from cerebrospinal fluid in the brain ventricles.
Beyond artifact detection, there is also the challenge of attributing specific neurocognitive functions to individual components as well as gathering them into resulting functional domains. Several recent articles have shown that, when this is done, the resulting structure in the FNC matrix is highly interpretable61,62 and suggests an ordered whole-brain functional architecture. Current strategies for automated attribution include drawing on preexisting component atlases combined with spatial regression for performing such labeling.63 A focus on domains or groupings of regions or components is also thought provoking. For example, a focus solely on insula regions yielded multiple unique fingerprints in a dynamic connectivity analysis.64 New methods being developed to optimize across multiple domains have yielded some interesting results.65,66 Fig. 11 shows an example of estimated joint functional domains compared with the static (averaged) FNC matrix. Future work should focus on the combination of these approaches with an automated and/or dynamic labeling approach. Such work likely draw on more dynamic and flexible atlases.67
Fig. 11.
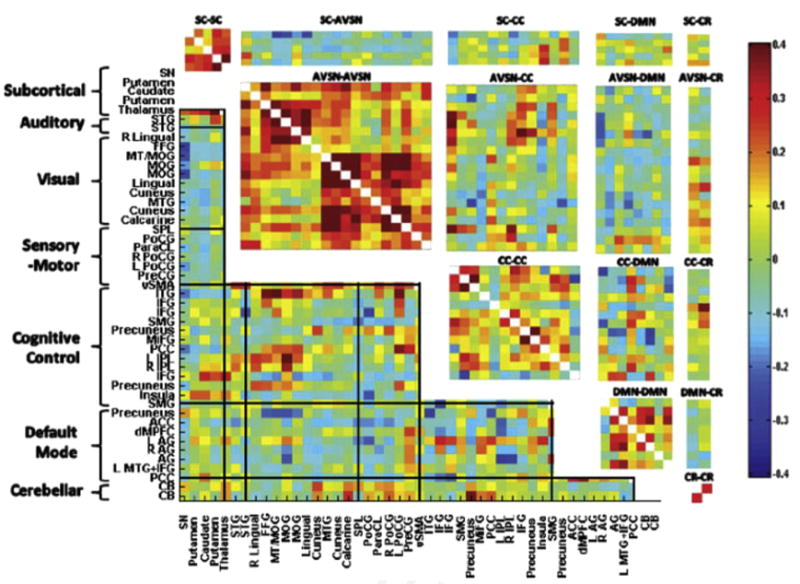
Population average of static windowed functional network connectivity matrix; that is, using all 162 time points (no windowing) for 47 ICA components (networks) obtained from a group ICA decomposition. Grid lines bound 7 functional domains. Rectangular pull-outs are 15 joint functional domain connectivity blocks estimated from the ICA data using the approach described by Miller and colleagues. (Data from Miller RL, Vergara VM, Keator DB, et al. A method for inter-temporal functional domain connectivity analysis: application to schizophrenia reveals distorted directional information flow. IEEE Trans Biomed Eng 2016;63(12):2525–39.)
Number 9: Independent Component Analysis can be Leveraged to Capture Dynamic (Time-Varying) Functional Connectivity
In recent years there have been a large number of articles focused on the estimation of time-varying connectivity patterns. This article moves beyond consideration of averaged or static connectivity across the entire resting fMR imaging experiment (see Refs.68–71 for reviews) and toward consideration of nonstationary functional connectivity, exploring how FNC changes over the time courses. One of the key advantages of ICA that are discussed here is that it minimizes assumptions made up front, including the nature of time course fluctuations, allowing an ICA decomposition to provide a powerful way to further study dynamic changes among the ICA time courses. Such work can easily be done within an ICA context using a sliding-window approach to estimate the FNC,72 other approaches including time-frequency analyses,73 or even windowless approaches that can capture instantaneous changes and do not assume temporally smooth transitions.74 The windowed approach consists of setting a chosen time interval (eg, a window of 20 TRs), computing an FNC matrix for the window and shifting the window across the time courses, and computing an FNC matrix at each point. This produces a time series of FNC matrices. Following this, clustering can be used to reduce these dynamic FNC matrices to a small number of functional connectivity states that represent connectivity patterns localized to a particular period of time.
These dynamic connectivity approaches have been shown to be a much more natural way to analyze resting fMR imaging data. They have already shown improved sensitivity to identifying group differences, brain arousal state, or diagnostic classifications from resting-state fMR imaging data.30,62 An example of FNC states estimated from resting fMR imaging collected concurrently with electroencephalogram (EEG) data is shown in Fig. 12. The states are ordered according to EEG measures of drowsiness and it is apparent that the connectivity patterns are affected by the arousal state (in particular, anticorrelated connectivity, indicated in blue, diminishes with increasing drowsiness).75,76 In terms of group differences, recent work using ICA has shown that patients schizophrenia tend to spend more time occupying a weakly connected dynamic state versus controls62 and also that dynamic FNC estimates seem to be more sensitive for classification of bipolar patients and patients with schizophrenia30 than static measures.
Fig. 12.
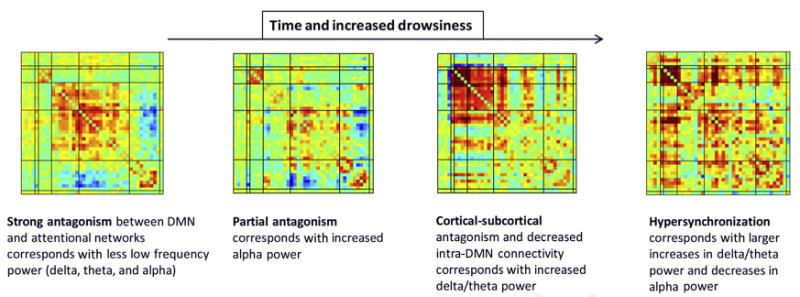
Example of dynamic functional network connectivity states estimated from a resting fMR imaging data set for which concurrent EEG data were also collected. Ordering the fMR imaging states according to EEG drowsiness measures reveals a striking pattern, because drowsiness increases the anticorrelated functional connectivity with the default mode network and diminishes that with other networks.
Researches can also focus on the spatial maps to identify changes in the connectivity nodes over time77,78 or across both spatial nodes and time courses.79 Approaches that incorporate models of spatial patterns changes over time are extremely interesting, have implications for studies that attempt to create atlases of the human brain, and are currently understudied.
Number 10: Independent Component Analysis Algorithm Development is Ongoing
New ICA and related algorithms are constantly being developed for application to brain imaging data. For example, the incorporation of multiple types of statistical diversity (such as independence and sparsity) has already been done within existing algorithms but is not yet fully understood. For example, the widely used infomax algorithm incorporates aspects of both independence and sparsity, leading to some interesting ongoing discussions.80 The combination of both sparsity and independence (as well as other types of statistical diversity) to varying degrees may provide a more powerful toolkit for querying resting-state fMR imaging data.81–84
In addition, the underlying ICA algorithms that are most widely used for fMR imaging data (eg, fastICA and infomax) both make key assumptions about the underlying source distributions. For example, infomax assumes that the source distribution is unimodal and sparse. Newer algorithms with more flexible models are capable of capturing sources across a wider range of possible distributional forms, including multimodal distributions that can more effectively maximize independence.17,85,86 In addition, constrained ICA approaches are also growing in use because they provide a way to bridge between region of interest-based and atlas-based approaches, enabling investigators to specify a region to query, and are also helpful in approaching single-subject ICA. Blind ICA approaches can provide maps based only on the structure of the data.10,19,20,87,88
Another interesting direction is the development of ICA approaches that assume a linear mixing of the sources to handle the nonlinear sources that can be present in neuroimaging data and that likely represent the nature of human brain activity. The challenge here is that the parameter estimation space becomes much larger. However, there are multiple solutions proposed for solving this problem.89,90 Most recently, deep learning approaches91 have been combined with modifications to the concept of independence to offer interesting solutions.92 Following an initial approach,93 the authors can capture nonlinearities within a deep ICA model. Neuroimaging data from patients with schizophrenia and healthy controls were analyzed with 5 coupling layers each with an embedded nonlinear function composed of 2 hidden layers. Results identified significant group differences in bilateral temporal lobe activity (one of the most consistent structural abnormalities94–96 found in schizophrenia) in addition to novel components spanning cerebellum, hippocampus, and parahippocampal gyrus. Some components showed evidence of significant non-linearities (Fig. 13). Results suggest that such models can detect components that are biologically relevant that may be missed by a linear model.
Fig. 13.

Nonlinear ICA of sMRI analysis identifies significant nonlinear effects between schizophrenia and healthy controls. On the left is an example of a component captured by the nonlinear ICA approach and on the right is a plot showing the evidence of a nonlinear effect after removing the linear relationship (which only appears in certain components). (Data from Castro E, Hjelm RD, Plis SM, et al. Deep independence network analysis of structural brain imaging: application to schizophrenia. IEEE Trans Med Imaging 2016;35(7):1729–40.)
Another area of active development includes the extension of the ICA BSS approach to handle multiple subspaces (eg, each subject is modeled in a personal subspace), as in the independent vector analysis (IVA) algorithm.18,97,98 IVA has already been applied to resting-state fMR imaging in multiple studies,18,99 yielding improved representation of intersubject variability in the spatial maps.100 The extension of this to additional subspaces to better capture other types of variability is an interesting future direction.101
Hybrid ICA and deep learning approaches are also showing strong potential for improved modeling of dynamic connectivity. Recent work has shown that a restricted Boltzmann machine, a basic building block for deep learning, provides results competitive with the widely used ICA approach.102 Moving beyond this to more flexible neural network models can capture more complex relationships between spatial and temporal dynamics in fMR imaging data.79
Summary
The application of ICA to resting fMR imaging data has been popular in large part because of the ability of ICA to capture interesting and meaningful spatiotemporal patterns in fMR imaging data while making minimal assumptions about the nature of the underlying spatial and temporal organization and being robust to artifactual effects. Although at this point ICA of fMR imaging data has been in use for almost 20 years, it continues to provide a fertile, robust basis for the development of novel extensions to further automate analysis, better capture variability, and extend into new directions, including advance prediction and indirect models capable of delineating patterns of brain dynamics via deep learning combined with subspace approaches.
Key Points.
Independent component analysis (ICA) is a data-driven approach for analyzing functional magnetic resonance (fMR) imaging data.
ICA is typically used for capturing spatial and temporal signatures of brain networks within fMR imaging data as well as for separating artifactual signals from signals of interest.
Components from an ICA analysis can be used in a wide variety of subsequent analyses, including classification, dynamic connectivity, graph theory, and dynamic causal modeling.
The blind source separation/ICA research community continues to be vibrant and new algorithms for use with brain imaging continue to be developed.
Acknowledgments
The corresponding author thanks Victor Vergara and Mohammad Arbabshirani for helpful discussion.
This work was partially supported by the National Science Foundation grant 1539067, and National Institutes of Health grants R01EB006841, R01EB020407, and P20RR021938/P20GM103472 (to V.D. Calhoun) and the National Center for Advancing Translational Sciences of the National Institutes of Health under award number KL2TR000421 (to N. de Lacy). The content is solely the responsibility of the authors and does not necessarily represent the official views of the National Institutes of Health.
Footnotes
Disclosure: The authors have no commercial or financial conflicts of interest to disclose.
References
- 1.Biswal B, Yetkin FZ, Haughton VM, et al. Functional connectivity in the motor cortex of resting human brain using echo-planar MRI. Magn Reson Med. 1995;34(4):537–41. doi: 10.1002/mrm.1910340409. [DOI] [PubMed] [Google Scholar]
- 2.Zou QH, Zhu CZ, Yang Y, et al. An improved approach to detection of amplitude of low-frequency fluctuation (ALFF) for resting-state fMRI: fractional ALFF. J Neurosci Methods. 2008;172(1):137–41. doi: 10.1016/j.jneumeth.2008.04.012. [DOI] [PMC free article] [PubMed] [Google Scholar]
- 3.Insel T, Cuthbert B, Garvey M, et al. Research domain criteria (RDoC): toward a new classification framework for research on mental disorders. Am J Psychiatry. 2010;167(7):748–51. doi: 10.1176/appi.ajp.2010.09091379. [DOI] [PubMed] [Google Scholar]
- 4.Clementz BA, Sweeney JA, Hamm JP, et al. Identification of distinct psychosis biotypes using brain-based biomarkers. Am J Psychiatry. 2016;173(4):373–84. doi: 10.1176/appi.ajp.2015.14091200. [DOI] [PMC free article] [PubMed] [Google Scholar]
- 5.Marquand AF, Wolfers T, Mennes M, et al. Beyond lumping and splitting: a review of computational approaches for stratifying psychiatric disorders. Biol Psychiatry Cogn Neurosci Neuroimaging. 2016;1(5):433–47. doi: 10.1016/j.bpsc.2016.04.002. [DOI] [PMC free article] [PubMed] [Google Scholar]
- 6.Du Y, Pearlson G, Liu J, et al. A group ICA based framework for evaluating resting fMRI markers when disease categories are unclear: application to schizophrenia, bipolar, and schizoaffective disorders. Neuroimage. 2015;122:272–80. doi: 10.1016/j.neuroimage.2015.07.054. [DOI] [PMC free article] [PubMed] [Google Scholar]
- 7.Calhoun VD, Adali T, Pearlson GD, et al. A method for making group inferences from functional MRI data using independent component analysis. Hum Brain Mapp. 2001;14(3):140–51. doi: 10.1002/hbm.1048. [DOI] [PMC free article] [PubMed] [Google Scholar]
- 8.Calhoun VD, Adali T. Multisubject independent component analysis of fMRI: a decade of intrinsic networks, default mode, and neurodiagnostic discovery. IEEE Rev Biomed Eng. 2012;5:60–73. doi: 10.1109/RBME.2012.2211076. [DOI] [PMC free article] [PubMed] [Google Scholar]
- 9.Erhardt EB, Rachakonda S, Bedrick EJ, et al. Comparison of multi-subject ICA methods for analysis of fMRI data. Hum Brain Mapp. 2011;32(12):2075–95. doi: 10.1002/hbm.21170. [DOI] [PMC free article] [PubMed] [Google Scholar]
- 10.Du YH, Allen EA, He H, et al. Artifact removal in the context of group ICA: a comparison of single-subject and group approaches. Hum Brain Mapp. 2016;37(3):1005–25. doi: 10.1002/hbm.23086. [DOI] [PMC free article] [PubMed] [Google Scholar]
- 11.Salman M, Du Y, Damaraju E, et al. IEEE International Symposium on Biomedical Imaging 2017. Melbourne, Australia: 2017. Group information guided ICA shows more sensitivity to group differences than dual-regression. [Google Scholar]
- 12.Calhoun VD, Adali T. Unmixing fMRI with independent component analysis. IEEE Eng Med Biol Mag. 2006;25(2):79–90. doi: 10.1109/memb.2006.1607672. [DOI] [PubMed] [Google Scholar]
- 13.McKeown MJ, Hansen LK, Sejnowski TJ. Independent component analysis of functional MRI: what is signal and what is noise? Curr Opin Neurobiol. 2003;13(5):620–9. doi: 10.1016/j.conb.2003.09.012. [DOI] [PMC free article] [PubMed] [Google Scholar]
- 14.Beckmann CF. Modelling with independent components. Neuroimage. 2012;62(2):891–901. doi: 10.1016/j.neuroimage.2012.02.020. [DOI] [PubMed] [Google Scholar]
- 15.Bell AJ, Sejnowski TJ. An information maximisation approach to blind separation and blind deconvolution. Neural Comput. 1995;7(6):1129–59. doi: 10.1162/neco.1995.7.6.1129. [DOI] [PubMed] [Google Scholar]
- 16.Hyvarinen A, Oja E. A fast fixed-point algorithm for independent component analysis. Neural Comput. 1997;9(7):1483–92. [Google Scholar]
- 17.Li X, Adali T. Independent component analysis by entropy bound minimization. IEEE Trans Signal Process. 2010;58(10):5151–64. [Google Scholar]
- 18.Lee JH, Lee TW, Jolesz FA, et al. Independent vector analysis (IVA): multivariate approach for fMRI group study. Neuroimage. 2008;40(1):86–109. doi: 10.1016/j.neuroimage.2007.11.019. [DOI] [PubMed] [Google Scholar]
- 19.Lin Q, Liu J, Zheng Y, et al. Semi-blind spatial ICA of fMRI using spatial constraints. Hum Brain Mapp. 2010;31(7):1076–88. doi: 10.1002/hbm.20919. [DOI] [PMC free article] [PubMed] [Google Scholar]
- 20.Du Y, Fan Y. Group information guided ICA for fMRI data analysis. Neuroimage. 2013;69:157–97. doi: 10.1016/j.neuroimage.2012.11.008. [DOI] [PubMed] [Google Scholar]
- 21.Salimi-Khorshidi G, Douaud G, Beckmann CF, et al. Automatic denoising of functional MRI data: combining independent component analysis and hierarchical fusion of classifiers. Neuroimage. 2014;90:449–68. doi: 10.1016/j.neuroimage.2013.11.046. [DOI] [PMC free article] [PubMed] [Google Scholar]
- 22.Sochat V, Supekar K, Bustillo J, et al. A robust classifier to distinguish noise from fMRI independent components. PLoS One. 2014;9(4):e95493. doi: 10.1371/journal.pone.0095493. [DOI] [PMC free article] [PubMed] [Google Scholar]
- 23.Pruim RH, Mennes M, van Rooij D, et al. ICA-AROMA: a robust ICA-based strategy for removing motion artifacts from fMRI data. Neuroimage. 2015;112:267–77. doi: 10.1016/j.neuroimage.2015.02.064. [DOI] [PubMed] [Google Scholar]
- 24.Xu JS, Calhoun VD, Worhunsky PD, et al. Functional network overlap as revealed by fMRI using sICA and its potential relationships with functional heterogeneity, balanced excitation and inhibition, and sparseness of neuron activity. PLoS One. 2015;10(2):e0117029. doi: 10.1371/journal.pone.0117029. [DOI] [PMC free article] [PubMed] [Google Scholar]
- 25.Xu J, Potenza MN, Calhoun VD, et al. Large-scale functional network overlap is a general property of brain functional organization: reconciling inconsistent fMRI findings from general-linear-model-based analyses. Neurosci Biobehav Rev. 2016;71:83–100. doi: 10.1016/j.neubiorev.2016.08.035. [DOI] [PMC free article] [PubMed] [Google Scholar]
- 26.Boles DB. The “lumping” and “splitting” of function and brain. Brain Cogn. 2000;42(1):23–5. doi: 10.1006/brcg.1999.1151. [DOI] [PubMed] [Google Scholar]
- 27.McKeown MJ, Jung TP, Makeig S, et al. Spatially independent activity patterns in functional MRI data during the Stroop color-naming task. Proc Natl Acad Sci U S A. 1998;95(3):803–10. doi: 10.1073/pnas.95.3.803. [DOI] [PMC free article] [PubMed] [Google Scholar]
- 28.Calhoun VD, Pekar JJ, McGinty VB, et al. Different activation dynamics in multiple neural systems during simulated driving. Hum Brain Mapp. 2002;16(3):158–67. doi: 10.1002/hbm.10032. [DOI] [PMC free article] [PubMed] [Google Scholar]
- 29.Jafri M, Pearlson GD, Stevens M, et al. A method for functional network connectivity among spatially independent resting-state components in schizophrenia. Neuroimage. 2008;39:1666–81. doi: 10.1016/j.neuroimage.2007.11.001. [DOI] [PMC free article] [PubMed] [Google Scholar]
- 30.Rashid B, Arbabshirani MR, Damaraju E, et al. Classification of schizophrenia and bipolar patients using static and dynamic resting-state fMRI brain connectivity. Neuroimage. 2016;134:645–57. doi: 10.1016/j.neuroimage.2016.04.051. [DOI] [PMC free article] [PubMed] [Google Scholar]
- 31.Arbabshirani M, Kiehl KA, Pearlson G, et al. Classification of schizophrenia patients based on resting-state functional network connectivity. Front Neurosci. 2013;7(133):1–16. doi: 10.3389/fnins.2013.00133. [DOI] [PMC free article] [PubMed] [Google Scholar]
- 32.Arbabshirani MR, Plis S, Sui J, et al. Single subject prediction of brain disorders in neuroimaging: promises and pitfalls. Neuroimage. 2017;145(Pt B):137–65. doi: 10.1016/j.neuroimage.2016.02.079. [DOI] [PMC free article] [PubMed] [Google Scholar]
- 33.Ma S, Correa N, Li X, et al. Automatic identification of functional clusters in fMRI data using spatial information. IEEE Trans Biomed Eng. 2011;58(12):3406–17. doi: 10.1109/TBME.2011.2167149. [DOI] [PMC free article] [PubMed] [Google Scholar]
- 34.Ongur D, Lundy M, Greenhouse I, et al. Default mode network abnormalities in bipolar disorder and schizophrenia. Psychiatry Res. 2010;183(1):59–68. doi: 10.1016/j.pscychresns.2010.04.008. [DOI] [PMC free article] [PubMed] [Google Scholar]
- 35.Lu W, Rajapakse JC. Approach and applications of constrained ICA. IEEE Trans Neural Netw. 2005;16(1):203–12. doi: 10.1109/TNN.2004.836795. [DOI] [PubMed] [Google Scholar]
- 36.Joel SE, Caffo BS, van Zijl PC, et al. On the relationship between seed-based and ICA-based measures of functional connectivity. Magn Reson Med. 2011;66(3):644–57. doi: 10.1002/mrm.22818. [DOI] [PMC free article] [PubMed] [Google Scholar]
- 37.Abou-Elseoud A, Starck T, Remes J, et al. The effect of model order selection in group PICA. Hum Brain Mapp. 2010;31(8):1207–16. doi: 10.1002/hbm.20929. [DOI] [PMC free article] [PubMed] [Google Scholar]
- 38.Li YO, Adali T, Calhoun VD. Estimating the number of independent components for functional magnetic resonance imaging data. Hum Brain Mapp. 2007;28(11):1251–66. doi: 10.1002/hbm.20359. [DOI] [PMC free article] [PubMed] [Google Scholar]
- 39.Hui M, Li J, Wen X, et al. An empirical comparison of information-theoretic criteria in estimating the number of independent components of fMRI data. PLoS One. 2011;6(12):e29274. doi: 10.1371/journal.pone.0029274. [DOI] [PMC free article] [PubMed] [Google Scholar]
- 40.Douglas PK, Harris S, Yuille A, et al. Performance comparison of machine learning algorithms and number of independent components used in fMRI decoding of belief vs. disbelief. Neuroimage. 2011;56(2):544–53. doi: 10.1016/j.neuroimage.2010.11.002. [DOI] [PMC free article] [PubMed] [Google Scholar]
- 41.Smith SM, Fox PT, Miller KL, et al. Correspondence of the brain's functional architecture during activation and rest. Proc Natl Acad Sci USA. 2009;106(31):13040–5. doi: 10.1073/pnas.0905267106. [DOI] [PMC free article] [PubMed] [Google Scholar]
- 42.Eklund A, Nichols TE, Knutsson H. Cluster failure: why fMRI inferences for spatial extent have inflated false-positive rates. Proc Natl Acad Sci U S A. 2016;113(28):7900–5. doi: 10.1073/pnas.1602413113. [DOI] [PMC free article] [PubMed] [Google Scholar]
- 43.Konishi S, Donaldson DI, Buckner RL. Transient activation during block transition. Neuroimage. 2001;13(2):364–74. doi: 10.1006/nimg.2000.0691. [DOI] [PubMed] [Google Scholar]
- 44.Calhoun VD, Adali T, Pekar JJ. A method for comparing group fMRI data using independent component analysis: application to visual, motor and visuomotor tasks. Magn Reson Imaging. 2004;22(9):1181–91. doi: 10.1016/j.mri.2004.09.004. [DOI] [PubMed] [Google Scholar]
- 45.Calhoun VD, Allen E. Extracting intrinsic functional networks with feature-based group independent component analysis. Psychometrika. 2013;78(2):243–59. doi: 10.1007/s11336-012-9291-3. [DOI] [PubMed] [Google Scholar]
- 46.Bright MG, Murphy K. Is fMRI “noise” really noise? Resting state nuisance regressors remove variance with network structure. Neuroimage. 2015;114:158–69. doi: 10.1016/j.neuroimage.2015.03.070. [DOI] [PMC free article] [PubMed] [Google Scholar]
- 47.McKeown MJ. Detection of consistently task-related activations in fMRI data with hybrid independent component analysis. Neuroimage. 2000;11(1):24–35. doi: 10.1006/nimg.1999.0518. [DOI] [PubMed] [Google Scholar]
- 48.Calhoun VD, Adali T, Pearlson GD, et al. Spatial and temporal independent component analysis of functional MRI data containing a pair of task-related waveforms. Hum Brain Mapp. 2001;13(1):43–53. doi: 10.1002/hbm.1024. [DOI] [PMC free article] [PubMed] [Google Scholar]
- 49.van den Bosch GE, El Marroun H, Schmidt MN, et al. Brain connectivity during verbal working memory in children and adolescents. Hum Brain Mapp. 2014;35(2):698–711. doi: 10.1002/hbm.22193. [DOI] [PMC free article] [PubMed] [Google Scholar]
- 50.Xu J, Calhoun VD, Potenza MN. Spatial ICA reveals functional activity hidden from traditional fMRI GLM-based analyses. Front Neurosci. 2013;7:154. doi: 10.3389/fnins.2013.00154. [DOI] [PMC free article] [PubMed] [Google Scholar]
- 51.Calhoun VD, Adali T, McGinty V, et al. fMRI activation in a visual-perception task: network of areas detected using the general linear model and independent component analysis. Neuroimage. 2001;14(5):1080–8. doi: 10.1006/nimg.2001.0921. [DOI] [PubMed] [Google Scholar]
- 52.Laney J, Westlake KP, Ma S, et al. Capturing subject variability in fMRI data: a graph-theoretical analysis of GICA vs. IVA. J Neurosci Methods. 2015;247:32–40. doi: 10.1016/j.jneumeth.2015.03.019. [DOI] [PMC free article] [PubMed] [Google Scholar]
- 53.Anderson A, Cohen MS. Decreased small-world functional network connectivity and clustering across resting state networks in schizophrenia: an fMRI classification tutorial. Front Hum Neurosci. 2013;7:520. doi: 10.3389/fnhum.2013.00520. [DOI] [PMC free article] [PubMed] [Google Scholar]
- 54.Yu Q, Sui J, Rachakonda S, et al. Altered topological properties of functional network connectivity in schizophrenia during resting state: a small-world brain network study. PLoS One. 2011;6(9):1–12. doi: 10.1371/journal.pone.0025423. [DOI] [PMC free article] [PubMed] [Google Scholar]
- 55.Yu Q, Allen EA, Sui J, et al. Brain connectivity networks in schizophrenia underlying resting state functional magnetic resonance imaging. Curr Top Med Chem. 2012;12(21):2415–25. doi: 10.2174/156802612805289890. Special issue on “Neurochemistry of schizophrenia and psychosis: the contribution of neuroimaging”. [DOI] [PMC free article] [PubMed] [Google Scholar]
- 56.Stevens M, Kiehl KA, Pearlson GD, et al. Functional neural circuits for mental timekeeping. Hum Brain Mapp. 2007;28(5):394–408. doi: 10.1002/hbm.20285. [DOI] [PMC free article] [PubMed] [Google Scholar]
- 57.Stevens M, Calhoun VD, Pearlson GD, et al. Brain network dynamics during error commission. Hum Brain Mapp. 2009;30(1):24–37. doi: 10.1002/hbm.20478. [DOI] [PMC free article] [PubMed] [Google Scholar]
- 58.Havlicek M, Friston K, Jan J, et al. Dynamic modeling of neuronal responses in fMRI using cubature Kalman filtering. Neuroimage. 2011;56(4):2109–28. doi: 10.1016/j.neuroimage.2011.03.005. [DOI] [PMC free article] [PubMed] [Google Scholar]
- 59.Calhoun VD, Pearlson GD, Maciejewski P, et al. Temporal lobe and ‘default’ hemodynamic brain modes discriminate between schizophrenia and bipolar disorder. Hum Brain Mapp. 2008;29(11):1265–75. doi: 10.1002/hbm.20463. [DOI] [PMC free article] [PubMed] [Google Scholar]
- 60.De Martino F, Gentile F, Esposito F, et al. Classification of fMRI independent components using IC-fingerprints and support vector machine classifiers. Neuroimage. 2007;34(1):177–94. doi: 10.1016/j.neuroimage.2006.08.041. [DOI] [PubMed] [Google Scholar]
- 61.Allen EA, Erhardt EB, Damaraju E, et al. A baseline for the multivariate comparison of resting-state networks. Front Syst Neurosci. 2011;5(2):2. doi: 10.3389/fnsys.2011.00002. [DOI] [PMC free article] [PubMed] [Google Scholar]
- 62.Damaraju E, Allen EA, Belger A, et al. Dynamic functional connectivity analysis reveals transient states of dysconnectivity in schizophrenia. Neuroimage Clin. 2014;5:298–308. doi: 10.1016/j.nicl.2014.07.003. [DOI] [PMC free article] [PubMed] [Google Scholar]
- 63.Calhoun VD. Group ICA of fMRI toolbox (GIFT) 2004 [Google Scholar]
- 64.Nomi JS, Farrant K, Damaraju E, et al. Dynamic functional network connectivity reveals unique and overlapping profiles of insula subdivisions. Hum Brain Mapp. 2016;37(5):1770–87. doi: 10.1002/hbm.23135. [DOI] [PMC free article] [PubMed] [Google Scholar]
- 65.Vergara V, Miller R, Van Erp T, et al. Human Brain Mapp 2016. Geneva, Switzerland: The functional dynamics of brain domains in schizophrenia. [Google Scholar]
- 66.Miller RL, Vergara VM, Keator DB, et al. A method for inter-temporal functional domain connectivity analysis: application to schizophrenia reveals distorted directional information flow. IEEE Trans Biomed Eng. 2016;63(12):2525–39. doi: 10.1109/TBME.2016.2600637. [DOI] [PMC free article] [PubMed] [Google Scholar]
- 67.Yarkoni T, Poldrack RA, Nichols TE, et al. Large-scale automated synthesis of human functional neuroimaging data. Nat Methods. 2011;8(8):665–70. doi: 10.1038/nmeth.1635. [DOI] [PMC free article] [PubMed] [Google Scholar]
- 68.Calhoun VD, Miller R, Pearlson G, et al. The chronnectome: time-varying connectivity networks as the next frontier in fMRI data discovery. Neuron. 2014;84(2):262–74. doi: 10.1016/j.neuron.2014.10.015. [DOI] [PMC free article] [PubMed] [Google Scholar]
- 69.Hutchison RM, Womelsdorf T, Allen EA, et al. Dynamic functional connectivity: promises, issues, and interpretations. Neuroimage. 2013;80:360–78. doi: 10.1016/j.neuroimage.2013.05.079. [DOI] [PMC free article] [PubMed] [Google Scholar]
- 70.Keilholz SD. The neural basis of time-varying resting state functional connectivity [review] Brain Connect. 2014;4(10):769–79. doi: 10.1089/brain.2014.0250. [DOI] [PMC free article] [PubMed] [Google Scholar]
- 71.Preti MG, Bolton TA, Van De Ville D. The dynamic functional connectome: state-of-the-art and perspectives. Neuroimage. 2016 doi: 10.1016/j.neuroimage.2016.12.061. [Epub ahead of print] [DOI] [PubMed] [Google Scholar]
- 72.Allen E, Damaraju E, Plis SM, et al. Tracking whole-brain connectivity dynamics in the resting state. Cereb Cortex. 2014;24(3):663–76. doi: 10.1093/cercor/bhs352. [DOI] [PMC free article] [PubMed] [Google Scholar]
- 73.Yaesoubi M, Allen EA, Miller RL, et al. Dynamic coherence analysis of resting fMRI data to jointly capture state-based phase, frequency, and time-domain information. Neuroimage. 2015;120:133–42. doi: 10.1016/j.neuroimage.2015.07.002. [DOI] [PMC free article] [PubMed] [Google Scholar]
- 74.Yaesoubi M, Calhoun V. Keystone Symposia - Connectomics. Santa Fe, NM: 2017. Window-less estimation of dynamic functional connectivity. [Google Scholar]
- 75.Allen E, Eichele T, Wu L, et al. Proc HBM. Seattle, WA: 2013. EEG signature of functional connectivity states. [Google Scholar]
- 76.Damaraju E, Allen E, Wu L, et al. EEG signatures of dynamic functional network connectivity states. Brain Topogr. 2017 doi: 10.1007/s10548-017-0546-2. [Epub ahead of print] [DOI] [PMC free article] [PubMed] [Google Scholar]
- 77.Kiviniemi V, Vire T, Remes J, et al. A sliding time-window ICA reveals spatial variability of the default mode network in time. Brain Connect. 2011;1(4):339–47. doi: 10.1089/brain.2011.0036. [DOI] [PubMed] [Google Scholar]
- 78.Ma S, Calhoun VD, Phlypo R, et al. Dynamic changes of spatial functional network connectivity in healthy individuals and schizophrenia patients using independent vector analysis. Neuroimage. 2014;90:196–206. doi: 10.1016/j.neuroimage.2013.12.063. [DOI] [PMC free article] [PubMed] [Google Scholar]
- 79.Hjelm D, Plis S, Calhoun VD. NIPS. Barcelona, Spain: 2017. Recurrent neural networks for spatiotemporal dynamics of intrinsic networks from fMRI data. [Google Scholar]
- 80.Calhoun VD, Potluru V, Phlypo R, et al. Independent component analysis for brain fMRI does indeed select for maximal independence. PLoS One. 2013;8(8):e73309. doi: 10.1371/journal.pone.0073309. [DOI] [PMC free article] [PubMed] [Google Scholar]
- 81.Adali T, Anderson M, Fu G. Diversity in independent component and vector analyses: identifiability, algorithms, and applications in medical imaging. IEEE Signal Process Mag. 2014;31:18–33. [Google Scholar]
- 82.Adali T, Anderson M, Fu G. IVA and ICA: use of diversity in independent decompositions. Proceedings of the European Signal Processing Conferences (EUSIPCO) 2012:61–5. [Google Scholar]
- 83.Du W, Fu G, Calhoun VD, et al. ICIP 2014. Paris, France: 2014. Performance of complex-valued ICA algorithms for fMRI analysis: importance of taking full diversity into account. [Google Scholar]
- 84.Du W, Levin-Schwartz Y, Fu GS, et al. The role of diversity in complex ICA algorithms for fMRI analysis. J Neurosci Methods. 2016;264:129–35. doi: 10.1016/j.jneumeth.2016.03.012. [DOI] [PMC free article] [PubMed] [Google Scholar]
- 85.Fu GS, Phlypo R, Anderson M, et al. Blind source separation by entropy rate minimization. IEEE Trans Signal Processing. in press. [Google Scholar]
- 86.Li XL, Adali T. Complex independent component analysis by entropy bound minimization. IEEE Trans Circuits Syst. 2010;57(7):1417–30. [Google Scholar]
- 87.Lu W, Rajapakse JC. Eliminating indeterminacy in ICA. Neurocomputing. 2003;50:271–90. [Google Scholar]
- 88.Calhoun VD, Adali T, Stevens M, et al. Semi-blind ICA of fMRI: a method for utilizing hypothesis-derived time courses in a spatial ICA analysis. Neuroimage. 2005;25(2):527–38. doi: 10.1016/j.neuroimage.2004.12.012. [DOI] [PubMed] [Google Scholar]
- 89.Wu L, Calhoun V. Nonlinear ICA: applications to spatial and temporal EEG source separation. Human Brain Mapping Conference. 2011 [Google Scholar]
- 90.Hyvarinen A, Pajunen P. Nonlinear independent component analysis: existence and uniqueness results. Neural Netw. 1999;12(3):429–39. doi: 10.1016/s0893-6080(98)00140-3. [DOI] [PubMed] [Google Scholar]
- 91.Plis SM, Hjelm DR, Salakhutdinov R, et al. Deep learning for neuroimaging: a validation study. Front Neurosci. 2014;8:229. doi: 10.3389/fnins.2014.00229. [DOI] [PMC free article] [PubMed] [Google Scholar]
- 92.Castro E, Hjelm RD, Plis SM, et al. Deep independence network analysis of structural brain imaging: application to schizophrenia. IEEE Trans Med Imaging. 2016;35(7):1729–40. doi: 10.1109/TMI.2016.2527717. [DOI] [PMC free article] [PubMed] [Google Scholar]
- 93.Dinh L, Krueger D, Bengio Y. NICE: non-linear independent components estimation. arXiv preprint ar-Xiv: 14108516. 2014;2014 [Google Scholar]
- 94.Xu L, Groth K, Pearlson G, et al. Source based morphometry: the use of independent component analysis to identify gray matter differences with application to schizophrenia. Hum Brain Mapp. 2009;30:711–24. doi: 10.1002/hbm.20540. [DOI] [PMC free article] [PubMed] [Google Scholar]
- 95.Turner J, Calhoun VD, Michael A, et al. Heritability of multivariate gray matter measures in schizophrenia. Twin Res Hum Genet. 2012;15(3):324–35. doi: 10.1017/thg.2012.1. [DOI] [PMC free article] [PubMed] [Google Scholar]
- 96.Gupta CN, Calhoun VD, Rachakonda S, et al. Patterns of gray matter abnormalities in schizophrenia based on an international mega-analysis. Schizophr Bull. 2015;41(5):1133–42. doi: 10.1093/schbul/sbu177. [DOI] [PMC free article] [PubMed] [Google Scholar]
- 97.Via J, Anderson M, Li XL, et al. Proc IEEE Workshop on Machine Learning for Signal Processing (MLSP) Beijing, China: 2011. A maximum likelihood approach for independent vector analysis of Gaussian data sets. [Google Scholar]
- 98.Anderson M, Fu G, Phlypo R, et al. Independent vector analysis: identification conditions and performance bounds. IEEE Trans Signal Process. 2014;62(17):4399–410. [Google Scholar]
- 99.Michael AM, Anderson M, Miller RL, et al. Preserving subject variability in group fMRI analysis: performance evaluation of GICA vs. IVA. Front Syst Neurosci. 2014;8:106. doi: 10.3389/fnsys.2014.00106. [DOI] [PMC free article] [PubMed] [Google Scholar]
- 100.Gopal S, Miller RL, Michael A, et al. Spatial variance in resting fMRI networks of schizophrenia patients: an independent vector analysis. Schizophr Bull. 2016;42(1):152–60. doi: 10.1093/schbul/sbv085. [DOI] [PMC free article] [PubMed] [Google Scholar]
- 101.Silva RF, Plis SM, Sui J, et al. Blind source separation for unimodal and multimodal brain networks: a unifying framework for subspace modeling. IEEE J Sel Top Signal Process. 2016;10(7):1134–49. doi: 10.1109/JSTSP.2016.2594945. [DOI] [PMC free article] [PubMed] [Google Scholar]
- 102.Hjelm RD, Calhoun VD, Salakhutdinov R, et al. Restricted Boltzmann machines for neuroimaging: an application in identifying intrinsic networks. Neuroimage. 2014;96:245–60. doi: 10.1016/j.neuroimage.2014.03.048. [DOI] [PMC free article] [PubMed] [Google Scholar]


