

Summary
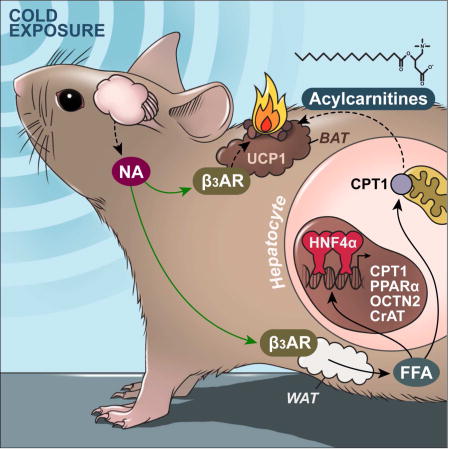
Cold induced thermogenesis is an energy demanding process that protects endotherms against a reduction in ambient temperature. Using non-targeted LC-MS based lipidomics, we identified elevated levels of plasma acylcarnitines in response to the cold. We found that the liver undergoes a metabolic switch to provide fuel for brown fat thermogenesis by producing acylcarnitines. Cold stimulates white adipocytes to release free fatty acids that activate the nuclear receptor HNF4α, which is required for acylcarnitine production in the liver and adaptive thermogenesis. Once in circulation, acylcarnitines are transported to brown adipose tissue, while uptake into white adipose tissue and liver is blocked. Finally, a bolus of L-carnitine or palmitoylcarnitine rescues the cold sensitivity seen with aging. Our data highlights an elegant mechanism whereby white adipose tissue provides long chain fatty acids for hepatic carnitilation to generate plasma acylcarnitines as a fuel source for peripheral tissues in mice.
Keywords: Acylcarnitines, brown fat, adipocytes, thermogenesis, UCP1, metabolism, liver, HNF4alpha, CPT1, aging
ETOC
Simcox et al. identify acylcarnitines as a novel source of energy for brown fat thermogenesis in mice and show that in response to cold, the liver activates a transcriptional program through HNF4α to increase acylcarnitine production. Blocking hepatic acylcarnitine synthesis impairs adaptive thermogenesis.
Introduction
Cellular metabolic networks evolved through the selective pressures of starvation and cold exposure, two energetically demanding conditions that require dynamic communication between tissues to maintain survival. During starvation, catecholamines signal to β-adrenergic receptors in the white adipose tissue (WAT) to mobilize lipid stores as free fatty acids (FFAs). Preferential use of circulating fatty acids by the liver and muscle during fasting preserves glucose stores for the brain. Throughout this metabolic switch, the liver uniquely provides ketones that can be metabolized by neurons in the Central Nervous System to generate ATP. This switch in primary fuel sources between tissues is regulated by metabolic substrate competition and inhibitory signaling in the Randle cycle (Hue and Taegtmeyer, 2009). In contrast to fasting, cold exposure stimulates energy expenditure, a consequence of fueling thermogenesis. During cold exposure there is activation of the β3 adrenergic receptor (β3AR), leading to increased triglyceride lipolysis in white adipocytes, and activation of thermogenesis in brown adipocytes (Lafontan and Berlan, 1993). However, little is known about the metabolic adaptations that occur in other cell types during acute cold challenge.
The brown adipose tissue (BAT) plays a major role in protecting against the cold through non-shivering thermogenesis. Brown adipocytes generate heat by disrupting ATP synthesis in the mitochondria through the uncoupling protein 1 (UCP1), that allows protons to flow across the inner mitochondrial membrane to release potential energy as heat. Mice lacking UCP1 develop hypothermia with acute cold challenge, however these mice are able to adapt to the cold with incremental reduction in ambient temperature, suggesting that alternative mechanisms of thermogenesis are at play (Golozoubova et al., 2001). To replenish the proton gradient, brown adipocytes increase utilization of both glucose and fatty acids, generating additional heat as a byproduct of cellular metabolism (Seale et al., 2009). During cold exposure, the BAT initially relies on glucose, and when activated increases glucose uptake (Orava et al., 2011; Yu et al., 2002). In addition to carbohydrates, brown adipocytes utilize fatty acids from triglyceride rich lipoproteins and FFAs released by white adipocytes (Bartelt et al., 2011; Chondronikola et al., 2014). Mice lacking adipose triglyceride lipase (ATGL) in adipocytes are unable to maintain their body temperature during a cold challenge, highlighting the importance of energy mobilization for thermogenesis (Haemmerle et al., 2006). However, more research is needed to identify additional fuel sources, beyond glucose and FFAs, that drive thermogenesis.
Mitochondrial fatty acid oxidation in the liver is a tightly regulated process that is activated upon fasting. After entry into cells, long-chain fatty acids are activated by acyl-CoA synthetase, and conjugated with carnitine by CPT1, the rate limiting enzyme in long-chain fatty acid oxidation (Esser et al., 1993; Fingerhut et al., 2001; Longo et al., 2006; Schooneman et al., 2013). Carnitine is transported into cells through a cell surface transporter, Octn2 (Tamai et al., 1998). Conjugation with carnitine allows the transport of fatty acids across the inner mitochondrial membrane through the carnitine-acylcarnitine translocase (CACT) (Ramsay et al., 2001). Once in the matrix, carnitine is removed, and fatty acids are destined for oxidation after activation by CPT2 to generate fatty acyl-CoAs (Gempel et al., 2002). CPT1 mRNA is regulated by the transcription factor HNF4α, a nuclear receptor that plays a key role in liver development and mitochondrial energetics (Martinez-Jimenez et al., 2010). Mutations in HNF4α lead to maturity-onset diabetes of the young type 1 (MODY 1), a disorder characterized by defective glucose-stimulated insulin secretion (Yamagata et al., 1996). During exercise and fasting acylcarnitines are elevated in the plasma, and are thought to reflect incomplete fatty acid oxidation (Schooneman et al., 2013). Acylcarnitines are also elevated in several inborn errors of metabolism, including disorders of fatty acid oxidation where mutations in MCAD, VLCAD, and LCHAD can lead to death (Shekhawat et al., 2005). Although circulating acylcarnitine levels are elevated in various conditions of metabolic stress, very little is known about their role in systemic energy metabolism, and their regulation.
In this study, we performed non-targeted lipidomics of plasma, and found that long-chain acylcarnitines (LCACs) were induced in response to cold exposure or treatment with β3AR agonist CL-316,243. We hypothesized that acylcarnitines served a greater role than being a byproduct of fatty acid oxidation, but rather a mechanism to provide fuel for thermogenesis. Knockdown studies targeting hepatic Cpt1a/b show a requirement for hepatic acylcarnitine synthesis for adaptive thermogenesis. These studies also led to a previously unappreciated role for hepatic HNF4α in regulating cold-induced changes in expression of enzymes involved in hepatic acylcarnitine metabolism. We demonstrate that this transcriptional program requires ATGL-mediated adipose tissue lipolysis of FFAs to activate HNF4α and serve as a substrate for acylcarnitine synthesis. With aging, mice show reduced plasma acylcarnitine levels in response to the cold, and display a cold sensitive phenotype. This can be reversed with carnitine or palmitoylcarnitine supplementation. Our findings suggest a novel role for the liver in thermogenesis, as well as uncovering a well-orchestrated inter-tissue communication system to upregulate energy mobilization for heat production.
Results
Global lipid analysis of plasma from mice exposed to cold and identification of acylcarnitines as a cold induced circulating lipid
To understand the metabolic changes that occur during acute cold exposure, mice were placed in room temperature (24°C) or cold (4°C) for 5 hours, and plasma was analyzed using LC-MS based lipidomic analysis; lipids are displayed as a heatmap after cluster analysis using MetaboAnalyst 3.0 (Figure 1A). A total of 287 circulating lipids significantly changed (p≤0.05) in response to cold exposure, and 93 lipids were elevated, while 194 lipids were reduced. Further analysis and identification of the lipids or derivatives that were significantly (p<0.01) upregulated by two-fold showed a high representation of LCAC species (Figure 1B). We confirmed that these lipids were LCACs using tandem mass spectroscopy (LC-MS/MS). To determine if the elevated LCACs reflected a change in thermogenic potential, we utilized aged mice as a physiologically relevant model of impaired thermogenesis. As mice and humans age, there is a loss of BAT function and increased sensitivity to hypothermia (Sellayah and Sikder, 2014; Yoneshiro et al., 2011). Therefore, we compared plasma lipidomic profiles between 3 month and 24 month-old mice, and found a temperature dependent divergence in the plasma lipid signature (Figure 1C), where older mice have a blunted response in the cold. To test whether LCAC species were reduced in older mice, we measured 14:0-Carnitine, 16:1-Carnitine, 18:0-Carnitine, and 18:2-Carnitine levels in the plasma, and found that 14:0-Carnitine was elevated twelve-fold in response to the cold, compared to a modest increase of two-fold in 24month old mice (Figure 1D). In our initial analysis, we only identified LCACs, and we were curious whether other acylcarnitine species were altered. Using ultra performance LC-MS/MS (UPLC-MS/MS) we quantified many of the previously identified acylcarnitine species and found that the sum of short-chain acylcarnitines (SCAC) (C2-C5), medium-chain acylcarnitines (MCAC) (C6-C12), and LCAC (C14-C18) (Figure 1E, FigureS1) were elevated in response to cold exposure, with the greatest increase in 3 month-old mice. Notably, older mice had higher basal levels of LCAC, MCAC, and SCAC at room temperature, but a clear blunted response in the cold (Figure 1E). In contrast, plasma carnitine levels were reduced in response to the cold in both 3 month and 24 month-old mice (Figure 1E). These results are consistent with impaired thermogenesis seen in 24 month-old mice (Figure S1E, S1F), and suggest a loss of metabolic flexibility that impairs the response to energetically stressful stimulus.
Figure 1. Acylcarnitine levels in the blood are elevated in response to cold exposure.

A) Heat Map and cluster analysis of 281 lipids from plasma of 3 month-old C57BL6J male mice at room temperature (24°C) or Cold (4°C). Samples were run on an Agilent 6490 LC-MS and analyzed using Metaboanalyst 3.0 (N = 5/group).
B) Volcano plot of LC-MS based lipidomics from the plasma of 3 month-old C57BL6J male mice at Room Temp or Cold. Lipids that are increased 2-fold in Cold/RT and have a p-value below 0.01 are labeled in red. Long chain acylcarnitine species were identified through LC-MS/MS (N = 5/group).
C) SAM analysis of LC-MS lipidomics of plasma from room temperature vs cold exposed in C57BL6J male mice 3 month or 24 month-old (N=4–5/group).
D) Plasma acylcarnitine levels of 3 month and 24 month-old C57BL6J male mice at room temperature Room Temp or Cold (N=4–5/group). ◆ Data are presented as mean ± SEM. *p ≤ 0.05, ***p ≤ 0.001, room temp. vs cold. p ≤ 0.05 3 months vs 24 months Room Temp.
E) Plasma levels of ◆ long chain acylcarnitine (LCAC), medium chain acylcarnitines (MCAC), short chain acylcarnitines (SCAC), and carnitine in the plasma of 3 month and 24 month-old C57BL6J male mice as measured by LC-MS (N=4–5/group). Data are presented as mean ± SEM. *p ≤ 0.05, **p ≤ 0.01, ***p ≤ 0.001, room temp. vs cold. p ≤ 0.05 3 months vs 24 months Room Temp. See also Figure S1.
Cold exposure stimulates expression of enzymes involved in acylcarnitine metabolism in the liver
Circulating acylcarnitine levels change during acute energetic stress including exercise and fasting (Costa et al., 1999; Hiatt et al., 1989; Yamaguti et al., 1996). These acute changes are regulated in part by transcriptional changes in components of the carnitine shuttle (Song et al., 2010; Vila-Brau et al., 2013). To test which tissues were contributing to the increase in acylcarnitine levels, we measured the expression of genes involved in acylcarnitine metabolism in the liver, skeletal muscle, and BAT. In the liver, we found the expression of Cpt1b, Octn2, Cact, Cpt2, and CrAT were increased in response to cold exposure, while the expression of Bbox1, an enzyme involved in carnitine synthesis, was not altered (Figure 2A). Western blot analysis showed increased levels of Cpt1b, however Cpt1a was unchanged when comparing livers from mice at 24°C and 4 °C for 5 hrs ( Figure 2B). A longer cold exposure of 8 hrs led to detectable increases in Cpt1a, Cpt1b, and Octn2 (Figure 2B). Western blot analysis of livers from mice at 30°C and 4°C, showed increases in Cpt1b and Octn2. In contrast, there were no detectable changes in gene expression of Cpt1b, Octn2, CrAT, and CACT in the skeletal muscle or BAT, except for increased expression of Octn2 (Figure S2A). To test whether the increase in circulating acylcarnitines was due to brown adipose tissue, we measured acylcarnitines in UCP1-DTA mice that lack BAT (Lowell et al., 1993). In response to the cold, UCP1-DTA mice have a similar induction in acylcarnitines when compared to littermate controls (Figure S2B). Both 14:0-Carnitine and 18:1-Carnitine in the blood were elevated approximately 2-fold in response to a 4hr cold exposure. Although the basal levels trend to be lower, the similar fold induction in control and mice lacking BAT, suggests that the source of acylcarnitines is not brown adipocytes.
Figure 2. Cold stimulates expression of genes required for acylcarnitine metabolism and knockdown of hepatic Cpt1 leads to cold sensitivity.

A) Gene expression measured by real-time PCR in livers of 3 month-old C57BL6J male mice at room temperature (24°C) or Cold (4°C) for 5hrs. N = 5/group.
B) Western blot analysis of livers detecting Cpt1b, Cpt1a, Octn2, and β-actin. 3 month-old C57BL6J mice were exposed to Room Temp or Cold for 5 hours or 8 hours, as well as thermoneutrality (30°C) or Cold (4°C) for 5hrs. N = 4/group.
C) Serum long-chain acylcarnitine levels for 3 month-old C57BL6J mice at 4°C treated with liver targeting liposomes containing siRNA to a scrambled control (Control), Cpt1a (siCpt1a), Cpt1b (siCpt1b), or a mixture of Cpt1a and Cpt1b (siCpt1a/siCpt1b). N = 5/group.
D) Western blots of Liver and BAT of 3 month-old C57BL6J mice at 4°C treated with Control siRNA, siCpt1a, siCpt1b, or siCpt1a/siCpt1b. Tissues were excised after 5 hours of cold exposure. N = 3/group.
E) Cold tolerance test at 4°C of 3 month-old C57BL6J mice treated with control (siScramble), siCpt1a, siCpt1b, or siCpt1a/siCpt1b. N = 4–5/group.
F) Cold tolerance test at 4°C of 3 month-old C57BL6J mice treated with control (siScramble) or siCpt1a/Cpt1b. Mice were given a single intravenous dose of PBS or palmitoylcarnitine. N = 5–6/group.
All transcripts were normalized to RPL13. Data are presented as mean ± SEM. *p ≤ 0.05, **p ≤ 0.01, ***p≤0.001. See also Figure S2.
Targeting acylcarnitine synthesis through knockdown of hepatic Cpt1a and Cpt1b lowers serum acylcarnitines and lowers core body temperature in the cold
To test whether the liver was the source of acylcarnitines and to test their requirement for adaptive thermogenesis, we developed siRNAs that target hepatic Cpt1a or Cpt1b (Figure 2D and S2C) using a liver in vivo transfection reagent (Bukong et al., 2014). Notably, both siRNAs for Cpt1a or Cpt1b reduced serum acylcarnitine levels, with the greatest effects seen when both Cpt1a/Cpt1b siRNAs were administered (Figure 2C). Knockdown of individual isoforms of Cpt1 resulted in reduced levels of several circulating acylcarnitines; siRNA targeting Cpt1a reduced all long chain acylcarnitines measured, while siRNA for Cpt1b only reduced 16:0, 18:0, and 18:1. Knockdown studies showed a direct effect on the liver, but knockdown was not observed in BAT or skeletal muscle (Figure S2D). Using western blot analysis, we found that Cpt1b, the major isoform in BAT, was not affected when Cpt1b siRNA was administered (Figure 2D). Histological analysis of livers of siRNA treated mice showed similar morphology, suggesting lack of liver damage (Figure S2E), and found similar serum triglyceride levels between mice treated with scrambled siRNA or Cpt1a/Cpt1b siRNA (Figure S2F). To test whether liver-derived acylcarnitines are required for adaptive thermogenesis we measured core body temperature hourly in the cold. We found that mice administered siRNAs targeting Cpt1a, Cpt1b, or both Cpt1a/Cpt1b had reduced core body temperature when compared to mice administered scrambled siRNAs (Figure 2E), where the greatest drop in temperature was detected when both Cpt1a/Cpt1b were knocked down. Simply reintroducing palmitoylcarnitine through the tail vein increased core body temperature in mice treated with siRNAs targeting Cpt1a/Cpt1b (Figure 2F).
Activation of adipose tissue lipolysis promotes expression of hepatic gene expression and acylcarnitine production
During cold exposure body temperature is maintained through both shivering and non-shivering thermogenesis. There is evidence that exercise leads to elevated acylcarnitine levels, therefore we hypothesized that shivering might trigger an induction in acylcarnitines as well. To rule shivering out, we used a stimulus of non-shivering thermogenesis through selective activation of β3AR using CL-316,243, which stimulates thermogenesis in brown adipocytes and lipolysis in white adipocytes. Mice were treated with CL-316,243 (Himms-Hagen et al., 1994) or vehicle control, and we found that CL-316,243 stimulates serum acylcarnitines, as noted by the elevated levels of 12:0-, 14:0-, 14:1-, 16:0-, 16:1-, 16:2-, 18:0-, 18:1-, and 18:2-Carnitine when compared to controls (Figure 3A). In parallel we measured the expression of genes involved in acylcarnitine metabolism, and found increases in hepatic Cpt1b, Octn2, Cpt1a, Cact, Cpt2, and CrAT (Figure 3B). Notably, many of these transcripts are direct targets of HNF4α, including well established targets like PPARα and ApoAIV, which were also induced by CL-316,243 (Figure 3B). HNF4α is a nuclear receptor that is activated by fatty acids. In BAT, we found increased expression of Octn2 and Cact, while Cpt2 and Acat1 were reduced, and Cd36, Cpt1b, Slc16a, and CrAT were unchanged. (Figure S3A). CL-316,243 is a selective β3AR agonist, yet it was able to stimulate changes in hepatic gene expression despite the lack β3AR expression in the liver. This observation and the increased expression of HNF4α targets, led us to test whether FFAs released from the WAT in response to β3AR activation could be driving the transcriptional response in the liver (Figure 3C). To test whether adipose tissue lipolysis is required, we generated adipose specific ATGL knockout mice (AAKO) and treated them with PBS or CL-316,243 (Figure 3D) (Schoiswohl et al., 2015). Compared to controls, AAKO mice were deficient in ATGL and had reduced FFA levels with PBS or CL-316,243 treatment (Figure 3D). Loss of ATGL in adipocytes, blocked the induction in Cpt1b, CrAT, Octn2, Cpt2, ApoA4, and CACT in the liver, and blocked the increases in circulating LCACs (Figure 3F). To test the acute effects of inhibiting ATGL, we treated mice with ATGL inhibitor Atglistatin. Atglistatin treatment attenuated the cold induced rise in circulating FFAs, which also led to impaired thermogenesis, abolished the transcriptional changes in hepatic acylcarnitine transcripts, and changes in circulating LCACs (Figure S3B–E).
Figure 3. Adipose tissue lipolysis promotes acylcarnitine production and regulates hepatic gene expression.

A) Serum acylcarnitine levels as measured by LC-MS in 3 month-old mice treated with PBS or CL-316,243. N = 5–7/group.
B) Expression of genes involved in acylcarnitine and lipid metabolism in the liver of 3 month- old mice treated with PBS or CL-316,243. N = 5–7/group.
C) Serum FFA level in mice treated with PBS or CL-316,243. N = 5–7/group.
D) ATGL protein levels in the WAT and serum FFA levels of ATGLF/F and AAKO mice treated with PBS or CL-316,243. N=5/group.
E) Gene expression in the livers of ATGLF/F and AAKO mice treated with PBS or CL-316,243. N=5/group.
F) Serum Acylcarnitine levels of ATGLF/F and AAKO mice treated with PBS or CL-316,243. N=5/group.
All transcripts were normalized to RPL13, statistical analysis completed used two-way ANOVA. Data are presented as mean ± SEM. *p ≤ 0.05, **p ≤ 0.01, ***p ≤ 0.001. See also Figure S3.
Time dependent changes in FFAs precede induction of serum acylcarnitines, hepatic gene expression, and liver acylcarnitine levels
The reliance of hepatic acylcarnitine production on changes in FFA release from the WAT suggests that FFAs may be acting as a substrate for LCAC production or as a signal to induce changes in hepatic gene expression. In either role, we predicted that changes in circulating FFAs would precede the cold induced rise in serum LCACs. To test this idea, we performed a time course to understand the changes in FFAs, acylcarnitines, and hepatic gene expression. We found that FFAs increased to 1.1 mM within thirty minutes of cold exposure (Figure 4A), while increases in serum LCACs occur later after 3 hours of cold exposure (Figure 4B). Transcript levels of hepatic Cpt1b exhibit a similar increase at 3 hours, which is preceded by the increased expression of PGC-1α, a strong transcriptional coactivator of HNF4α (Figure 4C). To test whether other HNF4α targets are induced by cold exposure in the liver, we measured ApoAIV expression by western blot analysis. ApoAIV increases in response to 5 or 8 hours of cold exposure (Figure S4A). Notably, HNF4α expression is unchanged through the 5 hour time course (Figure 4C). Acylcarnitine levels in the liver increase within one hour with levels of 12:0-,14:0-,16:0-carnitine continuing to rise during cold exposure, while 18:0-carnitine increased within the first hour, and decreased thereafter (Figure 4D).
Figure 4. Time-dependent changes in serum and hepatic acylcarnitines.

A) Time course of serum free fatty acids (FFA) and palmitoylcarnitine levels of 3 month-old male mice exposed to Room Temperature (24°C) or Cold (4°C). N = 5/group.
B) Time course of serum LCAC levels of 3 mont-old C57BL6J mice placed in Room Temp or Cold. N = 5/group.
C) Gene expression changes by real-time PCR analysis from livers of C57BL6J mice treated exposed to Room Temp or Cold. N = 5/group.
D) Liver acylcarnitine levels measured by LC-MS from C57BL6J mice exposed to Room Temp or Cold. N = 5/group.
All transcripts were normalized to RPL13. Data are presented as mean ± SEM. For comparison of Room Temp vs. 4°C *p ≤ 0.05, **p ≤ 0.01, ***p ≤ 0.001.
HNF4α regulates acylcarnitine metabolism in the liver of cold exposed mice
The observed increase in hepatic gene expression of enzymes involved in acylcarnitine metabolism led us to test a direct role for HNF4α in the liver, particularly with prior evidence that the nuclear receptors HNF4α and PPARα are known regulators of Cpt1 and Cpt2 expression (Gutgesell et al., 2009; Hayhurst et al., 2001; Louet et al., 2002; Martinez-Jimenez et al., 2010; Song et al., 2010). To determine whether the cold induced changes in hepatic gene expression were due to HNF4α, we generated mice lacking HNF4α in hepatocytes (Walesky et al., 2013). HNF4αF/F mice received either a control adeno-associated virus 8 (AAV8)-thyroid hormone binding globin (TBG)-eGFP or AAV8-TBG-eGFP-Cre one week prior to cold challenge, leading to selective deletion of HNF4α in the liver (Figure 5A, 5B, S5B). After 5 hours of cold exposure, loss of HNF4α led to impaired induction in Cpt1b, Octn2, and CrAT, Apoa4, and PGC-1α when compared to AAV8-TBG-eGFP controls (Figure 5B), while basal levels of Cpt2 and CACT were reduced in HNF4α null mice. These transcriptional changes correlated with functional changes in thermogenesis. HNF4αF/F AAV8-TBG-eGFP-Cre mice were unable to maintain their core body temperatures when challenged with a cold tolerance test, and displayed lower levels of circulating acylcarnitines (Figure 5C and 5E). The loss of HNF4α did not lead to complete disruption of circulating lipids. HNF4αF/F AAV8-TBG-Cre mice exhibited a similar rise in FFAs during cold exposure as the HNF4αF/F AAV8-TBG-eGFP control mice (Figure 5D). To determine whether other sources of energy were depleted, we measured blood glucose levels, and found an increase in mice lacking HNF4α in hepatocytes (Figure S5A). In contrast, serum triglycerides were reduced with the loss of HNF4α (Figure S5E). Notably, the expression of thermogenic genes UCP1, Elovl3, Dio2, and brown adipocyte markers, Cidea, Prdm16, and Eva1 were not altered in the brown adipose tissue of hepatocyte-selective HNF4α null mice (Figure S5C). Furthermore, gene expression of acylcarnitine transcripts Cpt1b, Octn2, CACT, and CrAT were unchanged in BAT (Figure S5C).
Figure 5. Hepatic HNF4α regulates acylcarnitine metabolism in the liver of cold exposed mice.

A) Western blot analysis of HNF4α and β-actin in the liver of HNF4αF/F mice infected with AAV8-TBG-eGFP (eGFP) or AAV8-TBG-eGFP-Cre (Cre). N = 6/group.
B) Gene expression changes by Real-time PCR analysis of livers from HNF4αF/F mice infected with eGFP or Cre. Mice were challenged with cold or room temperature for 5 hrs. N = 3 for room temperature and N = 6 for cold.
C) Core body temperature after a cold tolerance test at 4°C in HNF4αF/F mice infected with eGFP or Cre. N = 6/group.
D) FFA levels in serum of HNF4αF/F mice infected with eGFP or Cre. Mice were challenged with cold or room temperature for 5 hrs. N = 3 for room temperature and N= 6 for cold.
E) Serum long-chain acylcarnitine levels as measured by LC-MS from 5hr cold-exposed HNF4αF/F mice infected with eGFP or Cre. N = 6/group.
F) ChIP-seq analysis of hepatic HNF4α in proximity to promoters of Cpt1b, Octn2, PPARα, and CrAT.
G) Targeted ChIP-qPCR of HNF4α in the promoters of Cpt1b, Octn2, PPARα, and CrAT in the liver of 3-month old C57BL6J male mice. N = 3
All transcripts were normalized to RPL13. Data are presented as mean ± SEM. *p ≤ 0.05, **p ≤ 0.01, ***p ≤ 0.001. See also Figure S4.
Although Cpt1 and Cpt2 regulation by HNF4α is well established, we also observed reduction in Octn2 and CrAT expression in the livers of hepatocyte-selective HNF4α null mice (Hayhurst et al., 2001; Martinez-Jimenez et al., 2010). To determine if these changes in Octn2 and CrAT were due to direct regulation by HNF4α, we interrogated publically available ChIP-Seq data sets to determine whether HNF4α occupies their promoters (Alpern et al., 2014). HNF4α binding peaks were observed in proximity to promoters of PPARα, Cpt1b, Octn2, and CrAT (Figure 5F). These peaks were validated by targeted ChIP-qPCR using livers from C57BL6J mice (Figure 5G). Together these findings suggest that hepatic HNF4α is a major regulator of the cold adaptive response in the liver.
Palmitate treatment in hepatocytes activates expression of acylcarnitine pathway through HNF4α
To test whether FFAs could directly stimulate the expression of HNF4α targets, we isolated HNF4αF/F primary hepatocytes expressing Rosa 26 LSL-tdTomato, which allows us to test efficiency of Cre recombinase by detection of RFP (Figure 6A). Hepatocytes were infected with adeno-associated virus 48 hours prior to treatment with fatty acids. Hepatocytes were incubated with BSA alone or BSA conjugated to palmitate at a concentration of 0.25, 0.5, and 1.0 mM. Palmitate treatment increased expression of HNF4α targets, Octn2, Apoa4, MTTP, and PGC1α in a dose dependent fashion, while HNF4α and cyk18 expression were unchanged with palmitate treatment. The palmitate response was abrogated by the loss of HNF4α, as hepatocytes infected with Cre recombinase had a blunted response to palmitate in vitro (Figure 6B, Figure S6A). These findings suggest that treatment of hepatocytes with FFAs is sufficient in stimulating the cold-induced transcriptional response.
Figure 6. Acylcarnitines are taken up by BAT and metabolized through the TCA cycle.

A) Hepatocytes from HNF4αF/F mice expressing Rosa26-LSL-tdTomato infected with adenoviral CMV-eGFP (eGFP) or CMV-eGFP-Cre (Cre). Cre induced recombination leads to expression of red fluorescent protein (RFP). Hepatocytes were infected for 16hrs two-days prior to harvest.
B) Gene expression changes in hepatocytes measured by real-time PCR after treatment with BSA or BSA/palmitate at 0.25, 0.5, and 1.0 mM for 6 hrs. N = 3/group.
C) Clearance of U-14C-palmitoylcarnitine from the blood of C57BL6J male mice placed at Room Temperature (24°C) or Cold (4°C). N = 4/group. Mice received single intravenous dose of U-14C-palmitoylcarnitine.
D) Tissue uptake of U-14C-palmitoylcarnitine 5 hours post injection in mice placed at Room Temperature or Cold. N=4/group
E) Uptake of heavy labeled palmitoylcarnitine as measured by GC-MS in differentiated brown adipocytes incubated with either 12C-16:0-Carnitine or 13C-(1,2,3,4)-16:0-Carnitine for 6 hours. N = 5/group.
F) Incorporation of 13C-(1,2,3,4)-16:0-Carnitine into TCA cycle intermediate m+2 Citrate N = 5/group.
G) Schematic of 13C-(1,2,3,4,)-16:0-Carnitine entry and incorporation into the TCA cycle.
All transcripts were normalized to RPL13. Data are presented as mean ± SEM. For comparison of HNF4αF/F eGFP between BSA control (0) and palmitate treatment are shown as *p ≤ 0.05, **p ≤ 0.01, ***p ≤ 0.001. N = 5. For comparison between eGFP and Cre infected cells of the same treatment groups ◆ p ≤ 0.05, ◆◆ p ≤ 0.01, ◆◆◆ p ≤ 0.001 See also Figure S6.
Circulating acylcarnitines provide a fuel source for BAT thermogenesis
To determine which tissues take-up LCACs in vivo, we administered radiolabeled 14C-palmitoylcarnitine by intravenous (i.v.) administration to mice exposed to room temperature or cold. The rate of 14C-palmitoylcarnitine clearance from circulation occurs rapidly in cold exposed mice, after 1 hour 18% of palmitoylcarnitine is cleared at room temperature, while 69% is cleared in the cold (Figure 6C). In the cold mice took up 8-fold more acylcarnitines in BAT, 8-fold in skeletal muscle, and 4-fold in the heart, while uptake in inguinal WAT was reduced by 112-fold, 21-fold in epididymal WAT, and 89-fold in liver (Figure 6D). Although these results show that LCACs are being taken up by BAT, they fail to elucidate whether acylcarnitines are metabolized. Using isotopic labeling experiments, we tested whether differentiated brown adipocytes take up acylcarnitines. Brown adipocytes were incubated with 100 µM 12C-palmitoylcarnitine or heavy-labeled 13C-1,2,3,4-palmitoylcarnitine, and measured the incorporation of heavy labeled carbons into the TCA pool. We found that cells take up palmitoylcarnitine (Figure 6E), as supported by the abundance of the m+4 isotopomer of palmitoylcarnitine. To test whether 13C-1,2,3,4-palmitoylcarnitine was metabolized, we measured the incorporation of 13C into the TCA intermediate Citrate, and found that the m+2 isotopomer could be detected (Figure 6F). Together these findings support that palmitoylcarnitine is actively taken up by brown adipocytes and metabolized.
Reversal of cold sensitive phenotype in aged mice is rescued by acylcarnitine administration
As mice age, there is an impairment in thermogenic capacity (Figure S1E), and as shown in Figure 1D, reduced acylcarnitine levels. These changes coincide with reduced hepatic expression of genes involved in acylcarnitine metabolism (Figure 7A). To test whether the reduction with aging impairs thermogenesis, we administered a single dose of 100mg/kg of carnitine, which led to an increase in acylcarnitine levels during cold exposure (Figure 7B). We found that carnitine administration prevents hypothermia associated with aging, reversing cold sensitivity in 1-year old mice placed at 4°C (Figure 7C) and 2.5-year old mice placed at 16°C (Figure 7D). Carnitine administration in 2.5-year old mice reduced core body temperature by an average of 1.5°C compared to the control group that lost 5°C (Figure 7D). Moreover, intravenous administration of palmitoylcarnitine through the tail vein was able to improve thermoregulation when mice were challenged with 16°C (Figure 7E). The bolus of carnitine did not alter BAT gene expression in the 2.5-year old mice when we assessed UCP1, Dio2, Elov3, and Eva1 (Figure S7B). However, the ability of carnitine to improve thermogenesis was reliant on the presence of BAT, as UCP-DTA mice that lack BAT did not respond to carnitine administration (Figure 7F). Together these findings indicate that the drop in acylcarnitines contributes to the cold sensitive phenotype observed with aging.
Figure 7. Carnitine treatment stimulates acylcarnitine production and protects against age-induced cold sensitivity.

A) Hepatic gene expression in 3 month and 24 month-old mice exposed to Room Temperature (24°C) or Cold (4°C). N=5/group
B) Treatment of 2.5 year-old mice with carnitine (100mg/kg body weight) increases their serum acylcarnitine levels after 5 hours of cold as measured by LC-MS. N = 5/group.
C) Core body temperature after cold tolerance test at 4°C in 12-month old mice treated with either PBS or 100 mg/kg carnitine. N = 5/group.
D) Core body temperature after cold tolerance test at 16°C in 2.5 year-old mice treated with either PBS or 100 mg/kg carnitine. N = 5/group.
E) Change in core body temperature in 2.5 year-old mice treated with PBS or 16:0-Carnitine (100µM). N = 5/group.
F) Core body temperature of littermate control and UCP-DTA transgenic mice treated with PBS or with 100mg/kg carnitine. N=5/group
Data are presented as mean ± SEM. *p ≤ 0.05, **p ≤ 0.01, ***p ≤ 0.001. N = 5. See also Figure S7.
Discussion
Non-targeted LC-MS analysis of plasma lipids during cold exposure led to the identification of acylcarnitines as a cold-induced metabolite. While several acylcarnitine species had previously been detected in the blood in cases of inborn errors of metabolism, exercise, diabetes, and fasting, little was known about their physiologic function. Here, we show that acylcarnitine levels increase in response to the cold, are synthesized by the liver, and provide a fuel source for BAT thermogenesis. Acylcarnitine production is stimulated through the activation of the nuclear receptor HNF4α, by directly regulating the expression of genes involved in acylcarnitine metabolism. HNF4α activation requires FFA release from adipose tissue lipolysis, which provides a stimulus for HNF4α activation, and substrate for acylcarnitine synthesis. Blocking acylcarnitine production in the liver reduces serum acylcarnitine levels and impairs their ability to adapt to the cold. It has been well documented in rodents and humans that aging impairs thermogenesis, however little is known about the mechanisms at play. Here we found that induction of acylcarnitine levels in response to cold exposure were blunted in older mice. The cold sensitive phenotype observed can be reversed with carnitine administration, a treatment that’s known to stimulate acylcarnitine production. Furthermore, infusing palmitoylcarnitine alone, can improve core body temperature when aged mice are challenged with cold exposure. In sum, these findings indicate that the liver is an integral component of adaptive thermogenesis, as well as uncovering a well-orchestrated inter-tissue communication system to upregulate energy mobilization for heat production.
The liver is a focal point for energy mobilization, providing ketones and glucose during fasting, as well as packaging lipid rich lipoproteins for peripheral tissues. Acylcarnitines in the plasma have traditionally been thought of as markers of metabolic stress (Burrage et al., 2016; Genuth and Hoppel, 1981; Mai et al., 2013; McCoin et al., 2015; Schooneman et al., 2013). Although serum acylcarnitines fluctuate, a functional role for circulating acylcarnitines has yet to be determined. Using radiolabeled palmitoylcarnitine we found increased uptake in the BAT, skeletal muscle and heart during cold exposure. Indicating that acylcarnitines are utilized by multiple tissues through a tightly controlled mechanism. Notably, uptake of acylcarnitines decreased in WAT and liver in response to the cold, presumably to direct acylcarnitines towards metabolically active tissues. The active regulation of palmitoylcarnitine uptake suggests a role for acylcarnitines beyond markers of metabolic stress. Uptake was also detected in brown adipocytes in vitro using the metabolic tracer 13C-1,2,3,4-palmitoylcarnitine. These studies showed that acylcarnitines were taken up by brown adipocytes and metabolized, an outcome that was supported by the heavy labeling of the TCA intermediate citrate. Alternatively, acylcarnitines may improve thermoregulation through metabolic flux in the liver, producing heat as a byproduct of acylcarnitine synthesis. Early studies suggest that hepatic thermogenesis is possible, an outcome that was previously measured by calorimetry and shown to contribute to the total body temperature (Baconnier et al., 1979). Further studies are needed to determine the input of hepatic lipid processing in thermoregulation during cold exposure. However, our result that palmitoylcarnitine alone is sufficient to enhance thermogenesis indicates that acylcarnitines are capable of modulating thermogenesis independent of their synthesis and the failure of carnitine to rescue cold sensitivity in the UCP-DTA mice suggests that liver processing is not sufficient to improve hypothermia. Together these results support a model that acylcarnitines are a fuel source for thermogenesis, but it is important to note that these studies do not rule out the possibility of acylcarnitines having a signaling role as well.
There is a prevailing view that FFAs are the major source of energy for thermogenesis, yet we find that acylcarnitine production is required as shown by knockdown studies of hepatic Cpt1a/b that leads to reduced blood acylcarnitine levels, suggesting that this long held view is overly simplistic. This is also supported by the observation that deletion of hepatic HNF4α leads to reduced acylcarnitine levels, while FFA levels are unchanged, suggesting that FFAs are not sufficient for thermogenesis. This finding is surprising, considering the high abundance of FFAs that are available for thermogenesis in response to the cold. However, the metabolic program of brown adipocytes is unique compared to other cell types, where its activation leads to enhanced fatty acid oxidation, glucose uptake and utilization, lipogenesis, and lipolysis. This unique metabolic program reflects the dualistic nature of BAT that is capable of storing excess lipids similarly to other adipose depots, and yet shares similar features with skeletal muscle, including high mitochondrial content and high capacity for fatty acid oxidation (Festuccia et al., 2011; Yu et al., 2002). In other tissues fuel selection is regulated by the Randle cycle, a series of inhibitory signals that regulate glucose or fatty acid utilization, a process driven by substrate availability (Hue and Taegtmeyer, 2009). In the Randle cycle when both glucose and fatty acids are readily available, the TCA-cycle intermediate citrate, is exported to the cytoplasm to ultimately generate malonyl-CoA, an inhibitor of Cpt1b, the rate limiting step in fatty acid oxidation. Through inhibition of fatty acid oxidation, this allows the preferential use of glucose for energy (McGarry et al., 1991). Although cold exposure is energetically demanding, there is a high abundance of peripheral fuel sources, including serum glucose, free fatty acids, and triglycerides (Bartelt et al., 2011; Kinoshita et al., 2014; Wu et al., 2006). During acute cold exposure malonyl-CoA levels in BAT rise to levels that would inhibit Cpt1b activity (Saggerson and Carpenter, 1982). These conditions suggest that initial BAT thermogenesis is dependent on glucose uptake and perhaps other fuel sources like triglycerides, while persistent cold challenge may require a switch towards utilizing energetically rich molecules like acylcarnitines. Therefore, we propose a model where acylcarnitines provide a mechanism for lipid utilization to bypass the inhibition of Cpt1b in brown adipocytes, expediting the metabolic switch to FFA utilization.
The increase in expression of genes involved in acylcarnitine metabolism in response to cold was surprising, as there is little evidence for the liver’s involvement in adaptive thermogenesis. Prior studies on the transcriptional regulation of Cpt1 led our focus to HNF4α, which is primarily thought to be involved in liver development. Analysis of HNF4α occupancy using publically available ChIP-Seq data sets revealed potential binding sites in the promoter region of other genes involved in acylcarnitine metabolism (Louet et al., 2002; Martinez-Jimenez et al., 2010). Notably, HNF4α binding at these sites did not change in response to the cold, an outcome noted by other HNF4α targets (data not shown); instead it is the binding to various coactivators that likely drives changes in HNF4α activity. HNF4α activity is largely driven by coregulator interactions, where Hes6 has been shown to be inhibitory, while interactions through PGC-1α activate transcription (Martinez-Jimenez et al., 2010; Rhee et al., 2006; Rhee et al., 2003). We found that in response to the cold, expression of hepatic PGC-1α was induced, but lost as mice aged. The induction of PGC1α is likely driven by FFAs, which stimulate CREB phosphorylation, and increase expression of PGC1α. These findings fit with our model that HNF4α activation is dependent on the FFA release observed with the cold or activation with a β3-AR agonist CL-316,243 (Collins et al., 2006; Herzig et al., 2001; Schauer and Reusch, 2009). Alternatively, FFAs could activate HNF4α directly through its ligand binding domain, although binding of HNF4α to its purported lipid ligand has been shown to occur during assembly, while others have shown linoleic acid regulates HNF4α activity (Dhe-Paganon et al., 2002; Yuan et al., 2009). Our studies indicate that HNF4α is required for the induction of PGC1α, Octn2, MTTP, and Apoa4 in response to palmitate in hepatocytes. Additional studies are needed to understand the mechanism through which cold exposure increases HNF4α activity as well as other regulatory elements controlling this cold response in the liver. Although the induction of genes involved in acylcarnitine metabolism are abrogated in HNF4α knockout livers, they are not completely ablated. This suggests that other transcriptional regulators are involved in mediating the cold response observed with Octn2, Cpt2, CACT, and CrAT. Together our findings support a model where FFA release during the cold, stimulates a transcriptional program driven by HNF4α, ultimately leading to acylcarnitine synthesis and release into the plasma. This model explains why the β3-AR agonist CL-316,243 stimulates acylcarnitine levels in the blood, despite the lack of β3-AR expression in hepatocytes.
The source of serum acylcarnitines has long been a mystery. We found that a rise in acylcarnitines is dependent on the increase in circulating FFAs from adipose tissue. Inhibition of adipose tissue triglyceride lipolysis, by selective deletion of ATGL in adipocytes, blocked the increase in circulating acylcarnitines in response to β3-AR agonist. Acute inhibition of ATGL with Atglistatin treatment, also led to cold intolerance in mice, reduced levels of acylcarnitines and induction of hepatic gene expression. Although Atglistatin treatment inhibits ATGL in multiple tissues, others have shown that ATGL knockout mice are sensitive to hypothermia, and that loss of ATGL in the adipocytes is sufficient to decrease β3-AR agonist stimulation of FFA release (Ahmadian et al., 2011; Haemmerle et al., 2006). Interestingly, both adipose-selective deletion of ATGL and Atglistatin treatment inhibited the increased expression of hepatic acylcarnitine transcripts, suggesting that the cold induced FFAs are not only acting as a substrate for acylcarnitine synthesis but also stimulate the cold-induced transcriptional program in the liver. This observation is recapitulated in vitro with palmitate treatment of hepatocytes.
Our studies aimed to develop a deeper understanding of the metabolic changes that take place with cold exposure. Together, our findings support a model that acylcarnitines are synthesized by the liver to provide fuel for peripheral tissues during cold exposure. The inability to generate acylcarnitines by the liver leads to hypothermia. The rise in acylcarnitines is driven by substrate availability of FFAs through adipose tissue lipolysis and FFA activation of hepatic HNF4α that drives the expression of genes involved in acylcarnitine production. In response to the cold there is partitioning of acylcarnitines to brown adipose tissue, heart, and skeletal muscle, while liver and white adipose tissue decrease uptake. Notably, brown adipocytes take up and catabolize acylcarnitines. This broadens the understanding of the liver as a metabolic hub that processes fuel for peripheral tissues including hepatic gluconeogenesis, lipoprotein synthesis, ketogenesis, and now acylcarnitine production. In sum, these studies demonstrate the importance of peripheral energy sources in heat production by brown adipocytes and discovered an inter-tissue communication system that regulates thermogenesis.
Methods
Experimental Model and Subject Details
Animal Care
All procedures were approved by the Institutional Animal Care and Use Committee (IACUC) of University of Utah. Mice were housed at 22°C–24°C using a 12 hr light/12 hr dark cycle. Animals were maintained on a Teklad global soy protein-free diet (2920x-030917M). Animals had ad libitum access to water at all times, and food was only withdrawn if required for an experiment. Male mice C57BL6J at 3–4 months of age, unless otherwise stated. Mice were purchased from Jackson Laboratories.
Genetic Mouse Models
C57BL6J male mice aged to 3 months were purchased from Jackson laboratories, older mice were provided by the National Institute on Aging. HNF4αF/F mice were bred to C57BL/6 mice for five generations before crossing to homozygosity (Hayhurst et al., 2001). Male HNF4αF/F mice were aged to 12 weeks, one week prior to cold exposure mice received intraperitoneal injection of adeno-associated virus 8 (AAV8) containing Cre recombinase regulated by the thyroid hormone binding globin promoter (AAV8-TBG-Cre) to drive hepatocyte specific expression or a control green fluorescent protein regulated by the same promoter (AAV8-TBG-eGFP) (University of Pennsylvania Vector Core in Philadelphia)(Hayashi et al., 1993; Mu et al., 2015). Mice received a single injection of 400µL of AAV8-TBG-eGFP or AAV8-TBG-Cre (titer 1012genome copies/mL). AAKO mice were generated from the previously described ATGLF/F mice which were bred with C57BL/6NJ mice for more than 10 generations (Haemmerle et al., 2011). ATGLF/F mice were then bred to Adipoq-Cre BAC transgenic mice bred for 9 generations by the Jackson laboratories to C57BL/6J background. The mice from this F1 generation were then crossed to generate ATGLF/F mice that expressed the Adipoq-Cre transgene and compared to littermate controls lacking cre transgene. For the procedures described in this manuscript, male AAKO mice and male litter mate controls ranging from 22 to 27 weeks of age were selected for an experimental cohort. FVB/N-Tg(Ucp-DTA)1Kz/J mice expressing the diphtheria toxin A-chain using the UCP promoter containing 3 kb of 5'-flanking DNA and 0.3 kb of 3'-flanking DNA were acquired from the Jackson laboratory (Lowell et al., 1993). Male UCP-DTA mice were used for studies.
Brown Adipocyte
Brown preadipocytes were isolated from C57BL6J mice (Rodriguez-Cuenca et al., 2007). Interscapular BAT was removed from 4 week-old male C57BL6J mice in sterile conditions, minced into small pieces, and incubated in digestion buffer (0.1% collagenase type 2, DMEM, and antibiotic-50 IU Penicillan/mL and 50 µg Streptomycin/mL). The samples were incubated at 37°C in a shaking water bath for 1 hour. The solution was cooled at 4°C for 15–30 minutes, and then infranatant was filtered through a 100µm filter and centrifuged for 5 minutes at 700xg. The digestion buffer was removed and the pellet washed with DMEM and antibiotics (50 IU Penicillan/mL and 50 µg Streptomycin/mL), the cells were then centrifuged for 5 minutes at 700xg. The pellet was resuspended in 0.5 ml of DMEM with antibiotics, 0.2mL of this solution was added to a 6-well plate containing 1.8mL of cultured media (10% FBS, DMEM, and 50 IU Penicillan/mL and 50 µg Streptomycin/mL). The day after harvest, the cells were immortalized through retroviral expression of SV40 Large T-antigen using hygromycin for selection (Rodriguez-Cuenca et al., 2007). For experiments, the cells were plated in DMEM containing 10% FBS (RMBI), 20nM insulin (Sigma), and 1nM T3 (Sigma). Upon complete confluence cells were stimulated for differentiation by DMEM containing 10% FBS, 20nM insulin, 1nM T3, 0.5mM isobutylmethylxanthine (Sigma), 0.5µM dexamethasone (Sigma), 0.125mM indomethacin (Sigma), and 1µM rosiglitazone (Cayman). After 2 days differentiation media was removed and cells were maintained in DMEM 10% FBS, 20nM insulin, 1nM T3, and 1µM Rosiglitazone. Validation of brown preadipocytes was performed by RT-PCR during a differentiation time course for BAT markers PPARγ2, UCP1, Eva1, Elov3, Ebf2 and Prdm16.
Primary Hepatocytes
Primary hepatocytes were isolated as previously described (Severgnini et al., 2012) from 8 week old male HNF4αf/f Rosa26LSL-tdTomato, a kind gift from the laboratory of Eric Snyder at the University of Utah. Briefly, animals were anaesthetized with 5% isoflurane, the animals were sacrificed by cervical dislocation, the abdominal cavity was opened, the rib cage removed while taking care not to rupture blood vessels, and the visceral vena cava exposed. A catheter of PE-10 tubing was inserted through the right atrium into the vena cava, the catheter was kept in place by applying a surgical knot with fibroin. The livers were perfused with sterile PBS back pressure was created during the perfusion process by clamping the inferior vena cava below the kidneys which had previously been severed for 5 second intervals. The liver was then perfused with DMEM with 0.15% Collagenase type II (Sigma) for 10 minutes, and then excised. The liver sac was then cut in sterile conditions in a 10cm dish in DMEM. The cells were passed through a 100 µM cell strainer and then pelleted at 50 g for 1 minute, the pellet was washed 3 times with DMEM and then plated on a tissue culture plate coated with 0.1% rat tail collagen (Sigma). Cells were maintained in hepatic cell culture media (ThermoFisher), and assessed for hepatocyte purity by RT-PCR of albumin, cyk18, and transthyretin.
Method Details
Cold exposure
Mice were singly housed with no food, no bedding, but ready access to water. Starting at T0 mice were placed at the specified temperature of either 30°C (thermoneutrality), 24°C (room temperature), 16°C, or 4°C (cold exposure) for 5 hours. Body temperatures were taken every hour with a physitemp A590 rectal probe using an Oaklon Thermocouple digital thermometer.
CL-316,243 Administration
Administration of CL-316,243 (1mg/kg body weight; Cayman) or a vehicle control of sterile PBS pH 7.5 was performed by intraperitoneal injection. After drug or vehicle administration mice were singly housed in a cage with no food, no bedding, but ready access to water placed at 24°C for 5 hours. After euthanasia tissues were dissected 5 hours after administration of CL-316,243 or saline, flash frozen in liquid nitrogen, and stored at −80°C.
Atglistatin Treatment
Atglistatin (200µmol/kg body weight; Caymen) was diluted in corn oil and provided by oral gavage, a comparable volume of corn oil was administered by gavage in the control mice (Mayer et al., 2013). For the duration of the cold exposure mice were singly housed in a cage with no food, no bedding, but ready access to water.
Carnitine and Palmitoylcarnitine Administration
Carnitine (100mg/kg body weight; Sigma) was administered by intraperitoneal injection with sterile PBS pH 7.5 used as a vehicle control. Palmitoylcarnitine (100µM; Sigma), palmitate conjugated to BSA (100µM; Sigma), or BSA solution was injected via tail vein. After administration of metabolites mice were placed at 4°C with no food, no bedding, but ready access to water.
Palmitate Treatment of Primary Hepatocytes
The day after primary hepatocytes isolation, cells were rinsed 8–10× to remove debris. Hepatocytes from HNF4α F/F mice were infected with adenovirus expressing either CMV-eGFP (GFP) or CMV-eGFP-Cre (CRE) (ViraQuest) at multiplicity of infection (MOI) of 1. 48 hours post infection cells were treated with indicated levels of BSA conjugated palmitate for 6 hours, washed 3 times with PBS, and then RNA was extracted.
Tissue Uptake of Palmitoylcarnitine
Mice received an intravenous injection through the tail vein using 120µL solution of 1µCi of 14C-palmitoylcarnitine (PerkinElmer) mixed with unlabeled palmitoylcarnitine (Sigma) dissolved in sterile saline. The amount of unlabeled palmitoylcarnitine was adjusted to body weight, ensuring that the initial injection concentration was 10µM based on calculated blood volume (Riches et al., 1973). After injection, mice were placed in either Room Temperature (24°C) or Cold (4°C), body tempera tures and blood samples were taken hourly. Mice were sacrificed after five hours, tissues were weighed and processed by Folch extraction (Pandey et al., 2012). Briefly, ~100mg of tissue was homogenized in 1.4mL chloroform/methanol (2:1) first by glass dounce followed by four cycles in the TissueLyzer II (Qiagen). Urea (40%) and sulfuric acid (5%) were added and the tubes were processed again by TissueLyzer II. Samples were centrifuged 1,800g for 10 minutes. The aqueous phase and organic phase were measured using liquid scintillation.
Brown Adipocyte 13C-1,2,3,4-palmitoylcarnitine Labeling
On day 6 of differentiation brown adipocytes were washed 3 times with PBS, activated with 1µM CL-316,243, and then treated with 100µM 12C-palmitoylcarnitine (Sigma) or 100µM 13C-1,2,3,4-palmitoylcarnitine (Isotec) in Krebs Ringer Buffer (135mM NaCl, 5mM KCl, 1mM MgSO4, .4mM K2HPO4, 5.5mM Glucose, 20mM HEPES, 1mM CaCl2 pH 7.4). After 6 hours of palmitoylcarnitine treatment cells were washed 3 times with PBS and then collected using a cell scrapper for metabolic tracer analysis.
Hepatic Knockdown Studies
C57BL6J 3 month-old male mice received intravenous tail vein injection with 60ug of siRNA targeting Cpt1a, Cpt1b, both Cpt1a/Cpt1b, or scrambled negative control in a hepatocyte targeting liposome mixture (Altogen) (Bukong et al., 2014). Mice were injected a second time with 30ug of the specified siRNA liposome mixture twelve hours after the initial injection. Thirty-six hours after the initial injection, mice were singly housed without food but free access to water and placed at 4°C. A cold tolerance test was conducted as previously described; mice were sacrificed five hours after the start of cold exposure. The siRNAs were obtained from IDT using proprietary designs for the scrambled (51-01-19-09), Cpt1a (mm.Ri.Cpt1a.13.1), and Cpt1b (mm.Ri.Cpt1b.13.1).
Lipid Measurements
Lipids were extracted from serum (~40 µL) aliquots then combined with 225 µL ice-cold MeOH containing internal standards (Avanti Lipids, LM-1601 (19.82 µM, −1102 (14.52 µM) and −1002 (12.54 µM); 10 µL each / sample) and vortexed for 10 s. 750 µL of ice-cold MTBE (methyl tert-butyl ether) was added, vortexed for 10 s, and 200 µL of water is added to induce phase separation. The sample was then vortexed for 20 s followed by centrifugation at 14,000 g for 2 min at 4 °C. Th e upper phase (750 µL) was collected and evaporated to dryness under vacuum. Samples were reconstituted in 25 µL ACN:H2O:IPA (1:1:2 v/v) + 0.1% formic acid for analysis. A pooled QC sample was prepared by 5 µL aliquots from each sample.
Lipid extracts were separated on an Acquity UPLC CSH C18 1.7 µm 2.1 × 100 mm column maintained at 60 °C connected to an Agilent HiP 1290 Sampler, Agilent 1290 Infinity pump, equipped with an Agilent 1290 Flex Cube and Agilent 6520 Accurate Mass Q-TOF dual ESI mass spectrometer. For positive more, the source gas temperature was set to 350 °C, with a gas flow of 1 1.1 (L/min) and a nebulizer pressure of 24 psig. VCap voltage is set at 5000 V, fragmentor at 250 V, skimmer at 74.4 V and Octopole RF peak at 750 V. VCap voltage is set at 5000 V, fragmentor at 100 V, skimmer at 75 V and Octopole RF peak at 750 V. Reference masses in positive mode (m/z 121.0509 and 922.0098) were infused with nebulizer pressure at 2 psig. Samples were analyzed in a randomized order acquiring with the scan range between m/z 100 – 1700. Mobile phase A consists of ACN:water (60:40 v/v) in 10 mM ammonium formate and 0.1% formic acid, and mobile phase B consists of IPA:water (90:10 v/v) in 10 mM ammonium formate and 0.1% formic acid. The chromatography gradient for both positive and negative modes starts at 15% mobile phase B increasing to 30% B over 4 min, it then increases to 52% B from 4–5 min, then increases to 82% B from 5–22 min, then increases to 95% B from 22–23 min, and then increases to 99% B from 23–27 min. From 27–38 min it’s held at 99%B, then returned to 15% B from 38–38.2 min and was held there from 38.2–44 min. Flow is 0.3 mL/min throughout. Tandem mass spectrometry was conducted using the same LC gradient and at collision energies of 10 V, 20 V and 40 V. Injection volume was 3 µL.
Results from LC-MS experiments were collected using Agilent Mass Hunter Workstation and analyzed using the software package Agilent Mass Hunter Qual B.05.00. Using the Find By Formula (FBF) algorithm, MS/MS fragmentation and a Lipids PCLD database, possible assignments were generated then individually inspected. Compounds were also checked against the blank process sample to remove any artifacts. Once a list of confident assignments was made, a Mass Hunter Quant method was generated and the software program Mass Hunter Quant is used to analyze and integrate each compound. Lipids are normalized to LM-1601 response (PC(17:1(10Z)/0:0)). Representative chromatogram and corresponding standards can be found in Table S3. Serum free fatty acids were quantified by colorimetric kit according to the manufacturer’s instruction (Sigma).
Acylcarnitine analysis
Acylcarnitine analysis was performed according to a published procedure (Liu and Pasquali, 2005)) (Figure 1E, S1A–B). A Waters Acquity Ultra Performance LC solvent manager system was used for sample and mobile phase delivery. MS/MS analysis was performed on a Waters Quattro Premier XE tandem mass spectrometer operated in positive ion electrospray mode using MassLynx software. Acylcarnitines extracts were derivatised with butanolic HCl, dried, and resuspended in mobile phase for MS/MS analysis. Free carnitine and acetylcarnitine were monitored in selective reaction monitoring mode (SRM), while all other acylcarnitines were monitored using parent ion scan (m/z 85). A list of butylated acylcarnitine species are shown in Table S2. Acylcarnitines were quantified using stable isotope dilution method and NeoLynx software.
Metabolic Tracer Analysis
Brown adipose tissue was weighed in bead mill tubes containing 1.4 mm ceramic beads (Qiagen, Carlsbad, CA). Cold methanol containing d4-succinate as an internal standard was added to give a final methanol concentration of 80%. An Omni Bead Ruptor (Omni-Inc, Kennesaw, GA) was employed at 6.45 MHz for 30 seconds to disrupt the cells. The supernatant was transferred to fresh microfuge tubes and protein was precipitated by incubation at −20° C for 30 minutes. The extract was clarified by centrifugation at 20,000 × g followed by transfer to new fresh microfuge tubes and solvent removed en vacuo.
All GC-MS analysis was performed with a Waters GCT Premier mass spectrometer fitted with an Agilent 6890 gas chromatograph and a Gerstel MPS2 auto sampler. Dried samples were suspended in 40 µL of a 40 mg/mL O-methoxylamine hydrochloride (MOX) in pyridine and incubated for one hour at 30° C. To auto sampler vials was added 25 µL of this solution. 40 µL of N-methyl-N-trimethylsilyltrifluoracetamide (MSTFA) was added automatically via the auto sampler and incubated for 60 minutes at 37° C with shaking. After incubation 3 µL of a fat ty acid methyl ester standard (FAMES) solution was added via the auto sampler then 1 µL of the prepared sample was injected to the gas chromatograph inlet in the split mode with the inlet temperature held at 250° C. A 10:1 split ratio was used for analysis. The gas chromatograph had an initial temperature of 95° C for one minute followed by a 4 0° C/min ramp to 110° C and a hold time of 2 minutes. This was followed by a second 5° C/min ramp to 250° C, a third ramp to 350°C, then a final hold time of 3 minutes. A 30 m Phenomex ZB5-5 MSi column with a 5 m long guard column was employed for chromatographic separation. Helium was used as the carrier gas at 1 mL/min. Data was collected using MassLynx 4.1 software (Waters). Each isotope for the targeted metabolites were identified and their peak area was recorded using QuanLynx. All the extracted data was then corrected mathematically to account for natural abundance isotopes, and finally showed as the fraction of the total pool of citrate (Katajamaa and Orešič, 2005).
Gene Expression
RNA was isolated from liver, skeletal muscle, or BAT using Trizol reagent (Invitrogen), samples were homogenized with a TissueLyzer II (Qiagen). Reverse transcription was performed with SuperScript VILO Master Mix (Thermofisher). Quantification of gene expression was performed with KAPA SYBR FAST qPCR 2x Master Mix Rox Low (Kapabiosystems) on an Applied Biosystems QuantStuio 6 Flex Real-Time PCR System, 384-well. Analysis was performed by a calculated relative expression extrapolated from a standard curve for each primer pair that was then normalized to expression of the housekeeping gene RPL13. Primer pairs were designed with Universal Probe Library (Roche) or qPrimer Depot (mouseprimerdepot.nci.nih.gov), a list of primer pairs is included in Table S1.
Protein Analysis
Liver tissue was homogenized by glass dounce in RIPA buffer (Boston Bioproducts) with added protease inhibitor (Roche). Tissue samples were spun at 12,000 × g for 10 minutes at 4°C and the supernatant was extracted. Protein quantification was performed by BCA assay (Thermofisher), diluted in Laemmli loading buffer (BioRad), heated at 70°C for 20 min, and run on a standard 10% acrylamide gel. Protein was transferred to Amersham Protran .45µM Nitrocellulose (GE healthcare) and blotted for Cpt1b (16331-1-AP, ProteinTech), Octn2 (16331-1-AP, ProteinTech), Apoa-IV (5700S, Cell Signaling), HNF4α (PP-H1415-00, R & D Systems), or β-Actin (3700S, Cell Signaling).
Chromatin Immunoprecipitation
Chromatin was prepared from snap frozen livers. Livers were minced in 1% formaldehyde in PBS and incubated for 10 minutes at room temperature. Followed by quenching with 125 mM glycine for 10 minutes at room temperature. Livers were then homogenized in TissueLyser II according to manufacturer’s instructions. Samples were centrifuged at 400g for 5 min and resuspended in chip lysis buffer (25mM Tris pH8, 2mM EDTA, 150mM NaCl, 1% Triton X-100, 0.1% SDS) and sonicated in Diagenode pico bath sonicator for 33 cycles, 40 seconds on 40 seconds off. Chromatin was Immunoprecipitated with antibodies against IgG (PP64 EMD Millipore), HNF4α (PP-H1415-00, R & D Systems) overnight at 4 °C in the presence of Dyn abeads protein A (10001D, Invitrogen). DNA was purified with ChIP DNA Clean & Concentrator Kit (11–379, Genesee Scientific) and quantified by real-time PCR (ABI QuantStudio Flex6) using Syber green (KK4621, Kapa Biosystems). Occupancy was quantified using a standard curve and normalized to input DNA. Primers are listed in Table S1.
Quantification and Statistical Analysis
Assessment of lipidomics t-test p value, fold change, and generation of heat map were performed in MetaboAnalyst 3.0 (Xia et al., 2015). Comparison of the differentially abundant plasma lipids from 3 month old and 24 month old mice in Room Temperature or Cold was performed by significance analysis of microarrays (SAM) (Tusher et al., 2001). A tuning parameter, delta of 0.4, optimized the cutoff for significance with the estimation of false discovery rate (FDR) threshold q-value of 0.05. Volcano plot creation and SAM was performed using R (version 3.1.3). Comparison between two groups was completed by student T-test, while multiple comparisons were completed using Two-way ANOVA followed by a Tukey post-hoc analysis using Prism 7.
Supplementary Material
Highlights.
Increase in plasma acylcarnitines is required for adaptive thermogenesis
Adipose tissue lipolysis promotes hepatic acylcarnitine production
HNF4α stimulates expression of genes involved in acylcarnitine metabolism
Brown adipocytes increase uptake of acylcarnitines in response to the cold
Acknowledgments
The authors are grateful to members of the Diabetes and Metabolism Center and the Biochemistry Department at the University of Utah for useful discussion and feedback. Lipidomics and metabolic tracer analysis was performed at the Metabolomics Core Facility at the University of Utah. This study was supported by NIDDK KO1DK097285, NIDDK RO3DK103089, NIDDK RO1DK103930, Margolis Research Foundation, NIDDK DRC, T32DK091317, and S10 OD016232-01. The content is solely the responsibility of the authors and does not necessarily represent the official views of the National Institutes of Health.
Footnotes
Publisher's Disclaimer: This is a PDF file of an unedited manuscript that has been accepted for publication. As a service to our customers we are providing this early version of the manuscript. The manuscript will undergo copyediting, typesetting, and review of the resulting proof before it is published in its final citable form. Please note that during the production process errors may be discovered which could affect the content, and all legal disclaimers that apply to the journal pertain.
Contact for Reagent and Resource Sharing
Further information and requests for resources and reagents should be directed to and will be fulfilled by the Lead Contact Claudio Villanueva (villanueva@biochem.utah.edu).
AUTHOR CONTRIBUTIONS
J.S., C.J.V, G.G., A.M., M.P., S.L., P.J.S., I.H., J.C. conducted experiments, J.S., A.J.D., U.A., N.L., J.R., C.J.V. designed experiments, and J.S. and CJV wrote paper. All authors contributed to data analysis.
References
- Ahmadian M, Abbott MJ, Tang T, Hudak CSS, Kim Y, Bruss M, Hellerstein MK, Lee H-Y, Samuel VT, Shulman GI, et al. Desnutrin/ATGL is Regulated by AMPK and is Required for a Brown Adipose Phenotype. Cell metabolism. 2011;13:739–748. doi: 10.1016/j.cmet.2011.05.002. [DOI] [PMC free article] [PubMed] [Google Scholar]
- Alpern D, Langer D, Ballester B, Le Gras S, Romier C, Mengus G, Davidson I. TAF4, a subunit of transcription factor II D, directs promoter occupancy of nuclear receptor HNF4A during post-natal hepatocyte differentiation. Elife. 2014;3:e03613. doi: 10.7554/eLife.03613. [DOI] [PMC free article] [PubMed] [Google Scholar]
- Baconnier P, Benchetrit G, Tanche M. Liver heat production and temperature regulation in the anesthetized dog. Am J Physiol. 1979;237:R334–339. doi: 10.1152/ajpregu.1979.237.5.R334. [DOI] [PubMed] [Google Scholar]
- Bartelt A, Bruns OT, Reimer R, Hohenberg H, Ittrich H, Peldschus K, Kaul MG, Tromsdorf UI, Weller H, Waurisch C, et al. Brown adipose tissue activity controls triglyceride clearance. Nature medicine. 2011;17:200–205. doi: 10.1038/nm.2297. [DOI] [PubMed] [Google Scholar]
- Bukong TN, Momen-Heravi F, Kodys K, Bala S, Szabo G. Exosomes from Hepatitis C Infected Patients Transmit HCV Infection and Contain Replication Competent Viral RNA in Complex with Ago2-miR122-HSP90. PLoS Pathogens. 2014;10:e1004424. doi: 10.1371/journal.ppat.1004424. [DOI] [PMC free article] [PubMed] [Google Scholar]
- Burrage LC, Miller MJ, Wong LJ, Kennedy AD, Sutton VR, Sun Q, Elsea SH, Graham BH. Elevations of C14:1 and C14:2 Plasma Acylcarnitines in Fasted Children: A Diagnostic Dilemma. J Pediatr. 2016;169:208–213. e202. doi: 10.1016/j.jpeds.2015.10.045. [DOI] [PMC free article] [PubMed] [Google Scholar]
- Chondronikola M, Volpi E, Børsheim E, Porter C, Annamalai P, Enerbäck S, Lidell ME, Saraf MK, Labbe SM, Hurren NM, et al. Brown Adipose Tissue Improves Whole-Body Glucose Homeostasis and Insulin Sensitivity in Humans. Diabetes. 2014;63:4089–4099. doi: 10.2337/db14-0746. [DOI] [PMC free article] [PubMed] [Google Scholar]
- Collins QF, Xiong Y, Lupo EG, Jr, Liu HY, Cao W. p38 Mitogen-activated protein kinase mediates free fatty acid-induced gluconeogenesis in hepatocytes. J Biol Chem. 2006;281:24336–24344. doi: 10.1074/jbc.M602177200. [DOI] [PubMed] [Google Scholar]
- Costa CC, de Almeida IT, Jakobs C, Poll-The BT, Duran M. Dynamic changes of plasma acylcarnitine levels induced by fasting and sunflower oil challenge test in children. Pediatr Res. 1999;46:440–444. doi: 10.1203/00006450-199910000-00013. [DOI] [PubMed] [Google Scholar]
- Dhe-Paganon S, Duda K, Iwamoto M, Chi YI, Shoelson SE. Crystal structure of the HNF4 alpha ligand binding domain in complex with endogenous fatty acid ligand. J Biol Chem. 2002;277:37973–37976. doi: 10.1074/jbc.C200420200. [DOI] [PubMed] [Google Scholar]
- Esser V, Britton CH, Weis BC, Foster DW, McGarry JD. Cloning, sequencing, and expression of a cDNA encoding rat liver carnitine palmitoyltransferase I. Direct evidence that a single polypeptide is involved in inhibitor interaction and catalytic function. J Biol Chem. 1993;268:5817–5822. [PubMed] [Google Scholar]
- Festuccia WT, Blanchard P-G, Deshaies Y. Control of Brown Adipose Tissue Glucose and Lipid Metabolism by PPARγ. Frontiers in Endocrinology. 2011;2:84. doi: 10.3389/fendo.2011.00084. [DOI] [PMC free article] [PubMed] [Google Scholar]
- Fingerhut R, Roschinger W, Muntau AC, Dame T, Kreischer J, Arnecke R, Superti-Furga A, Troxler H, Liebl B, Olgemoller B, et al. Hepatic carnitine palmitoyltransferase I deficiency: acylcarnitine profiles in blood spots are highly specific. Clin Chem. 2001;47:1763–1768. [PubMed] [Google Scholar]
- Gempel K, Kiechl S, Hofmann S, Lochmuller H, Kiechl-Kohlendorfer U, Willeit J, Sperl W, Rettinger A, Bieger I, Pongratz D, et al. Screening for carnitine palmitoyltransferase II deficiency by tandem mass spectrometry. J Inherit Metab Dis. 2002;25:17–27. doi: 10.1023/a:1015109127986. [DOI] [PubMed] [Google Scholar]
- Genuth SM, Hoppel CL. Acute hormonal effects on carnitine metabolism in thin and obese subjects: responses to somatostatin, glucagon, and insulin. Metabolism: clinical and experimental. 1981;30:393–401. doi: 10.1016/0026-0495(81)90121-9. [DOI] [PubMed] [Google Scholar]
- Golozoubova V, Hohtola E, Matthias A, Jacobsson A, Cannon B, Nedergaard J. Only UCP1 can mediate adaptive nonshivering thermogenesis in the cold. FASEB J. 2001;15:2048–2050. doi: 10.1096/fj.00-0536fje. [DOI] [PubMed] [Google Scholar]
- Gutgesell A, Ringseis R, Schmidt E, Brandsch C, Stangl GI, Eder K. Downregulation of peroxisome proliferator-activated receptor alpha and its coactivators in liver and skeletal muscle mediates the metabolic adaptations during lactation in mice. J Mol Endocrinol. 2009;43:241–250. doi: 10.1677/JME-09-0064. [DOI] [PubMed] [Google Scholar]
- Haemmerle G, Lass A, Zimmermann R, Gorkiewicz G, Meyer C, Rozman J, Heldmaier G, Maier R, Theussl C, Eder S, et al. Defective lipolysis and altered energy metabolism in mice lacking adipose triglyceride lipase. Science. 2006;312:734–737. doi: 10.1126/science.1123965. [DOI] [PubMed] [Google Scholar]
- Haemmerle G, Moustafa T, Woelkart G, Büttner S, Schmidt A, van de Weijer T, Hesselink M, Jaeger D, Kienesberger PC, Zierler K, et al. ATGL-mediated fat catabolism regulates cardiac mitochondrial function via PPAR-α and PGC-1. Nature medicine. 2011;17:1076–1085. doi: 10.1038/nm.2439. [DOI] [PMC free article] [PubMed] [Google Scholar]
- Hayashi Y, Mori Y, Janssen OE, Sunthornthepvarakul T, Weiss RE, Takeda K, Weinberg M, Seo H, Bell GI, Refetoff S. Human thyroxine-binding globulin gene: complete sequence and transcriptional regulation. Molecular endocrinology (Baltimore, Md.) 1993;7:1049–1060. doi: 10.1210/mend.7.8.8232304. [DOI] [PubMed] [Google Scholar]
- Hayhurst GP, Lee YH, Lambert G, Ward JM, Gonzalez FJ. Hepatocyte nuclear factor 4alpha (nuclear receptor 2A1) is essential for maintenance of hepatic gene expression and lipid homeostasis. Mol Cell Biol. 2001;21:1393–1403. doi: 10.1128/MCB.21.4.1393-1403.2001. [DOI] [PMC free article] [PubMed] [Google Scholar]
- Herzig S, Long F, Jhala US, Hedrick S, Quinn R, Bauer A, Rudolph D, Schutz G, Yoon C, Puigserver P, et al. CREB regulates hepatic gluconeogenesis through the coactivator PGC-1. Nature. 2001;413:179–183. doi: 10.1038/35093131. [DOI] [PubMed] [Google Scholar]
- Hiatt WR, Regensteiner JG, Wolfel EE, Ruff L, Brass EP. Carnitine and acylcarnitine metabolism during exercise in humans. Dependence on skeletal muscle metabolic state. J Clin Invest. 1989;84:1167–1173. doi: 10.1172/JCI114281. [DOI] [PMC free article] [PubMed] [Google Scholar]
- Himms-Hagen J, Cui J, Danforth E, Jr, Taatjes DJ, Lang SS, Waters BL, Claus TH. Effect of CL-316,243, a thermogenic beta 3-agonist, on energy balance and brown and white adipose tissues in rats. The American journal of physiology. 1994;266:R1371–1382. doi: 10.1152/ajpregu.1994.266.4.R1371. [DOI] [PubMed] [Google Scholar]
- Hue L, Taegtmeyer H. The Randle cycle revisited: a new head for an old hat. Am J Physiol Endocrinol Metab. 2009;297:E578–591. doi: 10.1152/ajpendo.00093.2009. [DOI] [PMC free article] [PubMed] [Google Scholar]
- Katajamaa M, Orešič M. Processing methods for differential analysis of LC/MS profile data. BMC Bioinformatics. 2005;6:179–179. doi: 10.1186/1471-2105-6-179. [DOI] [PMC free article] [PubMed] [Google Scholar]
- Kinoshita K, Ozaki N, Takagi Y, Murata Y, Oshida Y, Hayashi Y. Glucagon is essential for adaptive thermogenesis in brown adipose tissue. Endocrinology. 2014;155:3484–3492. doi: 10.1210/en.2014-1175. [DOI] [PubMed] [Google Scholar]
- Lafontan M, Berlan M. Fat cell adrenergic receptors and the control of white and brown fat cell function. J Lipid Res. 1993;34:1057–1091. [PubMed] [Google Scholar]
- Liu A, Pasquali M. Acidified acetonitrile and methanol extractions for quantitative analysis of acylcarnitines in plasma by stable isotope dilution tandem mass spectrometry. J Chromatogr B Analyt Technol Biomed Life Sci. 2005;827:193–198. doi: 10.1016/j.jchromb.2005.09.004. [DOI] [PubMed] [Google Scholar]
- Longo N, di San Filippo CA, Pasquali M. DISORDERS OF CARNITINE TRANSPORT AND THE CARNITINE CYCLE. American journal of medical genetics. Part C, Seminars in medical genetics. 2006;142C:77–85. doi: 10.1002/ajmg.c.30087. [DOI] [PMC free article] [PubMed] [Google Scholar]
- Louet JF, Hayhurst G, Gonzalez FJ, Girard J, Decaux JF. The coactivator PGC-1 is involved in the regulation of the liver carnitine palmitoyltransferase I gene expression by cAMP in combination with HNF4 alpha and cAMP-response element-binding protein (CREB) J Biol Chem. 2002;277:37991–38000. doi: 10.1074/jbc.M205087200. [DOI] [PubMed] [Google Scholar]
- Lowell BB, V SS, Hamann A, Lawitts JA, Himms-Hagen J, Boyer BB, Kozak LP, Flier JS. Development of obesity in transgenic mice after genetic ablation of brown adipose tissue. Nature. 1993;366:740–742. doi: 10.1038/366740a0. [DOI] [PubMed] [Google Scholar]
- Mai M, Tonjes A, Kovacs P, Stumvoll M, Fiedler GM, Leichtle AB. Serum levels of acylcarnitines are altered in prediabetic conditions. PLoS One. 2013;8:e82459. doi: 10.1371/journal.pone.0082459. [DOI] [PMC free article] [PubMed] [Google Scholar]
- Martinez-Jimenez CP, Kyrmizi I, Cardot P, Gonzalez FJ, Talianidis I. Hepatocyte Nuclear Factor 4α Coordinates a Transcription Factor Network Regulating Hepatic Fatty Acid Metabolism. Molecular and Cellular Biology. 2010;30:565–577. doi: 10.1128/MCB.00927-09. [DOI] [PMC free article] [PubMed] [Google Scholar]
- Mayer N, Schweiger M, Romauch M, Grabner GF, Eichmann TO, Fuchs E, Ivkovic J, Heier C, Mrak I, Lass A, et al. Development of small-molecule inhibitors targeting adipose triglyceride lipase. Nature chemical biology. 2013;9:785–787. doi: 10.1038/nchembio.1359. [DOI] [PMC free article] [PubMed] [Google Scholar]
- McCoin CS, Knotts TA, Adams SH. Acylcarnitines--old actors auditioning for new roles in metabolic physiology. Nat Rev Endocrinol. 2015;11:617–625. doi: 10.1038/nrendo.2015.129. [DOI] [PMC free article] [PubMed] [Google Scholar]
- McGarry JD, Sen A, Esser V, Woeltje KF, Weis B, Foster DW. New insights into the mitochondrial carnitine palmitoyltransferase enzyme system. Biochimie. 1991;73:77–84. doi: 10.1016/0300-9084(91)90078-f. [DOI] [PubMed] [Google Scholar]
- Mu X, Español-Suñer R, Mederacke I, Affò S, Manco R, Sempoux C, Lemaigre FP, Adili A, Yuan D, Weber A, et al. Hepatocellular carcinoma originates from hepatocytes and not from the progenitor/biliary compartment. The Journal of Clinical Investigation. 2015;125:3891–3903. doi: 10.1172/JCI77995. [DOI] [PMC free article] [PubMed] [Google Scholar]
- Orava J, Nuutila P, Lidell ME, Oikonen V, Noponen T, Viljanen T, Scheinin M, Taittonen M, Niemi T, Enerback S, et al. Different metabolic responses of human brown adipose tissue to activation by cold and insulin. Cell Metab. 2011;14:272–279. doi: 10.1016/j.cmet.2011.06.012. [DOI] [PubMed] [Google Scholar]
- Pandey MK, Belanger AP, Wang S, DeGrado TR. Structure Dependence of Long-Chain [(18)F]Fluorothia Fatty Acids as Myocardial Fatty Acid Oxidation Probes. Journal of medicinal chemistry. 2012;55:10674–10684. doi: 10.1021/jm301345v. [DOI] [PMC free article] [PubMed] [Google Scholar]
- Ramsay RR, Gandour RD, van der Leij FR. Molecular enzymology of carnitine transfer and transport. Biochim Biophys Acta. 2001;1546:21–43. doi: 10.1016/s0167-4838(01)00147-9. [DOI] [PubMed] [Google Scholar]
- Rhee J, Ge H, Yang W, Fan M, Handschin C, Cooper M, Lin J, Li C, Spiegelman BM. Partnership of PGC-1alpha and HNF4alpha in the regulation of lipoprotein metabolism. J Biol Chem. 2006;281:14683–14690. doi: 10.1074/jbc.M512636200. [DOI] [PubMed] [Google Scholar]
- Rhee J, Inoue Y, Yoon JC, Puigserver P, Fan M, Gonzalez FJ, Spiegelman BM. Regulation of hepatic fasting response by PPARgamma coactivator-1alpha (PGC-1): requirement for hepatocyte nuclear factor 4alpha in gluconeogenesis. Proceedings of the National Academy of Sciences of the United States of America. 2003;100:4012–4017. doi: 10.1073/pnas.0730870100. [DOI] [PMC free article] [PubMed] [Google Scholar]
- Riches AC, Sharp JG, Thomas DB, Smith SV. Blood volume determination in the mouse. The Journal of Physiology. 1973;228:279–284. doi: 10.1113/jphysiol.1973.sp010086. [DOI] [PMC free article] [PubMed] [Google Scholar]
- Rodriguez-Cuenca S, Monjo M, Frontera M, Gianotti M, Proenza AM, Roca P. Sex steroid receptor expression profile in brown adipose tissue. Effects of hormonal status. Cell Physiol Biochem. 2007;20:877–886. doi: 10.1159/000110448. [DOI] [PubMed] [Google Scholar]
- Saggerson ED, Carpenter CA. Sensitivity of brown-adipose-tissue carnitine palmitoyltransferase to inhibition by malonyl-CoA. Biochem J. 1982;204:373–375. doi: 10.1042/bj2040373. [DOI] [PMC free article] [PubMed] [Google Scholar]
- Schauer IE, Reusch JEB. Non-esterified fatty acid exposure activates protective and mitogenic pathways in vascular smooth muscle cells by alternate signaling pathways. Metabolism: clinical and experimental. 2009;58:319–327. doi: 10.1016/j.metabol.2008.10.003. [DOI] [PMC free article] [PubMed] [Google Scholar]
- Schoiswohl G, Stefanovic-Racic M, Menke MN, Wills RC, Surlow BA, Basantani MK, Sitnick MT, Cai L, Yazbeck CF, Stolz DB, et al. Impact of Reduced ATGL-Mediated Adipocyte Lipolysis on Obesity-Associated Insulin Resistance and Inflammation in Male Mice. Endocrinology. 2015;156:3610–3624. doi: 10.1210/en.2015-1322. [DOI] [PMC free article] [PubMed] [Google Scholar]
- Schooneman MG, Vaz FM, Houten SM, Soeters MR. Acylcarnitines: reflecting or inflicting insulin resistance? Diabetes. 2013;62:1–8. doi: 10.2337/db12-0466. [DOI] [PMC free article] [PubMed] [Google Scholar]
- Seale P, Kajimura S, Spiegelman BM. Transcriptional control of brown adipocyte development and physiological function--of mice and men. Genes Dev. 2009;23:788–797. doi: 10.1101/gad.1779209. [DOI] [PMC free article] [PubMed] [Google Scholar]
- Sellayah D, Sikder D. Orexin restores aging-related brown adipose tissue dysfunction in male mice. Endocrinology. 2014;155:485–501. doi: 10.1210/en.2013-1629. [DOI] [PubMed] [Google Scholar]
- Severgnini M, Sherman J, Sehgal A, Jayaprakash NK, Aubin J, Wang G, Zhang L, Peng CG, Yucius K, Butler J, et al. A rapid two-step method for isolation of functional primary mouse hepatocytes: cell characterization and asialoglycoprotein receptor based assay development. Cytotechnology. 2012;64:187–195. doi: 10.1007/s10616-011-9407-0. [DOI] [PMC free article] [PubMed] [Google Scholar]
- Shekhawat PS, Matern D, Strauss AW. Fetal fatty acid oxidation disorders, their effect on maternal health and neonatal outcome: impact of expanded newborn screening on their diagnosis and management. Pediatr Res. 2005;57:78R–86R. doi: 10.1203/01.PDR.0000159631.63843.3E. [DOI] [PMC free article] [PubMed] [Google Scholar]
- Song S, Attia RR, Connaughton S, Niesen MI, Ness GC, Elam MB, Hori RT, Cook GA, Park EA. Peroxisome proliferator activated receptor alpha (PPARalpha) and PPAR gamma coactivator (PGC-1alpha) induce carnitine palmitoyltransferase IA (CPT-1A) via independent gene elements. Mol Cell Endocrinol. 2010;325:54–63. doi: 10.1016/j.mce.2010.05.019. [DOI] [PMC free article] [PubMed] [Google Scholar]
- Tamai I, Ohashi R, Nezu J, Yabuuchi H, Oku A, Shimane M, Sai Y, Tsuji A. Molecular and functional identification of sodium ion-dependent, high affinity human carnitine transporter OCTN2. The Journal of biological chemistry. 1998;273:20378–20382. doi: 10.1074/jbc.273.32.20378. [DOI] [PubMed] [Google Scholar]
- Tusher VG, Tibshirani R, Chu G. Significance analysis of microarrays applied to the ionizing radiation response. Proc Natl Acad Sci U S A. 2001;98:5116–5121. doi: 10.1073/pnas.091062498. [DOI] [PMC free article] [PubMed] [Google Scholar]
- Vila-Brau A, De Sousa-Coelho AL, Goncalves JF, Haro D, Marrero PF. Fsp27/CIDEC is a CREB target gene induced during early fasting in liver and regulated by FA oxidation rate. J Lipid Res. 2013;54:592–601. doi: 10.1194/jlr.M028472. [DOI] [PMC free article] [PubMed] [Google Scholar]
- Walesky C, Edwards G, Borude P, Gunewardena S, O’Neil M, Yoo B, Apte U. Hepatocyte Nuclear Factor 4 alpha Deletion Promotes Diethylnitrosamine-induced Hepatocellular Carcinoma in Mice. Hepatology (Baltimore, Md.) 2013;57:2480–2490. doi: 10.1002/hep.26251. [DOI] [PMC free article] [PubMed] [Google Scholar]
- Wu Q, Kazantzis M, Doege H, Ortegon AM, Tsang B, Falcon A, Stahl A. Fatty acid transport protein 1 is required for nonshivering thermogenesis in brown adipose tissue. Diabetes. 2006;55:3229–3237. doi: 10.2337/db06-0749. [DOI] [PubMed] [Google Scholar]
- Xia J, Sinelnikov IV, Han B, Wishart DS. MetaboAnalyst 3.0--making metabolomics more meaningful. Nucleic Acids Res. 2015;43:W251–257. doi: 10.1093/nar/gkv380. [DOI] [PMC free article] [PubMed] [Google Scholar]
- Yamagata K, Furuta H, Oda N, Kaisaki PJ, Menzel S, Cox NJ, Fajans SS, Signorini S, Stoffel M, Bell GI. Mutations in the hepatocyte nuclear factor-4alpha gene in maturity-onset diabetes of the young (MODY1) Nature. 1996;384:458–460. doi: 10.1038/384458a0. [DOI] [PubMed] [Google Scholar]
- Yamaguti K, Kuratsune H, Watanabe Y, Takahashi M, Nakamoto I, Machii T, Jacobsson G, Onoe H, Matsumura K, Valind S, et al. Acylcarnitine metabolism during fasting and after refeeding. Biochem Biophys Res Commun. 1996;225:740–746. doi: 10.1006/bbrc.1996.1244. [DOI] [PubMed] [Google Scholar]
- Yoneshiro T, Aita S, Matsushita M, Okamatsu-Ogura Y, Kameya T, Kawai Y, Miyagawa M, Tsujisaki M, Saito M. Age-related decrease in cold-activated brown adipose tissue and accumulation of body fat in healthy humans. Obesity (Silver Spring) 2011;19:1755–1760. doi: 10.1038/oby.2011.125. [DOI] [PubMed] [Google Scholar]
- Yu XX, Lewin DA, Forrest W, Adams SH. Cold elicits the simultaneous induction of fatty acid synthesis and beta-oxidation in murine brown adipose tissue: prediction from differential gene expression and confirmation in vivo. FASEB J. 2002;16:155–168. doi: 10.1096/fj.01-0568com. [DOI] [PubMed] [Google Scholar]
- Yuan X, Ta TC, Lin M, Evans JR, Dong Y, Bolotin E, Sherman MA, Forman BM, Sladek FM. Identification of an endogenous ligand bound to a native orphan nuclear receptor. PLoS One. 2009;4:e5609. doi: 10.1371/journal.pone.0005609. [DOI] [PMC free article] [PubMed] [Google Scholar]
Associated Data
This section collects any data citations, data availability statements, or supplementary materials included in this article.