

SUMMARY
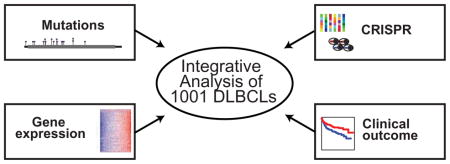
Diffuse large B cell lymphoma (DLBCL) is the most common form of blood cancer and is characterized by a striking degree of genetic and clinical heterogeneity. This heterogeneity poses a major barrier to understanding the genetic basis of the disease and its response to therapy. Here, we performed an integrative analysis of whole exome sequencing and transcriptome sequencing in a cohort of 1001 DLBCL patients to comprehensively define the landscape of 150 genetic drivers of the disease. We characterized the functional impact of these genes using an unbiased CRISPR screen of DLBCL cell lines to define oncogenes that promote cell growth. A prognostic model comprising these genetic alterations outperformed current established methods: cell of origin, the International Prognostic Index comprising clinical variables, and dual MYC and BCL2 expression. These results comprehensively define the genetic drivers and their functional roles in DLBCL to identify new therapeutic opportunities in the disease.
Keywords: exome sequencing, genetic mutations, diffuse large B cell lymphoma, DLBCL, TCGA, The Cancer Genome Atlas
eTOC Blurb
An integrative analysis in 1001 newly-diagnosed DLBCL patients identifies 150 genetic drivers with functional characterization using an unbiased CRISPR screen in DLBCL cell lines, and connects with clinical outcome.
INTRODUCTION
Diffuse large B cell lymphoma (DLBCL) is the most common hematologic malignancy, with an annual incidence of over 100,000 cases worldwide. Although more than half of these patients may achieve long-term remission, the majority of the remaining patients succumb to DLBCL. Application of next generation sequencing has revealed a striking degree of molecular and clinical heterogeneity in DLBCL (Zhang et al., 2013).
The heterogeneity of DLBCL has imposed several major limitations on previous genetic studies (Lohr et al., 2012; Morin et al., 2011; Pasqualucci et al., 2011; Zhang et al., 2013). First, sample-size limitations of earlier studies have hampered the discovery of low-frequency, but pathogenetically important mutations. Systematic pan-cancer analysis has indicated that 400 tumor-normal DLBCL pairs would be needed to comprehensively discover all the genes mutated at a frequency of 5% or higher with greater than 90% power (Lawrence et al., 2014). Second, defining the link between genetic mutations and clinical outcome has been challenging. Third, even as the genetic alterations are being defined, the functional impact of these mutations and their role in promoting the growth of lymphoma cells remains unclear, even though these are critical considerations for exploring therapeutics.
In this study, we sought to comprehensively define the genetic drivers of DLBCL and their association with functional and clinical outcomes through whole exome and transcriptome sequencing of tumors from 1001 newly diagnosed patients treated uniformly with rituximab-containing regimens. We further characterized the downstream functional impact of genes using an unbiased CRISPR screen in DLBCL cell lines.
RESULTS
Discovery of genetic drivers in DLBCL
We started with a discovery phase of identifying genes mutated in DLBCL through whole exome sequencing of 1001 DLBCL and 400 paired germline DNAs. The clinical characteristics of these patients are described fully in Table S1. The sample size of 400 tumor-normal pairs provided nearly 100% power for the discovery of genes mutated in 10% of patients and over 90% power to detect genes mutated in 5% of DLBCL patients (Lawrence et al., 2014). To increase the sensitivity and robustness of our discovery of driver gene mutations, we added 102 previously described tumor-germline pairs (Lohr et al., 2012; Morin et al., 2011; Pasqualucci et al., 2011; Zhang et al., 2013) to our set of 400 paired cases. These 502 paired tumor-germline cases represented a primary discovery set for identifying genetic drivers in DLBCL with the remaining cases serving as a validation set to ensure the reproducibility of the findings and to characterize the frequency of genetic events and clinical associations in these driver genes. In addition to single nucleotide variants (SNVs) and insertions/deletions (indels), we also characterized copy number alterations from whole exome sequencing data (Magi et al., 2013). A comprehensive exome sequencing quality summary is presented in STAR methods, Table S1 and Figure S1–S2. We verified the accuracy of our variant identification through Sanger sequencing of 1130 events, representing 61 genes with 90% concordance (Table S1).
The distribution of somatic alterations in tumor-normal pairs were used to identify (Lawrence et al., 2013) 150 putative driver genes that were recurrently mutated in DLBCL. We then defined genetic alterations for all 1001 DLBCLs corresponding to these 150 genes, identifying variants that meet the criteria for driver mutations as described (Lawrence et al., 2013; Papaemmanuil et al., 2016). The mean number of mutations per DLBCL case was 7.75. The individual variants identified by patient are listed in Table S1, with copy number and gene-level alterations summarized in Table S1.
The top 60 most frequently mutated genes are shown in the mutational heatmap in Figure 1A. Genes frequently exhibited a pattern of either predominant missense and/or copy number gains consistent with an oncogene (e.g. BCL2, CARD11, and IRF4), or truncating mutations and/or copy number losses consistent with a tumor suppressor gene (e.g. SPEN, CDKN2A, and TNFAIP3).
Figure 1. The landscape of genetic drivers in 1001 DLBCLs.

A. The mutational heatmap indicates the most recurrently altered genes in 1001 DLBCL cases with frequency >5%, color-coded by four genetic alteration types: missense mutation (yellow), copy number gain (red), truncating mutation (green), and copy number loss (blue). To the right of the mutational heatmap, the stacked bargraph indicates the gene-level alteration type breakdown using the same four-color scheme.
B. Clinical features of the corresponding 1001 patients are indicated below the mutational heatmap, including the International Prognostic Index (IPI) score, response to therapy (complete response or not), activated B cell-like (ABC) vs. germinal center B cell-like (GCB) DLBCL subtype, and gender.
Figure 1B summarizes the International Prognostic Index (IPI) (Shipp, 1993) score, initial response to therapy (complete response or not), and the cell of origin subsets of DLBCL, activated B cell-like (ABC) and germinal center B cell-like (GCB) DLBCL. When the cases were ordered in descending order by gene mutation frequency, there were no obvious patterns detectable in the corresponding clinical data. The large sample size in our study enabled not only the identification of driver genes in DLBCLs, but also provided clarity on the types of mutations in known driver genes.
Cell of origin effects in DLBCL
We defined the lineage-based subgroups of DLBCL using RNAseq to generate expression data in 775 patients for whom adequate material was available. Using gene expression to distinguish cell of origin (Wright et al., 2003), we identified 313 ABC DLBCLs and 331 GCB DLBCLs, while the rest were unclassified DLBCLs (Figure 2A, Table S2).
Figure 2. ABC/GCB based classification of DLBCL.

A. RNAseq gene expression classifier distinguishes Germinal Center B cell-like DLBCL (GCB), Unclassified DLBCL (UC), Activated B cell-like DLBCL (ABC).
B. Comparison of RNAseq subtype score vs. the NanoString linear predictor score (top) using (Pearson’s correlation R2=0.87, p<10−6) and by immunohistochemistry Hans GCB vs. Non-GCB classification (Wilcoxon test p<10−6) (bottom).
C. Genetic alterations that are enriched in ABC vs. GCB DLBCL (Fisher’s test FDR<0.1).
D. Network of genes with statistically significant (p<0.01) overlap or co-occurrence (red edges) and mutational exclusion (blue edges). Stronger associations are indicated with thicker and darker colored lines between nodes (p<0.001). Genes significantly enriched in GCB or ABC DLBCL are colored in green and orange respectively, or grey otherwise.
See also Table S2.
We validated the efficacy of the RNAseq-based classifier through two complementary approaches. First, we performed Nanostring assays (Scott et al., 2014) in 200 of these cases to determine cell of origin. We found excellent agreement between the expression data and the cell of origin calls generated by RNAseq and Nanostring (Figure 2B, top panel, R2=0.87, p<10−6). We also compared the RNAseq classifier with the immunohistochemistry-based Hans algorithm (Hans et al., 2004) commonly used to distinguish cell of origin. In 654 cases (Figure 2B, bottom panel, p<10−6) that we tested using immunohistochemistry for IRF4, BCL6 and CD10, we found that the RNAseq classifier score was significantly different between the two Hans algorithm classes. As expected, ABC DLBCLs had worse overall survival compared to GCB DLBCLs in our study (P=0.002, log-rank test). These data indicate that RNAseq can be reliably used to distinguish the DLBCL cell of origin subsets.
The connectivity of DLBCL driver genes
We further examined the differences in mutational frequencies among the ABC and GCB DLBCL subgroups. We found that these two subgroups shared the vast majority of driver genes at statistically indistinguishable frequencies. However, 20 genes were differentially mutated among the two groups (Figure 2C, Table S2) including EZH2, SGK1, GNA13, SOCS1, STAT6 and TNFRSF14 which were more frequently mutated in GCB DLBCLs, while ETV6, MYD88, PIM1 and TBL1XR1 were more frequently mutated in ABC DLBCLs.
We examined pairwise overlaps using Fisher’s test and mutual exclusion (Leiserson et al., 2016) among the 150 DLBCL driver genes. 61 genes had statistically significant relationships with other driver genes (p<0.01, Table S2), depicted in the network in Figure 2D. We noted a number of interesting features, including subnetworks associated with COO in DLBCL that generally exhibited mutually exclusive mutation patterns, as well as a larger network of genes shared between the subgroups. For instance, MLL2 mutations occurred in a largely exclusive fashion with MYC, while TP53 mutations occurred in a mutually exclusive fashion with KLHL6, implicating biologically relevant models for DLBCL.
Functional genomics through CRISPR Screening
CRISPR screening has emerged as a powerful method for identifying critical functional dependencies in vitro (Koike-Yusa et al., 2014; Shalem et al., 2014). We selected a total of six cell lines including three ABC DLBCLs (LY3, TMD8 and HBL1), two GCB DLBCLs (SUDHL4 and Pfeiffer) and one Burkitt lymphoma cell line (BJAB) that phenotypically resembles GCB DLBCLs.
We utilized the GeCKO v2 genome-wide human single guide (sgRNA) library (Shalem et al., 2014) containing over 120,000 sgRNAs targeting 19,050 protein coding genes to transduce three replicate populations from each cell line with the complete sgRNA library. The schematic for our CRISPR screen is shown in Figure 3A. Each gene was targeted by six distinct sgRNAs in Cas9 expressing DLBCL cells with cell growth allowed to proceed for 14 population doublings. At the end of these experiments, we expected that cells expressing sgRNAs that target oncogenes promoting cell growth and proliferation would be selectively depleted from the cell population, whereas cells expressing sgRNAs that target tumor suppressor genes inhibiting cell growth and proliferation would be selectively enriched in the cell population.
Figure 3. Defining the functional role of genetic drivers through CRISPR screen.

A. Schematic of CRISPR screen performed for six cell lines in triplicate.
B. A ranked list of CRISPR scores for the 19,032 genes targeted in the screen. Illustrative driver genes are shown in blue (likely oncogenes) or red (likely tumor suppressor genes).
C. CRISPR scores for 35 DLBCL oncogenes are shown alongside the frequency of genetic alterations and functional group.
We sequenced replicate populations at two time points (Figure 3A; Early: after transduction, Late: after 14 population doublings) to observe changes in sgRNA frequency over time. The resulting changes were then used to infer the magnitude and directionality of fitness effects associated with targeted gene knockout in DLBCL cell lines, with the ultimate goal of broadly identifying genes essential to the development and/or maintenance of DLBCL. High throughput sequencing of sgRNA libraries amplified from plasmid sequences was used to determine sgRNA abundance for populations at each time-point. Summary statistics of sgRNA sequencing library quality are detailed in the STAR Methods and Figure S3.
We identified 1956 “essential genes” whose silencing resulted in significantly decreased cell fitness in at least one cell line (see Table S3 for exhaustive list). We ranked all the genes based on their CRISPR score, a measure of the degree of alteration in each gene as a function of altered abundance of the guide RNAs targeting that gene (Figure 3B). We found that the genetic drivers identified through whole exome sequencing were disproportionately at the extremes of the distribution (p=3×10⁻⁵). The genes that were depleted in the screen and therefore implicated as oncogenes critical to cell-growth across the majority of DLBCLs included MYC, RHOA, SF3B1, MTOR, and BCL2. Among genes that were enriched in the screen and therefore implicated functionally as tumor suppressor genes, we noted TP53, MGA, PTEN and NCOR1. Separately, we examined the association of genomic copy number and the guide RNAs that were significantly altered in our screen (Figure S3) to rule out copy number alterations as a source of artefactual results (Aguirre et al., 2016). None of the essential driver genes were found within genomic regions identified by our analysis as potentially influenced by copy number amplification. Thus, we concluded that the decreased fitness resulting from essential driver gene knockout reflects the functional importance of these genes in the context of DLBCL.
In all, there were 35 driver genes whose knockout resulted in decreased viability of DLBCL cells, identifying them as functional oncogenes (Figure 3C). Nine of these driver genes were found to be important in a subtype-specific fashion. Knockout of EBF1, IRF4, CARD11, MYD88 and IKBKB was selectively lethal in ABC DLBCL whereas knockout of ZBTB7A, XPO1, TGFBR2 and PTPN6 was selectively lethal in GCB DLBCL. These data provide critical clues to the functional dependence of DLBCL on particular oncogenes and suggest that small molecule inhibitors of these oncogenes may provide therapeutic benefit in affected DLBCL patients. All of these genes were well-expressed in DLBCLs. Of the 35 CRISPR driver gene hits, 9 genes are direct targets of the therapeutic drug targets either in human clinical trials or already in use for another indication. Importantly, 36% of the DLBCL patients have genetic alterations in these 9 drug targets and would potentially benefit from targeted therapy.
Gene set enrichment analysis of the significant driver genes (Table S3) identified four functional groups, including Signaling (e.g. MTOR, PIK3R1, PIM2, BTK), Cell growth (e.g. MYC, CHD8, BCL2), B cell development (e.g. EBF1, IRF4, PAX5, POU2F2, YY1), and Transcription/Translation (e.g. SF3B1, XPO1, HIST1H1E). Importantly, we observed that the lethal effects of knocking down these genes were not limited to cell lines that harbored alterations in these genes, suggesting that these driver genes represent favored pathways for promoting proliferation in DLBCL.
Gene expression signature associations with genetic alterations and outcome
Gene expression profiling has long been used to define subtypes and understand the heterogeneity within DLBCL. Microarray-based gene expression studies have identified cell of origin subgroups (Alizadeh et al., 2000), as well as gene expression signatures derived from host inflammatory response (Monti et al., 2005), stromal tissues (Lenz et al., 2008) as well as other biological processes. However, the connections between these gene expression signatures and genetic alterations is largely unknown.
We first sought to comprehensively define the relevant gene expression signatures across our DLBCL cohort by performing RNA sequencing on all tumors for which RNA was available (N=775). From these cases, we defined a core set of 625 samples (STAR Methods) for integrative analysis.
Figure 4A provides an overview of the integrative expression analysis. We began the analysis with a comprehensive universe of nearly 9500 annotated gene sets from widely used gene set databases (Kegg, Reactome, MSigDB), as well as several lymphoma-specific gene signature sources (Lenz et al. 2008, Monti et al. 2005, and Shaffer et al.). We first identified annotated gene sets that showed a pattern of high correlation among the constituent genes in our dataset, indicating that these gene sets represented processes that are co-regulated, as well as variable, across DLBCL tumors. We found that 1228 gene sets exhibited such patterns of co-regulation. In addition to the observed high correlation among their constituent genes, the vast majority of these 1228 gene sets were strongly correlated with each other. The high inter-gene set correlation indicated a high degree of redundancy between these gene sets, likely reflecting their origin from shared biological processes. To reduce this observed redundancy and focus on distinct gene expression sets that described the underlying biology, we applied affinity propagation clustering (Frey and Dueck, 2007) to define the exemplars that essentially replicated the patterns of the members of the cluster. Application of affinity propagation clustering resulted in 31 unique clusters with cluster assignments for all gene sets. This analysis identified 31 non redundant gene clusters that each comprised highly correlated gene sets (Table S4), as well as exemplar gene sets which represents each cluster (Figure 4B). Our results recapitulated a number of described patterns underlying DLBCL gene expression. The cell of origin-derived ABC-high and GCB-high signatures were generally expressed in a mutually exclusive fashion. In addition, the signature clustering analysis also revealed two broad classes of gene sets. The first class included signatures representing many immune cell types (regulatory T cells, myeloid cells, NK cells) and stromal connective tissue (epithelial and endothelial cells). This group included the Monti Host Response signature (Monti et al., 2005), as well as the Lenz Stromal 1 and Stromal 2 signatures (Lenz et al., 2008). The second class included signatures related to tumor cell processes including proliferation, transcription, translation, DNA replication, cell cycle, as well as the Monti BCR and Oxidative Phosphorylation signatures (Monti et al., 2005).
Figure 4. Integrative analysis of gene expression, genetic alterations and outcome.

A. Schematic depicting the integrative analysis.
B. Heatmap of expression of significantly correlated geneset exemplars across DLBCL samples (N=625).
C. Heatmap of fold-change associations of significant genetic alterations with genesets exemplars. Fold-changes for significant associations (ANOVA test p<0.05) are shown in yellow-purple color scales, while insignificant associations are colored grey.
D. (Left) Enrichment of CRISPR hits within the cluster exemplar gene sets (Fisher’s test p<0.05). (Right) Survival association with cluster exemplar signature (logrank test, p<0.05).
See also Table S4.
For each of these gene set exemplars, we identified the genetic alterations associated with high and low expression. Figure 4C shows a heatmap of signatures vs. mutated genes (mutations and copy number alterations). These associations demonstrate a number of interesting patterns including the association of RHOA and MYC with proliferation-related signatures. The expression of many signaling pathways such as PI3 kinase did not reliably associate with specific mutations in PIK3R1, PIK3CD or PTEN suggesting that expression patterns from non-malignant cells may confound the effective measurement of these associations. There was no association between the expression of stromal signatures and overall mutational burden (p=0.4).
We further investigated the relationship of our CRISPR hits and these gene sets. We found that gene sets related to cancer-related processes (e.g. oxidative phosphorylation, DNA replication, cell cycle progression, RNA processing) demonstrated significant enrichment of the CRISPR identified driver genes. Strikingly, no enrichment of CRISPR hits were found in the immune and stromal gene sets. Finally, we tested each of the cluster exemplar signatures for associations with overall patient-survival. Figure 4D annotates the significant associations for all gene expression clusters. As expected, the GCB DLBCL signature was associated with better overall survival. Interestingly, the signatures in the stromal and immune response group (e.g. Regulatory T Cells) tended to associate with better survival, while the signatures in the proliferation and B cell group tended to associate with worse survival (e.g. MYC/Nucleotide Biosynthesis). The complete list of associations is listed in Table S4.
Clinical characteristics of DLBCL driver genes
Overall survival following diagnosis and initial treatment is shown in Figure 5A. The clinical risk groups of the international prognostic index (IPI) was highly prognostic in our patients (p<10−6), with clear distinctions in survival for the low, intermediate and high risk groups. The cell of origin distinction was found to be prognostic in our data (Figure 5A).
Figure 5. Genomic risk model stratifies DLBCL survival.

A. Overall survival of 1001 DLBCL cases, cases stratified by IPI groups, ABC/GCB DLBCL, MYC & BCL2 expression.
B. Hazard ratios and 95% confidence intervals of selected survival-associated genetic alterations (p<0.05).
C. Schematic depicting multivariate survival modeling.
D. Combinations of genetic and expression features that comprise the genomic risk model in DLBCL patients.
E. Survival of the predicted risk groups in the test set (logrank test, p=8×10⁻⁵).
F. Cross validation performance of the genomic risk model compared to that with only genetic alterations (DNA-only), and gene expression (RNA-only).
G. The genomic risk model significantly stratifies survival within known risk groups (logrank test)
High expression of MYC and BCL2 has been associated with worse prognosis (Green et al., 2012; Johnson et al., 2012). High expressors were defined from RNAseq data as MYC-high and BCL2-high and were significantly associated with survival (Figure S4). Double expressors were defined as samples that have both high expression of MYC and high expression of BCL2 (Figure 5A). We assessed the independence of ABC/GCB subgrouping and double expressors (high MYC and BCL2) and found that ABC/GCB status does not further stratify the double expressors (Figure S4).
We separately examined the association of translocations in MYC and BCL2 with mutations and expression by performing fluorescent in situ hybridization (FISH) using both genes to define translocations involving the immunoglobulin locus and MYC and BCL2 (performed separately). MYC translocations are associated with mutations and high expression of MYC, while translocations in BCL2 were associated with mutations and amplifications (Figure S4).
The potential association of mutations with clinical outcome has largely been unexplored. We first examined the association of specific mutations and survival among all DLBCLs. We found that MYC mutations were strongly associated with poorer survival, as were mutations in CD79B and ZFAT. Mutations in NF1 and SGK1 were associated with more favorable survival. We further examined the association of different mutations and survival within ABC and GCB DLBCL. Genetic alterations in KLHL14, BTG1, PAX5 and CDKN2A were associated with significantly poorer survival in ABC DLBCL. Alterations in CREBBP was associated with favorable survival in ABC DLBCLs. In the GCB DLBCL group, genetic alterations in NFKBIA, NCOR1 were associated with poorer prognosis while alterations in EZH2, MYD88, and ARID5B were all associated with significantly better prognosis (Figure 5B). The complete list of genes associated with survival is in the Table S5.
We have developed an interactive webtool (dlbcl.davelab.org) for survival analysis using clinical and genomic features. Our large dataset provided the opportunity to directly examine the combinatorial and potential confounding effects of MYC, BCL2, and cell of origin, along with other genetic alterations.
We developed a multivariate supervised learning approach for defining the association of survival with combinations of genetic markers (150 genetic driver genes) and gene expression markers (cell of origin, MYC, and BCL2). Our method is summarized in Figure 5C and STAR methods. We first enumerated all 313 possible combinations, that involved up to 3 separate genetic and gene expression markers and affected a minimum of 20 patients, as inputs for predictive model for survival (Zou and Hastie, 2005).
The individual components of the model are depicted in descending order of their association with poor survival in Figure 5D. MYC genetic alterations combined with MYC expression defined the subset with the least favorable prognosis in DLBCLs, while GCB DLBCLs with CD70 alterations had the most favorable prognosis. Each component in the model was defined so as to be prognostically independent from all others to collectively identify subgroups that cover the entire set of DLBCL cases. These features were combined into a Cox proportional hazards model to generate a prediction score, and the DLBCL cases were divided into three subgroups based on their predicted risk. The full list of these combinatorial features along with sample-level information and model coefficients is provided in Table S5.
We validated our predictive modeling approach using an independent test set (20% of the data). The genomic model was highly significant in distinguishing patients with high vs. low risk of death in the test set (p=8×10⁻⁵; Figure 5E; Table S5). In addition, we also used 5 fold cross-validation repeated 100 times to gain a robust estimation of model performance, finding it was highly statistically significant in distinguishing the survival groups (median logrank p=8×10⁻⁶). The integrative model strongly outperformed the other models based on genetic alterations (“DNA only”) or expression (“RNA only”) alone (Figure 5F). The genomic risk model, which used combinatorial features, also strongly outperformed a model with the same input features (DNA+RNA), but with no combinations used (Figure S5), underscoring the importance of examining interactions between different genomic features for evaluating a patient’s risk.
We further examined the performance of the genomic model in the known risk groups that are known to influence survival: cell of origin, double expression of MYC and BCL2, and IPI. Our genomic model was able to discern patients with significantly distinct outcomes within each group (Figure 5G, p<10−3 in all cases). These data indicate that our genomic predictor provides robust prognostic information that is not currently captured by widely used clinical and expression-based models.
Comparison of clinical vs. genomic risk
The hazard ratios of the different survival models in DLBCL are compared in Figure 6A for cell of origin, MYC and BCL2 separately and together, as well as the clinical risk (IPI) and genomic risk models. The genomic risk model outperformed all of these existing risk predictors in DLBCL. Next, we examined the time-dependent effects of the genomic model and IPI for DLBCL patients who survived for at least one, three or five years (Figure 6B). We found that the while IPI was highly prognostic in early years, its effect waned as a function of time. In contrast, the genomic risk model had significant prognostic value for predicting longer term mortality. These data indicate that the effects of IPI are strongest in predicting early mortality, whereas genomic risk is effective in predicting both early and late mortality.
Figure 6. Comparison of clinical risk model (IPI) with genomic risk model.

A. Comparison of hazard ratios (high vs. low risk groups) and 95% confidence intervals for various DLBCL risk models, including our genomic risk model.
B. The matrix of Kaplan-Meier survival plots indicates risk stratification by clinical risk model (IPI) vs. genomic risk model for all patients and patients stratified by minimum overall survival of 1, 3, and 5 years (logrank test).
C. Survival plot for response to initial therapy (logrank test, p<10−6).
D. Prediction of response to initial therapy using clinical risk model (left) and genomic risk model (right) (chi-squared test).
E. Survival plots showing the stratification of genomic and clinical risk models for each of the individual responses to therapy (logrank test).
We separately examined the survival effects of response to initial therapy. We found that response to initial therapy was significantly associated with survival, with median survival for complete responses being >12years, while the median survival for partial (2 years) and no responses (1 year) being drastically lower (Figure 6C). We also observed a pattern of continued mortality in patients achieving a complete remission, suggesting that for a large proportion of patients, achieving a complete remission does not necessarily indicate a cure. Both IPI and genomic risk models are significantly associated with response to initial therapy (Figure 6D), with IPI being more predictive. The genomic risk model has a higher percentage of high risk patients in the complete response group compared to IPI. We hypothesized that while the complete responders have a generally favorable prognosis as a group, this group still harbors a significant fraction of patients with early mortality that can be identified by the genomic risk model. To test our hypothesis, we examined survival for the predicted risk models stratified by clinical responses (Figure 6E). The genomic risk model was highly prognostic within each of the clinical response groups indicating that the genomic profile of a patient strongly influences their prognostic risk, regardless of their initial response to therapy.
DISCUSSION
The genetic heterogeneity of DLBCL has led to diverse approaches to classification and prognostication, and presented challenges in the development of effective new therapies. By enrolling 1001 DLBCL patients, we designed a study that is adequately powered to identify genetic drivers and their clinical significance. CRISPR screening provided a powerful approach to probing the functional role of the genetic drivers, identifying the driver genes that directly affect cell survival.
Of the 150 driver genes that we identified, 27 genes including SPEN, KLHL14 and MGA that have not been previously implicated in DLBCL to our knowledge. In addition, a number of genes such as CDKN2A and RB1 were thought to be altered in DLBCLs through copy number alterations were also revealed to be recurrent targets for function-altering mutations. While there is considerable interest in nominating genes for therapeutic targeting using mutational and ontology data, our data indicates a considerable need for caution. For instance, CRISPR-based knockout of several therapeutically targetable NOTCH2, PIK3CD and JAK2 did not have a significant impact in the growth of DLBCL cells. These findings suggest that such oncogenes may play a role in early pathogenesis or another cancer related function that may not be easy to target directly in DLBCL. On the other hand, functional screening established a role for a number of genetic drivers as potentially targetable genes in DLBCL.
Our study informs therapeutic development in several ways. First, our data provide a comprehensive approach to risk-stratification, distinguishing DLBCL patients who benefit from standard therapy from those who are expected to experience poor outcomes. Secondly, our data indicate that nearly 36% of DLBCL patients have a genetic alteration that may inform sensitivity to currently available therapies. Our genomic risk model can be applied clinically using existing assays, through the measurement of cell of origin, BCL2 and MYC expression and targeted sequencing of a panel of DLBCL driver genes. Our data also provide the context for understanding outcomes in clinical trials of targeted therapy. For instance, while MTOR mutations are prevalent in DLBCL, those patients tend to have generally good outcomes, especially in the GCB subtype. Since patients with relapsed DLBCL comprise the vast majority of patients who are enrolled in clinical trials, many such trials may be missing the DLBCL population that harbors the target (e.g. MTOR), but respond well to standard therapy, potentially contributing to a negative trial that fails to show efficacy of these agents. Finally, we anticipate that our work will provide a starting point for hypothesis-driven biological modeling of different gene combinations that contribute to poor risk DLBCLs to better understand their combined effects, and aid in developing new therapeutic approaches.
Genetic heterogeneity is a defining feature of DLBCL. Our study demonstrates the benefits of applying genomic methodologies to large, well-characterized cohorts of cancers to discern patterns that are not possible with smaller studies. Our approach has identified clinical and functional drivers of DLBCL that are prerequisites to improving outcomes in the disease.
STAR METHODS
CONTACT FOR REAGENT AND RESOURCE SHARING
Further information and requests for resources and reagents should be directed to and will be fulfilled by the Lead Contact, Sandeep Dave (sandeep.dave@duke.edu).
EXPERIMENTAL MODEL AND SUBJECT DETAILS
DLBCL patients
Diffuse Large B-Cell Lymphoma (DLBCL) tumors (N=1001) and paired-normal tissue (N=400), along with patient clinical information, were obtained from the institutions listed in the affiliations section. All cases were required to be de novo (i.e. not relapsed or transformed disease) and treated with a rituximab-containing standard regimen. All cases were reviewed by experienced hematopathologists. These cases were anonymized, shipped to Duke University, and processed in accordance with a protocol approved by the Institutional Review Board at Duke University. Clinical data including initial response to therapy, overall survival, gender, age, stage, performance status and number of extranodal sites were collected on nearly all cases.
Cell lines for CRISPR screening
OCI-LY3 were grown in RPMI 1640 (Gibco) with 20% HI-Fetal bovine serum and 1% Penicillin-Streptomycin (5,000 U/mL) (ThermoFisher). Pfeiffer, SU-DHL-4, BJAB, TMD8, and HBL-1 were grown in RPMI 1640 (Gibco) with 10% HI-Fetal bovine serum and 1% Penicillin-Streptomycin (5,000 U/mL) (ThermoFisher). All cell lines were grown at 37C. OCI-LY3, TMD8, SU-DHL-4, Pfeiffer, and HBL-1 are derived from males, and BJAB is derived from a female. Cell lines were authenticated through whole exome sequencing (Zhang et al., 2013).
METHOD DETAILS
Sample processing
Total RNA and DNA was extracted from samples using the AllPrep DNA/RNA FFPE kit (Qiagen, Cat. # 80234) per manufacturers guidelines. Briefly, paraffin was removed with Xylene, and the resulting tissue was washed once with 100% ethanol, and digested with PKD and proteinase K for 15 minutes at 56 C. The tissue was spun at full speed in a microcentrifuge, and the supernatant containing the RNA was bound to a column, washed with FRN buffer, treated with DNase I, washed with RPE buffer and eluted in 30 ul of water. The pellet was further digested in ATL and proteinase K for 1 hour at 56 C followed by 2 hours at 90 C. The DNA was bound to a column, washed and eluted in 100 ul of EB.
High-throughput exome library preparation
Genomic DNA was sheared to 250 bp using the Covaris S2 platform. A custom, in-house exome library preparation process based on the Agilent XT2 pooled exome capture method was designed to meet the need to create over 1400 sequencing libraries within a reasonable timeframe. To increase the throughput of exome library preparation, a custom 96-well barcode system was designed based on the Illumina sequencing system whereby a separate sequencing read is used to identify the barcode of a particular library. Custom barcodes of length 8, compatible with the 3-read Illumina hiseq v2 platform, were designed using scripts available at https://bioinf.eva.mpg.de/multiplex/ (Meyer and Kircher, 2010). The barcodes were designed to maximize capture efficiency, edit distance amongst one another, and sequence quality. An edit distance of 3 or greater was enforced, as well as standard channel balancing for optimal base diversity at each sequencing cycle.
Oligonucleotides were ordered with standard Illumina barcode modifications of 5′ phosphorylation, a phosphorothioate bond between the last two bases on the 3′ end, and HPLC purification. Oligonucleotides were annealed by standard protocols and diluted to a 15 μM working concentration in EB. The barcode sequences that we utilized are shown below.
| Sequences for the 96 custom barcodes used in high-throughput library preparation. | |||||
|---|---|---|---|---|---|
| CTATGCTG | GGATTCGT | AGCGGATA | TCGCTTAA | TCATACGC | AACGATGA |
| CAATCGAA | GCGAACTA | GGTCGTTA | GTTCAAGC | CCTAACTC | ATCTGACG |
| ACCATGCA | CTCGCTAT | GTTGAGGT | GGTAAGAC | AAGCGAAG | CGTACTAG |
| TGCAATCG | AGGCTACT | TCTAGCAA | ACGGTTGA | GAGCATCA | ATCCGAAC |
| AGCTCATC | GTCTATCC | ACCTGCTT | AGAGCGAA | AGAGCTCT | CAACTACC |
| GATCAGTC | GTTATGCG | GTTGCCTA | TATCAAGA | AAGAGCTT | ACTTCCAT |
| CTACTCCT | TCGTTAGA | GTCATTAT | GAACGAGT | TGATGCAA | TGGCAGTA |
| TAGATACC | GACGTCAA | TTGATAGG | CGTAAGGT | CTAGTCAG | TCTTCTGA |
| CAACCTCA | CTACCATG | TAGTCTAC | ACTAGAGG | AGAACCGT | TACGCGTA |
| CTTATCTT | AAGGTCCA | CCAGTAAT | CGCTATAG | CCATGGTT | AACTGCAG |
| ACGCATTG | ACCAGTTC | TGACCTAG | TATGATGG | AGGTTGCA | TAATGCGT |
| TGATCTGC | CCTGATCT | ACCAAGGT | GAAGGATA | GCATCGTA | GGAACGTT |
| TAGCGATA | CATCGCAT | TGACTAGC | TGCTTACC | AAGCCGTA | TCTTGGAC |
| TCCGATTG | TATCTGCG | ACTGGATC | ACTACTCT | CTCTTGCT | CTCGAAGT |
| GATACTCG | TCGATCTG | TGGATTGC | GGAAGTAC | GATGGTAG | ACGTACGT |
| CATGAGGA | GCTCTATC | TTAAGCGC | CTGAGCAA | CGCCTATA | CTGGACTT |
Pre-capture libraries were prepared with standard library preparation protocols using the KAPA Hyper kit (Kapa Biosystems, Wilmington, MA), and then pooled at equal volume and sequenced on the Illumina platform at low depth to determine exact relative abundances. Based on these abundances, libraries were balanced optimally for exome using the Agilent All Exon V5 human bait set. Library sequencing was performed to an average of 75X coverage on Illumina Hiseq 2500 platform.
Exome Sequence Alignment
Reads in fastq format (Cock et al., 2010) were pre-processed with GATK (McKenna et al., 2010) version 3.2 to remove Illumina adapter sequences (analysis type –T ClipReads, -XF illumina.adapters.fa) and Phred-scaled base qualities of 10 and below (-QT 10) similarly to described previously (Sehn et al., 2007; Zhang et al., 2013; Zhang et al., 2014). After GATK processing, reads were mapped to hg19 using Burrows-Wheeler Aligner (BWA) (Li and Durbin, 2010) version 0.7.7 with the mem algorithm. Reads were sorted with Novoalign V2.08.03 novosort. SAMtools (Li et al., 2009) flagstat was used to compute the number and percent of reads that mapped to the genome. Both depth and breadth of coverage for each exome were computed using BEDTools (Quinlan and Hall, 2010). PCR/optical duplicates were marked by Picard. Base quality recalibration and indel realignment was performed using GATK (McKenna et al., 2010).
Variant and gene filtering, analysis of significantly mutated genes
Joint variant calling was performed on all 1001 DLBCL samples together using Samtools (Li, 2011) mpileup v. 0.1.19 and somatic variant calling was performed using MuTect version 1.1.4 (Cibulskis et al., 2013) for the tumor/normal pairs. This resulted in a total of ~1.1 million variants. The variant functions and population statistics were annotated using Annovar (Wang et al., 2010; Yang and Wang, 2015). The MuTect somatic mutations were used as a high-quality discovery dataset for identifying mutated genes. Variant filtering was performed using the following criteria: select exonic, not synonymous variants, somatic variants, rare and damaging variants, exclude duplicate frameshifts that were found in multiple samples, variants found in repetitive regions, variants found in regions with poor coverage. Additionally, each variant was required to have an instance of genotype quality greater than 30 and read depth greater than 5. Driver gene analysis was performed using a combination of three approaches: (i) MutsigCV (Lawrence et al., 2013) which identifies driver genes with point mutations above the background mutation rate; and (ii) Hotnet2 (Leiserson et al., 2015) which identifies subnetworks of genes based on protein interactions; and (iii) the model we have applied previously (Love et al., 2012) to factor in copy number alterations, gene variability and the enrichment of rare (EXAC frequency less than 0.001), functional variants (CADD score greater than 10), as well as the proximity of SNVs to each other. Gene with very low expression levels across samples were excluded.
Copy Number Analysis
We estimated copy number aberrations in the 1001 DLBCLs using EXCAVATOR (Magi et al, 2013) in the pooled mode, against a set of 15 high quality normal samples. Normals were also run against normals to control for normal variation and population artifacts. Copy number segmentation is performed to smooth the exon-level counts. This resulted in the sample x gene copy number matrix. Integrative analysis of mutations and copy number variations was performed to identify driver genes. Amplifications and deletions were defined using thresholds of +1 and -1 respectively on log ratios.
Comparing FFPE vs. fresh frozen samples in matched patients
We performed parallel whole-exome sequence analysis of 34 sets of paired FFPE and frozen tumors, with each pair obtained from the same patient. The cases ranged in age from 4 years to 16 years, allowing us to determine the effect of sample age. We evaluated our overall mutation discovery sensitivity compared to previous DLBCL studies utilizing fresh-frozen biopsies by preparing paired FFPE and frozen biopsies from the same DLBCL case prepared and whole exome sequenced identically. The similarity metric between any two sequencings was computed with the Jaccard similarity metric, or the number of variants shared as fraction of the union of the variants in the two samples being compared. With the frozen case as the gold standard in any given pair, the Jaccard metric is sensitive to both false positives (increases denominator) and false negatives (decreases the numerator). An overall score of 0 equates to no overlap, and an overall score of 1 equates to complete overlap. We found that the similarity coefficient between the genomic profiles from the same patient derived from FFPE vs. frozen biopsies was completely preserved regardless of the age of the specimen. The results are summarized in the heatmap in Figure S1, with an adjoining bar graph indicating sample age. These data indicate that, at least for specimens that are less than 16 years of age, we can reliably identify mutations from FFPE cases at the same rate as frozen cases.
We also examined a potential concern with respect to FFPE samples is that the preservation method may cause some regions of the genome to be sequenced unevenly, resulting in poor sensitivity to somatic mutation detection in some portions of the genome. The violin plots in Figure S1 (right panel) show that the total variant distribution is equivalent between FFPE and frozen samples and that the recovery of somatic variants was equivalent (P=0.49, Wilcoxon rank-sum test). These results demonstrate that with appropriate processing and analysis, FFPE cases can be used to generate mutational data that are equivalent to those generated from frozen cases.
Comparing tumors with matched normal vs. unpaired tumors
To check for biases between tumors with paired normal (N=400) and the unpaired tumors (N=601), we have directly compared their mutational patterns and frequency for the set of 150 driver genes. The heatmap of genetic alterations for the paired and unpaired samples is shown in Figure S2A, which shows very similar patterns for the two groups. The scatterplot of mutational frequency for these two set of samples is shown in Figure S2B. The mutational frequencies are essentially identical (R2 = 0.94, P<10−6).
CRISPR Screen
To generate GeCKO.v2 library virus, 293T cells were seeded in 15 cm dishes at 12 million cells per dish. The following day, cells were transfected using TransIT-LT1 (Mirus) according to manufacturer’s instructions with 10 μg lentivector, 10 μg psPAX2 and 1 μg pCMV-VS. 16 hours post transfection, media was changed. Virus was harvested at 48 and 72 hours post transfection, pooled, filtered, aliquoted and stored at -80 until needed for screening.
DLBCL cells stably expressing Cas9 were generated by transduction of cells with lentiCas9-blast virus at multiplicity of infection (MOI) < 1. Forty-eight hours post transduction, cells were selected with 10 ug/ml blasticidin for four or five days and expanded. Cas9 activity in each stable cell line was confirmed by transduction with a control sgRNA targeting the AAVS1 locus (ggggccactagggacaggat) (3), followed by Surveyor assay (IDT) and Sanger sequencing of AAVS1 to assess editing rates. Sanger sequencing was performed on AAVS1 PCR product after cloning into the pCR 2.1 TOPO TA vector. For the TMD8 and HBL1 cell lines, single cell cloning was needed to isolate Cas9-expressing cells with >80% editing efficiency after testing with the AAVS1 sgRNA.
Cas9-expressing cells were transduced with the human GeCKO.v2 library virus pools with 8 μg/ml polybrene using conditions to obtain MOIs between 0.3–0.5 and 1000-fold representation of the library after selection. Subpools A and B of the GeCKO library were transduced into cells and screened separately in triplicate. 24–48 hours post transduction, cells were selected with 2 μg/ml puromycin for 72 hours. Some cells were harvested after puromycin selection to serve as the initial time point sample as well as after 14 population doublings. 1000-fold representation of the library was maintained at each passage.
Genomic DNA was harvested from each time point sample using the QIAamp Blood Maxi Kit according to manufacturer’s instructions. The sgRNA cassettes from each sample were amplified and barcoded for multiplexing from 50–100 μg of genomic DNA with two rounds of PCR with Takara Ex Taq DNA polymerase as previously described. PCR products were gel purified and isopropanol precipitated for sequencing on the HiSeq2500.
Normalized sgRNA abundance quantification for CRISPR screen
Guide RNA (sgRNA) amplicon sequencing reads for each library were downloaded from Hudson Alpha as de-multiplexed FASTQ files. Raw reads were then trimmed using CutAdapt v1.8.3 (Martin, 2011) to remove 5′ barcoded adapter sequences (33–38bp) specific to each library and 3′ PCR primer sequences (20bp). Reads were discarded if both barcode sequences could not be identified or if the resulting trimmed read was longer than 25bp or shorter than 15bp (cutadapt -g ^ <5primeadapter> -a <3primeadapter> -e 0.25 -m 15 -M 25). Successfully trimmed reads were aligned to the GeCKO v2 (Sanjana et al., 2014) sgRNA library using MAGeCK-VISPR v0.5.3 (Li et al., 2015) under default settings (no mismatches allowed) to produce a raw count table of sgRNAs across cell line replicates. The resulting count table was then normalized to account for sampling differences using the variance-stabilizing transformation implemented in the MAGeCK count module.
Statistical Estimation of Gene Knockout Fitness Effects on Cell Lines
CRISPR gene scores were used to quantify the magnitude and directionality of fitness effects from normalized sgRNA counts as in (Aguirre et al., 2016). Briefly, under a scenario in which there are m total genes being screened in cell line j, the CRISPR gene score for gene i targeted by n sgRNAs is given by the following equation:
where sgRNA scoreijk is given as the z-score transformation of the log-fold change between early and late samples in cell line j for a sgRNA k targeting gene i:
Accounting for genomic copy number in CRISPR screen
In lieu of cell line-level copy number data, we used the sliding window method used by (Wang et al.) to identify suspect genomic regions where CRISPR scores might reflect genomic amplification. Briefly, we computed a neighborhood score for each gene by counting the number of low CRISPR scores (< 5th percentile for a cell line) in the 40 gene genomic window surrounding the gene (20 “upstream genes”, 20 “downstream” genes). Genes were removed from further consideration if their genomic neighborhood score was >12 to minimize the confounding influence of genomic copy number on our analysis of essential DLBCL genes.
CRISPR screen quality control
Basic sequencing quality statistics were computed for both raw and trimmed libraries using FastQC (Andrews, 2010). Basic count table quality metrics, including alignment rate and two measures of sgRNA evenness (zero count sgRNAs, Gini Index) were determined using MAGeCK-VISPR. Pairwise Pearson correlation coefficients were used to measure the degree of correlation between cell line replicates. To further investigate the concordance among biological replicates, Principal Components Analysis (PCA) was performed using log-transformed normalized sgRNA counts.
We generated an average of 26.9 million reads per time-point (range: 14.2 million to 49.3 million), yielding an average of 224 reads/sgRNA for each library. After filtering and trimming reads to remove adapter sequences and low-quality reads, an average of 57.6% of reads aligned with perfect identity to the GeCKO sgRNA reference (range: [42.8% – 64.4%]), resulting in an median effective sgRNA coverage of 121.8 mapped reads/sgRNA (range: [65.5 – 228.9]). Broadly, the depth and quality of sequence data generated for sgRNA amplicon libraries falls within acceptable levels sufficient for differential abundance testing between early and late cell populations.
As shown in Figure S3, sequencing reads appeared to be uniformly distributed across sgRNAs in early time point libraries (median Gini index = 0.12; range [0.10 – 0.132] ; ~0.1 typically acceptable for early time points) with an acceptably small percentage of sgRNAs absent from each library (median zero count sgRNAs = 657; 0.5% of total sgRNAs; range [496 – 1559]). As expected, the distribution of sequencing reads across sgRNAs was significantly more uneven in late time point samples (median Gini Index = 0.21; range [0.16 – 0.42]), with significantly more sgRNAs missing from these sequencing libraries altogether (median zero count sgRNAs = 4654 sgRNAs; 3.7% of total sgRNAs; range [1901 – 16835]). Critically, we found no relationship between sequencing depth and the number of missing sgRNAs (R2 = 0.012, p = 0.64), suggesting a biological explanation for their absence (i.e. negative selection). Though these results fall within acceptable ranges (Gini Index < 0.2) for the majority of late samples, the uneven sgRNA distribution among late samples was especially pronounced in TMD8 and Pfeiffer cell lines. Because of this we were careful to interpret downstream patterns of sgRNA abundance driven primarily by TMD8 and Pfeiffer.
Changes in sgRNA abundance over the course of the experiment were largely consistent within cell lines and—to a lesser degree—across cell lines. GuideRNA abundance was sufficiently correlated among late time point libraries for most cell lines. The median pairwise correlation between late samples for each cell line was 0.72 (Pearson’s r; range [0.56 – 0.80]). This pattern was supported by Principal Component Analysis (PCA), which shows sgRNA abundance in late populations cluster by cell line along the first two PCs (Variation explained: PC1 = 18.7%, PC2 = 13.1%). Notably, sgRNA abundances from late timepoint TMD8 and Pfeiffer samples form distinct clusters along these axes apart from the primary cluster containing other cell lines.
To assess the degree to which previously known fitness effects were recapitulated by our CRISPR screen, Mann-Whitney U-tests were used to test whether the mean CRISPR score of previously described universally essential genes was significantly less than 0. Two sets of universally essential genes were chosen from the literature (Hart et al., 2014; Hart et al., 2017) on the basis of experimentally demonstrated essentiality across multiple human cell lines in previous CRISPR screens (downloaded from: http://tko.ccbr.utoronto.ca/). Additionally, we used a permutation test to determine whether the mean CRISPR score of universally essential genes was significantly less than could be expected for a set of randomly chosen genes (NPERM=9999).
Broad patterns of gene fitness inferred from sgRNA abundance changes were largely consistent with biological expectation and results from previous CRISPR screens. Shown in Figure S3, we found that sgRNAs with significantly decreased abundance were more likely to be members of KEGG genes sets for critical cellular functions including ribosomal biosynthesis, DNA replication, transcription, and translation, indicating negative selection against the loss of these genes in cells. Additionally, sgRNAs targeting genes that had been previously demonstrated to be essential across multiple human cell types resulted in significantly decreased cell fitness relative to randomly chosen sgRNAs (avg. CRISPR score = -0.153; CRISPR scoreessential = CRISPR scorerandom: p = 0; NPERM=9999). By contrast, non-targeting control sgRNAs showed a significant increase in cell fitness relative to randomly chosen sgRNAs (avg. CRISPR score = 1.15; CRISPR scorecontrol = CRISPR scorerandom: p = 0; NPERM=9999). Collectively, these results suggest that changes in sgRNA frequency over the course of the experiment likely reflect real changes in cell fitness induced by targeted gene silencing via the CRISPR/Cas9 complex.
Identification of “essential” DLBCL genes
Paired Mann-Whitney U tests were used to determine whether there was a significant (α = 0.05) difference between the average sgRNA counts at early and late time points for each gene in each cell line. Early and late sgRNA counts from the same replicate population were considered as pairs. Normalized sgRNA counts were log-transformed (log2 [1 + sgRNA count]) prior to significance testing to minimize the effects of outliers. Additionally, p-values were adjusted for multiple comparisons using the FDR method implemented in the R statistical environment.
Genes were assessed for significance at the pan-DLBCL and disease subtype-level (ABC/GCB) only if a significant effect was observed in at least one cell line. If observed, replicates from multiple cell lines were considered as a single cell line and assessed for significance using paired Mann-Whitney U tests as above.
Essential DLBCL genes were identified from the set of ~21,000 screen genes using two sets of criteria. Under the most stringent criteria, a gene was considered significant if (i) its’ FDR was <0.05 at the DLBCL, GCB, or ABC-level and (ii) a significant effect was observed in at least 2 cell lines. A more relaxed set of criteria was used to identify essential driver genes among the 161 most commonly mutated genes in DLBCL cases. These genes were considered significant if (i) a significant effect (p<0.05) was observed in at least one cell line and (ii) an extreme CRISPR score (absolute value > 1) was observed in at least two cell lines.
RNA sequencing library preparation and analysis
We removed rRNA from total RNA by hybridization to homologous rRNA DNA oligonucleotides (IDT, 200pmol Ultramer DNA oligos) by incubating in a thermocycler at 95 C for 2 minutes, followed by ramping down the temperature -0.1 C every 1 second until the temperature reached 45 C (Adiconis et al., 2013). The rRNA and DNA oligos that formed double stranded DNA/RNA complexes were then digested with RNase H (New England Biolabs, Cat. # M0297) for 30 minutes at 45 C. The remaining DNA oligos were then digested with DNase I (New England Biolabs, Cat. # M0303) for 30 minutes at 37 C.
RNA libraries were prepared using the Stranded mRNA-seq kit (Kapa Biosystems, Cat. # KK8401) per manufacturers guidelines. Briefly, cDNA was generated using random hexamer primers followed by A-tailing. The P5 and P7 universal sequencing adaptors containing specific 8mer index sequences were ligated to the A-tailed cDNA. For this, we generated adaptors containing the P5 and P7 sequencing primers with 96 specific index sequences (Supplementary Appendix). The resulting libraries were PCR amplified and pools of 96 were quantified using the Bioanalyzer (Agilent). To identify the breakdown of indexes within the pools, they were run on the MiSeq instrument using the Miseq reagent kit V2 50 cycles (Illumina, Cat. #MS-102-2001). Using the percent index value, the approximate concentration was normalized and calculated.
To improve the sensitivity and specificity of RNAseq in FFPE cases, RNAseq libraries were hybridized to Human All Exon V6 + 3′ UTR capture baits (Agilent, Cat. #5190-9306) as described previously (Cieslik et al., 2015). Each capture pool contained 24 libraries at 50 ng each for a total of 1200 ng of DNA. The pools were lyophilized using the speed vacuum technique. The libraries were first denatured and blocked at 95 C for 5 minutes, followed by holding at 65 C. The capture baits were mixed with RNase OUT and incubated for 2 minutes at 65 C. Hybridization buffer was mixed with the baits, followed by addition of the denatured libraries. The hybridization reaction was held at 65 C for 24 hours, followed by washing and amplification. These sequencing libraries were assessed for quality with the Bioanalyzer 2100 (Agilent) using the Agilent DNA 1000 Kit per manufacturer’s instructions. Libraries of high quality (e.g. with size distribution between 120–400bp and sufficient quantity for sequencing) were subjected to high throughput sequencing using the Illumina HiSeq 2500 platform per manufacturer’s instructions using HiSeq V4 125 PE, to generate an average of 10 million reads per sample.
The sequencing reads were aligned using TopHat, a spliced read aligner which allows for sequencing reads to span multiple exons (Trapnell et al., 2009). On average, we were able to align 80% of the sequencing reads for each sample to the reference genome. The Cufflinks software package was then used for reference-based transcript assembly and quantification of gene and transcript level expression (Trapnell et al., 2012). Using the Cufflinks package, we quantified the number of reads mapping to each exonic locus as exon fragments per kilobase of exon per million fragments mapped (FPKM) (Trapnell et al., 2012).
Gene expression measurements were FPKM normalized. To enable broad gene expression signature discovery and validation, we omitted 150 samples with expression of fewer than 12,000 genes owing potentially to either technical or biological artefacts. The remaining 625 cases were designated as the core set for the integrative analysis (Table S2). Additionally, quantile normalization was performed to remove the effects due to technical variation, and the data was log2 normalized.
Defining correlated gene signatures
We define gene signatures using a collection of widely used annotated gene set databases (Kegg, Reactome, Biocarta, Gene Ontology, MSigDB), as well as several lymphoma-specific gene signature sources (Lenz et al. 2008, Monti et al. 2005, and SigDB from Staudt et al.). We then test these signatures for significant correlation in our expression dataset by utilizing a permutation test that compares these gene sets to random gene sets of the same size. With n=500 permutations, we randomly sample without replacement from the universe of genes in the dataset. Then the pairwise correlation between all genes is calculated and the average of that matrix across the whole gene set is used as the test statistic. This test statistic is calculated for each gene set of interest and compared to the appropriate null distribution, given the number of genes in the set. Significant gene sets are those whose p-value when compared to the null distribution is less than 5×10⁻³, whose test statistic is > 0.1, and whose proportion of gene-gene correlations above 0.5 is greater than 5%.
| Sources for gene sets. | ||
|---|---|---|
| Pathway Collection | Abbreviation | Original Pathway Source |
| Biocarta | BIOCARTA | http://www.biocarta.com/ |
| Kegg | KEGG | http://www.genome.jp/kegg/ |
| Reactome | REACTOME | http://www.reactome.org/ |
| NCI Pathway Interaction Database | PID | http://www.ndexbio.org/ |
| Sigma Aldrich | SA | http://www.sigmaaldrich.com/ |
| Signaling Gatemway | SIG | http://www.signalinggateway.org/ |
| Signaling Transduction | ST | http://stke.sciencemag.org/ |
| Matrisome | NABA | http://matrisome.org/ |
| Gene Ontology | GO | http://www.geneontology.org/ |
| MSigDB Oncogenic Signatures | ONCO | MSigDB, Various publications |
| MSigDB Hallmark Signatures | HALLMARK | http://doi.org/10.1016/j.cels.2015.12.004 |
| Panther Pathway Database | PANTHER | http://www.pantherdb.org/ |
| Netpath Database | NETPATH | http://www.netpath.org/ |
| HumanCyc Pathways | HUMANCYC | https://humancyc.org/ |
| Institute of Bioinformatics Pathways | IOB | http://www.ibioinformatics.org/ |
| Xcell Algorithm Genesets | XCELL | http://xcell.ucsf.edu/ |
| Cibersort Algorithm Genesets | CIBERSORT | https://cibersort.stanford.edu/ |
| Lenz et al. 2008 signatures | LENZ | http://doi.org/10.1073/pnas.0804295105 |
| Staudt lab Signature DB | SIGDB | https://lymphochip.nih.gov/signaturedb/ |
| Monti et al. 2005 signatures | MONTI | http://doi.org/10.1182/blood-2004-07-2947 |
Clustering gene signatures
We clustered the significantly correlated gene sets using affinity propagation clustering (Frey and Dueck, 2007). Affinity propagation is a clustering algorithm that simultaneously identifies clusters and exemplars (cluster representatives) in the data without the user specifying the number of clusters (k) to be identified. The algorithm starts by considering all samples to be exemplars, and then by iteratively exchanging messages between data points until it converges to an optimal set of exemplars and clusters.
Using affinity propagation on the 1228 significantly correlated gene sets we obtained 31 clusters. Exemplar names were manually curated to best represent the gene signatures that were part of the cluster.
Association of genetic alterations with gene expression signatures
Genetic alterations were encoded as missense mutations, truncating mutations, copy number gains and copy number deletions. We tested for associations between genetic alterations and gene expression signature using ANOVA. Multiple hypothesis correction was performed using Benjamini-Hochberg test.
Association of gene expression signatures with CRISPR hits and survival
We identified significantly enriched genesets associated with CRISPR hits using Fisher’s test (p<0.05 & Odds ratio>1). Exemplar genesets related to proliferation and cell cycle exemplar were significantly associated with CRISPR hits.
We identified exemplar genesets associated with survival using logrank test (p<0.05). Interestingly, 16 out of the 31 exemplars were significantly associated with survival. Exemplars related to stromal signatures were associated with better prognosis, while exemplar genesets related to proliferation were associated with worse prognosis.
Classification of DLBCL into ABC and GCB subtypes
Genes previously associated with ABC/GCB classification were used to classify samples into ABC/GCB subgroups (Wright et al., 2003) (table below). Gene expression data used for this analysis are shown in Table S2.
| ensembl_ID | gene_name | Subtype associated with gene |
|---|---|---|
| ENSG00000143772 | ITPKB | GCB |
| ENSG00000196549 | MME | GCB |
| ENSG00000113916 | BCL6 | GCB |
| ENSG00000185697 | MYBL1 | GCB |
| ENSG00000105339 | DENND3 | GCB |
| ENSG00000119408 | NEK6 | GCB |
| ENSG00000135363 | LMO2 | GCB |
| ENSG00000118308 | LRMP | GCB |
| ENSG00000170054 | SERPINA9 | GCB |
| ENSG00000131370 | SH3BP5 | ABC |
| ENSG00000137265 | IRF4 | ABC |
| ENSG00000137193 | PIM1 | ABC |
| ENSG00000138185 | ENTPD1 | ABC |
| ENSG00000095585 | BLNK | ABC |
| ENSG00000118971 | CCND2 | ABC |
| ENSG00000139083 | ETV6 | ABC |
| ENSG00000033170 | FUT8 | ABC |
| ENSG00000104081 | BMF | ABC |
| ENSG00000172349 | IL16 | ABC |
| ENSG00000196396 | PTPN1 | ABC |
Quantile normalized and log2 transformed gene expression measurements were z-normalized across the genes. The ABC and GCB-specific scores were computed for each sample by taking the average of the z-scores for ABC, GCB genes respectively. A combined RNAseq subtype score was then computed by taking the difference in the ABC-specific score to the GCB-specific score. A sample was classified as ABC if the RNAseq subtype score was >0.25 and its GCB score was <0.75; and it was classified as GCB if the combined score was < -0.25 and its ABC score<0.75. The rest of the samples belonged to the unclassified group. The classification schema is described in detail below.
This results in 313 samples being classified as ABC DLBCL, 331 samples being classified as GCB DLBCL and 131 as Unclassified. The gene expression data for this classification is included in Table S2.
Validation of the RNAseq ABC/GCB classifier
NanoString Lymph2Cx ABC/GCB
In order to validate the RNAseq based subtype calls, we profiled 200 samples using the NanoString-based Lymph2Cx assay(Scott et al., 2014). We obtained NanoString linear predictor score (LPS) as well ABC/GCB calls from the Lymph2Cx assay. The RNAseq subtype scores are highly correlated to the NanoString LPS score (R2=0.87, p<10^-6).
Hans GCB/non-GCB calls
Additionally, we obtained immunohistochemistry-based Hans GCB/non-GCB calls (Hans et al., 2004) for 522 samples. There is also a high degree of concordance between the Hans calls and the RNAseq-based subtypes (p<10^-6).
MYC and BCL2 expression and translocations
In our study, we used log2 transformed RNAseq expression data for MYC and BCL2 and defined high expressors based on cutoffs trained from immunohistochemistry (IHC) data. We ran IHC for MYC (N=284) and BCL2 (N=404) and defined positive and negative IHC groups based on a cutoff of 40% and 50% respectively (Supplementary Table S1). High expressors were defined from RNAseq data as MYC-high and BCL2-high and were significantly associated with survival (MYC p=0.0013 and BCL2 p=0.006). Double expressors were defined as samples that have both high expression of MYC and high expression of BCL2 (N=154, p=0.00008).
We assessed the independence of ABC/GCB subgrouping and double expressors (high MYC and BCL2) by stratifying for ABC/GCB within the double expressors (N=154). Survival plot in Figure S4 shows that ABC/GCB status does not further stratify the double expressors (p=0.415).
We separately examined the association of translocations in MYC and BCL2 with mutations and expression by performing fluorescent in situ hybridization using both genes to define translocations involving the immunoglobulin locus and MYC and BCL2 (performed separately).
We profiled these translocation events using FISH for MYC and BCL2 in 126 DLBCLs. We found that MYC had a total of 14 translocations, while BCL2 has 26 translocations. We examined the associations between translocations and expression, mutations and copy number events (Figure S4). MYC translocations are associated with high expression (p=0.027). We found that nearly 80% of the cases with MYC mutations also had a translocation in MYC, whereas only 10% cases with wildtype MYC also had a translocation of the gene (p=0.005), while we don’t see an association with copy number amplifications. BCL2 mutations are strongly associated with translocations (p=4E-6) and amplifications are also associated with translocation events (p=0.03). BCL2 translocations have a trend towards higher expression, but the association is not statistically significant.
Survival plots of MYC, BCL2 translocations and double hits – MYC and BCL2 or BCL6 translocations do not show significant differences in the translocated cases (Figure S4).
Genomic risk model
We developed a supervised learning approach for defining the association of survival with combinations of the following genetic and molecular features: (a) known expression subgroups (ABC, GCB subgroups, MYC, and BCL2 high expression), (b) the mutations/copy number events in the 150 DLBCL-associated genes identified in this study. We use a comprehensive approach by first defining combinatorial features derived from genetic and molecular features.
A schematic of our predictive modeling workflow is shown in Fig 5C. The first step of our method involves enumerating all possible combinations that involved up to 4 separate genetic and molecular features (degree<=3) and affected a minimum of 20 patients (coverage >=20). This approach identified 313 combinatorial features, which includes 95 singletons, 166 pairs, 52 triplets. These combinatorial features formed the input for the survival predictive model.
We used elastic net regression (Zou and Hastie, 2005) with a Cox proportional hazards model. Elastic net is a regularized regression framework that is a linear combination of the L1 (Lasso regression) and L2 (Ridge regression) penalties. Ridge regression tends to favor lower coefficients and to keep correlated features in the model, while lasso regression tends to shrink the number of features in the model. Elastic net combines the advantages of these two methods, and allows for the flexibility of choosing the combination in a dataset-specific manner by tuning parameters using cross-validation within the training data.
The performance of the model was rigorously evaluated using 5-fold cross-validation which was repeated 100 times. Briefly, the data was randomly split into 5 parts, of which one of the part was designated test set and the remaining was used for training. The elastic net model was trained only on the training data, and then applied to the test set to get predictions. The predictions were then evaluated using a log-rank test. The methods were implemented in R using glmnet library.
QUANTIFICATION AND STATISTICAL ANALYSIS
All statistical analyses were performed using R v3.3.0. Kaplan-Meier survival curves were used for survival analysis. Statistical analyses used for each of the figures is specified in the legend. Ns for the different groups are provided in the figures.
DATA AND SOFTWARE AVAILABILITY
The exome sequencing files are uploaded to EGA (https://www.ega-archive.org/) and can be accessed using the accession number EGAS00001002606. Clinical data and all data used for this study are provided in the Supplementary tables. We have developed an interactive webtool (dlbcl.davelab.org) for survival analysis using clinical and genomic features.
Supplementary Material
A. The heatmap indicates all-pairs Jaccard similarity distance between variants measured from 34 paired FFPE and frozen DLBCL tumors obtained from the same patient. On the diagonal, the similarity for FFPE and Frozen cases from the same individual can be seen. The cases are sorted by sample age, indicated on the horizontal bar graph.
B. We compared the somatic mutation distribution of 30 frozen tumor/normal pairs, and 400 FFPE tumor/normal cases. There is no difference in the distribution (p=0.49, Wilcoxon Rank test). The mean and standard error of the mean of the frozen cases, as well as that of FFPE cases, are super-imposed on the violin plots.
Clinical Information. For each DLBCL patient sequenced, clinical features are shown.
Sample-level statistics. For each DLBCL sample, sequencing library barcode information, estimated tumor purity, sequencer quality metrics, and read count statistics are shown.
Sanger validation. 1130 separate Sanger reactions were performed on DLBCL cases to compare the result obtained by whole-exome sequencing to that observed by Sanger sequencing.
Variant and Individual-level information. Variant genomic location, functional annotation, whether the variant was observed in a Tumor/Normal pair, as well as DLBCL individual-level mutational status.
Copy Number Alterations: Individual gene-level copy number ratios are shown.
Gene and individual-level information. Mutation matrix for the 150 driver genes and 1001 DLBCL patients, with 1 indicating alteration (copy number or mutation), and 0 indicating no alteration.
A. Heatmap of genetic alterations for the paired tumors compared to the unpaired group shows very similar patterns of overlaps and exclusions.
B. Scatterplot of the mutational frequency for the paired and unpaired samples shows a high degree of similarity (R2 = 0.94, P<10−6).
A. Cumulative frequency distribution of normalized sgRNA counts among early and late cell line replicates.
B. Gini evenness indices computed from normalized sgRNA counts for all cell line replicates.
C. Sliding window copy number peak plot with y-axis displaying genes counts in each genomic region with CRISPR scores <5th percentile CRISPR score for a cell line. Red bars indicate genomic regions significantly enriched for genes with negative CRISPR scores (>12) as would be expected in amplified regions. Genes in these regions were discarded from consideration for essential gene status in DLBCL.
D. Gene set membership of genes ranked by CRISPR score. Genes with lower CRISPR scores are significantly more likely to be involved in fundamental cellular processes such as ribosome biosynthesis, DNA replication, transcription and translation.
A. Survival of DLBCL cases with high expression in MYC, BCL2 and their combination - double expressors, show significant survival differences. All tests are log-rank tests.
B. Double expressors (MYC and BCL2 high expression) stratified by ABC and GCB DLBCL subgroups are not associated with survival differences (p=0.25). Association of translocations of MYC (C) and BCL2 (D) with expression, mutations and copy number amplifications were tested in 126 DLBCLs.
E. Survival plots for MYC, BCL2 translocations and double hits (MYC & BCL2 or BCL6 translocations).
The cross-validation performance of the genomic risk model comprised of combinations of DNA and RNA features, is compared to a model with the same features used individually (not in combinations) shows that combinations, i.e., interactions contribute to the superior performance of the genomic risk model.
Gene expression data for ABC/GCB associated genes: Log2 transformed quantile normalized FPKM gene expression data for 775 DLBCL samples.
Genetic alterations: Genetic alterations significantly associated with ABC/GCB subgroups
Significant pairwise associations: Mutual exclusions and overlaps between pairs of genes
CRISPR knockout fitness effects of essential DLBCL genes
Gene set enrichment for essential genes inferred from CRISPR screens
Significant Signatures: Significantly correlated genesets and clusters with signature scores per sample
Genesets vs. Mutations: Mutations significantly associated with genesets are shown in this table
Geneset exemplars: Association of Geneset exemplars with essential genes from CRISPR screens and survival association
Significant survival associations: Genes with significant survival association
Genomic risk model: Combinatorial features used in the survival model
Test set: Predictions from Genomic Risk Model in the test set
HIGHLIGHTS.
Exome sequencing in 1001 DLBCL patients comprehensively identifies 150 driver genes
Unbiased CRISPR screen in DLBCL cell lines identifies essential oncogenes
Integrative analysis connects genomics, CRISPR hits and clinical outcome
A genomic risk model of survival outperforms existing risk-assessment methods
Acknowledgments
This work was partly funded through the Leukemia Lymphoma Society, Department of Defense and the National Institutes of Health. We gratefully acknowledge the generous support of C. Stiefel and D. Stiefel.
Footnotes
Author Contributions:
The following authors contributed to the design of the study: J. Zhang, A. Reddy, N. Davis, A. Moffitt, C. Love, A. Waldrop, and S. Dave.
The following authors contributed to sample or data collection: J. Zhang, A. Reddy, N. Davis, A. Moffitt, C. Love, A. Waldrop, S. Leppa, A. Pasanen, L. Meriranta, M. Karjalainen-Lindsberg, P. Norgaard, M. Pedersen, A. Gang, E. Høgdall, T. Heavican, W. Lone, J. Iqbal, G. Li, S. Kim, J. Healy, K. Richards, Y. Fedoriw, L. Bernal-Mizrachi, J. Koff, A. Staton, C. Flowers, O. Paltiel-Clarfield, N. Goldschmidt, M. Calaminici, A. Clear, J. Gribben, E. Nguyen, M. Czader, S. Ondrejka, A. Collie, E. Hsi, E. Tse, R. Au-Yeung, Y. Kwong, G. Srivastava, W. Choi, A. Evens, M. Pilichowska, M. Sengar, N. Reddy, S. Li, A. Chadburn, L. Gordon, E. Jaffe, R. Rempel, T. Tzeng, L. Happ, T. Dave, and S. Dave.
The following authors contributed to data analysis: J. Zhang, A. Reddy, N. Davis, A. Moffitt, C. Love, A. Waldrop, G. Li, S. Kim, J. Healy, R. Rempel, T. Tzeng, L. Happ, T. Dave, D. Rajagopalan, J. Datta, D. Dunson, and S. Dave.
The following authors contributed to manuscript preparation: J. Zhang, A. Reddy, N. Davis, A. Moffitt, A. Waldrop, and S. Dave.
Publisher's Disclaimer: This is a PDF file of an unedited manuscript that has been accepted for publication. As a service to our customers we are providing this early version of the manuscript. The manuscript will undergo copyediting, typesetting, and review of the resulting proof before it is published in its final citable form. Please note that during the production process errors may be discovered which could affect the content, and all legal disclaimers that apply to the journal pertain.
References
- Adiconis X, Borges-Rivera D, Satija R, DeLuca DS, Busby MA, Berlin AM, Sivachenko A, Thompson DA, Wysoker A, Fennell T, et al. Comparative analysis of RNA sequencing methods for degraded or low-input samples. Nat Meth. 2013;10:623–629. doi: 10.1038/nmeth.2483. [DOI] [PMC free article] [PubMed] [Google Scholar]
- Aguirre AJ, Meyers RM, Weir BA, Vazquez F, Zhang CZ, Ben-David U, Cook A, Ha G, Harrington WF, Doshi MB. Genomic copy number dictates a gene-independent cell response to CRISPR/Cas9 targeting. Cancer discovery. 2016;6:914–929. doi: 10.1158/2159-8290.CD-16-0154. [DOI] [PMC free article] [PubMed] [Google Scholar]
- Alizadeh AA, Eisen MB, Davis RE, Ma C, Lossos IS, Rosenwald A, Boldrick JC, Sabet H, Tran T, Yu X, et al. Distinct types of diffuse large B-cell lymphoma identified by gene expression profiling. Nature. 2000;403:503–511. doi: 10.1038/35000501. [DOI] [PubMed] [Google Scholar]
- Andrews S. FastQC: a quality control tool for high throughput sequence data 2010 [Google Scholar]
- Cibulskis K, Lawrence MS, Carter SL, Sivachenko A, Jaffe D, Sougnez C, Gabriel S, Meyerson M, Lander ES, Getz G. Sensitive detection of somatic point mutations in impure and heterogeneous cancer samples. Nat Biotechnol. 2013;31:213–219. doi: 10.1038/nbt.2514. [DOI] [PMC free article] [PubMed] [Google Scholar]
- Cock PJ, Fields CJ, Goto N, Heuer ML, Rice PM. The Sanger FASTQ file format for sequences with quality scores, and the Solexa/Illumina FASTQ variants. Nucleic Acids Res. 2010;38:1767–1771. doi: 10.1093/nar/gkp1137. [DOI] [PMC free article] [PubMed] [Google Scholar]
- Frey BJ, Dueck D. Clustering by passing messages between data points. science. 2007;315:972–976. doi: 10.1126/science.1136800. [DOI] [PubMed] [Google Scholar]
- Green TM, Young KH, Visco C, Xu-Monette ZY, Orazi A, Go RS, Nielsen O, Gadeberg OV, Mourits-Andersen T, Frederiksen M. Immunohistochemical double-hit score is a strong predictor of outcome in patients with diffuse large B-cell lymphoma treated with rituximab plus cyclophosphamide, doxorubicin, vincristine, and prednisone. Journal of Clinical Oncology. 2012;30:3460–3467. doi: 10.1200/JCO.2011.41.4342. [DOI] [PubMed] [Google Scholar]
- Hans CP, Weisenburger DD, Greiner TC, Gascoyne RD, Delabie J, Ott G, Müller-Hermelink HK, Campo E, Braziel RM, Jaffe ES. Confirmation of the molecular classification of diffuse large B-cell lymphoma by immunohistochemistry using a tissue microarray. Blood. 2004;103:275–282. doi: 10.1182/blood-2003-05-1545. [DOI] [PubMed] [Google Scholar]
- Hart T, Brown KR, Sircoulomb F, Rottapel R, Moffat J. Measuring error rates in genomic perturbation screens: gold standards for human functional genomics. Molecular systems biology. 2014;10:733. doi: 10.15252/msb.20145216. [DOI] [PMC free article] [PubMed] [Google Scholar]
- Hart T, Tong A, Chan K, van Leeuwen J, Seetharaman A, Aregger M, Chandrashekhar M, Hustedt N, Seth S, Noonan A. Evaluation and Design of Genome-wide CRISPR/Cas9 Knockout Screens. bioRxiv. 2017:117341. doi: 10.1534/g3.117.041277. [DOI] [PMC free article] [PubMed] [Google Scholar]
- Johnson NA, Slack GW, Savage KJ, Connors JM, Ben-Neriah S, Rogic S, Scott DW, Tan KL, Steidl C, Sehn LH. Concurrent expression of MYC and BCL2 in diffuse large B-cell lymphoma treated with rituximab plus cyclophosphamide, doxorubicin, vincristine, and prednisone. journal of clinical oncology. 2012;30:3452–3459. doi: 10.1200/JCO.2011.41.0985. [DOI] [PMC free article] [PubMed] [Google Scholar]
- Koike-Yusa H, Li Y, Tan EP, Velasco-Herrera MDC, Yusa K. Genome-wide recessive genetic screening in mammalian cells with a lentiviral CRISPR-guide RNA library. Nature biotechnology. 2014;32:267–273. doi: 10.1038/nbt.2800. [DOI] [PubMed] [Google Scholar]
- Lawrence MS, Stojanov P, Mermel CH, Robinson JT, Garraway LA, Golub TR, Meyerson M, Gabriel SB, Lander ES, Getz G. Discovery and saturation analysis of cancer genes across 21 tumour types. Nature. 2014;505:495–501. doi: 10.1038/nature12912. [DOI] [PMC free article] [PubMed] [Google Scholar]
- Lawrence MS, Stojanov P, Polak P, Kryukov GV, Cibulskis K, Sivachenko A, Carter SL, Stewart C, Mermel CH, Roberts SA, et al. Mutational heterogeneity in cancer and the search for new cancer-associated genes. Nature. 2013;499:214–218. doi: 10.1038/nature12213. [DOI] [PMC free article] [PubMed] [Google Scholar]
- Leiserson MD, Vandin F, Wu HT, Dobson JR, Eldridge JV, Thomas JL, Papoutsaki A, Kim Y, Niu B, McLellan M. Pan-cancer network analysis identifies combinations of rare somatic mutations across pathways and protein complexes. Nature genetics. 2015;47:106–114. doi: 10.1038/ng.3168. [DOI] [PMC free article] [PubMed] [Google Scholar]
- Leiserson MDM, Reyna MA, Raphael BJ. A weighted exact test for mutually exclusive mutations in cancer. Bioinformatics. 2016;32:i736–i745. doi: 10.1093/bioinformatics/btw462. [DOI] [PMC free article] [PubMed] [Google Scholar]
- Lenz G, Wright G, Dave SS, Xiao W, Powell J, Zhao H, Xu W, Tan B, Goldschmidt N, Iqbal J, et al. Stromal gene signatures in large-B-cell lymphomas. N Engl J Med. 2008;359:2313–2323. doi: 10.1056/NEJMoa0802885. [DOI] [PMC free article] [PubMed] [Google Scholar]
- Li H. A statistical framework for SNP calling, mutation discovery, association mapping and population genetical parameter estimation from sequencing data. Bioinformatics. 2011;27:2987–2993. doi: 10.1093/bioinformatics/btr509. [DOI] [PMC free article] [PubMed] [Google Scholar]
- Li H, Durbin R. Fast and accurate long-read alignment with Burrows-Wheeler transform. Bioinformatics. 2010;26:589–595. doi: 10.1093/bioinformatics/btp698. [DOI] [PMC free article] [PubMed] [Google Scholar]
- Li H, Handsaker B, Wysoker A, Fennell T, Ruan J, Homer N, Marth G, Abecasis G, Durbin R Genome Project Data Processing S. The Sequence Alignment/Map format and SAMtools. Bioinformatics. 2009;25:2078–2079. doi: 10.1093/bioinformatics/btp352. [DOI] [PMC free article] [PubMed] [Google Scholar]
- Lohr JG, Stojanov P, Lawrence MS, Auclair D, Chapuy B, Sougnez C, Cruz-Gordillo P, Knoechel B, Asmann YW, Slager SL, et al. Discovery and prioritization of somatic mutations in diffuse large B-cell lymphoma (DLBCL) by whole-exome sequencing. Proc Natl Acad Sci U S A. 2012;109:3879–3884. doi: 10.1073/pnas.1121343109. [DOI] [PMC free article] [PubMed] [Google Scholar]
- Love C, Sun Z, Jima D, Li G, Zhang J, Miles R, Richards KL, Dunphy CH, Choi WW, Srivastava G, et al. The genetic landscape of mutations in Burkitt lymphoma. Nat Genet. 2012;44:1321–1325. doi: 10.1038/ng.2468. [DOI] [PMC free article] [PubMed] [Google Scholar]
- Magi A, Tattini L, Cifola I, D’Aurizio R, Benelli M, Mangano E, Battaglia C, Bonora E, Kurg A, Seri M, et al. EXCAVATOR: detecting copy number variants from whole-exome sequencing data. Genome Biol. 2013;14:R120. doi: 10.1186/gb-2013-14-10-r120. [DOI] [PMC free article] [PubMed] [Google Scholar]
- McKenna A, Hanna M, Banks E, Sivachenko A, Cibulskis K, Kernytsky A, Garimella K, Altshuler D, Gabriel S, Daly M, et al. The Genome Analysis Toolkit: a MapReduce framework for analyzing next-generation DNA sequencing data. Genome Res. 2010;20:1297–1303. doi: 10.1101/gr.107524.110. [DOI] [PMC free article] [PubMed] [Google Scholar]
- Meyer M, Kircher M. Illumina sequencing library preparation for highly multiplexed target capture and sequencing. Cold Spring Harb Protoc. 2010;2010 doi: 10.1101/pdb.prot5448. pdb prot5448. [DOI] [PubMed] [Google Scholar]
- Monti S, Savage KJ, Kutok JL, Feuerhake F, Kurtin P, Mihm M, Wu B, Pasqualucci L, Neuberg D, Aguiar RC, et al. Molecular profiling of diffuse large B-cell lymphoma identifies robust subtypes including one characterized by host inflammatory response. Blood. 2005;105:1851–1861. doi: 10.1182/blood-2004-07-2947. [DOI] [PubMed] [Google Scholar]
- Morin RD, Mendez-Lago M, Mungall AJ, Goya R, Mungall KL, Corbett RD, Johnson NA, Severson TM, Chiu R, Field M, et al. Frequent mutation of histone-modifying genes in non-Hodgkin lymphoma. Nature. 2011;476:298–303. doi: 10.1038/nature10351. [DOI] [PMC free article] [PubMed] [Google Scholar]
- Papaemmanuil E, Gerstung M, Bullinger L, Gaidzik VI, Paschka P, Roberts ND, Potter NE, Heuser M, Thol F, Bolli N. Genomic Classification and Prognosis in Acute Myeloid Leukemia. New England Journal of Medicine. 2016;374:2209–2221. doi: 10.1056/NEJMoa1516192. [DOI] [PMC free article] [PubMed] [Google Scholar]
- Pasqualucci L, Trifonov V, Fabbri G, Ma J, Rossi D, Chiarenza A, Wells VA, Grunn A, Messina M, Elliot O, et al. Analysis of the coding genome of diffuse large B-cell lymphoma. Nat Genet. 2011;43:830–837. doi: 10.1038/ng.892. [DOI] [PMC free article] [PubMed] [Google Scholar]
- Quinlan AR, Hall IM. BEDTools: a flexible suite of utilities for comparing genomic features. Bioinformatics. 2010;26:841–842. doi: 10.1093/bioinformatics/btq033. [DOI] [PMC free article] [PubMed] [Google Scholar]
- Scott DW, Wright GW, Williams PM, Lih CJ, Walsh W, Jaffe ES, Rosenwald A, Campo E, Chan WC, Connors JM. Determining cell-of-origin subtypes of diffuse large B-cell lymphoma using gene expression in formalin-fixed paraffin-embedded tissue. Blood. 2014;123:1214–1217. doi: 10.1182/blood-2013-11-536433. [DOI] [PMC free article] [PubMed] [Google Scholar]
- Sehn LH, Berry B, Chhanabhai M, Fitzgerald C, Gill K, Hoskins P, Klasa R, Savage KJ, Shenkier T, Sutherland J, et al. The revised International Prognostic Index (R-IPI) is a better predictor of outcome than the standard IPI for patients with diffuse large B-cell lymphoma treated with R-CHOP. Blood. 2007;109:1857–1861. doi: 10.1182/blood-2006-08-038257. [DOI] [PubMed] [Google Scholar]
- Shalem O, Sanjana NE, Hartenian E, Shi X, Scott DA, Mikkelsen TS, Heckl D, Ebert BL, Root DE, Doench JG. Genome-scale CRISPR-Cas9 knockout screening in human cells. Science. 2014;343:84–87. doi: 10.1126/science.1247005. [DOI] [PMC free article] [PubMed] [Google Scholar]
- Shipp M. A predictive model for aggressive non-Hodgkin’s lymphoma. N Engl J Med. 1993;329:987–994. doi: 10.1056/NEJM199309303291402. [DOI] [PubMed] [Google Scholar]
- Trapnell C, Pachter L, Salzberg SL. TopHat: discovering splice junctions with RNA-Seq. Bioinformatics (Oxford, England) 2009;25:1105–1111. doi: 10.1093/bioinformatics/btp120. [DOI] [PMC free article] [PubMed] [Google Scholar]
- Trapnell C, Roberts A, Goff L, Pertea G, Kim D, Kelley DR, Pimentel H, Salzberg SL, Rinn JL, Pachter L. Differential gene and transcript expression analysis of RNA-seq experiments with TopHat and Cufflinks. Nat Protoc. 2012;7:562–578. doi: 10.1038/nprot.2012.016. [DOI] [PMC free article] [PubMed] [Google Scholar]
- Wang K, Li M, Hakonarson H. ANNOVAR: functional annotation of genetic variants from high-throughput sequencing data. Nucleic Acids Res. 2010;38:el64. doi: 10.1093/nar/gkq603. [DOI] [PMC free article] [PubMed] [Google Scholar]
- Wang T, Yu H, Hughes NW, Liu B, Kendirli A, Klein K, Chen WW, Lander ES, Sabatini DM. Gene Essentiality Profiling Reveals Gene Networks and Synthetic Lethal Interactions with Oncogenic Ras. Cell. 168:890–903.e815. doi: 10.1016/j.cell.2017.01.013. [DOI] [PMC free article] [PubMed] [Google Scholar]
- Wright G, Tan B, Rosenwald A, Hurt EH, Wiestner A, Staudt LM. A gene expression-based method to diagnose clinically distinct subgroups of diffuse large B cell lymphoma. Proc Natl Acad Sci U S A. 2003;100:9991–9996. doi: 10.1073/pnas.1732008100. [DOI] [PMC free article] [PubMed] [Google Scholar]
- Yang H, Wang K. Genomic variant annotation and prioritization with ANNOVAR and wANNOVAR. Nat Protoc. 2015;10:1556–1566. doi: 10.1038/nprot.2015.105. [DOI] [PMC free article] [PubMed] [Google Scholar]
- Zhang J, Grubor V, Love CL, Banerjee A, Richards KL, Mieczkowski PA, Dunphy C, Choi W, Au WY, Srivastava G, et al. Genetic heterogeneity of diffuse large B-cell lymphoma. Proc Natl Acad Sci U S A. 2013;110:1398–1403. doi: 10.1073/pnas.1205299110. [DOI] [PMC free article] [PubMed] [Google Scholar]
- Zhang J, Jima D, Moffitt AB, Liu Q, Czader M, Hsi ED, Fedoriw Y, Dunphy CH, Richards KL, Gill JI, et al. The genomic landscape of mantle cell lymphoma is related to the epigenetically determined chromatin state of normal B cells. Blood. 2014;123:2988–2996. doi: 10.1182/blood-2013-07-517177. [DOI] [PMC free article] [PubMed] [Google Scholar]
- Zou H, Hastie T. Regularization and variable selection via the elastic net. Journal of the Royal Statistical Society: Series B (Statistical Methodology) 2005;67:301–320. [Google Scholar]
Associated Data
This section collects any data citations, data availability statements, or supplementary materials included in this article.
Supplementary Materials
A. The heatmap indicates all-pairs Jaccard similarity distance between variants measured from 34 paired FFPE and frozen DLBCL tumors obtained from the same patient. On the diagonal, the similarity for FFPE and Frozen cases from the same individual can be seen. The cases are sorted by sample age, indicated on the horizontal bar graph.
B. We compared the somatic mutation distribution of 30 frozen tumor/normal pairs, and 400 FFPE tumor/normal cases. There is no difference in the distribution (p=0.49, Wilcoxon Rank test). The mean and standard error of the mean of the frozen cases, as well as that of FFPE cases, are super-imposed on the violin plots.
Clinical Information. For each DLBCL patient sequenced, clinical features are shown.
Sample-level statistics. For each DLBCL sample, sequencing library barcode information, estimated tumor purity, sequencer quality metrics, and read count statistics are shown.
Sanger validation. 1130 separate Sanger reactions were performed on DLBCL cases to compare the result obtained by whole-exome sequencing to that observed by Sanger sequencing.
Variant and Individual-level information. Variant genomic location, functional annotation, whether the variant was observed in a Tumor/Normal pair, as well as DLBCL individual-level mutational status.
Copy Number Alterations: Individual gene-level copy number ratios are shown.
Gene and individual-level information. Mutation matrix for the 150 driver genes and 1001 DLBCL patients, with 1 indicating alteration (copy number or mutation), and 0 indicating no alteration.
A. Heatmap of genetic alterations for the paired tumors compared to the unpaired group shows very similar patterns of overlaps and exclusions.
B. Scatterplot of the mutational frequency for the paired and unpaired samples shows a high degree of similarity (R2 = 0.94, P<10−6).
A. Cumulative frequency distribution of normalized sgRNA counts among early and late cell line replicates.
B. Gini evenness indices computed from normalized sgRNA counts for all cell line replicates.
C. Sliding window copy number peak plot with y-axis displaying genes counts in each genomic region with CRISPR scores <5th percentile CRISPR score for a cell line. Red bars indicate genomic regions significantly enriched for genes with negative CRISPR scores (>12) as would be expected in amplified regions. Genes in these regions were discarded from consideration for essential gene status in DLBCL.
D. Gene set membership of genes ranked by CRISPR score. Genes with lower CRISPR scores are significantly more likely to be involved in fundamental cellular processes such as ribosome biosynthesis, DNA replication, transcription and translation.
A. Survival of DLBCL cases with high expression in MYC, BCL2 and their combination - double expressors, show significant survival differences. All tests are log-rank tests.
B. Double expressors (MYC and BCL2 high expression) stratified by ABC and GCB DLBCL subgroups are not associated with survival differences (p=0.25). Association of translocations of MYC (C) and BCL2 (D) with expression, mutations and copy number amplifications were tested in 126 DLBCLs.
E. Survival plots for MYC, BCL2 translocations and double hits (MYC & BCL2 or BCL6 translocations).
The cross-validation performance of the genomic risk model comprised of combinations of DNA and RNA features, is compared to a model with the same features used individually (not in combinations) shows that combinations, i.e., interactions contribute to the superior performance of the genomic risk model.
Gene expression data for ABC/GCB associated genes: Log2 transformed quantile normalized FPKM gene expression data for 775 DLBCL samples.
Genetic alterations: Genetic alterations significantly associated with ABC/GCB subgroups
Significant pairwise associations: Mutual exclusions and overlaps between pairs of genes
CRISPR knockout fitness effects of essential DLBCL genes
Gene set enrichment for essential genes inferred from CRISPR screens
Significant Signatures: Significantly correlated genesets and clusters with signature scores per sample
Genesets vs. Mutations: Mutations significantly associated with genesets are shown in this table
Geneset exemplars: Association of Geneset exemplars with essential genes from CRISPR screens and survival association
Significant survival associations: Genes with significant survival association
Genomic risk model: Combinatorial features used in the survival model
Test set: Predictions from Genomic Risk Model in the test set