Abstract
Here we present preprocessed MRI data of 265 participants from the Consortium for Neuropsychiatric Phenomics (CNP) dataset. The preprocessed dataset includes minimally preprocessed data in the native, MNI and surface spaces accompanied with potential confound regressors, tissue probability masks, brain masks and transformations. In addition the preprocessed dataset includes unthresholded group level and single subject statistical maps from all tasks included in the original dataset. We hope that availability of this dataset will greatly accelerate research.
Keywords: fMRI, human, cognition, preprocessed
Introduction
The recently published Consortium for Neuropsychiatric Phenomics (CNP) dataset 1 is large (272 participants), diverse (healthy controls as well as individuals diagnosed with schizophrenia, bipolar disorder, and attention deficit/hyperactivity disorder), and rich in phenotypic information (each participant filled 42 questionnaires) dataset. It is undoubtedly a rich resource for the academic community. However, before any brain behaviour relationships could be answered, computationally expensive and processing steps need to be performed 2. In addition to requiring a lot of resources, a certain level of expertise in MRI data processing and fMRI task modelling is required before the data could be used to test scientific hypotheses.
To facilitate answering scientific questions using the CNP dataset, we have performed standard preprocessing as well as statistical modeling on the data, and are making the results of these analyses openly available. The preprocessing was designed to facilitate a wide range of analyses, and includes outputs in native (aligned with participants T1 weighted scan), MNI (volumetric) and fsaverage5 (surface) spaces. The data has not been denoised, but potential confound regressors have been calculated for each run, giving researchers the freedom to fit many different models that incorporate different denoising schemes. In addition, we also include group and single subject statistical maps for all tasks available in the original dataset. This preprocessed dataset joins the ranks of similar initiatives for other openly shared datasets 3– 5, and we hope it will be equally useful to the scientific community.
Methods
Preprocessing
For scanning parameters and details of the task fMRI paradigms, see 1. The input dataset was acquired from OpenfMRI.org 6 - accession number ds000030, revision 1.0.3.
Results included in this manuscript come from preprocessing performed using FMRIPREP version 0.4.4 ( http://fmriprep.readthedocs.io), a Nipype 7 based tool. FMRIPREP was run with the following command line arguments:
--participant_label {sid} -w $LOCAL_SCRATCH --output-space T1w fsaverage5 template --nthreads 8 --mem_mb 20000
Where { sid} was the participant label and $LOCAL_SCRATCH was temporary folder for storing intermediate results.
Within the pipeline each T1 weighted volume was corrected for bias field using N4BiasFieldCorrection v2.1.0 8, skullstripped using antsBrainExtraction.sh v2.1.0 (using OASIS template), and coregistered to skullstripped ICBM 152 Nonlinear Asymmetrical template version 2009c 9 using nonlinear transformation implemented in ANTs v2.1.0 10. Cortical surface was estimated using FreeSurfer v6.0.0 11.
Functional data for each run was motion corrected using MCFLIRT v5.0.9 12. Functional data was skullstripped using combination of BET and 3dAutoMask tools and was coregistered to the corresponding T1 weighted volume using boundary based registration with 9 degrees of freedom - implemented in FreeSurfer v6.0.0 13. Motion correcting transformations, transformation to T1 weighted space and MNI template warp were applied in a single step using antsApplyTransformations v2.1.0 with Lanczos interpolation.
Three tissue classes were extracted from T1w images using FSL FAST v5.0.9 14. Voxels from cerebrospinal fluid and white matter were used to create a mask in turn used to extract physiological noise regressors using aCompCor 15. The mask was eroded and limited to subcortical regions to limit overlap with grey matter, six principal components were estimated. Framewise displacement and DVARS 16 was calculated for each functional run using Nipype implementation. In addition to those regressors global signal and mean white matter signal was also calculated.
The whole dataset was preprocessed in total three times. After each iteration the decision to modify the preprocessing was purely based on the visual evaluation of the preprocessed data and not based on results of model fitting. First iteration (using FMRIPREP 0.4.2) uncovered inconsistent output image field of view and issues with EPI skullstripping, second iteration (using FMRIPREP 0.4.3) uncovered two cases of failed normalization due to poor initialization. In the final iteration all those issues were resolved. In total the preprocessing consumed ~22,556 single CPU hours.
For more details of the pipeline see http://fmriprep.readthedocs.io/en/0.4.4/workflows.html.
Volume-based task analysis
For a full description of the paradigms for each task, please refer to 1. We analysed the task data using FSL 17 and AFNI 18, implemented using Nipype 7. Spatial smoothing was applied using AFNI’s 3dBlurInMask with a Gaussian kernel with FWHM=5mm. Activity was estimated using a general linear model (GLM) with FEAT 17. Predictors were convolved with a double-gamma canonical haemodynamic response function 19. Temporal derivatives were added to all task regressors to compensate variability in the haemodynamic response function. Furthermore, the following regressors were added to avoid confounding due to motion: standardised dvars, absolute dvars, the voxelwise standard deviation of dvars, framewise displacement, and the six motion parameters (translation in 3 directions, rotation in 3 directions).
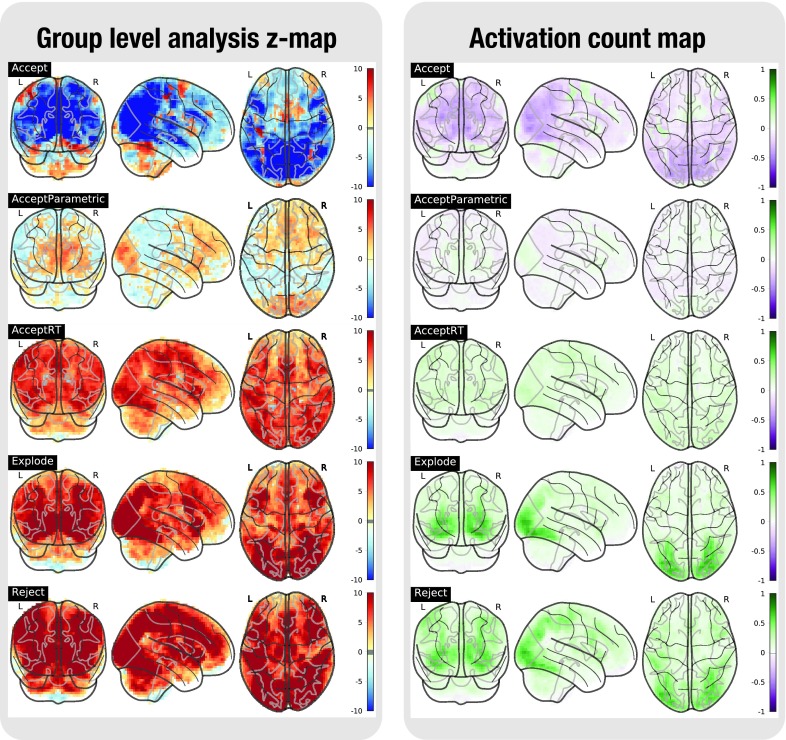
For the Balloon Analog Risk Task (BART), we included 9 task regressors: for each condition (accept, explode, reject), we added a regressor with equal amplitude and durations of 1 second on each trial. Furthermore, we included the same regressors with the amplitude modulated by the number of trials before explosions (perceived as the probability of explosions). The modulator was mean centered to avoid estimation problems due to collinearity. For the conditions that require a response (accept, reject), a regressor was added with equal amplitude, and the duration equal to the reaction time. These regressors were orthogonalised with their fixed-duration counterpart to separate the fixed effect of the trial and the effect covarying with the reaction time. A regressor is added for the control condition.
In the retrieval phase of the Paired-Associate Memory Task (PAMRET), we modelled 4 conditions: true positives, false positives, true negatives, false negatives. For each condition, a regressor is modelled first with fixed durations (3s) and second with reaction time durations, with the latter orthogonalised with the former. With an extra regressor with control trials, there are 9 task regressors in total.
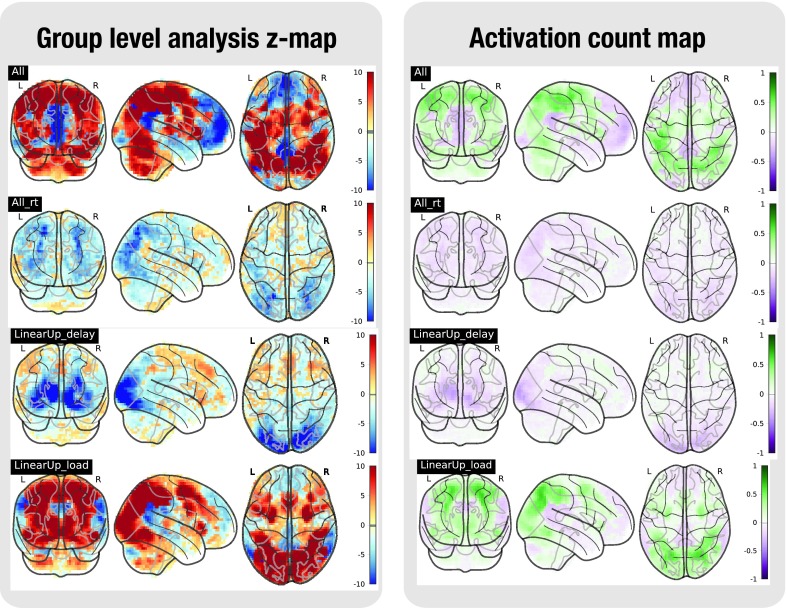
In the Spatial Capacity Task (SCAP), 25 task regressors were included. For each cognitive load (1 - 3 - 5 - 7) and each delay (1.5 - 3 - 4.5) with a correct response, two regressors were added: a regressor with fixed durations of 5 seconds and one with the duration equal to the reaction time, with the second orthogonalised with respect to the first. For both regressors, the onset is after the delay. The last regressor summarises all incorrect trials.
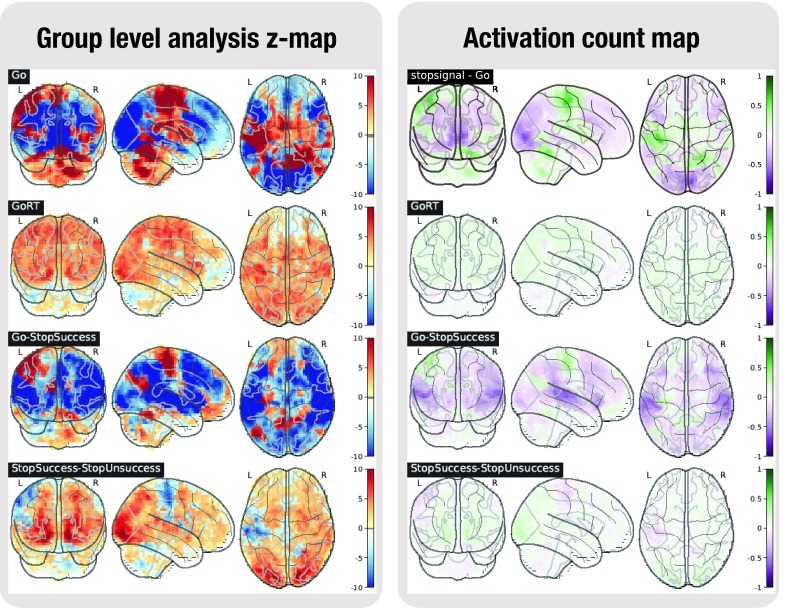
For the Stop-Signal Task (STOPSIGNAL), for each condition (go, stop - succesful, stop - unsuccesful), one task regressor was included with a fixed duration of 1.5s. For the conditions requiring a response (go and stop-unsuccesful), an extra regressor was added with equal amplitude, but the duration equal to the reaction time. Again, these regressors were orthogonalised with respect to the fixed duration regressor of the same condition. A sixth regressor was added with erroneous trials.
In the Task Switching Task (TASKSWITCH), all manipulations were crossed (switch/no switch, congruent/incongruent, CSI delay short/long), resulting in 8 task conditions. As in the SCAP task, we added for each condition two regressors: a regressor with fixed durations of 1 second, and one with the duration equal to the reaction time, with the second orthogonalised with respect to the first. There is a total of 16 regressors.
For subjects who are missing at least one regressor used in the contrasts, the task data are discarded. This is the case for example when no correct answers are registered for a certain condition in the SCAP task. For the SCAP task, we discarded 16 subjects; 14 subjects were removed for TASKSWITCH, 2 subjects for STOPSIGNAL, 2 subjects for BART, and 12 for PAMRET.
All modelled contrasts are listed in the Supplementary material. As is shown, all contrasts are estimated and tested for both a positive and a negative effect.
The total number of subjects modelled in the BART task is 259, while 244 subjects were modelled for the SCAP task. 254 subjects were included the TASKSWITCH task analysis, 197 subjects in the PAMRET task and 255 subjects in the STOPSIGNAL task.
Group level analysis
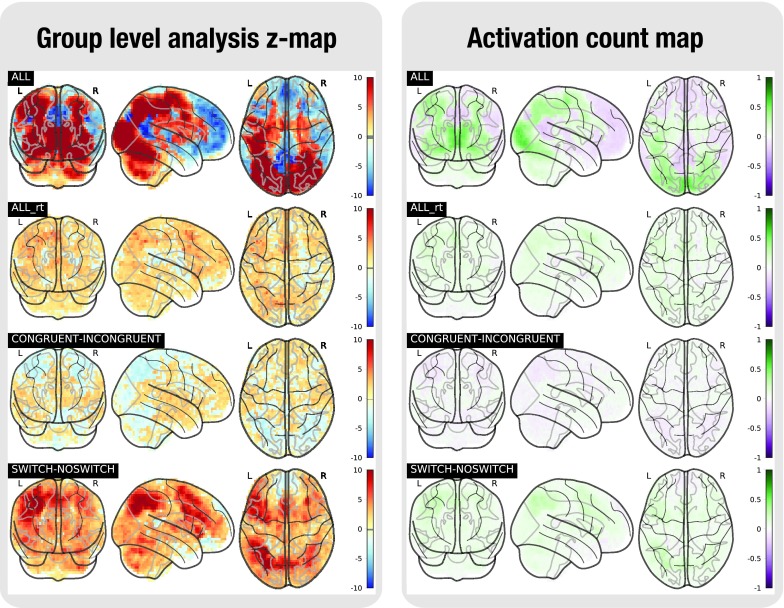
Subsequent to the single subject analyses, all subjects were entered in a one-sample group level analysis for each task. Three second level analysis strategies were followed: (A) ordinary least squares (OLS) mixed modelling using FLAME 17, (B) generalized least squares (GLS) with a local estimate of random effects variance, using FSL 17, and (C) non-parametric modelling (NP) using RANDOMISE 20, with the whole brain first level parameter estimates for each subject as input, and 10,000 permutations. The first two analyses use a group brain mask with voxels that were present in 100% of all subjects. For the permutation tests, a group mask was created where voxels were discarded for further analysis if less than 80% of the subjects have data in those voxels.
In addition to group level statistical maps, activation count maps (ACMs) were generated to show the proportion of participants that show activation, rather than average activation over subjects 21. These maps indicate whether the effects discovered in the group analyses are consistent over subjects. As in 21, the statistical map for each subject is binarized at z=+/-1.65. For each contrast, the average of these maps is computed over subjects. The average negative map (percentage of subjects showing a negative effect with z < -1.65) is subtracted from the average positive map to indicate the direction of effects.
Dataset validation
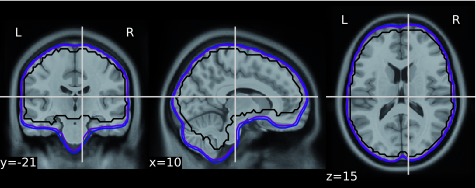
To validate the quality of volumetric spatial normalization we have looked at the overlap of the EPI derived brain masks in the MNI space (across all participants and runs - total of 1,969 masks - see Figure 1). The within subject coregistration and normalization worked well for the vast majority of participants, creating a very good overlap. All of the issues observed while processing the dataset are listed in Table 1.
A selection of the tested contrasts in the task analyses is shown in Figures 2 to 6. Figures were generated using nilearn 22.
Figure 1. Overlap of the EPI derived 1,969 brain masks in the MNI space: voxels inside the blue outlined were present within the mask for 85% of runs, purple: 95% of runs, black 100% of runs.
Table 1. Known issues.
List of problems with the raw data we were aware of at the time of writing that impacted preprocessing.
| Participants affected | Issue |
|---|---|
| 10971, 10501,
70036, 70035, 11121, 10299, 10428 |
Lack of T1w files. Preprocessing was not performed. |
| 11067 | Signal dropout in the cerebellum during BART, rest, SCAP, stop-signal and task switch tasks. |
Figure 2. Task analysis results for the BART task.
In the left plot, the statistical map of the one-sample group test, computed with randomise. The right plot shows the difference between the positive and the negative activation count maps.
Figure 3. Task analysis results for the PAMRET task.
In the left plot, the statistical map of the one-sample group test, computed with randomise. The right plot shows the difference between the positive and the negative activation count maps.
Figure 4. Task analysis results for the SCAP task.
In the left plot, the statistical map of the one-sample group test, computed with randomise. The right plot shows the difference between the positive and the negative activation count maps.
Figure 5. Task analysis results for the STOPSIGNAL task.
In the left plot, the statistical map of the one-sample group test, computed with randomise. The right plot shows the difference between the positive and the negative activation count maps.
Figure 6. Task analysis results for the TASKSWITCH task.
In the left plot, the statistical map of the one-sample group test, computed with randomise. The right plot shows the difference between the positive and the negative activation count maps.
Data and software availability
The preprocessed images were deposited along the original dataset in the OpenfMRI repository – accession number: ds000030 6, under the revision 1.0.4. The preprocessed data is organized according the draft BIDS derivatives specification. All FMRIPREP derivatives are organised under fmriprep/sub-<participant_label>/
Derivatives related to T1 weighted files are in the anat subfolder:
*T1w_preproc.nii.gz - bias field corrected T1 weighted file, using ANTS’ N4BiasFieldCorrection
*T1w_brainmask.nii.gz - brain mask derived using ANTS
*T1w_dtissue.nii.gz -tissue class map derived using FAST.
*T1w_class-CSF_probtissue.nii.gz, *T1w_class-GM_probtissue.nii.gz, *T1w_class-WM_probtissue.nii.gz - probability tissue maps.
All of the above are available in native and MNI space.
*T1w_smoothwm.[LR].surf.gii - smoothed GrayWhite surfaces.
*T1w_pial.[LR].surf.gii - pial surface.
*T1w_midthickness.[LR].surf.gii - MidThickness surfaces.
*T1w_inflated.[LR].surf.gii - FreeSurfer inflated surfaces for visualization.
*T1w_space-MNI152NLin2009cAsym_class-CSF_probtissue.nii.gz, *T1w_space-MNI152NLin2009cAsym_class-GM_probtissue.nii.gz, *T1w_space-MNI152NLin2009cAsym_class-WM_probtissue.nii.gz - probability tissue maps, transformed into MNI space.
*T1w_target-MNI152NLin2009cAsym_warp.h5 Composite (warp and affine) transform to transform participant's T1 weighted image into the MNI space
Derivatives related to EPI files are in the func subfolder:
*bold_space-<space>_brainmask.nii.gz Brain mask for EPI files.
*bold_space-<space>_preproc.nii.gz Motion-corrected (using MCFLIRT for estimation and ANTs for interpolation) EPI file
All of the above are available in the native T1 weighted space as well as the MNI space.
*bold_space-fsaverage5.[LR].func.gii Motion-corrected EPI file sampled to surface.
*bold_confounds.tsv A tab-separated value file with one column per calculated confound (see Methods) and one row per timepoint/volume
The results of the single subject task modeling are available in task/sub-<participant_label>/ and the group level results can be found in task_group/. Each subject-specific folder holds 5 folders - bart.feat, scap.feat, pamret.feat, stopsignal.feat, taskswitch.feat - with the results from the respective task modeling, organised as standard FEAT output. The group-level folder contains a folder for every task, in turn containing a folder for each contrast (see Supplementary material for naming conventions) and below those folders are the results of the three modeling strategies.
In addition, the dataset includes visual quality HTML reports (one per participant).
The results for each contrast in the one-sample group task analyses are deposited and can be interactively viewed in NeuroVault 23: http://neurovault.org/collections/2606/.
Latest source code used to produce the task analyses: https://github.com/poldracklab/CNP_task_analysis
Archived source code as at the time of publication: http://doi.org/10.5281/zenodo.832319 24.
License: MIT license.
All code has been run through a singularity container 25, created from a docker container poldracklab/cnp_task_analysis:1.0 available on docker hub ( https://hub.docker.com/r/poldracklab/cnp_task_analysis/).
Acknowledgements
We would like to thank all of the developers and beta testers of the FMRIPREP package - especially Oscar Esteban, Chris Markiewicz, and Ross Blair.
Funding Statement
This work has been funded by the Laura and John Arnold Foundation. JD has received funding from the European Union’s Horizon 2020 research and innovation programme under the Marie Sklodowska-Curie grant agreement No 706561. The acquisition of the original dataset was supported by the Consortium for Neuropsychiatric Phenomics (NIH Roadmap for Medical Research grants UL1-DE019580, RL1MH083268, RL1MH083269, RL1DA024853, RL1MH083270, RL1LM009833, PL1MH083271, and PL1NS062410).
The funders had no role in study design, data collection and analysis, decision to publish, or preparation of the manuscript.
[version 1; referees: 2 approved with reservations]
Supplementary material
Supplementary File 1: Task fMRI Contrasts.
References
- 1. Poldrack RA, Congdon E, Triplett W, et al. : A phenome-wide examination of neural and cognitive function. Sci Data. 2016;3: 160110. 10.1038/sdata.2016.110 [DOI] [PMC free article] [PubMed] [Google Scholar]
- 2. Poldrack RA, Gorgolewski KJ: Making big data open: data sharing in neuroimaging. Nat Neurosci. 2014;17(11):1510–7, [cited 2014 Oct 28]. 10.1038/nn.3818 [DOI] [PubMed] [Google Scholar]
- 3. Puccio B, Pooley JP, Pellman JS, et al. : The preprocessed connectomes project repository of manually corrected skull-stripped T1-weighted anatomical MRI data. Gigascience. 2016;5(1):45. 10.1186/s13742-016-0150-5 [DOI] [PMC free article] [PubMed] [Google Scholar]
- 4. Bellec P, Chu C, Chouinard-Decorte F, et al. : The Neuro Bureau ADHD-200 Preprocessed repository. Neuroimage. 2017;144(Pt B):275–86. 10.1016/j.neuroimage.2016.06.034 [DOI] [PubMed] [Google Scholar]
- 5. Glasser MF, Sotiropoulos SN, Wilson JA, et al. : The minimal preprocessing pipelines for the Human Connectome Project. Neuroimage. 2013;80:105–24. 10.1016/j.neuroimage.2013.04.127 [DOI] [PMC free article] [PubMed] [Google Scholar]
- 6. Poldrack RA, Barch DM, Mitchell JP, et al. : Toward open sharing of task-based fMRI data: the OpenfMRI project. Front Neuroinform. 2013;7:12. 10.3389/fninf.2013.00012 [DOI] [PMC free article] [PubMed] [Google Scholar]
- 7. Gorgolewski K, Burns CD, Madison C, et al. : Nipype: a flexible, lightweight and extensible neuroimaging data processing framework in python. Front Neuroinform. 2011;5:13. 10.3389/fninf.2011.00013 [DOI] [PMC free article] [PubMed] [Google Scholar]
- 8. Tustison NJ, Avants BB, Cook PA, et al. : N4ITK: improved N3 bias correction. IEEE Trans Med Imaging. 2010;29(6):1310–20. 10.1109/TMI.2010.2046908 [DOI] [PMC free article] [PubMed] [Google Scholar]
- 9. Fonov VS, Evans AC, McKinstry RC, et al. : Unbiased nonlinear average age-appropriate brain templates from birth to adulthood. Neuroimage. 2009;47:S102 10.1016/S1053-8119(09)70884-5 [DOI] [Google Scholar]
- 10. Avants BB, Epstein CL, Grossman M, et al. : Symmetric diffeomorphic image registration with cross-correlation: evaluating automated labeling of elderly and neurodegenerative brain. Med Image Anal. 2008;12(1):26–41. 10.1016/j.media.2007.06.004 [DOI] [PMC free article] [PubMed] [Google Scholar]
- 11. Dale AM, Fischl B, Sereno MI: Cortical surface-based analysis. I. Segmentation and surface reconstruction. Neuroimage. 1999;9(2):179–94. 10.1006/nimg.1998.0395 [DOI] [PubMed] [Google Scholar]
- 12. Jenkinson M, Bannister P, Brady M, et al. : Improved optimization for the robust and accurate linear registration and motion correction of brain images. Neuroimage. 2002;17(2):825–41. 10.1006/nimg.2002.1132 [DOI] [PubMed] [Google Scholar]
- 13. Greve DN, Fischl B: Accurate and robust brain image alignment using boundary-based registration. Neuroimage. 2009;48(1):63–72. 10.1016/j.neuroimage.2009.06.060 [DOI] [PMC free article] [PubMed] [Google Scholar]
- 14. Zhang Y, Brady M, Smith S: Segmentation of brain MR images through a hidden Markov random field model and the expectation-maximization algorithm. IEEE Trans Med Imaging. 2001;20(1):45–57. 10.1109/42.906424 [DOI] [PubMed] [Google Scholar]
- 15. Behzadi Y, Restom K, Liau J, et al. : A component based noise correction method (CompCor) for BOLD and perfusion based fMRI. Neuroimage. 2007;37(1):90–101. 10.1016/j.neuroimage.2007.04.042 [DOI] [PMC free article] [PubMed] [Google Scholar]
- 16. Power JD, Mitra A, Laumann TO, et al. : Methods to detect, characterize, and remove motion artifact in resting state fMRI. Neuroimage. 2013;84:320–41. 10.1016/j.neuroimage.2013.08.048 [DOI] [PMC free article] [PubMed] [Google Scholar]
- 17. Jenkinson M, Beckmann CF, Behrens TE, et al. : FSL. Neuroimage. 2012;62(2):782–90. 10.1016/j.neuroimage.2011.09.015 [DOI] [PubMed] [Google Scholar]
- 18. Cox RW: AFNI: software for analysis and visualization of functional magnetic resonance neuroimages. Comput Biomed Res. 1996;29(3):162–73. 10.1006/cbmr.1996.0014 [DOI] [PubMed] [Google Scholar]
- 19. Glover GH: Deconvolution of impulse response in event-related BOLD fMRI. Neuroimage. 1999;9(4):416–29. 10.1006/nimg.1998.0419 [DOI] [PubMed] [Google Scholar]
- 20. Winkler AM, Ridgway GR, Webster MA, et al. : Permutation inference for the general linear model. Neuroimage. 2014;92:381–97. 10.1016/j.neuroimage.2014.01.060 [DOI] [PMC free article] [PubMed] [Google Scholar]
- 21. Barch DM, Burgess GC, Harms MP, et al. : Function in the human connectome: task-fMRI and individual differences in behavior. Neuroimage. 2013;80:169–89. 10.1016/j.neuroimage.2013.05.033 [DOI] [PMC free article] [PubMed] [Google Scholar]
- 22. Abraham A, Pedregosa F, Eickenberg M, et al. : Machine Learning for Neuroimaging with Scikit-Learn. arXiv [cs.LG]. 2014. Reference Source [Google Scholar]
- 23. Gorgolewski KJ, Varoquaux G, Rivera G, et al. : NeuroVault.org: a web-based repository for collecting and sharing unthresholded statistical maps of the human brain. Front Neuroinform. 2015;9:8. 10.3389/fninf.2015.00008 [DOI] [PMC free article] [PubMed] [Google Scholar]
- 24. Durnez J, Gorgolewski CJ, Poldrack RA: poldracklab/CNP_task_analysis: v0.1. Zenodo. 2017. Data Source [Google Scholar]
- 25. Kurtzer GM, Sochat V, Bauer MW: Singularity: Scientific containers for mobility of compute. PLoS One. 2017;12(5):e0177459. 10.1371/journal.pone.0177459 [DOI] [PMC free article] [PubMed] [Google Scholar]


