

Abstract
Interactions of DNA with proteins are essential for key biological processes and have both a fundamental and practical significance. In particular, DNA binding to anti-DNA antibodies is a pathogenic mechanism in autoimmune pathology, such as systemic lupus erythematosus. Here we measured at the single-molecule level binding and forced unbinding of surface-attached DNA and a monoclonal anti-DNA antibody MRL4 from a lupus erythematosus mouse. In optical trap-based force spectroscopy, a microscopic antibodycoated latex bead is trapped by a focused laser beam and repeatedly brought into contact with a DNA-coated surface. After careful discrimination of non-specific interactions, we showed that the DNA-antibody rupture force spectra had two regimes, reflecting formation of weaker (20–40 pN) and stronger (>40 pN) immune complexes that implies the existence of at least two bound states with different mechanical stability. The two-dimensional force-free off-rate for the DNA-antibody complexes was ~2.2 × 10⁻³ s−1, the transition state distance was ~0.94 nm, the apparent on-rate was ~5.26 s−1, and the stiffness of the DNA-antibody complex was characterized by a spring constant of 0.0021 pN/nm, suggesting that the DNA-antibody complex is a relatively stable, but soft and deformable macromolecular structure. The stretching elasticity of the DNA molecules was characteristic of single-stranded DNA, suggesting preferential binding of the MRL4 antibody to one strand of DNA. Collectively, the results provide fundamental characteristics of formation and forced dissociation of DNA-antibody complexes that help to understand principles of DNA-protein interactions and shed light on the molecular basis of autoimmune diseases accompanied by formation of anti-DNA antibodies.
Keywords: DNA, Anti-DNA antibody, Single-molecule force spectroscopy, Optical trap, Two-dimensional kinetics, Nanomechanics
1 Introduction
Anti-DNA antibodies (Abs) are present in the blood of healthy subjects and can play a protective role in antibacterial host defense [1–3]. Some (patho)physiological conditions, such as infection, pregnancy, emotional stress, and chemotherapy, are characterized by a transient increase of the titers of anti-DNA Abs in the blood that return to the baseline after elimination of the trigger [4, 5]. Anti-DNA Abs are constantly present at a much higher level in the blood of patients with autoimmune diseases, such as systemic lupus erythematosus (SLE), rheumatoid arthritis, and multiple sclerosis, in cancer and cardiovascular pathology [6–8]. Despite many studies on anti-DNA antibodies, their roles in health and especially in diseases remain largely unclear.
The pathogenic potential of anti-DNA Abs depends on their structural and molecular properties. Pathogenic Abs are IgGs that have a high affinity and avidity to double-stranded DNA (dsDNA); they often fix complement and can exhibit cross-reactivity with other antigens (e.g., polynucleotides, phospholipids, polysaccharides, proteoglycans, and proteins), and mediate tissue damage [9–15]. The structural basis and mechanisms of the high affinity of pathogenic anti-DNA Abs to the antigens are not fully understood. Anti-DNA reactivity of Abs might appear as a result of a random hypermutation process and anti-DNA Abs can be coded by mutated V gene segments. Somatic hypermutations in certain positions and particular amino acid residues within the Ab domains can mediate and enhance the anti-DNA affinity which can be crucial for DNA binding [16]. Non-pathogenic anti-DNA Abs do not have nucleotide sequence specificity, while pathogenic Abs have a preference for certain DNA sequences, such as poly(dT) or poly(dG-dC) sequences [17, 18]. DNA-protein and DNA-Ab interactions are relatively strong as characterized by the following equilibrium kinetic parameters. An array of anti-DNA Ab fragments from a phage-displayed homo-VHD library binds to a terminal CTGC motif of 19-bp dsDNA with a Kd of 255 ± 10 nM [19]. Monoclonal Abs (mAbs) from lupus-prone mice V-88 interacts preferentially with the ds GC-rich structures with Kd of 18 ± 8.5 nM. The calculated apparent dissociation rate constants (koff) of the same Ab for (G ± C)25 was equal to 5.3 × 10⁻⁴ s−1 [20].
There are few studies on DNA-mediated interactions employing single-molecule nanomechanical techniques, such as the optical trap, magnetic tweezers, or atomic force microscopy (AFM) [21–23]. The main results of forced unbinding of bimolecular DNA-protein and DNA-peptide complexes can be summarized as follows. The binding strength of a selective interaction between dsDNA and an engineered peptide p007 was 42.1 pN (single-bond rupture event). The force-free off-rate (koff) was 0.32 ± 0.53 s−1, the (γ) was 0.74 nm, and the mean lifetime (toff) of the complex was 3.1 s [24]. These values are comparable with the values obtained in other DNA-peptide or DNA-protein systems measured at the single-molecule level [25–28]. Forced unbinding studies of DNA-protein complexes were complemented with imaging techniques that enabled researchers to track random walks of a repairing factor on DNA strands [29] and much more mechanistic details of individual DNA-protein interactions [30, 31].
Here we visualized bimolecular DNA/anti-DNA-antibody complexes and studied binding and forced unbinding of single Ab and DNA molecules using optical trap-based rupture force spectroscopy. We determined the nanomechanical and kinetic parameters of interactions of a monoclonal anti-DNA antibody MRL4 obtained from an autoimmune lupus mice model with two types of dsDNA (containing single-stranded regions) with different molecular weights from calf thymus or salmon testes. Namely, the force-free off-rate for both surface-attached DNA-antibody complexes was found to be ~2.2 × 10⁻³ s−1, the transition state distance was ~0.94 nm, the apparent on-rate was ~5.26 s−1, and the average stiffness was 0.0021 pN/nm. The numbers suggest that both DNA-antibody complexes are moderately stable, soft, and deformable supramolecular structures that are separated gradually into constituent macromolecules during rupture from at least two bound states with different affinities. The stretching elasticity of the DNA molecules suggests preferential binding of the MRL4 antibody to one strand of DNA. The results obtained provide fundamental characteristics of formation and dissociation of DNA-Ab complexes that underlie immunological reactions in autoimmune diseases associated with production of antinuclear antibodies and immune DNA-Ab complexes.
2 Materials and Methods
2.1 DNA Preparations from Calf Thymus and Salmon Testes
Commercial calf thymus (ctDNA) highly polymerized dsDNA Na-salt (SERVA, Germany) and salmon testes (stDNA) DNA (Calbiochem–EMD Millipore, USA) were used as antigens to form immune complexes with antibodies. As determined by agarose gel electrophoresis, the average molecular weight for stDNA was near 140 base pairs (bp) (from 250 to 100 bp) and for ctDNA near 11,000 bp (from 15,000 up to 850 bp) and a large amount of DNA was stuck on top of the gel due to its high molecular weight (Fig. 1). Hyperchromicity of the DNA preparations was estimated by the changes in absorbance at 260 nm recorded from 25 to 95 °C on a Shimadzu UV-1800 (Japan) spectrophotometer. The hyperchromicity was approximately 13 and 33 % for stDNA and ctDNA, respectively, suggesting that the DNAs were double stranded but contained single-stranded regions. This was confirmed by using the Qubit single-stranded DNA (ssDNA) Assay Kit (Molecular probes, Life technologies, USA) and Qubit 2.0 fluorometer (Invitrogen, USA) that revealed a substantial fraction of ssDNA exceeding 30 % in both DNA preparations. Purity of the DNAs was confirmed by the A260/A280 ratio, which was equal to 1.84 and 1.89 for stDNA and ctDNA, respectively.
Fig. 1.

Electrophoresis of stDNA (a) and ctDNA (b) in a 0.6 % agarose gel stained with GelRed Nucleic Acid Gel Stain (Biotium, USA). The size of molecular weight markers (lower lanes) is shown in base pairs (bp). The plots over the gels represent optical density profiles for the DNA bands
2.2 Purification and Characterization of a Monoclonal Anti-DNA Antibody MRL4
Stably transfected CHO-K1 cell line (ATCC CCL61) producing a MRL4 monoclonal anti-DNA Ab [32] were cultured in advanced DMEM with 10 % (v/v) FBS, L-glutamine, and 0.7 mg/mL Zeocin (2 mM) at 37 °C, 5 % CO2, and 95 % humidity. Large-scale production of the recombinant antibodies was carried out in 225-cm2 flasks (Corning, USA) with Pro-CHO 5 serum-free medium (Lonza, Switzerland). The MRL4 Ab was purified from the culture medium using a protein G-coupled resin (Pierce). The level of Ab production was estimated by ELISA. The purity of the Ab was demonstrated by SDS-PAGE (Fig. 2). The final preparation of Ab was dialyzed against 0.055 M borate buffer (pH 8.5) and protein concentration was determined by NanoDrop 2000 (Thermo Sci., USA) using the extinction coefficient of 1.37 for a 1 mg/ml IgG at 280 nm for a 10-mm beam path length.
Fig. 2.

PAAG (12.5 %) of purified monoclonal recombinant anti-DNA IgG MRL4. Stained by Coomassie R-250. Heavy chain (Hc) and light chain (Lc) of MRL4 are seen. Purity >95 %. The left line (MW) shows molecular weight markers
2.3 Optical Trap-Based Model System to Study Single-Molecule Force Spectroscopy of the DNA-Antibody Interactions
Single-molecule interactions of DNA with an anti-DNA-Ab MRL4 were investigated with an optical trap-based model system described in detail elsewhere [33, 34]. For these studies, two contacting surfaces were coated, each with one type of the interacting molecules. DNA was immobilized covalently on the bottom-attached silica beads (named pedestals), while antibodies were bound covalently to freely moving latex beads. Under microscopic control, an Ab-coated latex bead was trapped in a fluid chamber by a focused laser beam and moved in an oscillatory manner so that the bead was tapping a stationary DNA-coated pedestal anchored to the inner surface of a flow chamber (Fig. 3). When an Ab molecule on the bead interacted with a DNA molecule on the pedestal, the tension was produced while the bead was displaced from a laser focus until the DNA-antibody complex finally ruptured. The force applied to this complex was displayed as a force signal that was proportional to the strength of DNA-antibody binding. Rupture forces from many repeated interactions were collected and displayed as normalized force distribution histograms for each experimental condition.
Fig. 3.

Schematic of the experimental model for investigation of single-molecule DNA-Ab interactions (not to scale). An Ab-coated latex bead was trapped by an oscillating focused laser beam and touched repeatedly to a stationary DNA-coated silica pedestal. A tensile force is generated when DNA and antibody bind while the bead moves away from the pedestal and get displaced from the focus of the beam
2.4 Immobilization of DNA on Polyacrylamide-Coated Silica Pedestals
Spherical silica pedestals 5 μm in diameter were fixed at the bottom of a flow chamber by coating with a thin layer of polyacrylamide gel as described elsewhere [35]. The surface of the pedestals was activated with 12.5 % glutaraldehyde for 2 h at 4 °C. After thorough washing (20× chamber volume) with 0.055 M borate buffer, pH 8.5 (binding buffer), a DNA solution was inserted into the chamber at a saturating concentration of 0.3 mg/ml of ctDNA or 1 mg/ml of stDNA in the binding buffer and allowed to immobilize on the pedestals overnight at 4 °C. After washing the chamber with 20 volumes of the binding buffer to remove unbound DNA, 1 M ethanolamine in the binding buffer was added as a blocker and incubated for 1 h at 4 °C to inactivate residual aldehyde groups on the surface. Before measurements, the flow chamber was washed and equilibrated with 20 volumes of 0.02 M 2-(N-morpholino)ethanesulfonic acid (MES), pH 5, containing 100 mM NaCl, and 0.025 % (v/v) Tween 20 (working buffer). The covalent immobilization of DNA was confirmed by staining the pedestals with acridine orange or Sibr Green II followed by examination by fluorescent confocal microscopy (LSM 510 META, HeNe laser with λ = 488 nm, intensity 3 %) (Fig. 4).
Fig. 4.

Immobilization of stDNA (a, b) and ctDNA (c, d) on clustered polyacrylamide-coated glutaraldehyde-activated silica pedestals. a and c show images of the DNA-coated pedestals in a bright field mode. b and d show fluorescent images of the same pedestals with covalently immobilized stDNA stained by Sibr Green II (b) and ctDNA with acridine orange (d). The fluorescence intensity of control images (DNA physisorption onto non-activated polyacrylamide silica pedestals and glutaraldehyde-activated polyacrylamide-coated pedestals without DNA) were negligible (not shown). Scale bar, 10 μm
2.5 Coating Latex Beads with Antibodies
Abs were bound covalently to carboxylate-modified 2-μm latex beads (Bangs Laboratories, Inc.) activated in suspension (0.2 % solids) with N-(3-dimethylaminopropyl)-N′-ethylcarbodiimide hydrochloride (3 mg/ml, 15 min at room temperature) in 0.1 M MES, pH 5.2. After washing the activated beads with 0.055 M borate buffer, pH 8.5, by centrifugation/resuspension, the Abs were added at a final concentration of 20 μg/ml and incubated with stirring for 30 min at room temperature. Then the beads were incubated for 40 min at 4 °C in the binding buffer with 0.5 M ethanolamine as a blocker to deactivate residual O-acylisourea groups on the surface of the beads. Before the measurements, the beads were centrifuged and resuspended in 0.02 M MES, pH 5, containing 100 mM NaCl, and 0.025 % (v/v) Tween 20 (working buffer) at a final concentration of 107/ml and were flowed into a microscopic chamber with bottom-attached pedestals coated with covalently bound DNA. Under the conditions of bead activation and protein immobilization used in this study, the surface density of antibodies was estimated to be roughly equal to 3000 molecules/μm2 as determined earlier for platelet integrin molecules [36].
2.6 Measurements of the DNA-Antibody Rupture Forces, Data Processing, and Analysis
To measure the rupture force between DNA and Ab, an antibody-coated bead trapped by the laser light was brought to a distance of 2 to 3 μm from the DNA-coated pedestal. After oscillation of the bead was initiated, the bead was brought into contact with the pedestal by micromanipulation using a keyboard-controlled piezoelectric stage. Data collection was initiated at the first contact between the bead and the pedestal. Rupture forces following repeated contacts between the pedestal and the bead were collected for several minutes and were displayed as normalized force histograms for each experimental condition. Because only a small percentage of contact/detachment cycles resulted in effective DNA-Ab binding/unbinding, data from at least 10 experiments representing 2 × 10³–2 × 10⁴ individual measurements were combined. Individual forces measured during each contact-detachment cycle were collected into 5 pN-wide bins. The number of events in each bin was plotted against the average force for that bin after normalizing for the total number of interaction cycles. The percentage of events in a particular force range (bin) represents the probability of rupture events at that tension. Optical artifacts observed with or without trapped latex beads produce signals that appeared as forces below 10 pN [35]. Accordingly, rupture forces in this range were not considered when these data were analyzed. Measurements were performed in the working buffer (0.02 M MES, pH 5, containing 100 mM NaCl, and 0.025 % (v/v) Tween 20). The position of the optical trap and an IgG-coated bead was oscillated in a triangular waveform at 5 Hz with a 1.6-μm peak-to peak oscillation amplitude corresponding to a pulling speed of 12 μm/s and loading rate of 1200 pN/s with a trap stiffness of 0.1–0.2 pN/nm as computed from the bandwidth of Brownian motion. The average duration of contact between interacting surfaces was 0.022 ± 0.004 s. Force signals were collected at 2000 scans per second (0.5 ms time resolution).
2.7 Kinetic Analysis of the DNA-Antibody Interactions
To study the two-dimensional kinetics of DNA-antibody interactions, data analysis was performed using Bell’s model to extract kinetic parameters. According to the Bell’s formalism,
| (1) |
which relates the off-rate koff with a tensile force f. This relation governs the dissociation transition from the bound state (B) to the unbound (dissociated) state (U). Here, the pre-factor k0 is the force-free bond breakage rate (off-rate at a zero force), γ is the distance between the energy minimum of the bound state and the transition state, kB and T are the Boltzmann constant and absolute temperature, respectively. In writing Eq. (1), it is assumed that the transition state distance γ does not change much with the applied force as would be the case for a sharp transition [37]. In the presence of pulling force, the probability of rebinding is small, and the kinetic rate for the reverse association process or on-rate kon can be neglected. Under these conditions, the probability density function of unbinding forces is given by the equation
| (2) |
where rF is the force-loading rate. This expression for P(f) is obtained if we substitute in Eq. (32) of Tees et al. [38] and adjust the constant in the front such that the probability density function P(f) is normalized. In Tees et al., Eq. (32) is for p(t), the probability density function for the time t to failure for the case in which a bond is loaded by a force ramp starting at zero initial force. It was derived using “reliability theory” adapted to ligand receptor dissociation and verified using Monte Carlo simulations. In the kinetic analysis and modeling of the results of experimental measurements, this equation was used to fit the histograms of rupture forces in order to estimate the force-free off-rate koff and the transition state location γ.
After we have obtained force-free off-rate koff and the transition state location, γ, we can obtain the force-free kinetic rate for association kon using the experimental value of the binding probability Pb(t) measured at time t, expressed in terms of koff and kon by the following equation.
| (3) |
where Pb(t) can be measured at time t, koff is obtained by fitting histograms of rupture forces. We thus can calculate kon using this equation.
2.8 Atomic Force Microscopy
To visualize DNA-antibody complexes with atomic force microscopy, ctDNA (10 μg/ml) or stDNA (1 μg/ml) were incubated with mAb MRL4 or normal IgG (50 μg/ml) in a PBS buffer (pH 7.2) for 3 h at 37 °C. Separate Ab and DNA solutions were used for imaging control. To visualize DNA-Ab complexes, the samples containing 5 mM MgCl2 were placed onto freshly cleaved mica, incubated for 3–5 min at room temperature, washed by water, and dried in air. DNA and Abs were visualized using a MFP-3D atomic force microscope (Asylum Research, USA) in the tapping mode in air with a typical scan rate of 1 Hz. Rectangular silicon cantilevers AC160TS-R3 (Olympus) with tip radius 9 nm (k = 26 N/m, f = 300 kHz) were used. Images were processed with IgorPro 6.3.7.2. software.
2.9 Transmission Electron Microscopy
To further study topology of the DNA-Ab interactions, ctDNA (0.15 mg/ml) was incubated with Abs (0.15 mg/ml) in a 0.055 M borate buffer (pH 8.5) for 3 h at 37 °C. Separate Abs and DNA solutions were used for imaging control. The samples were diluted with 50 mM ammonium formate containing 33 % (v/v) glycerol, pH 7, to a final concentration of ~30 μg/ml for DNA and ~30 μg/ml for antibodies and sprayed onto freshly cleaved mica. The samples were rotary shadowed using tungsten overlaid with carbon in a vacuum evaporator (Dayton Vacuum, USA). Shadowed molecules were examined and photographed in the transmission electron microscope JEM-1200 EX (JEOL, Japan).
3 Results
3.1 Visualization of Bimolecular DNA-Antibody Complexes
To confirm DNA-binding activity of the anti-DNA Ab MRL4 used in this study and to reveal the topology of the DNA-Ab interactions, we used AFM and transmission electron microscopy (TEM) of DNA incubated with anti-DNA Abs. Typically, complexes of DNA with Ab molecules formed in the middle of a DNA loop (Figs. 5a, b, 6a). The DNA-bound Ab molecules were visually identical by size, shape, and electron density to control single-molecule images obtained from the same Ab preparation without DNA (Figs. 5c, 6b). The DNA molecules were easily visualized in control TEM images of pure ctDNA (Fig. 6c). As shown by AFM and TEM, monoclonal anti-DNA Ab MRL4 incubated with ctDNA and stDNA were mainly bound to the middle part of DNA molecules. In control experiments with IgG isolated from the blood of healthy humans, no binding to DNA was observed.
Fig. 5.
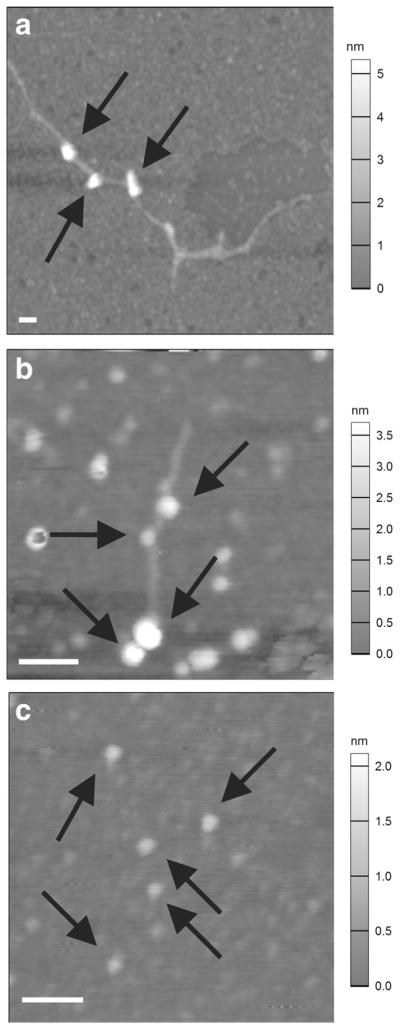
a Typical AFM images of ctDNA–anti-DNA antibody MRL4 complex (arrows); b stDNA–MRL4 complex (arrows); c anti-DNA antibodies MRL4 alone (arrows, control). Scale bar, 100 nm
Fig. 6.
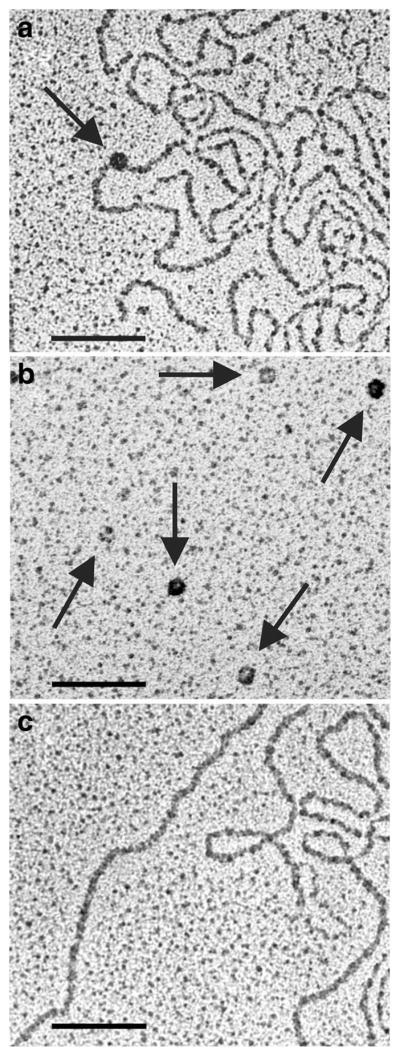
a Representative ctDNA–anti-DNA Ab complex (arrow); b isolated anti-DNA Abs (arrows); and c isolated ctDNA, visualized by transmission electron microscopy. Scale bar, 100 nm
3.2 Non-specific Surface-to-Surface and Protein-to-Surface Background Interactions
To assess the background noise and discriminate non-specific protein-surface interactions from specific binding of an Ab to DNA, control rupture force measurements were performed between pedestals and beads where the possibility of Ab-antigen reactions was excluded. The following pairs of interacting surfaces were analyzed using optical trap-based rupture force spectroscopy: (i) uncoated pedestals and uncoated beads; (ii) uncoated pedestals and non-specific IgG-coated beads; (iii) uncoated pedestals and beads coated with the monoclonal anti-DNA antibody MRL4; (iv) DNA-coated pedestals and uncoated beads (Fig. 7, Table 1). The force histograms obtained show that the rupture forces <20 pN were present with a high probability in all the histograms, meaning that they were required to break non-specific bonds. Therefore, these forces were excluded from further analysis. The non-specific background between uncoated surfaces (Fig. 7a) showed up as weaker forces with a steep exponential displaying rapidly decreasing probability up to 30 pN. IgG-immobilized beads and uncoated pedestals in addition to weak <20 pN forces generated somewhat higher rupture forces of 20–40 pN (Fig. 7b). Monoclonal anti-DNA Ab MRL4 interacted with uncoated pedestals with a higher rupture forces ranging up to 45–50 pN (Fig. 7c). Uncoated beads interacted with DNA on pedestals with forces reaching 55 pN (Fig. 7d). Despite variations in the reactivity of the control surfaces, the vast majority of non-specific and non-immune background interactions were represented by forces below 40 pN with exponentially decreasing probability. These observations were confirmed by the overall cumulative binding probability of control rupture force measurements (Table 1). It is noteworthy that in the control measurements the cumulative binding probability of the forces 20–40 pN did not exceed 5 %, while for the forces >40 pN the highest cumulative probability was 0.5 %. These numbers characterize the incidence of non-specific surface-to-surface and protein-to-surface background interactions typically measured by the instrument.
Fig. 7.

Normalized rupture force histograms of non-specific interactions. a Control histogram of non-specifically interacting uncoated surfaces. Interactions of IgG-coated (b) and MRL4 anti-DNA Ab-coated (c) beads with uncoated pedestals. d Interactions of DNA-coated pedestals and uncoated beads. Signals that appeared as forces below 10 pN due to optical artifacts were considered nonbinding events or zero
Table 1.
Cumulative binding probability for interacting surfaces, uncoated and coated with various immunoglobulins and DNA
| Interacting molecular pairs and control uncoated surfaces | Cumulative probability, % (mean ± SEM) | Figure(s) | |
|---|---|---|---|
|
| |||
| Forces 20–40 pN | Forces >40 pN | ||
| Controls for non-specific surface-to-surface interactions | |||
| No DNA and no Abs | 0.5 ± 0.3 | 0.2 ± 0.1 | 7A |
| No DNA and IgG | 3.5 ± 1.2 | 0.11 ± 0.05 | 7B |
| No DNA and MRL4 anti-DNA monoclonal Ab | 4.8 ± 2.4 | 0.4 ± 0.2 | 7C |
| stDNAa and no Abs | 1.7 ± 0.7 | 0.4 ± 0.2 | 7D |
| ctDNAb and no Abs | 1.8 ± 0.8 | 0.5 ± 0.4 | 7D |
| Controls for non-immune DNA-protein interactions | |||
| stDNA and IgG | 9.2 ± 1.1 | 1.3 ± 0.2 | 8C and 9A |
| ctDNA and IgG | 9.3 ± 2.1 | 1.1 ± 0.3 | 8D and 9B |
| Specific DNA-Ab interactions | |||
| stDNA and anti-DNA mAb MRL4 | 14.1 ± 1.7 | 11.6 ± 8.6 | 8A and 9A |
| ctDNA and anti-DNA mAb MRL4 | 18.1 ± 1.6 | 10.9 ± 4.6 | 8B and 9B |
Salmon testes DNA
Calf thymus DNA
3.3 Specific Interactions of the Monoclonal Anti-DNA Antibody MRL4 with ctDNA and stDNA
To determine the rupture force profile of DNA-Ab complexes, we measured the interactions of two types of DNA (stDNA and ctDNA) with a highly specific monoclonal anti-DNA Ab MRL4 (Fig. 8). The rupture force profiles for the stDNA-Ab and ctDNA-Ab interactions were similar and characterized by a broad force spectrum up to 65–70 pN with a relative preference towards ctDNA (Table 1). Based on the control experiments, we segregated this force profile into three parts corresponding to weak non-specific forces <20 pN (excluded from the analysis), intermediate forces 20–40 pN, and strong forces >40 pN. The cumulative binding probability for the intermediate and strong forces are shown in Table 1. Two main features were revealed that made the DNA-antibody force spectra different from the controls (Fig. 7). First, the specific interactions were characterized by a pronounced peak of strong forces >40 pN (cumulative probability 11–12 versus 0.5 % in control) with the most probable forces peaking at 55–60 pN. Second, the intermediate interactions 20–40 pN were 3–3.5-fold more frequent than in the non-specific controls (14–18 versus 5 % in control) (Fig. 8a, b; Table 1).
Fig. 8.

Normalized rupture force histograms of the interactions of a monoclonal anti-DNA Ab MRL4 (a, b) and non-specific IgG (c, d) with stDNA (a, c) or ctDNA (b, d). Two force regimes are highlighted: the intermediate interactions at 20–40 pN (gray) and strong interactions >40 pN (black)
To correct for non-immune DNA-IgG interactions, we performed control measurements of both stDNA and ctDNA with non-specific immunoglobulins (IgG) (Fig. 8c, d). Although the overall reactivity of the DNA- and IgG-coated surfaces was much higher than in the control experiments shown in Fig. 7, the cumulative binding probabilities for both parts of the force spectra analyzed were substantially lower than for the DNA-MRL4 Ab interactions (Fig. 8a, b). The differences were especially pronounced for the strong forces (~1 versus 11–12 % for DNA-IgG and DNA-MRL4 interactions, respectively), indicating that the forces >40 pN reflect the specific portion of DNA-Ab interactions. The cumulative binding probabilities of the intermediate forces were also distinct (9 versus 14–18 % for DNA-IgG and DNA-MRL4 interactions, respectively). Thus, the rupture force profile of specific DNA-Ab interactions was quite different from all non-specific non-immune interactions and did not depend much on the type of DNA studied.
The relative reactivity of various IgGs studied towards two different types of DNA is summarized in Fig. 9. The height of the bar reflects the overall probability of forces >20 pN. Each bar is segregated into intermediate (gray) and strong (black) force regimes. It is clear that anti-DNA Abs have a much higher reactivity for DNA compared to non-immune control interactions. The DNA-mAb interactions were characterized by the stronger and specific binding interactions both for stDNA and ctDNA.
Fig. 9.
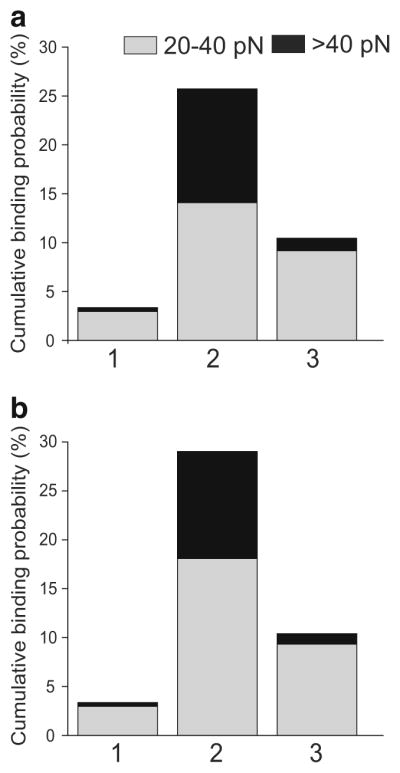
Average cumulative binding probabilities for various immunoglobulins interacting with stDNA (a) and ctDNA (b). The intermediate forces from 20 to 40 pN are in gray and strong forces >40 pN are in black. (1) Non-specific interactions (mean of all interacting surface pairs shown in Fig. 8); (2) a monoclonal anti-DNA Ab MRL4; (3) IgG, a control for non-immune interactions
3.4 Analysis of the Kinetics of the DNA-Antibody Interactions
In the raw data, we typically have two peaks in the histograms of unbinding force. The first peak is around 10 pN and the second peak is around 55 pN (Fig. 10). It has been shown earlier that the first peak corresponds to non-specific interactions between the bead and the pedestal. We used the probability density function of unbinding forces (Eq. 2) from Bell’s model [39] to fit the second peak of the histogram. We then analyzed the kinetics of DNA-antibody interactions using a force-free kinetic rate to obtain the association (on-rate) kon [34].
Fig. 10.

Rupture force histograms (bars) and Bell’s model fits (curves) from two representative fitting exercises for the peaks of specific DNA-Ab forces >40 pN (inserts). a Fitting parameters are rF = 1200 pN/s, k0 = 0.0012 s−1, γ = 0.979 nm; b fitting parameters are rF = 1200 pN/s, k0 = 0.0026 s−1, γ = 0.91 nm
From the experiment, the loading rate is rF = 1200 pN/s. We left the dissociation rate k0 and transition state position γ as fitting parameters for the histograms obtained from the experiments. We used a nonlinear least squares method to fit the data with Eq. (2). Figure 10 shows two examples of fits to the histograms. We have chosen the bin size of the histogram according to the method that minimizes adaptive mean integrated squared error [40].
With the above estimates for koff, we used Eq. (3) to estimate kon′. From the experiments, we have Pb(t) = 0.11 ± 0.05 and t = 0.022 ± 0.004 s. Substituting these values together with kon obtained from histogram fitting and koff = k0 (zero force), we get kon′ = 5.26 ± 2.5 s−1.
Various shapes of DNA-antibody forced unbinding signals. For quantitative analysis of the rupture force spectra, we used ramped force unbinding signals that were computationally recognized and processed. A typical single force signal (Fig. 11a) shows a small positive peak that reflects a compressive force exerted by a trapped bead on a pedestal. The large negative peak has a linear decay that reflects a ramping force that increases until the antigen-Ab complex yields to this force, after which the signal returns to zero. When the bead and pedestal touch each other repeatedly, the signals described appear every time when a DNA-Ab complex is formed and dissociated by the tensile force. These signals comprise the main source of quantitative information characterizing the probability and strength of the antigen-Ab interaction.
Fig. 11.

Data traces extracted from raw files showing various types of rupture force signals generated by the optical trap during forced unbinding of DNA-Ab complexes. The binding/unbinding events were detected as voltage signals calibrated in force units. Positive peaks reflect a compressive force exerted by a trapped bead on a pedestal upon touching. a Negative linear signal reflecting a one-step single-molecule unbinding event; b jagged two-step signal indicative of multiple interactions and stepwise unbinding; c a signal showing elastic elongation preceding unbinding; d signal with a rupture-force plateau (isometric stretching); e–g complex signals with a combination of unbinding scenarios: isometric stretching with elongation (e); isometric stretching and stepwise unbinding (f); isometric stretching, stepwise unbinding, and elastic elongation (g)
In addition to these major signals, we observed visually a number of unusual signals with a more complicated profile. These unusual signals comprised about 10 % of all unbinding events and were automatically excluded from the data analysis for rupture force spectroscopy. The uncommon signals shown in Fig. 11b–g could be grouped as follows: (i) jagged two-step signals (Fig. 11b); (ii) signals deviating from the linear ramp force (elastic elongation) (Fig. 11c); (iii) signals with a rupture-force plateau (isometric stretching) (Fig. 11d); (iv) complex combined signals (Fig. 11e–g). It is clear that each type of the nonlinear rupture force signals reflects a distinct unbinding scenario with underlying molecular mechanisms. The jagged signals reflect multistep unbinding due to multiple intermolecular interactions, likely originating from the bivalent nature of antibodies and/or a high surface density of DNA. The nonlinear unbinding force signals reflect molecular deformations (elastic or non-elastic) that precede the rupture event. Such complicated nanomechanics is most likely attributed to elongation of DNA molecules and can provide important information about the viscoelastic properties of DNA, Abs, and their complexes, which we analyze below. Of note, the variability of the types of unbinding signals observed in this work suggests that they reflect complex unusual mechanisms of binding and forced unbinding of DNA-antibody immune complexes.
3.5 Nanomechanics of DNA During Forced Unbinding of DNA-Antibody Complexes
We modeled the DNA molecule as being in series with a “spring” that represents the stiffness of the optical trap (Fig. 12). The extension is the sum of the extension of DNA molecule as well as that of this “spring”.
Fig. 12.

Fits of the force versus time data from the optical trap. The top two panels are for stDNA and the bottom two panels are for ctDNA. The curves were fitted to Eq. (5) using MATLAB’s curve fitting tool box. The values of Kuhn length obtained from the fits were close to the Kuhn lengths for single-stranded DNA
Since the trap is being pulled with a constant velocity v, we can write:
| (4) |
Here x1 is the extension of the DNA and x2 is the displacement of the optical trap from the center of the laser beam. In our experiments, the DNA is a mixture of single- and double-stranded DNA. Double-stranded DNA has Kuhn length about 100 nm and extensional stiffness about 1400 pN [41], while single-stranded DNA has Kuhn length about 1.5 nm and extensional stiffness around 48 pN [42]. Thus, independent of whether a small or large fraction of single-stranded DNA is present, we expect that most of the compliance comes from single-stranded DNA. So, we assume a freely jointed chain model for the dependence of x1 on F. The trap stiffness is Kf so that displacement x2(t) = F/Kf. Plugging these into the expression for x above we get the following relation between the force F as a function of time t:
| (5) |
where L0 is the contour length of the single-stranded DNA (ssDNA), b is its Kuhn length, and K0 is the stiffness of the ssDNA. In reality, the stiffness K0 contains contributions from ssDNA as well as the DNA-Ab complex. We will come back to this point later. In the experiments v = 12,000 nm/s, T = 300 K, and the trap stiffness is Kf = 0.1 pN/nm. We leave b, K0, and L0 as fitting parameters. The lengths L0 are known to lie in a certain range for both stDNA and ctDNA, so we provide this range as a constraint to the fitting algorithm, for ctDNA its 600–6000 nm and for stDNA its 30–100 nm. We find that 1.5 nm < b < 3 nm which is very close to 1.5 nm for ssDNA [42] and K0 is in the range from 0 to 10 pN, which is on the order of its true value. This is consistent with our assumption that most of the compliance in these experiments comes from ssDNA. Some of these fits for both stDNA and ctDNA are shown in Fig. 12. In order to confirm that double-stranded DNA makes no contribution to the compliance, we also tried an extensible worm-like-chain model [41] for x1(F), but found that it does not give good fits to extension data. From the range of Kuhn lengths obtained in our fits, we surmised that either one or two strands of ssDNA are being extended by the optical trap.
The K0 calculated above is the composite stiffness of two springs in series—the ssDNA and the DNA-Ab complex. So we can use values for K0 from our fits and values for the extensional stiffness of the ssDNA to estimate the stiffness of the DNA-Ab complex. From [42] we obtain the stiffness for ssDNA KD = 48 pN. We used the following equation to calculate the stiffness of DNA-Ab complex:
| (6) |
where KC is the stiffness of the DNA-Ab complex and K0 was obtained by fitting the experimental data. Stiffness appears in the denominator in Eq. (6); since the extensional stiffness of double-stranded DNA is very large in comparison to single-stranded DNA, it will make a negligible contribution, and is hence excluded from Eq. (6). Even though the contour lengths for stDNA and ctDNA are different, we find that KC varied only over a small range. We find that the average stiffness of the DNA antigen-antibody complex is KC = 0.0021 ± 0.0003 pN/nm, which varies over a small range and is much smaller than the stiffness of the optical trap.
4 Discussion
4.1 Importance of DNA-Ab Interactions
Mechanisms of antigen-Ab interactions are a fundamental problem of molecular immunology and molecular biology because it is a general model system to study specific biomolecular recognition. DNA is a very special type of antigen, and information about DNA-containing immune complexes is particularly important in at least two respects. First, DNA-Ab interactions exemplify DNA-protein interactions that underlie many key biological processes, such as transcription, regulation of a gene expression, etc. Second, formation and properties of DNA-Ab complexes are important pathogenic factors because anti-DNA Abs are produced in autoimmune diseases as a part of antinuclear Abs in response to tissue damage and exposure of nuclear antigens to blood [12, 16]. SLE is an autoimmune connective tissue disease that is characterized by the production of anti-DNA IgG antibodies and formation of immune Ab-DNA/nucleosome complexes that mediate inflammation in organs, for example in the kidney, thus inducing a serious complication of SLE known as “lupus nephritis”. [43, 44]. Mechanisms of anti-DNA antibody production and the basis of their pathogenicity remain largely unknown. There are no exact properties that would allow us to distinguish non-pathogenic versus pathogenic anti-DNA Abs and their complexes with polynucleotide antigens. Therefore, understanding the molecular characteristics of pathogenic DNA-Ab complexes, including mechanisms of their formation and dissociation, are very important. The main goal of this research was to determine quantitative as well as qualitative characteristics of the interactions of a monoclonal anti-DNA IgG antibody with DNA at the single-molecule level.
4.2 A Model System for Single-Molecule Force Spectroscopy
Here we used a recombinant humanized monoclonal anti-DNA IgG Ab MRL4 obtained initially from an autoimmune lupus mouse model [32]. MRL4 contains V domains which differ by only few residues from VH and VL of a DNA-hydrolyzing autoantibody BV04-01 from lupus-prone mouse [45]. The MRL4 Ab is highly specific for both ssDNA and dsDNA with preferential binding to ssDNA [46]. Abs against both ssDNA and dsDNA, like mAb MRL4, may be involved in the development of SLE because they were isolated from the kidneys in murine SLE models and SLE patients [12, 47].
To obtain precise nanomechanical and kinetic characteristics of the DNA-Ab interactions, we measured the binding of mAb MRL4 to DNA at the single-molecule level while minimizing effects of avidity and other auxiliary intermolecular interactions. To explore the bimolecular DNA-mAb interactions, we measured their binding and unbinding using optical trap-based force spectroscopy, a biophysical methodology that we developed previously and applied successfully to quantify several different protein-ligand interactions [33–35]. Basically, in this technique, a microscopic Ab-coated latex bead is trapped by a focused laser beam and repeatedly brought into contact with a DNA-coated pedestal. When the Ab on the bead binds non-covalently to the DNA on the pedestal, the bead is displaced from the moving optical trap center to generate a pulling force that increases linearly until the moment of forced dissociation of the complex (Fig. 3). The binding probability and the rupture forces are then measured to characterize the interaction properties of the Ab and the antigen (DNA). It is noteworthy that, in addition to the optical trap, AFM-based rupture force spectroscopy has been widely used to study individual protein-ligand interactions [24–26, 28, 48]; however, the optical trap is more sensitive and accurate at lower forces of the order of piconewtons, while AFM usually operates in the nanonewton force range [49].
4.3 Specific and Non-specific Interactions
The lower force limit of our measurement system, as determined by thermal fluctuations of the trapped bead, is ~10 pN and the upper level limited by the trap stiffness and a bead size is about 150 pN. Therefore, only those bonds that rupture at forces in the range 10–150 pN are detectable. Careful control experiments (Table 1, Fig. 7) show that the large majority of the non-specific interactions occur with rupture forces below 20 pN. Accordingly, we focused our attention on the yield forces in the range of >20 pN, which was segregated into intermediate (20–40 pN) and strong (>40 pN) force regimes. The intermediate and strong rupture force regimes both resulted from Ab bound to DNA, but were different in a number of important characteristics. First of all, they were differentially sensitive to elimination of either DNA or anti-DNA Abs from one of the interacting surfaces with the intermediate interactions being less sensitive, whereas the stronger interactions were more effectively inhibited by substituting specific reactants for inert molecules (Table 1). These data suggest that the intermediate forces (20–40 pN) comprise a combination of non-specific and specific DNA-Ab interaction, while the stronger force regime (>40 pN) reflects specific immune DNA-Ab interactions. Unlike control IgG, the mAb MRL4 molecules were found attached to ctDNA and stDNA molecules, indicating specific DNA-Ab interactions. Notably, the Ab always bound to the curved middle part of DNA, not to a straight portion or an end, suggesting that bending of the DNA strands may facilitate exposure of an epitope. It is noteworthy that the interactions of ctDNA and stDNA with mAb, either in the imaging or in the force spectroscopy experiments, were basically similar (Table 1, Fig. 8), suggesting that the basic mechanisms of DNA-Ab interactions do not depend on the size and origin of DNA. Perhaps anti-DNA antibody MRL4 recognizes identical sequences and/or similar conformations in the DNA samples used in this study [16, 18].
4.4 Kinetics of the DNA-Ab Interactions
The rupture forces >40 pN for DNA-Ab interactions have a peak at 55–60 pN that can be mathematically analyzed to extract two-dimensional kinetic parameters, provided the results reflect single-molecule binding and unbinding. Based on the literature [50–53] and our own experience of nanomechanical measurements [33, 54, 55], several independent criteria are usually taken into account to distinguish single-molecule events from multiple receptor-ligand interactions. All of these criteria are applicable to our study.
The incidence of the specific DNA-Ab interactions was near 10 %, meaning that statistically the probability of multiple interactions was less than 1 %.
The rupture of a single attachment always occur in onestep, whereas the rupture of multiple attachments usually occurs in a sequence of multiple steps reflected as a jagged force signal. Only single-step interactions were included in the data analysis in this study.
The strength of multiple DNA-Ab interactions is likely remained unmeasured due to the inability of the optical trap to measure the strength of interactions more 100 pN.
These and some other arguments support a conclusion that the vast majority of DNA-Ab interactions measured in this study was bimolecular, thus justifying the applied mathematical model used to extract single-molecule kinetic parameters of the DNA-Ab interactions.
Using Bell’s formalism [39], we obtained a number of kinetic parameters for the DNA-Ab interactions. The off-rate of force-free dissociation (k0) was ~2.22 × 10⁻³ s−1 for DNA-Ab complexes with both types of DNA, indicating that their stability was similar. Our value of k0 is much higher than the k0 = 5.4 × 10⁻⁶ s−1 for streptavidin/biotin complex [56], meaning that the DNA-Ab complexes are much weaker. However, the off-rate obtained is within the range reported for DNA-antibody or DNA-protein interactions, for example, the koff of D17.4 DNA aptamer/IgE complex was calculated to be (2.92 ± 0.18) × 10−3 s−1 or (2.85 ± 0.14) × 10−3 s−1 depending on the environmental conditions [57, 58]. Giuntoli et al. [59] showed that the rate of dissociation from DNA of the Escherichia coli nucleoid protein Fis was approximately koff ~ 8 × 10⁻³ s−1.
Another important parameter of binding interactions is the transition state position (distance), γ, which can be interpreted as the distance of molecular separation at which the bond fails. The average value for γ was ~0.94 nm, which is nearly two to three times longer than usually reported for protein-protein interactions, but this is consistent with the fact that the stiffness of the bond between DNA and the antibody is low and it could be deformed before the unbinding occurred.
4.5 Nanomechanics of the DNA-Ab Complexes
In our experiments we observed unusual nonlinear DNA-Ab rupture force signals that reflected a complicated unbinding pathway of the DNA-antibody immune complexes, such as molecular deformations that provided important information about viscoelastic properties of DNA, antibodies, and their DNA-antibody immune complexes. First of all, we have found that the stiffness of the DNA-antibody complex corresponds to the known mechanical properties of single-stranded DNA (ssDNA) rather than dsDNA. This finding is consistent with the chemical characteristics of the DNA preparations used in this study, both of which contained a substantial fraction of ssDNA. This finding also confirms that the anti-DNA Ab MRL4 binds preferentially to a single-stranded DNA [46]. Alternatively, during unbinding of a DNA-Ab immune complex, one strand of DNA is stretched apart, while the other is covalently attached to the surface.
The finding that the DNA-Ab interactions can be mediated by ssDNA is also not very different from imagining the ssDNA as a “linker” between the Ab-antigen complex and the force measuring device. Since the forces exerted on the ssDNA are large, any secondary structures as well as thermal fluctuations in it are completely extended at the forces that cause rupture of the complex. For these large forces, the ssDNA molecule is straight and the bonds connecting its monomers stretch slightly as a linear spring that is in series with the antibody complex. Since the stiffness of these two springs in series is known from our fits to the experimental data, the stiffness of the DNA-Ab complex was extracted using Eq. 2 and turned out to be equal to KC = 0.0021 pN/nm. We have found that stiffness of the complex varies over a small range and is much smaller than the stiffness of the optical trap.
5 Conclusion
In this work some fundamental aspects of the DNA-protein interactions were determined at the single-molecule level using optical trap-based force spectroscopy of surface-attached DNA-Ab complexes. The rupture force histograms displayed two force regimes with intermediate and stronger binding interactions, reflecting the existence of at least two bound states with different affinities, which needs to be further explored. The force-free off-rate of the order of 2 × 10⁻³ s−1 characterizes the DNA-Ab complex as moderately stable and the average transition state distance of 0.94 nm implies that the complex is not brittle and its forced unbinding occurs gradually rather than abruptly. The spring constant of the DNA-Ab complex was found to be 2 orders of magnitude smaller than the optical trap stiffness which characterizes the DNA-Ab immune complex as a relatively soft and deformable structure. The nanomechanical parameters suggest that binding of an anti-DNA monoclonal Ab MRL4 is preferably mediated by a single-stranded DNA, suggesting that this mAb has a preference towards ssDNA over dsDNA in autoimmune diseases characterized by generation of anti-DNA Abs.
Acknowledgments
This work was supported by NIH grants U01-HL116330, R56 HL090774 and PO1-HL110860, NSF grant DMR 1505662, and the Program for Competitive Growth at Kazan Federal University.
Footnotes
Author Contributions The manuscript was written through contributions of all authors. All authors have given approval to the final version of the manuscript.
Compliance with Ethical Standards
Conflict of Interest The authors declare that they have no conflict of interest.
References
- 1.Pisetsky DS. Antibody responses to DNA in normal immunity and aberrant immunity. Clinical and Diagnostic Laboratory Immunology. 1998;5:1–6. doi: 10.1128/cdli.5.1.1-6.1998. [DOI] [PMC free article] [PubMed] [Google Scholar]
- 2.Williams WM, Isenberg DA. A cross-sectional study of anti-DNA antibodies in the serum and IgG and IgM fraction of healthy individuals, patients with systemic lupus erythematosus and their relatives. Lupus. 1996;5:576–586. doi: 10.1177/096120339600500604. [DOI] [PubMed] [Google Scholar]
- 3.Uchida K. Natural antibodies as a sensor of electronegative damage-associated molecular patterns (DAMPs) Free Radical Biology and Medicine. 2014;72:156–161. doi: 10.1016/j.freeradbiomed.2014.03.016. [DOI] [PubMed] [Google Scholar]
- 4.Lora V, Bonaguri C, Gisondi P, Sandei F, Battistelli L, Russo A, et al. Autoantibody induction and adipokine levels in patients with psoriasis treated with infliximab. Immunologic Research. 2013;56:382–389. doi: 10.1007/s12026-013-8410-2. [DOI] [PubMed] [Google Scholar]
- 5.Quan CP, Watanabe S, Pamonsinlapatham P, Bouvet J-P. Different dysregulations of the natural antibody repertoire in treated and untreated HIV-1 patients. Journal of Autoimmunity. 2001;17:81–87. doi: 10.1006/jaut.2001.0529. [DOI] [PubMed] [Google Scholar]
- 6.Williamson RA, Burgoon MP, Owens GP, Ghausi O, Leclerc E, Firme L, et al. Anti-DNA antibodies are a major component of the intrathecal B cell response in multiple sclerosis. Proceedings of the National Academy of Sciences of the United States of America. 2001;98:1793–1798. doi: 10.1073/pnas.031567598. [DOI] [PMC free article] [PubMed] [Google Scholar]
- 7.Compagno M, Rekvig OP, Bengtsson AA, Sturfelt G, Heegaard NH, Jönsen A, et al. Clinical phenotype associations with various types of anti-dsDNA antibodies in patients with recent onset of rheumatic symptoms. Results from a multicentre observational study. Lupus Science and Medicine. 2014;1:e000007. doi: 10.1136/lupus-2013-000007. [DOI] [PMC free article] [PubMed] [Google Scholar]
- 8.Gorny MK, Lawniczak M, Jenek R, Słowik-Gabryelska A, Kaczmarek E, Zeromski J. Alloantibodies, autoanti-bodies, and immune complexes in patients with lung cancer. Lung. 1988;166:97–105. doi: 10.1007/BF02714033. [DOI] [PubMed] [Google Scholar]
- 9.Barbas SM, Ditzel HJ, Saloneh EM, Yang WP, Silverman GJ, Burton DR. Human autoantibody recognition of DNA. Proceedings of the National Academy of Sciences of the United States of America. 1995;92:2529–2533. doi: 10.1073/pnas.92.7.2529. [DOI] [PMC free article] [PubMed] [Google Scholar]
- 10.Suenaga R, Abdou NI. Cationic and high affinity serum IgG anti-dsDNA antibodies in active lupus nephritis. Clinical and Experimental Immunology. 1993;94:418–422. doi: 10.1111/j.1365-2249.1993.tb08211.x. [DOI] [PMC free article] [PubMed] [Google Scholar]
- 11.Deocharan B, Qing X, Beger E, Putterman C. Antigenic triggers and molecular targets for anti-double-stranded DNA antibodies. Lupus. 2002;11:865–871. doi: 10.1191/0961203302lu308rr. [DOI] [PubMed] [Google Scholar]
- 12.Madaio MP, Yanase K. Cellular penetration and nuclear localization of anti-DNA antibodies: mechanisms, consequences, implications and applications. Journal of Autoimmunity. 1998;11:535–538. doi: 10.1006/jaut.1998.0217. [DOI] [PubMed] [Google Scholar]
- 13.Putterman C. New approaches to the renal pathogenicity of anti-DNA antibodies in systemic lupus erythematosus. Autoimmunity Reviews. 2004;3:7–11. doi: 10.1016/S1568-9972(03)00082-X. [DOI] [PubMed] [Google Scholar]
- 14.Ullala AJ, Marion TN, Pisetsky DS. The role of antigen specificity in the binding of murine monoclonal anti-DNA antibodies to microparticles from apoptotic cells. Clinical Immunology. 2014;154:178–187. doi: 10.1016/j.clim.2014.05.007. [DOI] [PMC free article] [PubMed] [Google Scholar]
- 15.Foster MH, Kieber-Emmons T, Ohliger M, Madaio MP. Molecular and structural analysis of nuclear localizing anti-DNA lupus antibodies. Immunologic Research. 1994;13:186–206. doi: 10.1007/BF02918279. [DOI] [PubMed] [Google Scholar]
- 16.Aranow C, Zhou D, Diamond B. Anti-DNA antibodies: structure, regulation and pathogenicity. In: Lahita RG, Tsokos G, Buyon JP, Koike T, editors. Systemic lupus erythematosus. 5. Academic Press; 2011. pp. 235–258. [Google Scholar]
- 17.Shlomchik M, Mascelli M, Shan H, Radic MZ, Pisetsky D, Marshak-Rothstein A, et al. Anti-DNA antibodies from autoimmune mice arise by clonal expansion and somatic mutation. Journal of Experimental Medicine. 1990;171:265–292. doi: 10.1084/jem.171.1.265. [DOI] [PMC free article] [PubMed] [Google Scholar]
- 18.Uccellini MB, Busto P, Debatis M, Marshak-Rothstein A, Viglianti GA. Selective binding of anti-DNA antibodies to native dsDNA fragments of differing sequence. Immunology Letters. 2012;143:85–91. doi: 10.1016/j.imlet.2012.01.003. [DOI] [PMC free article] [PubMed] [Google Scholar]
- 19.Jin H, Sepulveda J, Burrone OR. Specific recognition of a dsDNA sequence motif by an immunoglobulin VH homodimer. Protein Science. 2004;13:3222–3229. doi: 10.1110/ps.04921704. [DOI] [PMC free article] [PubMed] [Google Scholar]
- 20.Eivazova ER, McDonnell JM, Sutton BJ, Staines NA. Specificity and binding kinetics of murine lupus anti-DNA monoclonal antibodies implicate different stimuli for their production. Immunology. 2000;101:371–377. doi: 10.1046/j.1365-2567.2000.00119.x. [DOI] [PMC free article] [PubMed] [Google Scholar]
- 21.Chaurasiya KR, Paramanathan T, McCauley MJ, Williams MC. Biophysical characterization of DNA binding from single molecule force measurements. Physics of Life Reviews. 2010;7:299–341. doi: 10.1016/j.plrev.2010.06.001. [DOI] [PMC free article] [PubMed] [Google Scholar]
- 22.Noy A. Force spectroscopy 101: how to design, perform, and analyze an AFM-based single molecule force spectroscopy experiment. Current Opinion in Chemical Biology. 2011;15:710–718. doi: 10.1016/j.cbpa.2011.07.020. [DOI] [PubMed] [Google Scholar]
- 23.Rocha MS. Extracting physical chemistry from mechanics: a new approach to investigate DNA interactions with drugs and proteins in single molecule experiments. Integrative Biology (Camb) 2015;7:967–986. doi: 10.1039/c5ib00127g. [DOI] [PubMed] [Google Scholar]
- 24.Chung JW, Shin D, Kwak JM, Seog J. Direct force measurement of single DNA-peptide interactions using atomic force microscopy. Journal of Molecular Recognition. 2013;26:268–275. doi: 10.1002/jmr.2269. [DOI] [PubMed] [Google Scholar]
- 25.Bartels F, McIntosh M, Fuhrmann A, Metzendorf C, Plattner P, Sewald N, et al. Effector-stimulated single molecule protein–DNA interactions of a quorum-sensing system in Sinorhizobium meliloti. Biophysical Journal. 2007;92:4391–4400. doi: 10.1529/biophysj.106.082016. [DOI] [PMC free article] [PubMed] [Google Scholar]
- 26.Wollschlager K, Gaus K, Kornig A, Eckel R, Wilking S, McIntosh M, et al. Single-molecule experiments to elucidate the minimal requirement for DNA recognition by transcription factor epitopes. Small. 2009;5:484–495. doi: 10.1002/smll.200800945. [DOI] [PubMed] [Google Scholar]
- 27.Koch S, Wang M. Dynamic force spectroscopy of protein-DNA interactions by unzipping DNA. Physical Review Letters. 2003;91:028103. doi: 10.1103/PhysRevLett.91.028103. [DOI] [PubMed] [Google Scholar]
- 28.Krasnoslobodtsev AV, Shlyakhtenko LS, Lyubchenko YL. Probing interactions within the synaptic DNA–SfiI complex by AFM force spectroscopy. Journal of Molecular Biology. 2007;365:1407–1416. doi: 10.1016/j.jmb.2006.10.041. [DOI] [PMC free article] [PubMed] [Google Scholar]
- 29.Sanchez H, Suzuki Y, Yokokawa M, Takeyasu K, Wyman C. Protein-DNA interactions in high speed AFM: single molecule diffusion analysis of human RAD54. Integrative Biology. 2011;3:1127–1134. doi: 10.1039/c1ib00039j. [DOI] [PubMed] [Google Scholar]
- 30.Lionnet T, Allemand JF, Revyakin A, Strick TR, Saleh OA, Bensimon D, et al. Single-molecule studies using magnetic traps. Cold Spring Harbor Protocols. 2012;2012:34–49. doi: 10.1101/pdb.top067488. [DOI] [PubMed] [Google Scholar]
- 31.Limmer K, Pippig DA, Aschenbrenner D, Gaub HE. A force-based, parallel assay for the quantification of protein-DNA interactions. PloS One. 2014;9:e89626. doi: 10.1371/journal.pone.0089626. [DOI] [PMC free article] [PubMed] [Google Scholar]
- 32.Kofler R, Strohal R, Balderas RS, Johnson ME, Noonan DJ, Duchosal MA, et al. Immunoglobulin kappa light chain variable region gene complex organization and immunoglobulin genes encoding anti-DNA autoantibodies in lupus mice. Journal of Clinical Investigation. 1988;82:852–860. doi: 10.1172/JCI113689. [DOI] [PMC free article] [PubMed] [Google Scholar]
- 33.Litvinov RI, Gorkun OV, Owen SF, Shuman H, Weisel JW. Polymerization of fibrin: specificity, strength, and stability of knob-hole interactions studied at the single-molecule level. Blood. 2005;106:2944–2951. doi: 10.1182/blood-2005-05-2039. [DOI] [PMC free article] [PubMed] [Google Scholar]
- 34.Litvinov RI, Yarovoi SV, Rauova L, Barsegov V, Sachais BS, Rux AH, et al. Distinct specificity and single-molecule kinetics characterize the interaction of pathogenic and non-pathogenic antibodies against platelet factor 4-heparin complexes with platelet factor 4. Journal of Biological Chemistry. 2013;288:33060–33070. doi: 10.1074/jbc.M113.481598. [DOI] [PMC free article] [PubMed] [Google Scholar]
- 35.Litvinov RI, Shuman H, Bennett JS, Weisel JW. Binding strength and activation state of single fibrinogen-integrin pairs on living cells. Proceedings of the National Academy of Sciences of the United States of America. 2002;99:7426–7431. doi: 10.1073/pnas.112194999. [DOI] [PMC free article] [PubMed] [Google Scholar]
- 36.Litvinov RI, Mekler A, Shuman H, Bennett JS, Barsegov V, Weisel JW. Resolving two-dimensional kinetics of the integrin αIIbβ3-fibrinogen interactions using binding-unbinding correlation spectroscopy. Journal of Biological Chemistry. 2012;287:35275–35285. doi: 10.1074/jbc.M112.404848. [DOI] [PMC free article] [PubMed] [Google Scholar]
- 37.Evans E, Ritchie K. Dynamic strength of molecular adhesion bonds. Biophysical Journal. 1997;72:1541–1555. doi: 10.1016/S0006-3495(97)78802-7. [DOI] [PMC free article] [PubMed] [Google Scholar]
- 38.Tees DFJ, Woodward JT, IV, Hammer DA. Reliability theory for receptor-ligand bond dissociation. Journal of Chemical Physics. 2001;114:7483–7496. [Google Scholar]
- 39.Bell GI. Models for the specific adhesion of cells to cells. Science. 1978;200:618–627. doi: 10.1126/science.347575. [DOI] [PubMed] [Google Scholar]
- 40.Bura E, Zhmurov A, Barsegov V. Nonparametric density estimation and optimal bandwidth selection for protein unfolding and unbinding data. Journal of Chemical Physics. 2009;130:015102. doi: 10.1063/1.3050095. [DOI] [PubMed] [Google Scholar]
- 41.Nelson P. Biological physics. Freeman WH and company; New York: 2004. [Google Scholar]
- 42.Zhang Y, Zhou H, Ou-Yang ZC. Stretching single-stranded DNA: interplay of electrostatic, base-pairing, and base-pair stacking interactions. Biophysical Journal. 2001;81:1133–1143. doi: 10.1016/S0006-3495(01)75770-0. [DOI] [PMC free article] [PubMed] [Google Scholar]
- 43.Jorgensen MH, Rekvig OP, Jacobsen RS, Jacobsen S, Fenton KA. Circulating levels of chromatin fragments are inversely correlated with anti-dsDNA antibody levels in human and murine systemic lupus erythematosus. Immunology Letters. 2011;138:179–186. doi: 10.1016/j.imlet.2011.04.006. [DOI] [PubMed] [Google Scholar]
- 44.Spatz L, Iliev A, Saenko V, Jones L, Irigoyen M, Manheimer-Lory A, et al. Studies on the structure, regulation, and pathogenic potential of anti-dsDNA antibodies. Methods. 1997;11:70–78. doi: 10.1006/meth.1996.0389. [DOI] [PubMed] [Google Scholar]
- 45.Kozyr AV, Kolesnikov AV, Khlyntseva AE, Bogun AG, Savchenko GA, Shemyakin IG, et al. Role of structure-based changes due to somatic mutation in highly homologous DNA-binding and DNA-hydrolyzing autoantibodies exemplified by A23P substitution in the VH domain. Autoimmune Diseases. 2012;2012:683829. doi: 10.1155/2012/683829. [DOI] [PMC free article] [PubMed] [Google Scholar]
- 46.Lomakin YA, Zakharova MY, Stepanov AV, Dronina MA, Smirnov IV, Bobik TV, et al. Heavy-light chain interrelations of MS-associated immunoglobulins probed by deep sequencing and rational variation. Molecular Immunology. 2014;62:305–314. doi: 10.1016/j.molimm.2014.01.013. [DOI] [PubMed] [Google Scholar]
- 47.Pavlovic M, Kats A, Cavallo M, Chen R, Hartmann JX, Shoenfeld Y. Pathogenic and epiphenomenal anti-DNA antibodies in SLE. Autoimmune Diseases. 2010;2010:462841. doi: 10.4061/2010/462841. [DOI] [PMC free article] [PubMed] [Google Scholar]
- 48.Liu YY, Guthold M, Snyder MJ, Lu HF. AFM of self-assembled lambda DNA-histone networks. Colloids and Surfaces, B: Biointerfaces. 2015;134:17–25. doi: 10.1016/j.colsurfb.2015.06.026. [DOI] [PMC free article] [PubMed] [Google Scholar]
- 49.Nawas S, Sanches P, Bodensiek K, Li S, Simons M, Schaap IA. Cell visco-elasticity measured with AFM amp optical trapping at sub-micrometer deformations. PloS One. 2012;7:e45297. doi: 10.1371/journal.pone.0045297. [DOI] [PMC free article] [PubMed] [Google Scholar]
- 50.Weisel JW, Shuman H, Litvinov RI. Protein-protein unbinding induced by force: single-molecule studies. Current Opinion in Structural Biology. 2003;13:227–235. doi: 10.1016/s0959-440x(03)00039-3. [DOI] [PubMed] [Google Scholar]
- 51.Goldsmith HL, McIntosh FA, Shahin J, Frojmovic MM. Time and force dependence of the rupture of glycoprotein IIb-IIIa-fibrinogen bonds between latex spheres. Biophysical Journal. 2000;78:1195–1206. doi: 10.1016/S0006-3495(00)76677-X. [DOI] [PMC free article] [PubMed] [Google Scholar]
- 52.Lee I, Marchant RE. Force measurements on the molecular interactions between ligand (RGD) and human platelet αIIbβ3 receptor system. Surface Science. 2001;491:433–443. [Google Scholar]
- 53.Zhu C, Long M, Chesla SE, Bongrand P. Measuring receptor/ligand interaction at the single-bond level: experimental and interpretative issues. Annals of Biomedical Engineering. 2002;30:305–314. doi: 10.1114/1.1467923. [DOI] [PubMed] [Google Scholar]
- 54.Litvinov RI, Bennett JS, Weisel JW, Shuman H. Multi-step fibrinogen binding to the integrin αIIbβ3 detected using force spectroscopy. Biophysical Journal. 2005;89:2824–2834. doi: 10.1529/biophysj.105.061887. [DOI] [PMC free article] [PubMed] [Google Scholar]
- 55.Litvinov RI, Gorkun OV, Galanakis DK, Yakovlev S, Medved L, Shuman H, et al. Polymerization of fibrin: direct observation and quantification of individual B:b knob-hole interactions. Blood. 2007;109:130–138. doi: 10.1182/blood-2006-07-033910. [DOI] [PMC free article] [PubMed] [Google Scholar]
- 56.Chilkoti A, Stayton PS. Molecular origins of the slow streptavidin-biotin dissociation kinetics. Journal of the American Chemical Society. 1995;117:10622–10628. [Google Scholar]
- 57.Poongavanam MV, Kisley L, Kourentzi K, Landes CF, Willson RC. Ensemble and single-molecule biophysical characterization of D17.4 DNA aptamer-IgE interactions. Biochimica et Biophysica Acta, Proteins Proteomics. 2016;1864:154–164. doi: 10.1016/j.bbapap.2015.08.008. [DOI] [PubMed] [Google Scholar]
- 58.Schwesinger F, Ros R, Strunz T, Anselmetti D, Güntherodt HJ, Honegger A, et al. Unbinding forces of single antibody-antigen complexes correlate with their thermal dissociation rates. Proceedings of the National Academy of Sciences of the United States of America. 2000;97:9972–9977. doi: 10.1073/pnas.97.18.9972. [DOI] [PMC free article] [PubMed] [Google Scholar]
- 59.Giuntoli RD, Linzer NB, Banigan EJ, Sing CE, de la Cruz MO, Graham JS, et al. DNA-segment-facilitated dissociation of Fis and NHP6A from DNA detected via single-molecule mechanical response. Journal of Molecular Biology. 2015;427:3123–3136. doi: 10.1016/j.jmb.2015.07.015. [DOI] [PMC free article] [PubMed] [Google Scholar]