

Abstract
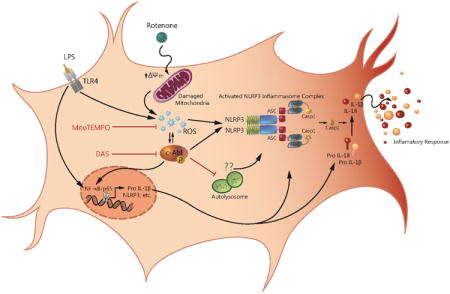
A growing body of evidence suggests that excessive microglial activation and pesticide exposure may be linked to the etiology of PD; however, the mechanisms involved remain elusive. Emerging evidence indicates that intracellular inflammasome complex namely NLRP3 complex is involved in the recognition and execution of host inflammatory response. Thus, in the present study, we investigated the hypothesis that NLRP3 inflammasome activation is linked to rotenone (ROT)-induced microglial activation which is dependent upon a priming stimulus by a pathogen-associated molecular pattern (PAMP) or damage associated molecular pattern (DAMP), respectively. Herein using both BV2 cells and primary microglial cells, we show that LPS priming and subsequent ROT stimulation enhanced NLRP3 inflammasome activation, c-Abl and PKCδ activation, mitochondrial dysfunction, NF-κB activation, and autophagic markers, while TFEB levels were decreased dramatically. Mechanistic studies revealed c-Abl acts as a proximal signal that exacerbated the activation of the afore mentioned markers. Intriguingly, siRNA-mediated depletion or pharmacological inhibition of c-Abl via dasatinib abrogated LPS and ROT-induced microglial activation response via attenuation of NLRP3 inflammasome activation, mitochondrial oxidative stress, and ALS dysfunction. Moreover, mitoTEMPO, a mitochondrial antioxidant, attenuated NLRP3 inflammasome activation effects via blockade of c-Abl and PKCδ activation. In LPS treated mice, dasatinib attenuated NLRP3 inflammasome activation, c-Abl and PKCδ activation; and sickness behavior. Together our findings identify an exaggerated ROS/c-Abl/NLRP3 signaling axis in the heightened microglial activation response evidenced in LPS-primed ROT-stimulated microglial cells and suggest that targeting c-Abl-regulated NLRP3 inflammasome signaling offers a novel therapeutic strategy for PD treatment.
Keywords: microglial activation, c-Abl tyrosine kinase, Parkinson's disease, neuroinflammation, NLRP3 inflammasome, rotenone
Graphical abstract
Introduction
A characteristic feature of neurodegenerative disease is the proliferation of activated microglia a condition refered to as microgliosis. Microglia are the resident immune cells of the brain and plays a pivotal role in CNS development, maintenance, and disease. Most notably they mediate the clearance of toxic cellular debris and support tissue repair. However, protracted activation of microglia exerts deleterious effects on the brain such as neurodegenerative diseases (Tremblay et al., 2011). In fact, analysis of postmortem PD brains revealed microglial activation markers, accumulation of proinflammatory cytokines and indices of oxidative stress (McGeer et al., 1988). Activated microglia release a diverse array of toxic mediators including proinflammatory cytokines, nitric oxide and superoxide, which has been shown to play a critical role in the pathogenesis of neurodegererative disorders such as AD, prion disease and PD (Chao et al., 1995; Mosley et al., 2006; Tansey et al., 2007; Tansey and Goldberg, 2010). In fact, chronic inflammation has been implicated in the delayed and progressive dopaminergic neurodegeneration (Gao et al., 2002a; Gao et al., 2002b; Qin et al., 2007; Gao et al., 2011). The factors released by activated microglia have been linked to neurodegenerative conditions (Gao et al., 2002b; Block et al., 2007). Therefore, there is an urgent need to understand the mechanism underlying persistent microglial activation and to develop novel pharmacological strategies that limits microglial activity during PD pathogenesis.
Rotenone (ROT) exposure has raised great concerns as a potential environmental risk factor for inflammation related neurodegenerative disorders. ROT inhibits complex I of the electron transport chain and promotes the generation of mitochondrial superoxide production during complex I substrates oxidation (Andreyev et al., 2005; Keeney et al., 2006). Systemic ROT administration has been shown to induce Parkinsonian features in rats including selective dopaminergic neurodegeneration (Betarbet et al., 2000). Moreover, Gao et al. demonstrated that the contribution of microglial cells may be indispensable for LPS and rotenone-induced synergistic neurotoxicity (Gao et al., 2002a; Gao et al., 2002b; Gao et al., 2003). Thus, ROT-induced degeneration of dopaminergic neurons may not be entirely dependent upon inhibition of neuronal mitochondrial complex I activity but may also involve the contribution of microglial cells (Gao et al., 2002a). Taken together, the afore mentioned studies highlight the proinflammatory effects of ROT.
c-Abl is a 120 kDa protein that belongs to the cytoplasmic tyrosine kinase family. c-Abl has been shown to be activated via oxidative (Sun et al., 2000; Stuart et al, 2005) or genotoxic stress (Yuan et al., 1999). Interestingly, c-Abl has also been implicated in the CNS development, including neurogenesis, neurite outgrowth, and neuronal plasticity (Moresco and Koleske, 2003; Moresco et al., 2003). A growing body of evidence from several experimental model systems has also demonstrated that c-Abl is activated in neurodegenerative diseases including Alzheimer's disease (Cancino et al., 2008; Jing et al., 2009; Tremblay et al., 2010), Parkinson's disease (Ko et al., 2010; Imam et al., 2011; Mahul-Mellier et al., 2014) and synucleinopathies (Estrada et al., 2011). In this context, c-Abl has been shown to promote tyrosine phosphorylation of parkin in the N-terminal domain, and STI-571, a c-Abl kinase inhibitor has been shown to inhibit tyrosine phosphorylation thereby maintaining in a catalytically active and protective state (Ko et al., 2010).
The inflammasomes are multiprotein signaling platforms that are assembled following exposure to pathogen-associated and damage associated molecular pattern molecules (PAMP and DAMP, respectively) and environmental stimuli (Rubartelli, 2014). Presently, inflammasomes are placed under two families namely the nucleotide oligomerization domain (NOD)-like receptor (NLR) family and the pyrin and HIN200 (hematopoietic interferon-inducible nuclear antigens with 200 amino-acid repeats) domain containing protein (PYHIN) family. The NLR family comprises NLRP1, NLRP2, NLRP3, NLRP6, NLRC4 and NLRP12. The PYHIN family includes absent in melanoma 2 (AIM2) and γ-interferon-inducible protein (IFI16) (reviewed in (Benetti et al., 2013)). The NLRP3 inflammasome is the most characterized member of the NLR family. The NLRP3 inflammasome complex includes a specific member of the NOD-like receptor protein (NLRP) subfamily, apoptosis-associated speck like protein containing a CARD- an adapter protein, and procaspase-1 (Stehlik et al., 2003; Ippagunta et al., 2010). The inflammosome and its associated components are an integral part of the body's immune system, where they participate in the defense against invading pathogens. The NLRP3 inflammosome is tightly controlled and has been shown to require two distinct steps. First, under basal conditions the pro-form of IL-1β and NLRP3 proteins are expressed at very low levels, therefore a priming step is essential to induce their transcription (Jha et al., 2010; Ozaki et al., 2015). This is mediated via the activation of Toll like receptors or NOD2 to initiate the NF-κB signaling cascade leading to the transcription of NLRP3 and prointerleukin-1β (pro-IL-1β) (Sutterwala et al., 2014); this step is termed as ‘priming’. Second, upon priming, the activating stimuli originating from pathogens or the host induce the assembly of NLRP3 inflammasome components and subsequent caspase-1 mediated proteolytic processing of pro-IL-1β and pro-IL-18 into mature peptides, which is eventually released into the extracellular milieu to elicit the downstream effects (van de Veerdonk et al., 2011; Kim et al., 2016). Thus, NLRs serves as a nexus between disturbance in cellular homeostasis and the generation of proinflammatory cytokines (Martinon et al., 2009; Latz, 2010; Khare et al., 2012), providing further impetus for studying the role of this receptor in neurodegenerative diseases.
There are a plethora of studies that demonstrates NLRP3 activation in bone-marrow derived macrophages and dendritic cells (Burm et al., 2015); however, only scant evidence are available regarding the mechanisms regulating the priming and activation of NLRP3 inflammasome in the microglia (Gustin et al., 2015). In the present study, we investigated the inflammatory mechanisms involved in ROT-stimulated LPS-primed microglia using BV2 microglial cell line and mouse primary microglia. We show that LPS priming in rotenone-stimulated cells amplifies the microglial activation response via the ROS/c-Abl/NLRP3 signaling axis. Our data provide further mechanistic insight into the anti-inflammatory effects of dasatinib indicating that targeting oxidative stress-induced c-Abl activation in the microglia may serve as a novel pathway for limiting persistent microglial activation evidenced in numerous inflammation associated neurodegenerative diseases including PD.
Material and Methods
Chemicals and Reagents
Cell culture supplies including DMEM/F-12 media, RPMI 1640 media, penicillin/streptomycin, L-glutamine, fetal bovine serum (FBS), CM-H2DCFDA dye and MitoSox® dye were purchased from Invitrogen. Rotenone, mouse anti-β actin antibody, mitoTEMPO, disuccinimidyl suberate (DSS), BSA lyophilized powder and acridine orange (AO) were purchased from Sigma-Aldrich. Lipopolysaccharide (E. Coli O111:B4) (LPS) and c-Abl antibody were purchased from EMD Millipore. Dasatinib (DAS), p-c-Abl (pY412), PKCδ, p-PKCδ (pY311), phospho-IκBα, iNOS, ASC, TOM20, lamin B, tubulin and p65 antibodies were purchased from Santa Cruz Biotechnology. Beclin1, NLRP3, caspase-1, LC3B, p-c-Abl (pY245), IL-1β and IL-18 antibodies were purchased from Cell Signaling Technology. TFEB antibody was Bethyl laboratories, Inc. Caspase 1 (p10) antibody was purchased from Adipogen. The mouse IL-1β and IL-18 ELISA kits from eBiosciences.
Cell Culture and Treatment
Immortalized mouse microglial BV2 cell line were cultured and maintained at 37°C in RPMI 1640 medium containing 10% heat inactivated (HI) FBS, 2mM L-glutamine, 100mg/ml penicillin and 100mg/ml streptomycin. Cells were first primed with 1μg/ml LPS for 3h, media was replaced and cells were subsequently stimulated with followed by treatment with rotenone at concentrations of 0.1, 0.25 or 0.5μM. Cells were pretreated with 100nM DAS for 1h before exposing them to LPS and ROT. Post treatment, BV2 cells were either collected for mRNA extraction or for protein analysis by qRT-PCR or western blotting, respectively.
Primary Microglial Culture
Primary mixed glia were was prepared from postnatal (P1) mouse pups as described earlier (Gordon et al., 2011). In brief, brains were isolated from pups, meninges were carefully removed, and then immediately placed in DMEM/F-12 medium (containing 10% HI-FBS, 2mM L-glutamine, 100mg/ml penicillin, 100mg/ml streptomycin and 2mM sodium pyruvate). The brains were triturated to make a single cell suspension. The cells were then plated in flask for 2 weeks at 37°C. Microglia were separated from this mixed glial cell culture using either shake off method or via magnetic separation kit (EasyStep™ Mouse Cd11b positive selection kit) from Stem Cell Technologies (Gordon et al., 2011).
siRNA transfection
Transfection of BV2 microglial cells and primary microglia was performed using Amaxa Nucleofector Kit (Lonza). Briefly, 3×10⁶ BV2 cells were suspended in 100μl transfection buffer containing 400μM ATP-disodium, 600μM magnesium chloride, 100μM potassium hypophosphate, 20μM sodium bicarbonate and 5μM glucose. The 1.5nM of c-Abl siRNA (ThermoFisher, CAT # 162296) or control siRNA (Santa Cruz Biotechnology, CAT# sc-37007) were added to the transfection mix. The cells were then transfected by electroporation using A-23 program of Lonza Nucleofector™ 2b devise. Detailed protocol can be found in our previous publication (Panicker et al., 2015). Post transfection, the cells were incubated for 48h followed by various treatment.
Animal Study
Six to eight weeks old C57bl/6 mice were obtained from Charles River and housed under standard conditions at 22 ± 1°C and 30% relative humidity with 12h light cycle as per IACUC protocol. Mice were randomly assigned in four different groups. DAS (25mg/kg/day) was administered orally for 30 days prior to LPS treatment. The well-characterized acute LPS neuroinflammation model for PD was used for this study (Qin et al., 2007). Mice were injected intraperitoneally with either saline or LPS (5mg/kg). Six hours post treatment, the mice were subjected to VersaMax open field study and rotarod performance test (Ghosh et al., 2013; Gordon et al., 2016) for behavior analysis. After behavior tests, animals were euthanized and brain tissues from substantia nigra region were collected and stored at -80°C.
ROS, NO and MitoSox Assays
The cells were plated in 96-wellplate and primed with LPS for 3h. The primed cells were further stimulated with ROT for various time points. Post treatment, the media was removed and the cells incubated with redox sensitive 1μM CM-H2DCFDA dye for 1h. Following incubation, the supernatant containing unabsorbed dye was aspirated out. The cells were washed with PBS twice and the change in fluorescent intensity as indicator of ROS generation, was carried out by using fluorescence microplate reader with excitation and emission wavelength of 488nm and 525nm, respectively. For nitric oxide (NO) assay, the cells supernatant media was collected post treatment completion and nitrite levels were determined spectrophotometrically using Griess' reagent as per the manufacturer protocol. To analyze the generation of mitochondrial superoxide, post treatment cells were incubated with 5μM MitoSOX dye for 20min, followed by two washings with HBSS buffer. Change in mitochondrial superoxide generation was quantified using fluorescence microplate reader with excitation and emission wavelengths of 510nm and 580nm, respectively.
Mitochondrial Membrane Potential
The mitochondrial membrane integrity was measured using a lipophilic JC-1 dye (Invitrogen) as described by Ghosh et al. (Ghosh et al., 2010). In brief, post-treatment cells were exposed to JC-1 (2μg/ml) dye. After 30min incubation, cells were washed with PBS and analysis was performed by measuring red fluorescence excitation at 590nm over 600nm emission and green fluorescence excitation at 485nm over 535nm emission. JC-1 dye accumulated within healthy mitochondria forming red aggregates however, the dye stays as green monomer in non-healthy cells. The ratio of RED:GREEN represents change in mitochondrial membrane potential.
MTS Cell Viability Assay
The BV2 cells were plated in 96-wellplate at the seeding density of 10,000/well. Cells were treated with varying concentration (0.1-0.5μM) of ROT (6, 12 or 24h) with or without LPS (1μg/ml, 3h) priming and cell viability was assessed as described by Jin et at, 2014 (Jin et al., 2014). In brief, post treatment cells were exposed to Cell Titer 96® AQueous One Solution Cell Proliferation (MTS) Assay kit from Promega. After 45min (37°C) incubation with 10μl MTS dye the formazan crystals were dissolved with 25μl of dimethyl sulfoxide (Sigma-Aldrich), the change in color was measured spectrophotometrically at 490nm, values were plotted at % of control and were plotted as bar graph.
qRT-PCR
RNA extraction from microglial cells were performed using Trizol® Reagent as described (Seo et al., 2014). RNA was converted into cDNA using AffinityScript qPCR cDNA synthesis system (Agilent Technology) following the standard kit protocol. The RT2 SYBR Green Master Mix and pre-validated primers were obtained from SA Biosciences and were used for Quantitative PCR assays. Mouse 18s was used as housekeeping gene for internal normalization. The ΔΔCt method was used to determine the fold change in gene expression, using threshold cycle (Ct) value of the housekeeping gene and respective target gene.
Western Blotting
The whole cell lysates were prepared using modified RIPA buffer as described previously (Panicker et al., 2015). To analyze the intracellular translocation, nuclear and cytosolic fractions were collected using NE/PER kit (Thermo Fisher). Protein amount was estimated using Bradford reagent and equal amount of protein was resolved on a 7.5-15% SDS-polyacrylamide gel. Resolved protein were transferred to nitrocellulose membrane and membranes were blocked for 1h by incubating with Rockland blocking buffer, followed by incubation with specific primary antibody overnight at 4°C. Membranes were washed and incubated with specific fluorescent labelled secondary antibody. The membrane containing antibody-bound protein was scanned using Odyssey IR Imaging System (LI-COR) and data were analyzed using Odyssey 2.0 software.
Immunoblotting of media supernatant
After treatment, cell supernatants were collected and were concentrated using TCA method as explained by Chakrabarti et al (Chakrabarti et al., 2015). Briefly, 72μl of 100% (w/v) tricholoroacetic acid (Sigma-Aldrich) and 30μl of 5% (w/v) sodium cholate (Sigma-Aldrich) were added per ml of media. After 20 minutes incubation on ice, samples were centrifuged at 12,000×g for 10min at 4°C. Pellets were carefully washed with ice-cold acetone at least 2 times and were allowed to dry to evaporate acetone. Concentrates were then dissolved in SDS sample buffer containing 33.34mM NaOH (Sigma-Aldrich). Standard western blotting protocol, as described above, was followed for these samples.
Immunocytochemistry and Confocal imaging
Immunostaining was done with both BV2 cells and primary microglia (Panicker et al., 2015). In brief, cells were plated on glass cover-slips and were exposed to desired treatments. Post treatment, fixed with 4% paraformaldehyde for 30 minutes followed by 3 washes with PBS and blocking with 2% BSA solution containing 0.5% Triton-X and 0.05% Tween 20. After blocking step, cells were incubated with primary antibodies (rabbit anti-NLRP3 (1:300), goat anti-TOM20 (1:300), mouse anti-p-c-Abl Y412 (1:300), rabbit anti-LC3B (1:300) and rabbit anti-p65 (1:250)) at 4°C overnight and then 90 minutes incubation with secondary antibodies (Donkey anti-goat Alexa Fluor® 555, Donkey anti-rabbit Alexa Fluor® 488 or Donkey Anti-mouse Alexa Fluor® 555). Lastly, cells were exposed to Hoechst (10μg/ml) for 10min to stain nuclei. After each step cells were washed with 1XPBS thrice. Coverslips were mounted on glass slides using Fluoroshield™ mounting medium (Sigma-Aldrich) and were allowed to dry overnight in dark. The p-c-Abl (pY412), p65 and LC3B samples were visualized using an inverted microscope (Nikon TE-2000U) and were captured using Spot digital camera (Diagnostic instruments). LC3B stained puncta were counted using ImageJ software with ‘Analyze’ plugin.
Confocal imaging was performed to visualize NLRP3 and TOM20 colocalization. Leica DMIRE2 laser scanning confocal microscope with the 63×-oil immersion objective and Leica confocal software from Iowa State University Microscope Facility were used to capture images. The Z-stack images were processed using Imaris software.
ASC oligomerization detection
ASC pyroptosome analysis was detected using immunoblotting method as described by Juliana et al (Juliana et al., 2010). Briefly, cell pellets were washed and resuspended in lysis buffer (20mM HEPES, 150mM KCl, 1% NP-40, 0.1mM PMSF and 1× protease phosphatase inhibitory cocktail) and were kept on ice for 30min, followed by centrifugation at 5,000×g for 10min at 4°C. The pellets were washed with ice-cold PBS twice and then were resuspended in freshly prepared 4mM DSS (crosslinking agent) for 30min, centrifuged at 5,000×g for 10min at 4°C. The pellets were then resuspended in 10% SDS buffer and were subjected to western blot analysis as mentioned before.
Cytokine estimation
The BV2 or primary microglia were seeded in the 96-wellplate. Post treatment, cytokines such as IL-1β, IL-18 was measured using ELISA based immunoassay kits as per manufacturer instructions.
c-Abl Activity Assay
The c-Abl Activity was performed as described earlier (Schlatterer et al., 2011b). Briefly, post treatment, the BV2 cell lysate was prepared in the cell lysis buffer (25mM HEPES, pH 7.5, 20mM β-glycerophosphate, 0.1mM sodium orthovanadate, 0.1% Triton X-100, 0.3M NaCl, 1.5mM MgCl2, 0.2mM EDTA, 0.5 mM dithiothreitol, 10mM NaF, 1× protease-phosphatase inhibitor cocktail). The cell lysate was centrifuged at 10,000rpm for 10 minutes. Equal amount of protein from each treatment group was loaded in Streptavidin coated 96 well plates and incubated with the 5μl of ice-cold 10× kinase buffer containing 200mM HEPES, pH 7.4, 10mM MnCl2, 10mM MgCl2, 10mM DTT, 10mM Na3VO4, 10mM Sodium ATP, 5μg of biotin conjugated c-Abl substrate, Abltide (EMD Millipore, CAT # 12-539) and final volume was adjusted to 50μl with ddH2O. Recombinant active c-Abl enzyme (EMD Millipore, CAT # 14-459) was used as positive control at 1μg/reaction. The reaction was started by incubating the plate at 30°C for 30 minutes. The reaction was stopped by adding 250μl of 2% ice-cold BSA. Subsequently, the plates were washed three times with wash buffer. The plate wells were further incubated for 1h at room temperature with 4G10® anti-phosphotyrosine antibody (1:1000) (EMD Millipore, CAT # 05-321). Plates were washed three times and incubated for 1h with HRP-conjugated secondary antibody (1:1000). Post incubation, the wells were washed 5 times with wash buffer and incubated with HRP substrate for 20 minutes. The change in color development was read with spectrophotometer at 405nm.
Caspase-1 Activity
Caspase-1 activity in BV2 cells was measured using the caspase-1 specific substrate YVAD as per manufacturer instructions (BioVision Inc., CAT # K111-25). Briefly, 2 million cells per treatment group were collected following treatment completion and lysed in ice-cold cell lysis buffer containing protease-phosphatatse inhibitor cocktail for 10 minutes. The cell lysate was centrifuged at 10,000rpm for a minute and supernatant was collected. 100μg of protein from each treatment group was incubated at 37°C with the reaction buffer containing caspase-1 specific Ac-YVAD-pNA substrate for 1 hour. The cytosolic caspase-1 activity was assayed by determining the increased absorbance at 405 nm using a SpectraMax® M2e microplate reader.
Acridine Orange (AO) Assay
Activity of intracellular acidic sacs can be viewed by acridine orange dye, which tends to accumulate in acidic vacuoles and produce red fluorescence. BV2 cells were plated in 24-wellplate. Post treatment, the cells were incubated with 5μg/ml AO solution for 20min at 37°C, followed by washing with PBS (Moriyama et al., 1982). The images were captured using FLoid™ Cell Imaging System by Invitrogen at 480nm excitation for green channel and 580nm excitation for red channel.
Statistical Analyses
Results were expressed as mean ± SEM. All the data were analyzed with Prism 6.0 software (GraphPad). P-values were determined using one-way ANOVA, followed by post hoc Tukey Test to compare means of different treatment groups. Differences with p<0.05 were considered statistically significant. Students' t-test was used for comparing two groups.
Results
LPS priming induces a rapid activation of NLRP3 inflammasome components in ROT-stimulated microglial cells
Due to the multifactorial nature of PD, in the present study we evaluated the influence of prior microglial activation in an environment of mitochondrial stress (ROT), which recapitulates heightened microglial activation in PD-like neuropathology. Treatment of murine macrophages with ROT leads to NLRP3 activation and IL-1β release in a delayed fashion although only in the presence of an inflammasome activator ATP (Won et al., 2015). Mitochondria targeted toxins have been shown to influence cell viability (Ferger et al., 2010), in order to rule out toxic effects of ROT on our experimental end points first we determined the effects of ROT and LPS on cell viability using the MTS assay, which measures mitochondrial dehydrogenase activity. For this purpose, microglia were treated with LPS (1μg/ml, 3h) or varying concentrations of ROT (0.1, 0.25 and 0.5μM) or in combination with varying concentration of ROT for 6, 12 and 24h. In this context, at 3h post LPS cells were washed and exposed to fresh medium containing varying concentrations (0.1-0.5μM) of ROT for 6h. MTS assay revealed that treatment of BV2 cells with ROT concentrations ranging from 0.1-0.5μM did not induce loss of cell viability (fig 1(A)) as compared with control cells at 6h time point, indicating that microglial activation may not be related to microglial death. Likewise, both LPS and sequential treatment with LPS and ROT failed to elicit loss of cell viability at 6h post drug treatment. Our data is consistent with previous studies showing that ROT by itself fails to elicit cell death at early time points (Ferger et al., 2010). Intriguingly, at later time points (12 and 24h), a marked increase in cell death was evidenced in cells that were sequentially stimulated with LPS and ROT (fig 1(A)). Since 6h time point failed to elicit toxicity, all subsequent experiments were performed until this time point.
Figure 1. Rotenone treatment induces NLRP3 inflammosome machinery in LPS primed microglia.

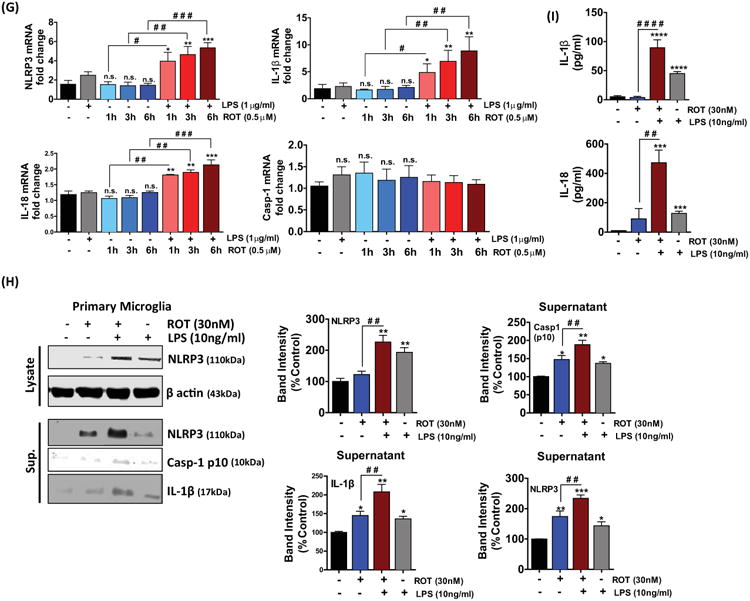
(A) Effect of Rotenone on cell viability. BV2 microglial cells were either untreated or treated with LPS (1μg/ml) for 3h and subsequently stimulated with the indicated concentrations rotenone or rotenone alone for 6, 12 and 24h. Cell viability was determined by MTS assay. Cell survival was represented as percent of control. The data represent mean ± S.E.M. of three independent experiments, N=8. *p<0.05, **p <0.01, ***p<0.001 and **** p<0.0001 compared with control. (B-D) BV2 cells were primed with LPS followed by stimulation with different concentrations of ROT or ROT alone for 6 hrs. At the end of the treatment period the whole cell lysates were collected and immunoblotted for (B) NLRP3, (C) caspase-1 (pro and cleaved), (D) IL-1β (pro-& cleaved). A concentration dependent increase in NLRP3 related markers were evidenced in LPS and ROT stimulated cells. The data represented as mean ± S.E.M. of at least three replicates. *p<0.05 and **p<0.01 is compared with control group and #p<0.05 and # #p<0.01 represents significance between dose-matched ROT and LPS-primed ROT treated group. (E) BV2 microglial cells were primed with LPS (1μg/ml) for 3 hours followed by stimulation with 0.5μM ROT or ROT alone for the indicated time period. At the end of the indicated times whole cell lysates or media supernatants (sup.) were collected and as indicated were immunoblotted for NLRP3, caspase-1 (pro and cleaved), IL-1β (cleaved), and β actin. Densitometric scanning analysis reveals enhancement in NLRP3 marker levels in LPS primed ROT stimulated cells at 6h. Data presented as mean ± S.E.M. The blots are representative of at least three independent experiments. *p<0.05, **p<0.01 and ***p<0.001 compared with control cells, whereas #p<0.05 and # #p<0.01 indicates significance between time-matched ROT and LPS-primed ROT treated group; n.s.: not significant. (F) Bar graphs represent secreted IL-1β, IL-18 and TNFα as determined by ELISA. The ELISA data represents the mean ± S.E.M. performed in replicates of 4 and performed at least 4 independent times. *p<0.05, **p<0.01, ***p<0.001 and ****p<0.0001 vs control, whereas #p<0.05, # #p<0.01, # # #p<0.001 and # # # #p<0.0001 vs time-matched ROT; n.s.: not significant. (G) BV2 microglial cells were treated as described above (1(E)). At the end of the treatment times, cells were collected, lysed and RNA was extracted, and gene expression was analyzed using RT-PCR, normalized to 18s by the ΔΔCt method. The normalized folds change in gene expression of NLRP3, IL-1β, IL-18 and caspase-1 is represented as mean ± S.E.M. for each experiment performed in triplicate at least 3 times independently. *p<0.05, **p<0.01 and *** p<0.001 compared with control cells, whereas #p<0.05, # #p<0.01 and # # #p<0.001 indicates significance between time-matched ROT and LPS-primed ROT treated group; n.s.: not significant. (H) Immunoblot analysis of NLRP3 and processed/cleaved caspase-1 and IL-1β in whole cells lysates and supernatant of mouse primary mouse microglial cells treated with or without LPS (10ng/ml) for 3 hours, followed by stimulation with ROT or ROT alone for 4h. *p<0.05, **p<0.01 and ***p<0.001 vs control group; and # #p<0.01 vs LPS-primed ROT treated group. (I) The levels of IL-1β and IL-18 secreted in the media were determined by ELISA. The data is presented as mean ± S.E.M. (n=4). *p<0.05, **p<0.01, ***p <0.001 and **** p<0.0001 compared with control cells. #p<0.05, # #p<0.01, # # #p<0.001 and # # # #p<0.0001 denotes significance between ROT and LPS-primed ROT treated group.
LPS is an inflammatory activator that is widely used to study microglial activation. Pro-IL-1β is not constitutively expressed in the microglia (Dostert et al., 2008), therefore the cells were primed with 1μg/ml LPS for 3h to stimulate pro-IL-1β synthesis and to upregulate inflammasome components and substrates as well as to mimic excessive microglial activation, which is implicated in PD (Kim and Joh, 2006). Initially, we determined whether ROT, a mitochondrial electron transport chain inhibitor, influenced the NLRP3 inflammasome activation in LPS-primed BV2 microglial cells. BV2 cells were treated with different concentrations of ROT in the presence or absence of LPS (1μg/ml, 3h) for 6h and NLRP3 related markers were determined by WB analysis. As shown in fig 1(B-D), cells treat with ROT (0.5μM) or LPS alone caused a significant increase (p<0.05) in NLRP3 expression as compared with control cells. However, in cells that were primed with LPS and subsequently stimulated with ROT a dose-dependent increase in the expression of NLRP3-related markers were evidenced. In this context, >1.5-fold increase was evidenced in relation to NLRP3 markers (NLRP3, caspase-1 p20, cleaved IL-1β) in LPS-primed ROT-stimulated cells as compared with control cells.
Next, we sought to further investigate the kinetics of NLRP3 inflammasome activation in LPS-primed BV2 microglia that were stimulated with ROT for different periods of time (1, 3, 6h) to confirm NLRP3 inflammasome activation. We observed that all three NLRP3 related markers were upregulated by several folds in LPS/ROT stimulated cells as compared with ROT treated cells (fig 1(E, F)). Data shown in fig 1(E) demonstrates that upon stimulation of LPS-primed BV2 microglia with ROT, activation of NLRP3 related markers were increased in a time-dependent manner. In this context, the protein expression of NLRP3 and caspase-1 (p20) increased by more than 1.5-fold and 2.1-fold, respectively, at 6h. Likewise, we saw a pronounced time-dependent secretion of mature IL-1β, caspase-1 (p10) and NLRP3 starting at 1h in LPS-primed ROT-stimulated cells as compared with control cells as assessed via immunoblot analysis of concentrated supernatants (fig 1(E)). To further verify NLRP3 inflammasome activation, we performed ELISA analysis. We measured IL-1β and IL-18 secretion upon stimulation of BV2 microglial cells with LPS or ROT or LPS and ROT for varying time points (1-6h). We observed a significant increase in IL-1β (p<0.05), IL-18 (p<0.05) and TNFα (p<0.001) secretion in LPS stimulated cells. Likewise, a marked increase (>2.5-fold) in IL-1β and IL-18 secretion and >4-fold increase in TNFα secretion was evidenced at 6h post LPS and ROT sequential stimulation as compared with ROT treated BV2 cells (fig 1(F)).
Subsequently, we performed quantitative Real Time-PCR (qRT-PCR) to determine whether changes in mRNA transcript levels might have accounted for the elevated NLRP3-related marker levels in LPS and ROT sequentially stimulated BV2 microglial cells. We observed a significant increase in NLRP3-related markers at all time points with levels increasing by more than 1.5-fold at 3h and 6h, respectively, upon LPS and ROT sequential stimulation as compared with ROT stimulated cells (fig 1(G)). However, caspase-1 transcript levels remained unchanged at all time points exposed to either LPS or ROT or LPS and ROT as compared with control cells, supporting transcription-independent caspase-1 activation mechanisms (fig 1(G)).
The rapid response to LPS and ROT was mirrored in mouse primary microglial cells (fig 1(H, I)). In a recent study, priming of primate primary microglia with varying concentrations (4-500ng/ml) of LPS resulted in similar amount of IL-1β release at least at the 4h time point (Burm et al., 2015). Therefore, experiments were performed at a similar time point with primary microglia. For this purpose, we exposed the primary microglial cells for 3h with a low concentration of LPS (10ng/ml) followed by ROT (30nM) for 4h to activate primary microglia (Chang et al., 2013). ELISA analysis revealed that LPS priming and ROT stimulation of mouse primary microglial cells elicited a marked increase (>20-fold) in both IL-1β and IL-18 as compared with ROT treated cells (fig 1(I)). Additionally, immunoblot analysis of concentrated cell culture supernatant from LPS and ROT sequentially stimulated cells revealed the appearance of mature IL-1β and caspase-1 (p10) as well as NLRP3 (fig 1(H)). Our results further confirm the validity of our model to study the impact of sequential treatment with LPS and ROT in the induction of a pronounced microglial proinflammatory signaling cascade especially, NLRP3 inflammasome activation. Subsequent experiments were carried out at the afore mentioned concentrations of both LPS and ROT to determine the levels of inflammatory cytokines and ALS related markers. Collectively, our studies suggest that ROT alone induces a suboptimal increase in NLRP3-related markers; however, additional factors such as LPS priming would be required to induce heightened inflammatory response via potentiation of NLRP3 inflammasome activation.
LPS priming and ROT stimulation enhance intracellular ROS generation, nitrite production and dissipation of MMP in BV2 microglia
It is well established that ROT induced inhibition of electron transport chain leads to ROS generation (Li et al., 2003; Indo et al., 2007). To examine whether ROT-induced changes in ROS generation may be linked to NLRP3 inflammasome activation, we determined ROT-induced ROS generation in BV2 cells using the cell permeant ROS indicator, CM-H2DCFDA, and subsequent quantification using fluorescence plate reader assay. The exposure of BV2 microglial cells to LPS for 3h resulted in a significant (p<0.05) increase in ROS generation, as compared with controls. Upon ROT stimulation, BV2 cells demonstrated a time-dependent (fig 2(A)) increase in ROS generation. In this context a 50%, 65% and 110% increase in ROS generation was evidenced at 1, 3, 6h, respectively, as compared with controls. Moreover, ROT stimulation enhanced ROS generation in LPS primed cells. In this context, BV2 cells sequentially treated with LPS and ROT, displayed an 80, 120 and 210% increase at 1, 3, 6h, respectively, as compared with control cells (fig 2(A)).
Figure 2. Rotenone enhances free radical production and mitochondrial depolarization in LPS-primed BV2 cells.

BV2 microglial cells were subjected to the same treatment conditions as detailed above (1(E)). ROS generation (A), mitochondrial superoxide (B) and mitochondrial membrane potential (C) were measured spectrophotometrically using redox sensitive CM-H2DCFDA, mitosox and JC-1 dye respectively. The data represent mean ± S.E.M., n=6 and expressed as percent of control. (D) Spectrophotometric analysis of nitrite release using the Griess method. The data represents the mean ± S.E.M. n = 6. *p <0.05,**p < 0.01, ***p< 0.001 vs control; #p<0.05, # #p< 0.01 and # # #p< 0.001 denotes significant differences between ROT vs LPS-primed ROT treated group, while n.s.: not significant.
As DCF fluorescence studies detects intracellular changes in ROS generation and fails to detect the exact source, we used mitoSOX™ red, a probe that is targeted to the mitochondria and fluoresces when oxidized by O2-. Treatment with ROT caused a 1.3 and 1.5-fold increase in mitochondrial superoxide production at 3 and 6h, respectively (fig 2(B)). However, in cells that were sequentially treated with LPS and ROT a similar increase (>2-fold) in mitochondrial ROS generation was evidenced at 3h and 6h, respectively.
Next, we examined the effect of LPS priming on ROT-induced NO production in BV2 cells. The BV2 cells were subjected to the same treatment conditions as detailed above. LPS induced NO generation by more than 2-fold as compared to control cells. On the contrary, LPS priming induced a dose-dependent increase in NO generation in ROT stimulated cells. In fact, greater than 3-fold increase in NO generation was evidenced in LPS-primed ROT stimulated cells at 6h as compared to ROT treated cells.
As ETC inhibitors can cause mitochondrial dysfunction leading to mitochondrial depolarization and energy depletion (Plaza Davila et al., 2015; Charli et al., 2016), we next assessed the impact of ROT on mitochondrial membrane potential (MMP, Δψm). The outer membrane of mitochondria is highly susceptible to reactive free radicals and increased free radical generation within the cell can damage the structure of the outer membrane, creating pores and making the membrane leaky (Kowaltowski et al., 2001; Chipuk et al., 2006; Tait and Green, 2010). To evaluate the mitochondrial membrane permeability, we examined the mitochondrial membrane potential using the JC-1 assay. JC-1, a cationic dye, indicates mitochondrial depolarization via a reduction in the ratio of red to green fluorescence. As shown in fig 2(C), 0.5 μM ROT treatment caused significant (p<0.05) and time-dependent dissipation in MMP in BV2 cells. However, LPS priming for 3h and subsequent stimulation with ROT for 1, 3 and 6h resulted in a further time-dependent collapse of MMP. In this context, an 18, 46 and 36% reduction of MMP (figure 2(C)) were evidenced in these cells at 1, 3 and 6h, respectively. Taken together, our results demonstrated that electron transport chain inhibitor enhance LPS-induced ROS generation concomitant with lowered membrane potential associated with dysfunctional mitochondria. Thus, it is plausible that exaggerated mitochondrial ROS generation in LPS-primed ROT-stimulated microglial cells may contribute to an enhanced microglial activation response via NLRP3 inflammasome activation.
c-Abl and PKCδ activation is augmented in a time-dependent manner in LPS-primed ROT-stimulated microglial cells
To this point our data indicate that LPS priming and subsequent ROT stimulation enhances NLRP3 inflammasome activation. In order to identify the signaling pathways utilized by LPS and ROT stimulation to enhance NLRP3 inflammasome activity, we considered redox sensitive signaling pathways likely to be activated during LPS and ROT stimulation. Accumulating evidence indicates that the non-receptor tyrosine kinase c-Abl participates in numerous neurodegenerative diseases and that its activation can cause neuroinflammation and oxidative stress-induced neuronal injury in mouse model of AD and PD (Alvarez et al., 2004; Schlatterer et al., 2011a; Schlatterer et al., 2011b). Thus, we first assessed whether heightened oxidative stress response and perturbation of mitochondrial function impact c-Abl activity upon exposure of cells to ROT for increasing duration (1-6h) in BV2 microglial cells and c-Abl activation was also determined by WB analysis. In cells that were exposed to ROT or LPS, a modest increase in the magnitude of phosphorylated levels of c-Abl was evidenced. Conversely, LPS priming and subsequent stimulation with ROT elicited robust increase (>1.6-fold increase) in c-Abl phosphorylation at 3h and a sustained activation was evidenced for the remainder of the treatment period consistent with an aberrant activation state (fig 3(A)). In this context, the extent of phosphorylation was found to be dramatically increased on two distinct tyrosine residues (Tyr245 and Tyr412) in LPS/ROT stimulated cells as compared with LPS or ROT only treated cells. c-Abl phosphorylation at Tyr245 and Tyr412 serves as an indirect measure of c-Abl activation (Dorey et al., 2001; Ko et al., 2010). In fact, they are well established regulatory phsophotyrosine residues that are required for c-Abl activation (Brasher and Van Etten, 2000; Katsumata et al., 2012). Densitometric analysis confirmed that LPS priming induced a significant time-dependent increase in the phosphorylation of c-Abl (p<0.01) (fig 3(A)). To further determine whether LPS or ROT or combination-induced alteration of p-c-Abl levels could be attributed to transcriptional changes, we determined the transcript levels of c-Abl in BV2 cells exposed to these agents (data not shown).
Figure 3. Phosphorylation of c-Abl tyrosine kinase and PKCδ was enhanced in BV2 microglial cells following LPS priming and subsequent stimulation with ROT.

BV2 microglial cells were treated as described in 1(E). Post treatment, whole cell lysate were prepared and immunoblotted for p-c-Abl (Y412, Y245), c-Abl, p-PKCδ (Y311) and PKCδ (A). β actin was used as loading control. The expression level of p-c-Abl is enhanced upon LPS/ROT stimulation. Significant difference between control and the treatment groups are indicated as *p<0.05 and **p< 0.01, whereas #p<0.05 and # #p< 0.01 denotes significance between time-matched ROT and LPS-primed ROT groups. The p-c-Abl and p-PKCδ band intensity were normalized to c-Abl and PKCδ, respectively. The normalized band intensity represented as the mean ± S.E.M. of at least 4 independent experiments; n.s.: not significant. (B) Primary microglial cells were treated as described in 1(H). Whole cell lysates were prepared and c-Abl phosphorylation status was probed by western blotting using antibodies specific to pY412, pY245 and c-Abl. β actin was used as loading control. The upper panels show bands of p-c-Abl, c-Abl and β actin. Densitometric scanning reveals significant increase in c-Abl activation in response to LPS and rotenone stimulation. Data are expressed as mean ± S.E.M.; *p<0.05, **p< 0.01 and ***p< 0.001 vs control, whereas # #p< 0.01 denotes significance between ROT and LPS-primed ROT groups. (C) Representative Immunofluorescent images depicting the distribution of p-c-Abl (Y412) (red) immunoreactive cells in primary mouse microglial cells subjected to same treatment conditions as described in 1(H). The nucleus was counterstained with Hoechst stain (blue). Immunofluorescence of p-c-Abl (Y412) was markedly enhanced in LPS-primed ROT-stimulated cells as compared with ROT treated cells. Experiments were performed in triplicates and representative of at least three independent experiments. Scale bar in E = 100μM. c-Abl= c-Abl tyrosine kinase and PKCδ= Protein Kinase C δ.
We next determined the expression of p-c-Abl Y412 in primary microglial cells either exposed to LPS or ROT or sequentially exposed to LPS and ROT by fluorescence microscopy. We observed a modest expression of p-c-Abl Y412, which is depicted as red fluorescence in LPS or ROT treated cells as compared with control cells; however, strong immunoreactivity for p-c-Abl Y412 was evidenced in LPS/ROT treated cells as compared with control cells (fig 3(C)). To further ascertain c-Abl activation, next we investigated whether the expression of c-Abl and p-c-Abl was altered in mouse primary microglial cells exposed to low dose of LPS or ROT or LPS/ROT using WB analysis. A marked increase in Y412 phosphorylated and Y245 phosphorylated c-Abl protein levels were evidenced in LPS-primed cells that were subsequently stimulated with ROT as compared with control cells (fig 3(B)), further corroborating immunofluorescence analysis. A modest increase in p-c-Abl levels were evidenced in LPS or ROT alone treated cells. These results indicate that sequential treatment with LPS and ROT accentuates c-Abl activation in microglial cells.
Previous studies have demonstrated that c-Abl plays an essential role in PKCδ activation in response to oxidative stress (Gonfloni et al., 2012). In this context, c-Abl has been shown to phosphorylate PKCδ on tyrosine 311, which has been linked to apoptotic death in H2O2 treated cells (Lu et al., 2007). Furthermore, recently we demonstrated a positive association between PKCδ upregulation and microglia activation and that genetic ablation of PKCδ attenuated LPS-induced proinflammatory response (Gordon et al., 2016). Therefore, we examined whether exposure to LPS or ROT or in combination activated PKCδ, a downstream mediator of c-Abl. Similar to the temporal pattern of activation of c-Abl, a time-dependent parallel increase in p-PKCδ Y311 expression levels were evidenced in ROT-stimulated cells that were primed with LPS as compared with LPS or ROT alone treated cells (fig 3(A)). Our results suggest that a LPS-induced generation of intracellular ROS in conjunction with high grade mitochondrially derived ROS originating from ROT-induced disruption of mitochondrial ETC might have contributed to a heightened oxidative stress environment which in turn might have been conducive for the aberrant activation of c-Abl and PKCδ.
Mitochondria-derived ROS drives the NLRP3 inflammasome activation and redox sensitive kinase activation in ROT stimulated cells
Studies have implicated ROS-derived from dysfunctional mitochondria may be linked to sustained NLRP3 inflammasome activation and IL-1β secretion (Tschopp and Schroder, 2010; Bauernfeind et al., 2011; Zhou et al., 2011; Kauppinen et al., 2012; Chen et al., 2015; Jang et al., 2015). Numerous NLRP3 activators have been shown to trigger mitochondrial ROS production in a variety of cells. For example, fatty acid palmitate has been shown to promote NLRP3 inflammasome activation and IL-1β release via mitochondria-generated ROS dependent fashion (Wen et al., 2011a). Because ROT treatment revealed the potential involvement of mitochondria-derived ROS in the enhanced oxidative stress response, we next utilized mitochondria-targeted antioxidant to dissect in detail the role of mitochondrial ROS on NLRP3 inflammasome activation and IL-1β secretion. In these experiments, BV2 cells were pretreated with mitoTEMPO (200 and 500μM), mitochondria-targeted ROS scavenger (Nakahira et al., 2011), for 1h prior to LPS priming and subsequently stimulated with ROT. Notably, the LPS and ROT-induced mitochondrial ROS production in BV2 cells was markedly inhibited by mitoTEMPO (fig 4(A)). ROS generation induced by the combination of LPS and ROT was reduced by 20 and 40% following treatment with 200 and 500μM mitoTEMPO, respectively (fig 4(A)). Notably, mitoTEMPO (200, 500μM) elicited significant reduction (p<0.01) in ROS generation correlated with diminished secretion of IL-1β and IL-18 in response to ROT and LPS (fig 4(D)). Additionally, repression of expression of NLRP3, caspase-1 cleavage was also evidenced in mitoTEMPO pretreated cells that were stimulated with ROT subsequent to LPS priming (fig 4(B)). Given that PKCδ and c-Abl are redox sensitive protein kinases and were activated upon stimulation with ROT in LPS-primed cells, we further investigated the importance of mitochondria-derived ROS on the activation of the two pro-oxidant kinases. We found that ROT induced phosphorylation of c-Abl at both 412 and 245 sites and PKCδ at Y311 site was blunted (p<0.01) at both 200 and 500μM mitoTEMPO, respectively (fig 4(C)) as detected via WB. Together, these results indicate that mitoTEMPO attenuated NLRP3 inflammasome activation and activation of redox sensitive kinases such as c-Abl suggesting that mitochondria-derived ROS may mediate NLRP3 inflammasome activation via c-Abl/PKCδ signaling axis in response to LPS and ROT in microglial cells.
Figure 4. Mitochondrial ROS drives the NLRP3 inflammasome activation, c-Abl and PKCδ phosphorylation and inflammatory mediators release in LPS-primed rotenone stimulated BV2 cells.

(A) BV2 microglial cells were pretreated with MitoTEMPO (200μM or 500μM) for 1 hour, followed by priming with LPS (1μg/ml) for 3 hours. The primed cells were subsequently stimulated with ROT (0.5μM) for 6h. The reactive oxygen species production post treatment was quantified fluorometrically using CM-H2DCFDA dye. The data is expressed as percent of control and is represented as mean ± S.E.M.; n=8. *p<0.05, **p<0.01 and ***p<0.001 versus control; a ap<0.01 vs ROT; while # #p<0.01 denotes significance between LPS-primed ROT treated groups with and without MitoTEMPO (B, C) The whole cell lysate were immunoblotted for NLRP3, caspase-1 (cleaved) (B), p-c-Abl (Y412), p-c-Abl (Y245), c-Abl, p-PKCδ (Y311) and PKCδ (C). β actin was used as loading control. The densitometric analysis of normalized band intensity for each treatment group was plotted on histogram and is represented as mean ± S.E.M. for each experiment performed with n=4. *p<0.05, **p<0.01 and ***p<0.001 versus control; ap<0.05 and a ap<0.01 represents significant difference between ROT vs LPS-primed ROT treatment groups; while #p<0.05, # #p<0.01 and # # #p<0.001 denotes significance between LPS-primed ROT treated groups with and without MitoTEMPO; n.s.: not significant. (D) The cell supernatant was assessed for secreted IL-1β and IL-18 by ELISA. The data is represented as mean ± S.E.M.. n=6. ***p<0.001 and ****p<0.0001 compared with control; a a a ap<0.0001 represents significant difference between ROT vs LPS-primed ROT treatment groups; while # #p<0.01 and # # #p<0.001 denotes significance between LPS-primed ROT treated groups with and without MitoTEMPO.
Mitochondrial dysfunction and NLRP3 inflammasome activation is elicited in a c-Abl dependent manner in LPS primed ROT stimulated microglial cells
A growing body of evidence indicates that c-Abl inhibitor could suppress neurotoxicity and neuroinflammation in experimental models of PD and AD (Jing et al., 2009; Estrada et al., 2011; Karuppagounder et al., 2014; Brahmachari et al., 2016). In an effort to assess the anti-inflammatory effects of DAS, a dual c-Abl/c-Src kinase inhibitor (Lombardo et al., 2004), we used the LPS-stimulated BV2 microglial cells as a model of neuroinflammation. DAS attenuated the expression of key inflammatory markers in a concentration-dependent manner. More specifically, DAS treatment decreased the secretion proinflammatory cytokines and NF-κB nuclear translocation (supplement fig 1). Given that DAS effectively suppressed the induction of proinflammatory markers at 100nM, we used the same concentration to elucidate the mechanistic basis of the anti-inflammatory effects. In another study, phosphorylation of c-Abl in NSC-34 cells expressing mutant or WT SOD was found to be reduced at 100nM (Katsumata et al., 2012). Stimulation of BV2 microglial cells with LPS (1μg/ml) and ROT (0.5μM) for 6h induced a 1.8-fold increase in active p-c-Abl levels (Y412 and Y245) (fig 3(A)) with a concomitant increase in c-Abl kinase activity (4.5 fold) as compared with ROT treated cells (fig 5(A)). However, upon 1h pretreatment with 100nM DAS a near complete abolition in c-Abl kinase activity was evidenced in LPS/ROT treated cells. These studies indicate that DAS inhibits c-Abl activation in LPS/ROT-stimulated microglial cells confirming the inhibitory effects of the drug on c-Abl activation (fig 5(A)). In fact, our WB findings corroborated our c-Abl enzymatic analysis whereby a marked reduction in p-c-Abl levels (Y412) was evidenced in LPS/ROT treated cells that were pretreated with DAS (fig 5(B)). Alternatively, the inhibitory effects of DAS on Src kinase cannot be excluded.
Figure 5. Dasatinib attenuates c-Abl activation, oxidative stress, dissipation of mitochondrial membrane potential (MMP, ΔΨm) in LPS-primed ROT stimulated BV2 cells.

(A) Whole cell lysates from LPS (1μg/ml)-primed BV2 microglial cells that were pretreated with DAS (100nM, 1h) and subsequently stimulated with ROT (0.5μM) for 6h were assessed for activation of c-Abl using the in vitro c-Abl activity assay. The values were converted to % control and are presented as mean ± S.E.M. *p<0.05 and ***p<0.001 compared with control cells; a a ap<0.001 represents significant difference between ROT vs LPS-primed ROT treatment groups; while #p<0.05 represents significance between LPS-primed ROT treated groups with and without DAS. (B) Following the same treatment regimen as described above cell lysates were immunoblotted for c-Abl and p-c-Abl (Y412). β actin was used as loading control. Densitometric quantification of immunoblots bands (lower panel) of BV2 microglial cells with or without DAS treatment demonstrated that LPS priming and ROT stimulation mediated increase in phosphorylation of c-Abl at Y412 is markedly reduced in DAS treated microglia. Data is presented as the mean ± S.E.M of three independent experiments. *p<0.05, **p<0.01 and ***p<0.001 compared with control cells; a ap<0.01 and a a ap<0.001 represents significant difference between ROT vs LPS-primed ROT treatment groups; while #p<0.05 and # #p<0.01 represents significance between LPS-primed ROT treated groups with and without DAS. (C-E) DAS attenuates MMP collapse and ROS generation in ROT-stimulated LPS-primed BV2 cells. BV2 microglial cells were treated as above. Post treatment changes in the mitochondrial potential (C), intracellular ROS (D) and mitochondrial superoxide (E) were determined by spectrofluormetry using JC-1, CM-H2DCFDA and mitosox dye, respectively, in BV2 microglial cells. The results are expressed as % of control and presented as mean ± S.E.M., N≤6. (F-H) BV2 microglial cells were treated as above (5(A)). Post treatment, cell supernatants were analyzed for nitrite release via Griess method (F), mRNA levels (G) and protein expression of iNOS (H) in BV2 cells. The elevated expression of iNOS was antagonized by DAS in LPS primed ROT stimulated BV2 cells. The mRNA data normalized to 18S is presented as mean ± S.E.M., n=4-6. β actin antibody was used as loading control in western blots. The normalized densitometric analyses are representative of at least three independent experiments and data is expressed as mean ± S.E.M. *p <0.05, **p <0.01, ***p<0.001 and ****p <0.0001 compared with control cells; a ap<0.01 and a a ap<0.001 represents significant difference between ROT vs LPS-primed ROT treatment groups; while #p<0.05 and # #p<0.01 denotes significance between LPS-primed ROT treated groups with and without DAS. n.s.: not significant.
We next explored whether DAS inhibits ROS generation and NLRP3 inflammasome activation in LPS/ROT-stimulated BV2 microglial and mouse primary microglial cells. Interestingly, DAS pretreatment significantly inhibited loss of MMP, generation of ROS and nitrite production (fig 5(C-H)), NLRP3 expression (fig 6(A-C)), ASC oligomerization (sup. fig 2), caspase-1 activation (fig 6(D)) and secretion of IL-1β and IL-18 (fig 6(E)) under these experimental conditions in BV2 microglial cells. Likewise, DAS pretreatment suppressed expression of NLRP3 related markers in primary microglia subjected to the afore mentioned treatment conditions (fig 6(F,G)).
Figure 6. Dasatinib attenuates NLRP3 inflammasome in the LPS-primed ROT stimulated microglia. (A-C).

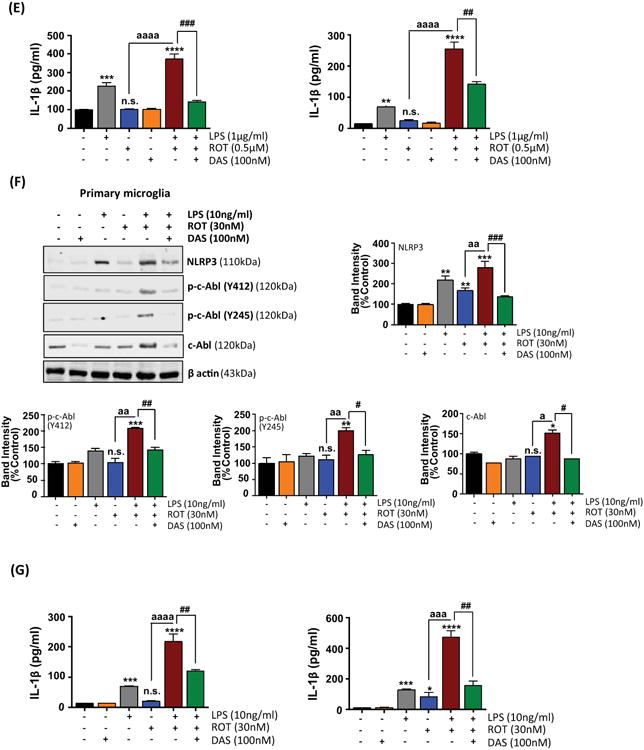
DAS pretreatment partially attenuates the upregulation of NLRP3 related markers in LPS primed rot stimulated primary microglial cells. BV2 microglial cells were treated as described above, cell lysates were analyzed for NLRP3 (A), caspase-1 (pro and cleaved) (B), IL-1β (pro-& cleaved) (C) by immunoblotting. Panel below shows densitometric scanning analysis of cleaved caspase-1 (p10) and IL-1β in the cell culture supernatants in cells treated same as in 5(A). The data is expressed as % of control and represented as mean ± S.E.M and representative of three independent experiments. *p<0.05 and **p<0.01 versus control; ap<0.05 represents significant difference between ROT versus LPS-primed ROT treatment groups; while #p<0.05 and # #p<0.01 represents significance between LPS-primed ROT treated groups with and without DAS. (D) Caspase-1 activity was determined fluorometrically using caspase-1 specific substrate as described in the Materials and Methods section. The data represented as ± S.E.M. of % of control from three different experiments (n≤6). *p<0.05 and ***p<0.001 vs control; a ap<0.01 represents significant difference between ROT vs LPS-primed ROT treated group; while # # #p <0.001 denotes significance between LPS-primed ROT treated groups with and without DAS. (E) ELISA analysis of IL-1β and IL-18 in supernatants of BV2 cells exposed to LPS or ROT or in combination. The ELISA results are represented as mean ± S.E.M, n=6. ***p<0.001 and ****p<0.0001 vs control group; a a a ap<0.0001 represents significant difference between ROT and LPS-primed ROT treated group; while # #p<0.01 and # # #p <0.001 denotes significance between LPS-primed ROT treated groups with and without DAS. n.s.: not significant. (F) Immunoblot analysis of whole cell lysates for NLRP3, p-cAbl (Y245 and Y412) and c-Abl in DAS (100nM) pretreated LPS (10ng/ml)-primed primary mouse microglial cells that were stimulated with ROT (30nM) for 4h. The data is expressed as % of control and represented as mean ± S.E.M, n=4. *p<0.05, **p<0.01 and ***p<0.001 denotes significant difference from control; ap<0.05 and a ap<0.01 represents significant difference between ROT vs LPS-primed ROT treatment groups; while #p<0.05, # #p<0.01 and # # #p<0.001 denotes significance between LPS-primed ROT treated groups with and without DAS. n.s.: not significant. (G) Posttreatment ELISA analysis of IL-1β and IL-18 in supernatants of primary microglia. The ELISA results are represented as mean ± S.E.M, n=6. ***p<0.001 and ****p<0.0001 vs control group; a a ap<0.001 and a a a ap<0.0001 represents significant difference between ROT and LPS-primed ROT treatment groups; while # #p<0.01 denotes significance between LPS-primed ROT treated groups with and without DAS. n.s.: not significant.
To further ascertain the role of c-Abl in NLRP3 inflammasome activation in our experimental conditions, we utilized a siRNA system to specifically downregulate c-Abl protein levels in BV2 microglia and studied the microglial activation response in response to ROT in LPS-primed cells. In pilot experiments, we obtained optimal suppression of c-Abl protein at 48h following transfection as assessed via WB analysis. We found an 80% reduction in the levels of c-Abl in cells that were transfected with the c-Abl siRNA as compared with scramble-transfected cells (fig 7(A)). Transfection of BV2 microglial cells with siRNA targeted to c-Abl inhibited LPS and ROT-induced increase in the expression and secretion of NLRP3 by approximately 85% (fig 7(B)). Additionally, in LPS and ROT sequentially treated cells c-Abl siRNA prevented secretion of cleaved NLRP3, casp-1 (p10) as well as IL-1β by 80%, 84% and 70%, respectively as compared with scramble ROT-treated cells (fig 7(B)). ELISA analysis confirmed the inhibitory effects of c-Abl knock-down on IL-1β and IL-18 extracellular release (fig 7(C)). Our results suggest that c-Abl plays a role in NLRP3 inflammasome activation induced by LPS and the aggravation of NLRP3 inflammasome signaling occurs following ROT-induced excessive ROS generation. We next examined the impact of siRNA-mediated knock-down of c-Abl in primary microglial cells exposed to LPS and ROT. Upon verification of depletion of endogenous c-Abl levels by c-Abl targeted siRNA (fig 7(D)), we next investigated NLRP3 inflammasome activation using WB analysis. A diminished pattern of NLRP3 inflammasome activation as reflected by reduced expression levels of NLRP3 and secreted NLRP3, IL-1β and caspase-1 were evidenced in response to LPS and ROT in c-Abl siRNA transfected as compared with scramble transfected cells (fig 7(E)). ELISA studies further corroborated that LPS and ROT potentiates NLRP3 inflammasome activation as reflected by increased IL-1β and IL-18 levels (fig 7(F)). These studies suggest that c-Abl mediates NLRP3 inflammasome activation via ROS generation in LPS-primed ROT-stimulated microglial cells.
Figure 7. RNAi-mediated knockdown of c-Abl attenuates LPS/rotenone-induced NLRP3 inflammasome activation and pro-inflammatory cytokines release.
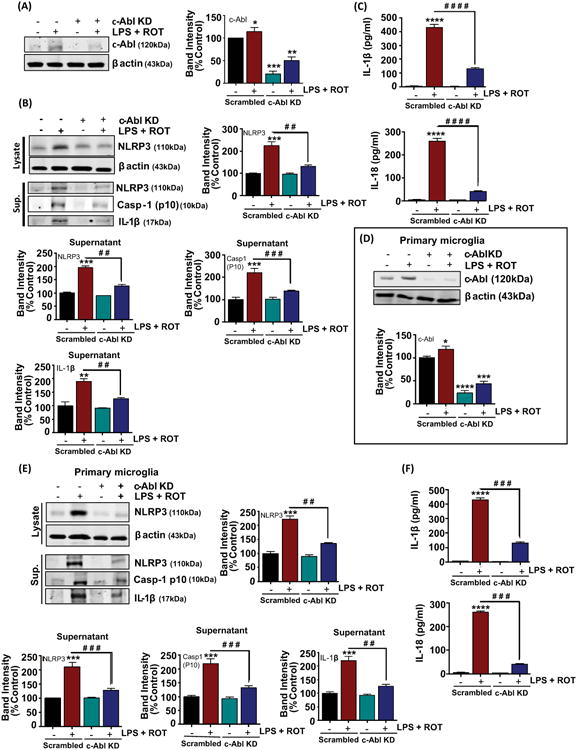
(A) The BV2 microglial cells were transfected with the indicated siRNAs for 48h and whole cell lysates were collected and analyzed by immunoblotting with c-Abl. The level of c-Abl was dramatically reduced in c-Abl siRNA transfected cells as compared with scramble transfected cells. (B) Immunoblotting for NLRP3 related markers in the supernatant (sup.) and whole cell lysates of BV2 cells subjected to the same treatment conditions as detailed above (fig 5(A)). β actin was used as loading control. The bar graph represents densitometric analysis. Bands were normalized to β actin and are presented as mean ± S.E.M. of % control of at least three independent experimental repeats. *p< 0.05, **p < 0.01 and ***p< 0.001 versus scrambled control, while # #p<0.01 and # # #p<0.001 denotes significance between LPS-primed scrambled transfected cells treated with ROT versus LPS-primed c-Abl knockdown transfected cells treated with ROT. (C) Supernatants of the siRNAs transfected BV2 cells posttreatment were analyzed for Il-1β and IL-18 using ELISA. The is represented as mean ± S.E.M. of 2 independent experiments with n=3-4 per experiment per group. ****p< 0.0001 versus scrambled control group and # # # # #p<0.0001 versus scrambled transfected cells treated with LPS+ROT. (D) Primary mouse microglial cells were transfected with either scrambled or c-Abl siRNA. 48 hrs post transfection, primary microglial cells were subjected to immunoblot analysis for c-Abl to confirm efficient downregulation of c-Abl expression. Representative immunoblot image confirming siRNA KD of c-Abl, but not scrambled siRNA, reduces c-Abl protein to less than 25% of control levels in primary microglial cells. (E) 48h post-siRNA transfection experiments primary microglial cells were subjected to the same treatment conditions as detailed above (7(D)). Whole Cell lysate and culture supernatant (sup.) as indicated were collected and immunoblotted with antibodies against NLRP3, cleaved caspase-1 and IL-1β. The immunoblots were normalized to β actin; values were presented as % of control and mean ± S.E.M. of 4 independent experiments. *p < 0.05, ***p < 0.001 and ****p< 0.0001 versus scrambled control, while # #p<0.01 and # # #p<0.001 denotes significance between LPS-primed scrambled transfected cells treated with ROT versus LPS-primed c-Abl knockdown transfected cells treated with ROT. (F) ELISA analysis of primary microglial cell culture supernatant for secreted IL-1β and IL-18. The ELISA data are expressed as means ± S.E.M. of at least three replicates per treatment and are representative of at least three independent experiments. ****p< 0.0001 versus scrambled control, while # # #p <0.001 denotes significance between scrambled transfected vs c-Abl knock down primary microglia primed with LPS and treated with ROT.
Dasatinib suppresses increased trafficking of NLRP3 to mitochondria in LPS-primed ROT-stimulated microglial cells
Previous studies have demonstrated that NLRP3 has the propensity to accumulate in the mitochondria upon exposure to NLRP3 inducing stimuli such as nigericin (Subramanian et al., 2013). Thus, we hypothesized that NLRP3 inflammasome activation is associated with NLRP3 translocation to mitochondria. We performed immunofluorescence studies to determine the cellular localization pattern of NLRP3 upon exposure to LPS, ROT or LPS/ROT in mouse primary microglial cells. Confocal double immunofluorescence analysis was performed using NLRP3 (green) and TOM20 (red) (fig 8), which is mitochondrial marker that is routinely used to demonstrate mitochondrial translocation in a wide variety of cells. Examination of the distribution pattern of NLRP3 revealed that it exhibited a more dispersed expression pattern in the cytoplasm in primary microglial cells that were treated with the vehicle. By contrast a dramatic increase in NLRP3 compartmentalization within the mitochondria was evidenced in primary microglial cells that were stimulated with LPS/ROT, while LPS and ROT displayed a modest increase in mitochondrial translocation. Consistent with our data, in a recent study, Iyer et al. demonstrated that mitochondria play a pivotal role in NLRP3 activation via the direct interaction of NLRP3 to the mitochondria via cardiolipin (Iyer et al., 2013). Remarkably, DAS inhibited NLRP3 trafficking to the mitochondria in LPS/ROT stimulated primary microglial cells (fig 8, last row). These results further show that DAS-induced attenuation of c-Abl activation may limit ROT-induced mitochondrial dysfunction and resultant redistribution of NLRP3 to mitochondria in LPS-primed cells as previously reported (Iyer et al., 2013; Subramanian et al., 2013).
Figure 8. Confocal images demonstrating the inhibitory effects of dasatinib on Rotenone-induced re-localization of NLRP3 to the mitochondria in LPS-primed primary microglia.

Primary microglia treated as described in 6(F). Representative confocal immunofluorescent images of cells that were co-immunostained for NLRP3 (green) and TOM20 (red) followed by staining with Hoechst for nucleus (blue). Merged images of NLRP3 and TOM20 (yellow) indicated by arrows. LPS priming and ROT stimulation of primary microglial cells caused an increase in the colocalization of NLRP3 and TOM20. Results are representative of at least 3 experiments. Scale bar = 50μm.
Dasatinib inhibits NF-κB activation in ROT-stimulated LPS-primed microglial cells
Previously we and other have demonstrated that inflammagen LPS-induced NF-κB activation in BV2 microglial cells (Gao et al., 2013; Panicker et al., 2015; Gordon et al., 2016). Likewise, in ROT-treated BV2 cells a marked increase in NF-κB activity was evidenced post drug treatment (Yuan et al., 2013). Furthermore, NLRP3 expression has been shown to be induced by NF-κB in murine hepatocytes (Boaru et al., 2015). Therefore, we hypothesized that exacerbated NF-κB activation in LPS/ROT-treated cells may underlie the amplified proinflammatory response evidenced in these cells. Activation of NF-κB transcription factor is crucial for proinflammatory gene transcription. In the resting state, NF-κB is sequestered in the cytoplasm as an inactive complex via interaction with the IκBα inhibitory protein. Following exposure to inflammagens, IκBα in the NF-κB complex is phosphorylated by IκBα kinase (IκK), ubiquitinated and eventually degraded via ubiquitin-proteasomal system (UPS); thereby leading to the translocation of p65 to the nucleus (Karin, 1999; Aldieri et al., 2003). Thus, we assessed the magnitude of NF-κB activation in LPS/ROT-stimulated cells as compared with LPS or ROT treatment. For this purpose, we determined the activation status of p65 subunit of NF-κB by WB analysis in BV2 cells that were treated with LPS, ROT or LPS/ROT for 10 or 20min. A rapid relocalization of p65 to the nucleus as early as 10min in BV2 cells exposed to LPS. In contrast, LPS priming and subsequent stimulation with ROT for 6h resulted in a significant (p<0.05) increase in p65 nuclear translocation (fig 9(A)). To further confirm NF-κB activation in these cells, we determined p-IκBα levels using WB analysis. A marked upregulation of IκBα phosphorylation at Ser32 site was found to parallel nuclear translocation of p65 in LPS/ROT treated cells at 6h as compared with LPS or ROT only treated cells (fig 9(B)). Indeed, nuclear translocation of p65 correlated with increased levels of NF-κB gene products including IL-1β, IL-18 (fig 1(F)) and NOS2 (fig 5(G)) in LPS/ROT treated BV2 cells. Our results are consistent with previous studies showing that NF-κB activation is mediated via degradation of IκBα proteins and accompanying p65 nuclear translocation in cells that are stimulated with immune modulators (Sakurai et al., 2003; Vermeulen et al., 2003).
Figure 9. Dasatinib inhibits Rotenone-induced NF-κB activation in LPS-primed BV2 cells. (A, B).
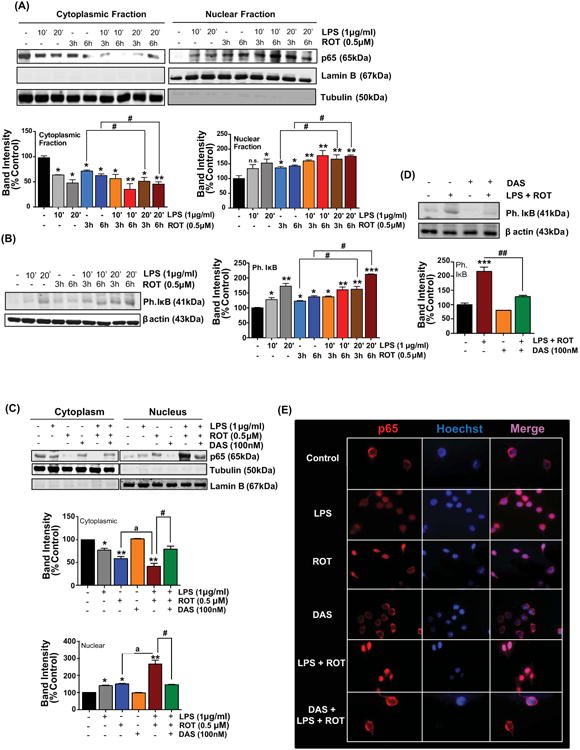
Rotenone augments LPS-induced p65 translocation to the nucleus. Representative immunoblots reveal time course changes for p65 and phospho IκB. (A) Immunobloting analysis were performed in BV2 cells that were primed with LPS for 10 and 20 minutes and subsequently treated with or without rotenone for 3 and 6h. Subcellular fractionation studies were carried out and cytoplasmic and nuclear fractions were immunoblotted for p65. The blots were further probed with lamin B and tubulin, respectively, for determining equal loading and to confirm the purity of nuclear and cytosolic fractions. Densitometric scanning analysis depicted below. The relative p65 was normalized to lamin B or tubulin. Data presented is representative of at least 3 independent experiments. Values are converted to % control and expressed as mean ± S.E.M. (B) BV2 cells were stimulated as described in 9(A). At the end of the treatment period, whole cell lysate was immunoblotted for p-IκB and β actin. The relative p-IκB and was normalized to β actin. The % control values are expressed as mean ± S.E.M. *p<0.05, **p< 0.01 and ***p< 0.001 vs control group, whereas #p< 0.05 denotes significance between time-matched ROT and LPS-primed ROT groups; n.s.: not significant. (C, D) DAS attenuates nuclear translocation of p65 and phosphorylation of IκB in LPS-primed ROT-stimulated BV2 cells. BV2 cells were pretreated with DAS (100nM, 1h) followed by treatment with LPS (1μg/ml, 20min) and ROT (0.5μM, 6h). Western blot analysis following fractionation of cellular extracts and whole cell lysates from microglial cells showed that DAS pretreatment attenuated nuclear translocation of p65 (C) and p-IκB levels (D) in LPS-primed ROT-stimulated cells. The normalized band intensity for each treatment group is represented as mean ± S.E.M. *p<0.05, **p<0.01 and ***p<0.001 vs control group; ap<0.05 represents significant difference between ROT and LPS-primed ROT treatment groups; whereas #p<0.05 and # #p<0.01 denotes significance between LPS-primed ROT treated groups with and without DAS. (E) DAS attenuates excessive nuclear translocation of p65 in LPS primed ROT stimulated microglia. Representative immunofluorescence images showing cellular localization of p65. Immunohistochemical staining was performed using an antibody against p65 (red) subunit of NF-κB while nucleus was counterstained with Hoechst stain (Blue). Nuclear localization was determined in 3-4 random fields per slide. These results are representative of at least 3 independent experiments. Scale bar = 100μm.
In order to determine the effect of DAS on LPS/ROT-induced NF-κB signaling, BV2 microglial cells were pretreated with DAS and subsequently primed with LPS and stimulated with ROT. Incubation of BV2 microglia with 100nM DAS prior to LPS/ROT treatment for 1h significantly attenuated NF-κB activation as evidenced by the retention of p65 in the cytosol as assessed via immunoblotting (fig 9(C)) and immunofluorescence studies (fig 9(E)). Likewise, our WB studies further confirmed the inhibitory effects of DAS on NF-κB activation in LPS/ROT treated BV2 cells as measured by decreased IκBα phosphorylation (pS32) (fig 9(D)) and nuclear translocation of p65 (fig 9(C)). These results suggest that DAS-associated anti-inflammatory effects might at least in part mediated via suppression of c-Abl/NF-κB interplay presumably limiting the magnitude of the accentuated proinflammatory signaling cascade involving NLRP3 inflammasome activation.
c-Abl is linked to the impairment of ALS in ROT-stimulated LPS-primed microglial cells
Autophagy represents an intracellular cellular degradative machinery that degrades damaged organelles or misfolded proteins via lysosomal degradative machinery. In a previous study ROT was found to induce disruption of autophagic flux in SH-SY5Y cells and in the substantia nigra (SNpc) in Parkinsonian rats (Wu et al., 2015). In this context, excessive accumulation of autophagosomes with a concomitant disruption of lysosomal function was evidenced in these cells. Moreover, multiple reports indicate that autophagy is a negative regulator of NLRP3 inflammosome activation (Saitoh et al., 2008; Nakahira et al., 2011; Chuang et al., 2013). Therefore, we examined whether autophagy changes occur following LPS or ROT stimulation or LPS and ROT sequential treatment by examining the expression levels of beclin1, p62, LC3B I and LC3B II using western blot analysis. Beclin 1 is a critical component of the class III phosphatidylinositide 3-kinase (PI3K) complex, which been shown to participate in autophagosome formation (McKnight and Zhenyu, 2013). p62 is an adaptor protein that is involved in the formation of a linkage between LC3B II and the ubiquitinylated proteins to be degraded and has been routinely used for monitoring autophagic flux (Komatsu and Ichimura, 2010). The microtubule associated protein LC3B I is present in the cytoplasm however, upon association with phosphatidylethanolamine (via an ubiquitin like conjugation reaction) of the membrane of autophagosome leads to the conversion to LC3B II, a widely used autophagosome marker (Tanida et al., 2008). Both p62 and LC3B II are degraded together with ubiquitinylated protein following autophagosome fusion with the lysosome (Tanida et al., 2008; Komatsu and Ichimura, 2010). BV2 microglial cells were incubated with either LPS or ROT or primed with LPS prior to ROT (0.5μM) stimulation for increasing time period (1, 3 and 6h). As shown in fig 10(A), a sustained and dramatic increase in autophagy mediators including LC3B II, and beclin1 with a concomitant upregulation of p62 levels was evidenced in cells that were primed with LPS prior to ROT stimulation as compared with control cells. Also, a significant increase in these markers was evidenced in cells exposed to LPS or ROT alone treated cells as compared with controls. A similar scenario was evidenced in primary microglial cells exposed to LPS or ROT or combination (fig 10(B)). Additionally, we also performed immunofluorescent studies to determine LC3B positive puncta. Consistent with our WB findings, exposure of primary microglial cells to LPS and ROT resulted in a dramatic increase in LC3B positive puncta as compared with LPS or ROT treated cells (fig 10(F)). Next, we determined whether LPS/ROT-induced autophagy upregulation is mediated in a c-Abl dependent manner. Because maximal increments in autophagy related markers occurred at 6h post LPS/ROT stimulation, 6h was chosen to study the effects of DAS on ROT-induced impairment in autophagic flux in LPS-primed microglia. Data show that DAS attenuated ROT-induced increases in autophagy markers in LPS-primed cells as compared with controls (fig 10(C)). To further ascertain the role of c-Abl in the upregulation of autophagic mediators in LPS/ROT stimulated cells, primary microglial cells were transiently transfected with siRNA targeting c-Abl or scramble siRNA. Subsequently cells were primed with LPS (10ng/ml) for 3h and stimulated with ROT (30nM) for 4h in order to assess modulation of autophagic markers. Our data revealed that LC3B II, beclin1, p62 levels after stimulation with ROT in LPS-primed cells was significantly lower in siRNA c-Abl transfected cells as compared with siRNA scrambled transfected cells (fig 10(G)). Our results are consistent with previous studies demonstrating a positive association between c-Abl induction and disruption of autophagic flux (Hu et al., 2012; Mahul-Mellier et al., 2014). Our studies suggest that c-Abl-mediated impairment in the clearance of autophagic vacuoles (AVs) might partly underlie the excessive buildup of AVs in LPS/ROT-stimulated microglial cells.
Figure 10. Involvement of c-Abl in ROT-induced impairment of ALS in LPS primed microglial cells.
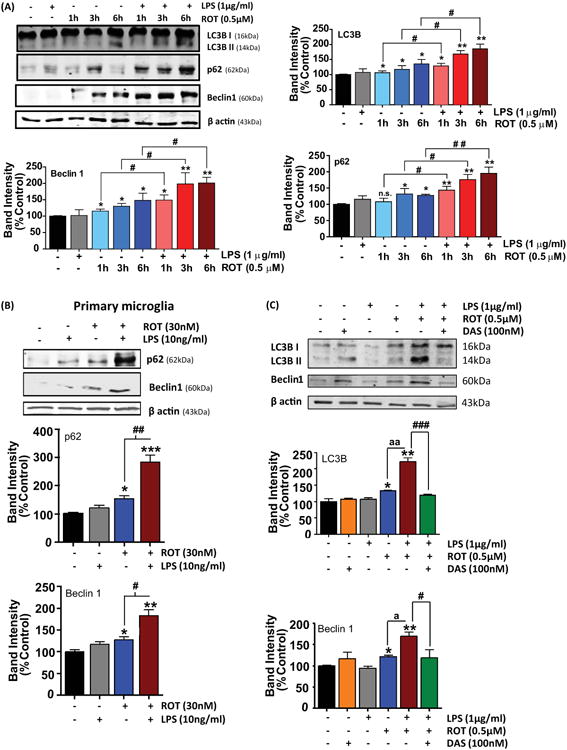
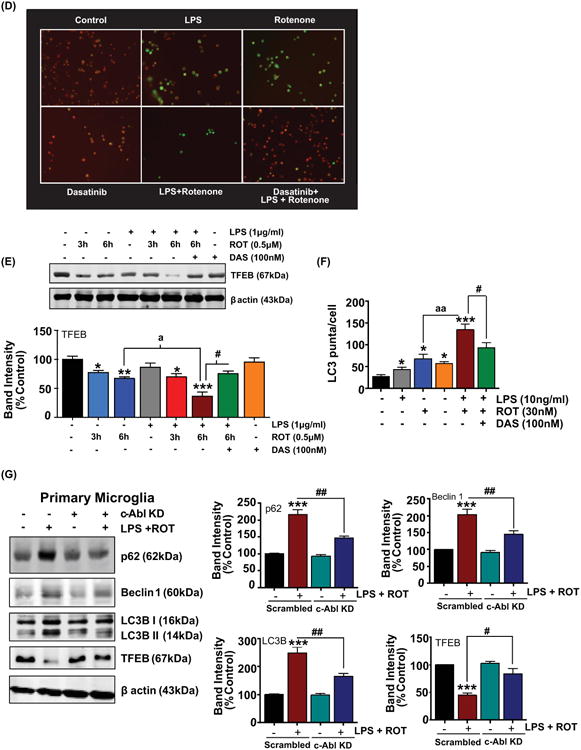
(A-B) Rotenone augments autophagolysosomal dysfunction in LPS-primed microglial cells. (A) Enhancement of ALS markers in LPS-primed ROT stimulated BV2 cells. BV2 microglial cells were treated same as above (fig 1(E)) for the indicated time period. Post treatment, whole cell lysates were collected and immunoblotted with antibodies for Microtubule-associated protein light chain 3B (LC3B), p62 and Beclin1. A time-dependent increase in the expression of ALS markers is evidenced in LPS-primed ROT stimulated cells as compared with ROT treated cells. The levels of indicated proteins were normalized to β actin and the normalized band intensity for each treatment group is represented as mean ± S.E.M. *p<0.05 and **p<0.01 compared with control, whereas #p<0.05 and # #p<0.01 represents significance between time-matched ROT vs LPS-primed ROT treated group; n.s.: not significant. Results representative of at least 3 independent experiments. (B) Primary microglia were treated as described above (fig 1(H)). At the end of the treatment period, whole cell lysates were collected and immunobloted for p62 and beclin1. The bar graphs represent densitometric scanning analysis of immunoblotted bands. The representative immunoblots are an average of 4 independent experiments and represented as mean ± S.E.M. *p <0.05, **p <0.01 and ***p <0.001 vs control, while #p<0.05 and # #p<0.01 represents significance between time-matched ROT vs LPS-primed ROT treated group. (C-E) Effect of DAS on ROT-induced ALS dysfunction in LPS-primed BV2 cells. BV2 microglial cells were treated as in fig 5(A). Post treatment, whole cell lysate was collected and immunoblotted for the autophagy related markers: LC3B, Beclin1 (C). β actin was used as loading control. LC3B and beclin1 levels were increased in LPS and ROT stimulated cells whereas these markers were further increased by LPS priming. DAS pretreatment caused a near complete abrogation of LC3B and beclin1 levels in cells stimulated with LPS and ROT. The densitometric analysis of band intensity for each treatment group normalized to the respective β actin and plotted on histogram as average of 3 independent experiments and represented as mean ± S.E.M. *p<0.05, **p<0.01 and ***p<0.001 versus control; ap<0.05 and a ap<0.01 represents significant difference between ROT versus LPS-primed ROT treatment groups; while #p<0.05 and # # #p<0.001 denotes significance between LPS-primed ROT treated groups with and without DAS. (D) DAS attenuates loss of lysosomal membrane potential (LMP) in LPS-primed ROT-stimulated BV2 cells. BV2 microglial cells were treated as in fig 5(A). Post treatment, BV2 cells were stained with acridine orange for the determination of lysosomal integrity. ROT-induced loss of lysosomal membrane permeability was exaggerated by LPS priming. DAS pretreatment attenuated ROT induced loss of LMP in LPS primed BV2 microglial cells. Original magnification X40. The representative image from each treatment group is shown; n=3 coverslip pretreatment group and representative of two independent experiments. (E) Immunoblot analysis of whole cell lysates for lysosomal biogenesis marker (TFEB) and β actin. BV2 microglial cells were primed with LPS (1μg/ml) for 3h followed by ROT (0.5μM) for 3 and 6h. DAS (100nM, 1h) pretreatment was performed to analyze the role of c-Abl. Panel below represent the densitometric analysis of TFEB normalized to β actin and presented as % of control. ROT causes dramatic reduction in TFEB level at 6h in LPS-primed BV2 cells, which was significantly recovered by DSA pre-exposure. The values are plotted as mean ± S.E.M. of at least 4 experiments. *p<0.05, **p<0.01 and ***p<0.001 versus control; ap<0.05 versus time-matched ROT group; while #p<0.05 denotes significance between LPS-primed ROT (6h) treated groups with and without DAS. (F) Primary microglia were treated as described in fig 6(F). The numbers of LC3B positive puncta were quantified. The bar graph depicts the intensity of the puncta per cell. Experiment was performed with n=3 coverslips per treatment group of at least two independent replicates. *p <0.05 and ***p <0.001 vs control, a ap<0.01 vs ROT and #p<0.05 vs LPS-primed ROT-treated group. (G) Effect of c-Abl knock down on ROT-induced ALS dysfunction in LPS-primed primary microglia. After transfection of mouse primary microglial cells with scrambled or c-Abl specific siRNA for 48h then cells were subjected to the same treatment conditions as described in fig 7(D). Efficient c-Abl depletion was achieved in all microglia culture. Immunoblot analysis for expression of LC3B, p62, Beclin1 and TFEB were performed in lysates of cells transfected with scrambled or c-Abl specific siRNA. Reduced levels of ALS markers were evidenced in c-Abl siRNA transfected microglia as compared with scrambled siRNA transfected cells that were sequentially treated with LPS and ROT. The bar graphs depict the densitometric scanning analysis of the immunoblot bands. The relative ALS marker levels were normalized to β actin. Data presented is representative of at least 4 independent experiments. The % control values are expressed as means ± S.E.M. ***p<0.001 versus scrambled control, while #p<0.05 and # #p<0.01 denotes significance between LPS-primed scrambled transfected cells treated with ROT versus LPS-primed c-Abl siRNA transfected cells treated with ROT.
It is well established that impairment in lysosomal function blocks autophagic degradation of damaged organelles and long lived proteins. In fact, the acidic environment of lysosome is critical for the degradation of autophagosomes (Mizushima, 2007a, b; Yang and Klionsky, 2009). Furthermore, lysosome-destabilizing agent mediated lysosomal rupture has been implicated in activation of NLRP3 inflammasome (Lima et al., 2013). To ascertain whether lysosomal activity is modulated in LPS-primed ROT-exposed cells, we used the acridine orange immunofluorescence analysis. Acridine orange dye can be trapped within intact acidic lysosomes resulting in red fluorescence, while in the cytoplasm they fluoresce green when the lysosomal acidity is lost. Consistent with previous studies (Carrithers et al., 2007; Mader et al., 2012), immunofluorescence analysis revealed that exposure of BV2 microglia to either ROT or LPS alone decreased lysosomal acidification indicating decreased lysosomal integrity. Interestingly, cells sequentially treated with LPS and ROT displayed a marked attenuation of lysosomal acidification as judged by a near complete abolition of acridine orange florescence, as compared with control cells (fig 10(D)). As expected, DAS pretreatment restored lysosomal acidity in LPS/ROT-treated cells as evidenced by a marked increase in the proportion of cells exhibiting red fluorescence. Collectively, these results suggest that LPS priming might exacerbate ROT-induced impairment in autophagic flux via impairment of lysosomal function.
The transcription factor EB (TFEB) has been shown to be a master regulator of the ALS pathway that is regulated by mTOR signaling events (Decressac et al., 2013). In cellular models of protein misfolding and oxidative stress, enhancement of TFEB function has been found to be associated with improved protein clearance and neuroprotection. Given that we observed excessive accumulation of autophagic mediators in cells that received a combination of LPS and ROT, we addressed the possibility whether impairment in lysosomal biogenesis might contribute to the impairment in autophagic flux. For this purpose, we determined time-dependent regulation of TFEB levels in LPS or ROT or in LPS-primed cells that were exposed to ROT for varying duration using WB analysis. A time-dependent reduction in the expression levels of TFEB was evidenced in ROT treated cells (0.5μM, 3 and 6h); however, in cells that were stimulated with LPS/ROT, a further time dependent increase in the depletion of TFEB levels was evidenced during the entire treatment duration as compared with control cells (fig 10(E)), which is suggestive of defective lysosomal biogenesis. Intriguingly, we found that DAS significantly attenuated ROT-induced depletion of TFEB in LPS-primed cells further confirming its restorative effects on lysosomal function (fig 10(E)). These results suggested that impairment in the clearance of AVs in LPS/ROT-stimulated cells might be attributed at least in part to lysosomal dysfunction originating from a failed lysosomal degradative machinery. Taken together, our data highlights the pivotal role of c-Abl in ROT-induced ALS dysfunction in LPS-primed cells.
Enhancement of PKCδ and c-Abl activation correlates positively with TH neuron loss in LPS-primed ROT-stimulated midbrain neuron-glia cultures
Given that both c-Abl and PKCδ displayed aberrant activation in LPS and ROT sequentially treated microglial cells as compared with LPS or ROT treatment (fig 1(H)), we next examined whether LPS and ROT exacerbated c-Abl and PKCδ activation in midbrain neuron-glia cultures and how this relates to the levels of TH. As shown in fig 11(A), sequential treatment with LPS and ROT significantly increased p-c-Abl (Y412) and p-PKCδ (Y311) levels as compared with LPS or ROT only treated neuron-glia mixed cultures indicative of redox sensitive kinase activation. These results further confirmed activation of both c-Abl and PKCδ activation, which may, in part, elicit a heightened oxidative stress response in response to LPS and ROT in these cells. Notably, we found that aberrant activation of the afore mentioned redox sensitive kinases positively correlated with TH loss and that DAS restored the loss of TH levels in LPS and ROT stimulated mixed neuron glia coculture (fig 11(B)).
Figure 11. Dasatanib attenuated the activation of c-Abl and partially reduced TH neuronal loss in ventral midbrain neuron glia culture primed with LPS and stimulated with ROT.

(A) Ventral mesencephalic culture were pretreated or not with DAS (100nM, 1h) then primed with LPS (1μg/ml, 3h) and subsequently either left unstimulated or stimulated with ROT (0.5μM) for 6h. Cell lysates were immunoblotted with indicated antibodies. DAS attenuated c-Abl and PKCδ activation in LPS primed ROT stimulated ventral midbrain cultures. (B) Likewise, DAS inhibited TH depletion in LPS and ROT treated cells. Band intensities were quantified using densitometric scanning analysis and the relative expression levels of c-Abl, p-c-abl, PKCδ, p-PKCδ were normalized to β actin. Results are representative of at least two independent experiments. Values are converted to % of control and expressed as means ± S.E.M. *p<0.05 and ***p<0.001 vs non-treated control; a ap<0.01 and a a ap<0.001 denotes significant difference between ROT and LPS-primed ROT treatment groups; while #p<0.05 and # #p<0.01 indicates significance between LPS-primed ROT-treated groups with DAS vs without DAS. n.s.: not significant.
It has been found that ROT enhances oxidative stress response and DAgic cell death in mixed neuron-glia culture as compared with neuron enriched culture that were pretreated with LPS (Gao et al., 2002a). Since DAS blocked the activation of the redox sensitive kinase, it is plausible that heightened glia-dependent c-Abl-mediated oxidative stress response may enhance proinflammatory cascade and subsequent dopaminergic neurodegeneration. However, further studies are needed to determine whether there is a differential loss of TH positive cells in midbrain neuron enriched culture upon LPS and ROT stimulation.
Dasatinib treatment attenuates behavioral deficits, NLRP3 inflammasome activation and ALS dysfunction in the substantia nigra of LPS treated mice
To determine whether data generated using isolated microglia could be translated into an in vivo setting, we used the LPS neuroinflammation model of PD. We and others have demonstrated that LPS elicits a marked increase in proinflammatory mediators levels (Tomas-Camardiel et al., 2005; de Pablos et al., 2014; Gordon et al., 2016). Moreover, previous studies have demonstrated that DAS prevents neuroinflammatory response in a mouse model of Amyotrophic lateral sclerosis and AD (Dhawan and Combs, 2012; Katsumata et al., 2012). Therefore, we next sought to determine the in vivo efficacy of DAS in LPS-treated mice. The mice were administered 25mg/kg/d DAS via oral gavage for 30 days before LPS (5mg/kg, i.p.) administration. Based on the anti-inflammatory effects of DAS we hypothesized that blockade of c-Abl dependent downstream immune signaling cascade may suppress the sickness behavior in these mice. To assess the severity of the sickness behavior we assessed motor activity. Mice treated with LPS showed significant reduction in the cumulative distance traveled, vertical and horizontal activity as compared with the controls. However, when mice were treated with DAS we observed a remarkable improvement in LPS-induced sickness behavior as reflected in the improvement of the locomotor activity. To further evaluate sickness behavior, we performed Rotarod analysis in these mice. The recovery of DAS pretreated mice from endotoxin shock is further confirmed in the Rotarod test. The improved exploratory behavior in DAS-pretreated LPS-administered mice might be attributed to amelioration of LPS-induced septicemia or alternatively a rapid recovery from this illness. These data highlight that interference of c-Abl activation via DAS can abrogate microglial proinflammatory signaling cascade via suppression of NLRP3 inflammasome related markers, which in turn may contribute to an improvement in sickness behavior after LPS treatment. We next investigated whether DAS would directly reduce proinflammatory response in LPS treated mice. We found that DAS reduced ionized calcium binding adapter molecule 1 (IBA-1, microglial marker) and NLRP3 expression in the substantia nigra of LPS treated mice (fig. 12(J and K)). Likewise, DAS attenuated the mRNA levels of NLRP3 and IL-1β but not TNFα and IL-18, and Cas-1 in the SNc of LPS treated mice as assessed via qRT-PCR analysis (Fig. 12 (E-I)). Next, we determined whether DAS directly affected the activation of c-Abl and PKCδ. Western blot analysis revealed that DAS attenuated LPS-induced hyperphosphorylation of c-Abl kinase at Tyr245 and Ty412 residues and its downstream substrate PKCδ (pY311) (fig. 13(A)). Next, we assessed whether DAS affected ALS markers in LPS treated mice. As expected, in LPS-treated mice, increased protein expression of beclin1 was accompanied by down regulation of TFEB consistent with ALS dysfunction (fig 13(B)). These changes in ALS markers were also significantly ameliorated by DAS. Taken together these data suggest that the anti-inflammatory effects of DAS, might at least in part mediated via attenuation of redox sensitive kinases and restoration of the ALS function in LPS treated mice.
Figure 12. The anti-inflammatory effects of dasatinib on LPS-induced sickness behavior and expression of proinflammatory markers in the substantia nigra.
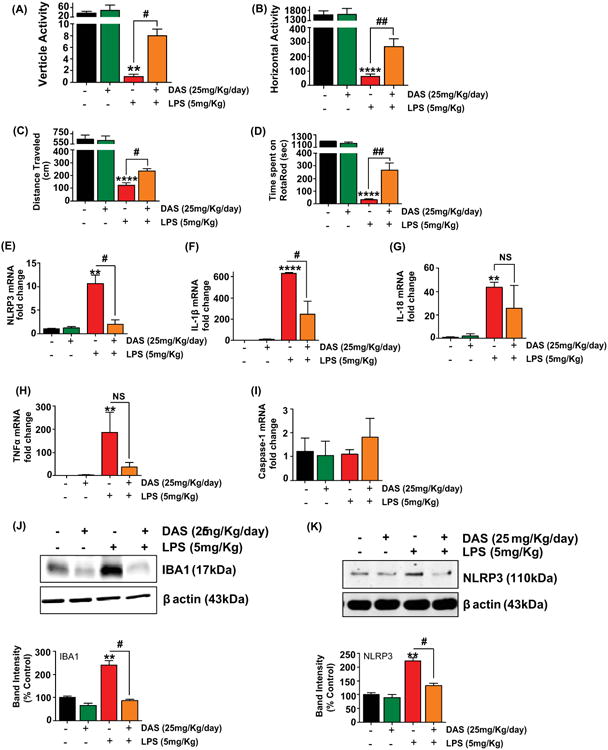
The mice were administered DAS (25mg/kg) or vehicle, once daily via oral gavage for 30 days followed by a single IP injection of LPS (5mg/kg) or vehicle. At the end of 6h following LPS treatment mice were assessed for locomotor activities using the VersaMax analyzer. (A) total vertical activity, (B) total horizontal movement and (C) total distance travelled were quantified LPS-administered mice exhibited sickness behavior consistent with endotoxemia in comparison DAS-pretreated LPS injected mice exhibited normal behavior comparable to saline treated animals. (D) Mice were also tested for motor performance on a rotarod. The latency to fall off the rotarod was increased in DAS-pretreated LPS injected mice. Data are expressed as the mean ± S.E.M. from 3-4 mice. The data is representative of at least three independent experiments. **p<0.01 and ****p<0.0001 compared with saline-treated control group; #p<0.05 and # #p<0.01 shows significant difference between LPS treated group vs DAS+LPS treated group. The effect of DAS on the LPS-induced upregulation of the mRNA expression of proinflammatory markers in the substantia nigra (SNpc). Mice were treated as indicated in 12(A). At the end of behavioral analysis, qRT-PCR analysis was performed to evaluate the changes in mRNA expression of NLRP3 (E), IL-1β (F), IL-18 (G), TNFα (H) and Caspase-1 (I) in the SNAc. DAS attenuated LPS-induced upregulation of NLRP3 and IL-1β but not TNFα, IL-18 or caspase-1. Values are the mean ± S.E.M. (n=3-4 in each group). **p<0.01 and ****p<0.0001 compared with saline-treated control group; #p<0.05 and # #p<0.01 shows significant difference between LPS treated group vs DAS+LPS treated group; NS = not significant. Suppression of glial activation by DAS treatment in the SN of LPS treated mice. (J) Quantification of immunoblots for IBA1. LPS treatment induced microglial activation in the SN as indicated by increased IBA1 expression, however, DAS pre-treatment dramatically reduced LPS-induced microgliosis. Levels of β actin was used an internal loading control. (K) Immunoblotting of NLRP3 in SN lysates. LPS-treated mice showed increased protein expression of NLRP3, which was significantly blocked by DAS pretreatment. Data expressed as the mean ± S.E.M. (n=3-4). **p<0.01 vs control group and #p<0.05 vs LPS-treated group.
Figure 13. The therapeutic effect of DAS in ameliorating activation of redox sensitive kinases and ALS markers in the LPS treated mice.

DAS suppresses LPS-induced upregulation of redox sensitive kinases and ALS dysfunction in the SNpc. Mice were treated as indicated in fig 12. (A) Representative immunoblot images showing relative levels of c-Abl and phospho-c- Abl (Y245 and Y412) in the SN of mice at 6h post LPS treatment. Densitometric scanning analysis revealed that LPS treatment caused hyperphosphorylation of c-Abl tyosine kinase at both activation sites (Y245 and Y412), which was blocked significantly by DAS pre-treatment. Similarly, a marked increase in phosphorylation of PKCδ at Y311 residue was evidenced in LPS treated mice while DAS pretreated mice demonstrated a significant reduction in the phosphorylation of PKCδ. Levels of β actin was used an internal loading control. The p-c-Abl and p-PKCδ band intensity were normalized to c-Abl and PKCδ, respectively, and c-Abl and PKCδ were normalized to β actin. Data expressed as the mean ± S.E.M. (N=3-4) of % control. *p<0.05 and **p<0.01 versus saline-treated control group; #p<0.05 versus LPS group. (B) DAS protects against LPS-induced ALS dysfunction by decreasing beclin-1 levels and increasing TFEB levels in the substantia nigra of LPS treated mice. Whole cell lysates were prepared from the SNpc and immunoblotted for beclin-1 and TFEB. Densitometric scanning reveals DAS significantly (p<0.05) ameliorated ALS dysfunction. The bands were normalized to β actin. Data represented as the mean ± S.E.M. (N=3-4). **p<0.01 versus saline-treated control group; #p<0.05 versus LPS group.
Discussion
Herein we demonstrate that c-Abl may have a potential regulatory role in the modulation of NLRP3 related markers in the LPS and ROT-stimulated microglia and in an in vivo LPS model of neuroinflammation. Upon LPS priming and subsequent stimulation of microglia by ROT a dramatic increase in c-Abl levels, mitochondrial dysfunction, maturation and secretion of NLRP3 inflammasome related markers, NF-κB activation, trafficking of NLRP3 to the mitochondria, and ALS dysfunction as compared with LPS or ROT-treated cells were evidenced. Additionally, NLRP3 was significantly increased in the supernatant of microglia primed with LPS and stimulated with ROT, the role of altered plasma membrane permeability in the mechanism of NLRP3 release into the extracellular media cannot be entirely ruled out. Similarly, acceleration of NLRP3 inflammasome activation and ALS dysfunction was evidenced in LPS-primed ROT-stimulated primary microglial cells. Furthermore, antioxidant mitoTEMPO reduced activation of NLRP3, c-Abl, PKCδ as well as ROS generation in LPS-primed ROT-stimulated BV2 microglial cells. Intriguingly, DAS, a tyrosine kinase inhibitor, was found to inhibit NLRP3 inflammasome activation. Subsequent mechanistic studies revealed that DAS mitigated the activation of c-Abl induced by LPS and ROT. Moreover, the anti-inflammatory effects of DAS on LPS/ROT-stimulated microglial activation was found to be mediated in part via inhibition of mitochondrial dysfunction, ROS generation, mitochondrial trafficking of NLRP3, NF-κB activation and ALS impairment, further confirming the multi-target directed effects of DAS. However, the lack of selectivity and off target effects of these compounds promoted us to further investigate the role of c-Abl in the exacerbation of proinflammatory signaling cascade in LPS-primed ROT-stimulated microglial cells using c-Abl specific siRNA. Our studies revealed the novel signaling events linking c-Abl to NLRP3 inflammasome activation in microglial cells. Our in vivo studies validated the in vitro findings, whereby in a neuroinflammation LPS model of PD a positive association was evidenced between microglial activation, NLRP3 upregulation and c-Abl activation. Moreover, we found that the administration of DAS resulted in reduced sickness behavior and improved motor function in correlation with its anti-inflammatory effects in LPS treated mice. The results are, to the best of our knowledge, the first to demonstrate that LPS priming and subsequent stimulation with ROT amplifies microglial activation response via an exacerbated NLRP3 inflammasome activation response through mechanisms that involve mitochondrial ROS dependent c-Abl activation and presumably ALS dysfunction.
Central or peripheral inflammation has been shown to promote the transformation of primed state of microglia into an activated state, which can trigger or induce processes related to neurodegeneration. Accumulating evidence demonstrate that systemic inflammation exacerbate PD-associated neurodegenerative process (Ferrari and Tarelli, 2011). For example, people infected with Japanese encephalitis virus ad H5N1 influenza virus showed an increased risk for developing PD (Shoji et al., 1993; Jang et al., 2009). Additionally, inflammation triggered by bacteria or virus has been implicated in α-synuclein misfolding, aggregation and propagation (Lema Tome et al., 2013). Thus, interplay between brain inflammation and systemic inflammation may contribute to the progression of neurodegenerative diseases including PD. Therefore, improved understanding of the mechanisms that underlie microglial activation and their transition to a hyperactivated phenotype may lead to the development of therapeutics that reduces the exacerbation of PD symptomology and delay disease progression.
Our present study demonstrates that NLRP3 inflammasome activation is enhanced in LPS-primed and ROT-stimulated microglia. In this context, we demonstrate that LPS priming and ROT stimulation exaggerated microglial NLRP3, IL-1β, IL-18 mRNA and protein expression levels as well as the secretion of mature IL-1β and IL-18. Furthermore, activated caspase-1 was potentiated in LPS-primed ROT-stimulated cells suggesting that NLRP3 inflammasome assembly has occurred which in turn has contributed to increased generation of proinflammatory cytokines. Our data is consistent with a recent report demonstrating that microglia can release IL-1β and IL-18 in an NLRP3 inflammasome dependent manner (Gustin et al., 2015). In fact, in both AD brains and in AD transgenic mice NLRP3 inflammasome activation has been evidenced (Mitroulis et al., 2010). Additionally, transactive response DNA binding protein 43 (TDP-43) has been shown to activate microglia via the NLRP3 inflammasome (Zhao et al., 2015). To further highlight the pivotal role of NLRP3 inflammasome in microglial activation response, we performed immunocytochemical studies in primary microglia exposed to LPS or ROT or in combination. Our data indicate that ROT stimulation induces a marked redistribution of NLRP3 to mitochondria, whereby a punctate pattern of mitochondrial colocalization was evidenced. Recent reports suggest that upon activation NLRP3 translocate to the mitochondria and mitochondria associated endoplasmic reticulum (ER) membranes (Zhou et al., 2011). Moreover, upon stimulation with NLRP3 inflammasome activators, cardiolipin translocates from the inner to the outer mitochondrial membrane, which is believed to provide a docking position for NLRP3 and thereby facilitating the localization of NLRP3 (which is located in the ER prior to macrophage stimulation) to the mitochondria (Iyer et al., 2013). Remarkably, DAS treatment resulted in the near complete blockade of NLRP3 relocalization to the mitochondria in primary microglia exposed to LPS and ROT. Thus, it is plausible that mitochondria bound NLRP3 in the vicinity of elevated ROS generation may be important for NLRP3 inflammasome activation.
Upon ROT administration, microglia-derived ROS such as superoxide, hydroxyl, and peroxynitrite has been shown to cause selective degeneration of SNc, owing to low levels of antioxidant defense and accompanying high levels of DA metabolism (Javed et al., 2016). More specifically, microglia derived ROS was found to be indispensable for ROT-induced DA degeneration (Gao et al., 2003). In recent years, a growing body of evidence supports the pivotal role of ROS in the activation of NLRP3 inflammasome (Zhou et al., 2010; Salminen et al., 2012; Jang et al., 2015). The mechanistic basis of ROS-dependent NLRP3 activation is poorly understood; however, both intracellular ROS and mitochondrial ROS has been implicated in the mechanism of NLRP3 inflammasome activation. Increasing evidence supports the involvement of mitochondrially derived ROS in NLRP3 inflammasome activation (Sorbara and Girardin, 2011; Zhou et al., 2011; Heid et al., 2013). Accordingly, in the present study ROT-induced mitochondrial electron transport chain (ETC) complex I inhibition and subsequent generation of ROS might have contributed to the excessive ROS generation in the presence of LPS. Consistent with our data, in a recent study ROT was found to induce NLRP3 inflammasome activation in the presence of an inflammasome activator (ATP) via a mechanism involving the generation of high grade mitochondrial ROS (Won et al., 2015). In another study, the saturated fatty acid palmitate was found to induce NLRP3 inflammasome activation and the release of IL-1β via a mitochondrial ROS-mediated mechanism (Wen et al., 2011a). In agreement with these findings, we demonstrated that cells that were sequentially treated with LPS and ROT showed a marked increase in ROS generation preceded elevated NLRP3 inflammasome activation as compared with LPS or ROT only treated cells. Accordingly, mitoTEMPO, a mitochondria-targeted antioxidant, attenuated NLRP3 inflammasome activation and consequent IL-1β secretion and caspase-1 activation at least in part via inhibition of c-Abl and PKCδ activation in LPS-primed ROT-stimulated cells further highlighting the pivotal role of mitochondria-derived ROS in NLRP3 inflammasome activation. Likewise, DAS also exhibited significant antioxidant effects as evidenced by significant abrogation of MMP collapse (fig 5(C)) with a concomitant suppression of ROS levels (fig 5(D)) in LPS-primed microglial cells that were stimulated with ROT. Here we provide direct experimental evidence that the continued presence of the initial triggers (e.g., LPS) was not required for persistent microglial activation and that the persistent ROS originating from defective mitochondria with disrupted mitochondrial ETC in the presence of ROT was sufficient to amplify the NLRP3 inflammasome activation in LPS-primed ROT-stimulated microglial cells.
The ubiquitously expressed c-Abl is activated in response to diverse stimuli including growth factors, cell adhesion, oxidative stress and DNA damage (for a review see (Gonfloni et al., 2012)). Multiple lines of evidence document a role for c-Abl in oxidative stress-induced neuronal injury and high levels have been evidenced in postmortem PD brains (Ko et al., 2010; Brahmachari et al., 2016). For example, a recent report has demonstrated a role for c-Abl in oxidative stress-induced neuronal cell death via Cdk5/GSK3b activation and tau hyperphosphorylation (Cancino et al., 2008). Treatment with STI571, a c-Abl kinase inhibitor, was found to decrease Cdk5 activation and Tau phosphorylation leading to the abrogation of neuronal cell death (Cancino et al., 2008). Moreover, other studies have focused on understanding the role of c-Abl in dopaminergic neuronal cell death. Despite this, only scant evidence is available regarding the regulatory effects of c-Abl in microglial activation response (Dhawan et al., 2012). Consistent with the pro-inflammatory effect of c-Abl in an experimental model of AD (Schlatterer et al., 2011b), herein we show that an exaggerated c-Abl activation positively correlated with an accentuated NLRP3 inflammasome activation in microglial cells that were sequentially stimulated with LPS and ROT. Conversely, DAS pretreatment not only inhibited c-Abl activation but also NLRP3 inflammasome activation as indicated by the inhibition of caspase-1 activity and resultant IL-1β and IL-18 secretion from these cells. In accordance with the DAS results, siRNA mediated knockdown of c-Abl showed a marked reduction in the expression levels of NLRP3 inflammasome related markers in BV2 cells (fig 7(B,C)) and primary microglial cells (fig 7(E,F)) sequentially treated with LPS and ROT. This study demonstrated, for the first time, that c-Abl is a critical determinant of NLRP3 inflammasome activation. Moreover, the extracellular release of NLRP3 alongside its activation might serve an additional regulatory role for the amplification of microglial proinflammatory response (Baroja-Mazo et al., 2014). Thus, a combination of brain inflammation and agrochemicals exposure may trigger or promote dopaminergic neurodegeneration (Gao et al., 2003). Indeed, in the present study we demonstrate that sequential stimulation of mixed neuro-glia culture with LPS and ROT leads to c-Abl activation and accompanying loss of TH positive neurons (fig 11), which may be probably mediated via enhanced oxidative stress and heightened microglial activation response. Thus, c-Abl-mediated activation of microglia may increase the susceptibility of dopaminergic neurons to cell death owing to increased susceptibility to oxidative stress.
The PKCδ signaling axis has been shown to regulate the release of proinflammatory mediators in murine microglial cells (Wen et al., 2011b). Previously we and others have reported that PKCδ signaling axis as one of the key factors in conferring susceptibility to proinflammatory stimuli (Wen et al., 2011b; Gordon et al., 2016). In this context, genetic ablation of PKCδ not only attenuated microglial activation response but also nigrostriatal dopaminergic neurotoxicity highlighting the pivotal role of redox sensitive kinase in microglial activation in response to diverse inflammagens. Here we demonstrate pronounced activation of redox sensitive kinase PKCδ in response to ROT stimulation in LPS-primed microglia as compared with LPS or ROT treated microglial cells. Collectively, these results suggest that interaction between c-Abl and PKCδ might at least in part contribute to the potentiation of the oxidative stress response and resultant exaggerated NLRP3 inflammasome activation in microglial cells sequentially exposed to LPS and ROT.
High levels of NF-κB activity have been identified in PD brains and anti-inflammatory agents have been shown to elicits their protective effects via inhibition of NF-κB signaling events (Ghosh et al., 2007). In fact, ROT has been shown to induce microglial activation via the NF-κB in a MAPK pathway dependent manner leading to increased generation of inflammatory cytokines in BV2 microglia (Gao et al., 2013). Consistent with this report, stimulation of BV2 microglial cells with LPS and ROT-induced a rapid accentuation of NF-κB activity as compared with control cells. NF-κB plays a key role in the regulation of transcription of several genes involved in the induction of an inflammatory response (Tak and Firestein, 2001; Wu et al., 2014). Consistent with these reports, we observed an exacerbation of gene transcription as well as protein expression of proinflammatory mediators including NLRP3, IL-1β, IL-18 and NOS2 in BV2 microglial cells stimulated with LPS and ROT as compared with ROT treated BV2 cells. Interestingly, Bauernfeind et al demonstrated that NF-κB, transcription factor promotes NLRP3 priming consequently leading to NLRP3 inflammasome assembly formation (Bauernfeind et al., 2009). The finding that microglial NLRP3 mRNA was sensitized to ROT following LPS priming further supports the involvement of this pathway in mitochondrial stress-induced exacerbation of proinflammatory priming. Also, c-Abl has been shown to be involved in doxorubicin induced NF-κB activation and imantinib, a c-Abl kinase inhibitor, treatment was found to attenuate its activation in breast cancer cells (Esparza-Lopez et al., 2013). In accordance with these findings, DAS not only inhibited NF-κB activity but also diminished mRNA and protein levels of iNOS and secretion of IL-1β and IL-18. Together, these data provide novel evidence that LPS priming and subsequent stimulation with ROT may accentuate proinflammatory signaling cascade presumably via c-Abl-mediated NF-κB-dependent NLRP3 inflammasome priming and subsequent activation. Thus, our studies raise the possibility that DAS may dampen the heightened microglial activation by interfering with both step-1 (NF-κB activation) and step-2 (NLRP3 activation) in cascade of events leading to NLRP3 inflammasome activation.
Defective autophagy has been implicated in neurodegenerative diseases including PD and AD (Kesidou et al., 2013). In this context, we recently demonstrated that methamphetamine (MA) induced dopaminergic neurotoxicity may be linked to concomitant impairment in mitochondrial function and autophagic flux (Kanthasamy et al., 2006; Lin et al., 2012). Additionally, recent reports implicate aberrant activation of c-Abl in the impaired autophagic clearance of α-synuclein and subsequent induction of dopaminergic neurotoxicity (Hebron et al., 2013a, b). Pharmacological inhibition of c-Abl was found to promote autophagic clearance of α-synuclein and nigral dopaminergic neuron survival (Hebron et al., 2013b, a). In this study, we provide evidence that LPS priming amplifies ROT-induced ALS impairment. Most importantly, our data demonstrates an exaggerated accumulation of autophagic markers and lysosomal dysfunction with a concomitant down regulation of TFEB, a master regulator of lysosomal biogenesis. Our data showing accumulation of autophagic markers is consistent with reports in PC-12 neuronal cells exposed to ROT (Wu et al., 2015). The loss of TFEB function has been shown to cause lysosomal dysfunction in several experimental models of neurodegenerative disease, which has been attributed to the accumulation of toxic aggregates originating from impaired lysosomal degradative machinery (Tsunemi et al., 2012; Cortes et al., 2014; Siddiqui et al., 2015). We were also able to demonstrate that DAS effectively restored the function of ALS in LPS-primed ROT-stimulated BV2 cells. Likewise, the knock down of c-Abl protein by siRNA elicited a similar response in primary microglial cells exposed to LPS and ROT. Emerging evidence implicates autophagy as a negative regulator of NLRP3 inflammasome (Nakahira et al., 2011; Zhou et al., 2011). Additionally, activation of autophagy by inflammatory signals has been shown to limit IL-1β production by targeting ubiquitinated inflammasomes for degradation thereby eliminating active inflammasomes (Shi et al., 2012). Given that c-Abl inhibits Parkin, a ubiquitin E3 ligase, and impairs autophagic clearance mechanisms (Ko et al., 2010), it is plausible that undegraded NLRP3 owing to impaired autolyosomal clearance mechanism may have contributed to the excessive inflammatory response evidenced in LPS/ROT-stimulated cells. Alternatively, it is plausible that exaggerated mitochondrial ROS levels originating from undegraded damaged mitochondria might have contributed to LMP, thereby leading to the disruption of lysosomal clearance of AVs and eventually to the enhancement of NLRP3 inflammasome activation. Our studies support an integral role for c-Abl in the impairment of lysosome-mediated autophagic clearance which in turn may, at least in part, contribute to heightened proinflammatory outcomes. Further studies are required to elucidate the relevance of disruption of mitophagy in the activation of NLRP3 inflammasome.
Inhibition of c-Abl activity via a myriad of pharmacological inhibitors have been shown to be neuroprotective in animal models of PD and AD (Cancino et al., 2008; Schlatterer et al., 2011a; Karuppagounder et al., 2014; Mahul-Mellier et al., 2014; Estrada et al., 2016). Dasatinib is an FDA approved drug for the treatment in cases of chronic phase Philadelphia chromosome-positive chronic myelogenous leukemia (CP-CML) (Brave et al., 2008). Moreover, it has been shown to cross the blood-brain barrier (Porkka et al., 2008; Katsumata et al., 2012). Based on our in vitro data that c-Abl-mediated microglial activation may serve as a significant source of inflammatory mediators, we next sought to confirm and extend our findings in vivo. Our results demonstrate that DAS suppresses NLRP3 inflammasome activation, microglial activation and ALS dysfunction in LPS treated mice (figs 12, 13). Consistent with our previous report (Gordon et al., 2016), here we show that systemic LPS challenge can induce CNS IL-1β synthesis and sickness behavior concomitant with a central inflammatory response. A novel finding of this study is DAS improved exploratory behavior in DAS-pretreated LPS-administered mice might be partly attributed to the amelioration of c-Abl dependent proinflammatory signaling cascade involving the NLRP3 inflammasome activation and associated ALS dysfunction. Although, the role of Src kinases cannot be excluded here. Together, the emerging picture demonstrates that c-Abl mediated regulation of NLRP3 inflammasome activity is multifaceted. DAS appears to inhibit NLRP3 inflammasome but does this by inhibiting c-Abl and downstream proinflammatory signaling cascade, which may be attributed to the inhibition of oxidative stress response that may be conducive for microglial activation. Further studies are needed to elucidate whether differential regulation of target cells might contribute to the anti-inflammatory effects of DAS in the LPS neuroinflammation model of PD.
Our current results demonstrate, for the first time, that aberrant c-Abl kinase activation may be linked to the amplification of NLRP3 inflammasome activation, mediated in part via mitochondria-derived ROS and presumably ALS dysfunction, in microglial cells exposed to LPS and ROT sequentially. Our data also provide novel evidence highlighting the multifacted anti-inflammatory effects of DAS. Notably, DAS administration attenuated both pro-inflammatory response in the brain and sickness behavior in LPS treated mice. Since the innate immune system has to recognize diverse damage associated molecular patterns (DAMPs) and pattern associated molecular patterns (PAMPs), our results suggest that c-Abl may serve as a pivotal oxidative stress sensor for NLRP3 inflammasome activation as well as anomalous protein aggregation mechanisms. c-Abl appears to be an attractive target because it impacts mutliple mechanims including ALS and inflammatory mechanisms that are implicated in the pathogenesis of PD. Thus, c-Abl has potential therapeutic implications in the treatment of inflammation related disorders including PD.
Supplementary Material
Sup. Fig. 1: Dasatinib causes dose-dependent attenuation of LPS-mediated activation of BV2 microglial cells. (A, B) DAS inhibits LPS-mediated NF-κB activation. (A) BV2 microglial cells were pretreated with 100nM DAS for 1h followed by treatment with LPS (1μg/ml) for 30min. Using immunofluorescence imaging, intracellular localization of p65 (red), an NF-κB subunit, was observed. Hoechst (blue) was used to stain the nuclei. The images represent 2 different experiments perform independently. The third row shows that LPS caused nuclear translocation of p65. Whereas, DAS pretreatment reduced the LPS-induced p65 translocation (bottom row). (B) IκB protein expression was analyzed using immunoblotting technique. BV2 cells pretreated with DAS (10, 30 and 100nM, 1h) were treated with 1μg/ml LPS for 30min. The whole cell lysates were collected at the indicated time and immunoblotted with the IκB antibody. Immunoblot reveals that LPS-mediated degradation of IκB was significantly recovered by DAS pretreatment in a dose-dependent manner. β actin was used as a loading control. The experiments were performed in duplicate at least 2 independent repetitions. (C) BV2 cells were pretreated with DAS (10, 30 and 100nM) for 1h followed by LPS (1μg/ml) treatment for 24h. The cell free supernatant was analyzed for secreted nitric oxide (NO) levels using Griess colorimetric assay. LPS caused >9-fold increase in extracellular release of NO, which was significantly reduced by DAS in a dose-dependent manner. The data represents the mean ± S.E.M. performed in replicates of 6. ***p<0.001 and **** p<0.0001 compared with LPS alone group. (D, E) Luminex® analysis of released inflammatory cytokines. BV2 cells were treated as described in sup. fig. 1(C) and cell free supernatant was collected for analysis of cytokines levels using Luminex® multiplex assay. The bar graph represents the concentration of IL-6 (D) and TNFα (E) in pg/ml. LPS induced aberrant release of these proinflammatory cytokines, while DAS pretreatment attenuated this effect. The data is presented as mean ± S.E.M. (n=6). *p<0.05, **p<0.01 and ***p<0.001 compare significance between LPS and DAS-pretreated LPS groups, while # # # #p<0.0001 denotes significance versus control group.
Sup. Fig. 2: c-Abl inhibitor attenuates ROT-induced oligomerization of ASC in LPS-primed BV2 cells. BV2 cells were pretreated with DAS (100nM, 1h) followed by priming with LPS (1μg/ml, 3h) and treatment with ROT (0.5μM) for 6h. Upon completion of treatment the cell lysates were subjected to centrifugation at 400 × g for 15 min at 4°C. The pellets were washed with PBS and subsequently cross linked with DSS for 30 min. The cross linked pellets and cell lysates were subsequently immunoblotted for ASC. The upper panel represents the immunoblot of cross linked (+ DSS) lysates and bottom blot represents the whole cell lysate (- DSS). β actin was used as a loading control. The results indicate that LPS-primed ROT-treated cells have increased expression of ASC with increased level of ASC oligomer (activated form). However, cells pretreated with DAS showed significant reduction in ASC expression and oligomerization induced by LPS and ROT. The bar graph represents the normalized densitometry data, represented as % of control. The data is presented as mean ± S.E.M. of two independent experiments. ***p<0.001 versus control, while # # # #p<0.0001 denotes significant difference between LPS-primed ROT-treated group with and without DAS pretreatment.
Acknowledgments
This work was supported by NIH grant NS078247 and NS088206 (awarded to A.K). The Dean's Professorship to A.K is also acknowledged. The W. Eugene and Linda Lloyd Endowed Chair to A.G.K. and Salisbury Chair to AK is also acknowledged.
Footnotes
Conflict of interest: The authors declare that they have no conflict of interest.
References
- Aldieri E, Atragene D, Bergandi L, Riganti C, Costamagna C, Bosia A, Ghigo D. Artemisinin inhibits inducible nitric oxide synthase and nuclear factor NF-kB activation. FEBS Lett. 2003;552:141–144. doi: 10.1016/s0014-5793(03)00905-0. [DOI] [PubMed] [Google Scholar]
- Alvarez AR, Sandoval PC, Leal NR, Castro PU, Kosik KS. Activation of the neuronal c-Abl tyrosine kinase by amyloid-beta-peptide and reactive oxygen species. Neurobiology of disease. 2004;17:326–336. doi: 10.1016/j.nbd.2004.06.007. [DOI] [PubMed] [Google Scholar]
- Andreyev AY, Kushnareva YE, Starkov AA. Mitochondrial metabolism of reactive oxygen species. Biochemistry (Mosc) 2005;70:200–214. doi: 10.1007/s10541-005-0102-7. [DOI] [PubMed] [Google Scholar]
- Baroja-Mazo A, Martin-Sanchez F, Gomez AI, Martinez CM, Amores-Iniesta J, Compan V, Barbera-Cremades M, Yague J, Ruiz-Ortiz E, Anton J, Bujan S, Couillin I, Brough D, Arostegui JI, Pelegrin P. The NLRP3 inflammasome is released as a particulate danger signal that amplifies the inflammatory response. Nat Immunol. 2014;15:738–748. doi: 10.1038/ni.2919. [DOI] [PubMed] [Google Scholar]
- Bauernfeind F, Bartok E, Rieger A, Franchi L, Nunez G, Hornung V. Cutting edge: reactive oxygen species inhibitors block priming, but not activation, of the NLRP3 inflammasome. J Immunol. 2011;187:613–617. doi: 10.4049/jimmunol.1100613. [DOI] [PMC free article] [PubMed] [Google Scholar]
- Bauernfeind FG, Horvath G, Stutz A, Alnemri ES, MacDonald K, Speert D, Fernandes-Alnemri T, Wu J, Monks BG, Fitzgerald KA, Hornung V, Latz E. Cutting edge: NF-kappaB activating pattern recognition and cytokine receptors license NLRP3 inflammasome activation by regulating NLRP3 expression. J Immunol. 2009;183:787–791. doi: 10.4049/jimmunol.0901363. [DOI] [PMC free article] [PubMed] [Google Scholar]
- Benetti E, Chiazza F, Patel NS, Collino M. The NLRP3 Inflammasome as a novel player of the intercellular crosstalk in metabolic disorders. Mediators Inflamm. 2013;2013:678627. doi: 10.1155/2013/678627. [DOI] [PMC free article] [PubMed] [Google Scholar]
- Betarbet R, Sherer TB, MacKenzie G, Garcia-Osuna M, Panov AV, Greenamyre JT. Chronic systemic pesticide exposure reproduces features of Parkinson's disease. Nat Neurosci. 2000;3:1301–1306. doi: 10.1038/81834. [DOI] [PubMed] [Google Scholar]
- Block ML, Zecca L, Hong JS. Microglia-mediated neurotoxicity: uncovering the molecular mechanisms. Nature reviews. 2007;8:57–69. doi: 10.1038/nrn2038. [DOI] [PubMed] [Google Scholar]
- Boaru SG, Borkham-Kamphorst E, Van de Leur E, Lehnen E, Liedtke C, Weiskirchen R. NLRP3 inflammasome expression is driven by NF-kappaB in cultured hepatocytes. Biochem Biophys Res Commun. 2015;458:700–706. doi: 10.1016/j.bbrc.2015.02.029. [DOI] [PubMed] [Google Scholar]
- Brahmachari S, Ge P, Lee SH, Kim D, Karuppagounder SS, Kumar M, Mao X, Shin JH, Lee Y, Pletnikova O, Troncoso JC, Dawson VL, Dawson TM, Ko HS. Activation of tyrosine kinase c-Abl contributes to alpha-synuclein-induced neurodegeneration. The Journal of clinical investigation. 2016;126:2970–2988. doi: 10.1172/JCI85456. [DOI] [PMC free article] [PubMed] [Google Scholar]
- Brasher BB, Van Etten RA. c-Abl has high intrinsic tyrosine kinase activity that is stimulated by mutation of the Src homology 3 domain and by autophosphorylation at two distinct regulatory tyrosines. J Biol Chem. 2000;275:35631–35637. doi: 10.1074/jbc.M005401200. [DOI] [PubMed] [Google Scholar]
- Brave M, Goodman V, Kaminskas E, Farrell A, Timmer W, Pope S, Harapanhalli R, Saber H, Morse D, Bullock J, Men A, Noory C, Ramchandani R, Kenna L, Booth B, Gobburu J, Jiang X, Sridhara R, Justice R, Pazdur R. Sprycel for chronic myeloid leukemia and Philadelphia chromosome-positive acute lymphoblastic leukemia resistant to or intolerant of imatinib mesylate. Clinical cancer research : an official journal of the American Association for Cancer Research. 2008;14:352–359. doi: 10.1158/1078-0432.CCR-07-4175. [DOI] [PubMed] [Google Scholar]
- Burm SM, Zuiderwijk-Sick EA, t Jong AE, van der Putten C, Veth J, Kondova I, Bajramovic JJ. Inflammasome-induced IL-1beta secretion in microglia is characterized by delayed kinetics and is only partially dependent on inflammatory caspases. J Neurosci. 2015;35:678–687. doi: 10.1523/JNEUROSCI.2510-14.2015. [DOI] [PMC free article] [PubMed] [Google Scholar]
- Cancino GI, Toledo EM, Leal NR, Hernandez DE, Yevenes LF, Inestrosa NC, Alvarez AR. STI571 prevents apoptosis, tau phosphorylation and behavioural impairments induced by Alzheimer's beta-amyloid deposits. Brain : a journal of neurology. 2008;131:2425–2442. doi: 10.1093/brain/awn125. [DOI] [PubMed] [Google Scholar]
- Carrithers MD, Dib-Hajj S, Carrithers LM, Tokmoulina G, Pypaert M, Jonas EA, Waxman SG. Expression of the voltage-gated sodium channel NaV1.5 in the macrophage late endosome regulates endosomal acidification. Journal of immunology. 2007;178:7822–7832. doi: 10.4049/jimmunol.178.12.7822. [DOI] [PubMed] [Google Scholar]
- Chakrabarti A, Banerjee S, Franchi L, Loo YM, Gale M, Jr, Nunez G, Silverman RH. RNase L activates the NLRP3 inflammasome during viral infections. Cell Host Microbe. 2015;17:466–477. doi: 10.1016/j.chom.2015.02.010. [DOI] [PMC free article] [PubMed] [Google Scholar]
- Chang CY, Choi DK, Lee DK, Hong YJ, Park EJ. Resveratrol confers protection against rotenone-induced neurotoxicity by modulating myeloperoxidase levels in glial cells. PLoS One. 2013;8:e60654. doi: 10.1371/journal.pone.0060654. [DOI] [PMC free article] [PubMed] [Google Scholar]
- Chao CC, Hu S, Peterson PK. Glia, cytokines, and neurotoxicity. Crit Rev Neurobiol. 1995;9:189–205. [PubMed] [Google Scholar]
- Charli A, Jin H, Anantharam V, Kanthasamy A, Kanthasamy AG. Alterations in mitochondrial dynamics induced by tebufenpyrad and pyridaben in a dopaminergic neuronal cell culture model. Neurotoxicology. 2016;53:302–313. doi: 10.1016/j.neuro.2015.06.007. [DOI] [PMC free article] [PubMed] [Google Scholar]
- Chen L, Na R, Boldt E, Ran Q. NLRP3 inflammasome activation by mitochondrial reactive oxygen species plays a key role in long-term cognitive impairment induced by paraquat exposure. Neurobiol Aging. 2015;36:2533–2543. doi: 10.1016/j.neurobiolaging.2015.05.018. [DOI] [PubMed] [Google Scholar]
- Chipuk JE, Bouchier-Hayes L, Green DR. Mitochondrial outer membrane permeabilization during apoptosis: the innocent bystander scenario. Cell Death Differ. 2006;13:1396–1402. doi: 10.1038/sj.cdd.4401963. [DOI] [PubMed] [Google Scholar]
- Chuang SY, Yang CH, Chou CC, Chiang YP, Chuang TH, Hsu LC. TLR-induced PAI-2 expression suppresses IL-1beta processing via increasing autophagy and NLRP3 degradation. Proc Natl Acad Sci U S A. 2013;110:16079–16084. doi: 10.1073/pnas.1306556110. [DOI] [PMC free article] [PubMed] [Google Scholar]
- Cortes CJ, Miranda HC, Frankowski H, Batlevi Y, Young JE, Le A, Ivanov N, Sopher BL, Carromeu C, Muotri AR, Garden GA, La Spada AR. Polyglutamine-expanded androgen receptor interferes with TFEB to elicit autophagy defects in SBMA. Nat Neurosci. 2014;17:1180–1189. doi: 10.1038/nn.3787. [DOI] [PMC free article] [PubMed] [Google Scholar]
- de Pablos RM, Herrera AJ, Espinosa-Oliva AM, Sarmiento M, Munoz MF, Machado A, Venero JL. Chronic stress enhances microglia activation and exacerbates death of nigral dopaminergic neurons under conditions of inflammation. Journal of neuroinflammation. 2014;11:34. doi: 10.1186/1742-2094-11-34. [DOI] [PMC free article] [PubMed] [Google Scholar]
- Decressac M, Mattsson B, Weikop P, Lundblad M, Jakobsson J, Bjorklund A. TFEB-mediated autophagy rescues midbrain dopamine neurons from alpha-synuclein toxicity. Proceedings of the National Academy of Sciences of the United States of America. 2013;110:E1817–1826. doi: 10.1073/pnas.1305623110. [DOI] [PMC free article] [PubMed] [Google Scholar]
- Dhawan G, Combs CK. Inhibition of Src kinase activity attenuates amyloid associated microgliosis in a murine model of Alzheimer's disease. Journal of neuroinflammation. 2012;9:117. doi: 10.1186/1742-2094-9-117. [DOI] [PMC free article] [PubMed] [Google Scholar]
- Dhawan G, Floden AM, Combs CK. Amyloid-beta oligomers stimulate microglia through a tyrosine kinase dependent mechanism. Neurobiol Aging. 2012;33:2247–2261. doi: 10.1016/j.neurobiolaging.2011.10.027. [DOI] [PMC free article] [PubMed] [Google Scholar]
- Dorey K, Engen JR, Kretzschmar J, Wilm M, Neubauer G, Schindler T, Superti-Furga G. Phosphorylation and structure-based functional studies reveal a positive and a negative role for the activation loop of the c-Abl tyrosine kinase. Oncogene. 2001;20:8075–8084. doi: 10.1038/sj.onc.1205017. [DOI] [PubMed] [Google Scholar]
- Dostert C, Petrilli V, Van Bruggen R, Steele C, Mossman BT, Tschopp J. Innate immune activation through Nalp3 inflammasome sensing of asbestos and silica. Science. 2008;320:674–677. doi: 10.1126/science.1156995. [DOI] [PMC free article] [PubMed] [Google Scholar]
- Esparza-Lopez J, Medina-Franco H, Escobar-Arriaga E, Leon-Rodriguez E, Zentella-Dehesa A, Ibarra-Sanchez MJ. Doxorubicin induces atypical NF-kappaB activation through c-Abl kinase activity in breast cancer cells. Journal of cancer research and clinical oncology. 2013;139:1625–1635. doi: 10.1007/s00432-013-1476-3. [DOI] [PMC free article] [PubMed] [Google Scholar]
- Estrada LD, Zanlungo SM, Alvarez AR. C-Abl tyrosine kinase signaling: a new player in AD tau pathology. Curr Alzheimer Res. 2011;8:643–651. doi: 10.2174/156720511796717249. [DOI] [PubMed] [Google Scholar]
- Estrada LD, Chamorro D, Yanez MJ, Gonzalez M, Leal N, von Bernhardi R, Dulcey AE, Marugan J, Ferrer M, Soto C, Zanlungo S, Inestrosa NC, Alvarez AR. Reduction of Blood Amyloid-beta Oligomers in Alzheimer's Disease Transgenic Mice by c-Abl Kinase Inhibition. Journal of Alzheimer's disease : JAD. 2016;54:1193–1205. doi: 10.3233/JAD-151087. [DOI] [PubMed] [Google Scholar]
- Ferger AI, Campanelli L, Reimer V, Muth KN, Merdian I, Ludolph AC, Witting A. Effects of mitochondrial dysfunction on the immunological properties of microglia. Journal of neuroinflammation. 2010;7:45. doi: 10.1186/1742-2094-7-45. [DOI] [PMC free article] [PubMed] [Google Scholar]
- Ferrari CC, Tarelli R. Parkinson's disease and systemic inflammation. Parkinsons Dis. 2011;2011:436813. doi: 10.4061/2011/436813. [DOI] [PMC free article] [PubMed] [Google Scholar]
- Gao F, Chen D, Hu Q, Wang G. Rotenone directly induces BV2 cell activation via the p38 MAPK pathway. PLoS One. 2013;8:e72046. doi: 10.1371/journal.pone.0072046. [DOI] [PMC free article] [PubMed] [Google Scholar]
- Gao HM, Hong JS, Zhang W, Liu B. Distinct role for microglia in rotenone-induced degeneration of dopaminergic neurons. J Neurosci. 2002a;22:782–790. doi: 10.1523/JNEUROSCI.22-03-00782.2002. [DOI] [PMC free article] [PubMed] [Google Scholar]
- Gao HM, Hong JS, Zhang W, Liu B. Synergistic dopaminergic neurotoxicity of the pesticide rotenone and inflammogen lipopolysaccharide: relevance to the etiology of Parkinson's disease. J Neurosci. 2003;23:1228–1236. doi: 10.1523/JNEUROSCI.23-04-01228.2003. [DOI] [PMC free article] [PubMed] [Google Scholar]
- Gao HM, Jiang J, Wilson B, Zhang W, Hong JS, Liu B. Microglial activation-mediated delayed and progressive degeneration of rat nigral dopaminergic neurons: relevance to Parkinson's disease. Journal of neurochemistry. 2002b;81:1285–1297. doi: 10.1046/j.1471-4159.2002.00928.x. [DOI] [PubMed] [Google Scholar]
- Gao HM, Zhang F, Zhou H, Kam W, Wilson B, Hong JS. Neuroinflammation and alpha-synuclein dysfunction potentiate each other, driving chronic progression of neurodegeneration in a mouse model of Parkinson's disease. Environmental health perspectives. 2011;119:807–814. doi: 10.1289/ehp.1003013. [DOI] [PMC free article] [PubMed] [Google Scholar]
- Ghosh A, Chandran K, Kalivendi SV, Joseph J, Antholine WE, Hillard CJ, Kanthasamy A, Kalyanaraman B. Neuroprotection by a mitochondria-targeted drug in a Parkinson's disease model. Free Radic Biol Med. 2010;49:1674–1684. doi: 10.1016/j.freeradbiomed.2010.08.028. [DOI] [PMC free article] [PubMed] [Google Scholar]
- Ghosh A, Roy A, Liu X, Kordower JH, Mufson EJ, Hartley DM, Ghosh S, Mosley RL, Gendelman HE, Pahan K. Selective inhibition of NF-kappaB activation prevents dopaminergic neuronal loss in a mouse model of Parkinson's disease. Proceedings of the National Academy of Sciences of the United States of America. 2007;104:18754–18759. doi: 10.1073/pnas.0704908104. [DOI] [PMC free article] [PubMed] [Google Scholar]
- Ghosh A, Saminathan H, Kanthasamy A, Anantharam V, Jin H, Sondarva G, Harischandra DS, Qian Z, Rana A, Kanthasamy AG. The peptidyl-prolyl isomerase Pin1 up-regulation and proapoptotic function in dopaminergic neurons: relevance to the pathogenesis of Parkinson disease. J Biol Chem. 2013;288:21955–21971. doi: 10.1074/jbc.M112.444224. [DOI] [PMC free article] [PubMed] [Google Scholar]
- Gonfloni S, Maiani E, Di Bartolomeo C, Diederich M, Cesareni G. Oxidative Stress, DNA Damage, and c-Abl Signaling: At the Crossroad in Neurodegenerative Diseases? International journal of cell biology. 2012;2012:683097. doi: 10.1155/2012/683097. [DOI] [PMC free article] [PubMed] [Google Scholar]
- Gordon R, Hogan CE, Neal ML, Anantharam V, Kanthasamy AG, Kanthasamy A. A simple magnetic separation method for high-yield isolation of pure primary microglia. J Neurosci Methods. 2011;194:287–296. doi: 10.1016/j.jneumeth.2010.11.001. [DOI] [PMC free article] [PubMed] [Google Scholar]
- Gordon R, Singh N, Lawana V, Ghosh A, Harischandra DS, Jin H, Hogan C, Sarkar S, Rokad D, Panicker N, Anantharam V, Kanthasamy AG, Kanthasamy A. Protein kinase Cdelta upregulation in microglia drives neuroinflammatory responses and dopaminergic neurodegeneration in experimental models of Parkinson's disease. Neurobiol Dis. 2016;93:96–114. doi: 10.1016/j.nbd.2016.04.008. [DOI] [PMC free article] [PubMed] [Google Scholar]
- Gustin A, Kirchmeyer M, Koncina E, Felten P, Losciuto S, Heurtaux T, Tardivel A, Heuschling P, Dostert C. NLRP3 Inflammasome Is Expressed and Functional in Mouse Brain Microglia but Not in Astrocytes. PloS one. 2015;10:e0130624. doi: 10.1371/journal.pone.0130624. [DOI] [PMC free article] [PubMed] [Google Scholar]
- Hebron ML, Lonskaya I, Moussa CE. Nilotinib reverses loss of dopamine neurons and improves motor behavior via autophagic degradation of alpha-synuclein in Parkinson's disease models. Human molecular genetics. 2013a;22:3315–3328. doi: 10.1093/hmg/ddt192. [DOI] [PMC free article] [PubMed] [Google Scholar]
- Hebron ML, Lonskaya I, Moussa CE. Tyrosine kinase inhibition facilitates autophagic SNCA/alpha-synuclein clearance. Autophagy. 2013b;9:1249–1250. doi: 10.4161/auto.25368. [DOI] [PMC free article] [PubMed] [Google Scholar]
- Heid ME, Keyel PA, Kamga C, Shiva S, Watkins SC, Salter RD. Mitochondrial reactive oxygen species induces NLRP3-dependent lysosomal damage and inflammasome activation. J Immunol. 2013;191:5230–5238. doi: 10.4049/jimmunol.1301490. [DOI] [PMC free article] [PubMed] [Google Scholar]
- Hu W, Lu S, McAlpine I, Jamieson JD, Lee DU, Marroquin LD, Heyen JR, Jessen BA. Mechanistic investigation of imatinib-induced cardiac toxicity and the involvement of c-Abl kinase. Toxicol Sci. 2012;129:188–199. doi: 10.1093/toxsci/kfs192. [DOI] [PubMed] [Google Scholar]
- Imam SZ, Zhou Q, Yamamoto A, Valente AJ, Ali SF, Bains M, Roberts JL, Kahle PJ, Clark RA, Li S. Novel regulation of parkin function through c-Abl-mediated tyrosine phosphorylation: implications for Parkinson's disease. J Neurosci. 2011;31:157–163. doi: 10.1523/JNEUROSCI.1833-10.2011. [DOI] [PMC free article] [PubMed] [Google Scholar]
- Indo HP, Davidson M, Yen HC, Suenaga S, Tomita K, Nishii T, Higuchi M, Koga Y, Ozawa T, Majima HJ. Evidence of ROS generation by mitochondria in cells with impaired electron transport chain and mitochondrial DNA damage. Mitochondrion. 2007;7:106–118. doi: 10.1016/j.mito.2006.11.026. [DOI] [PubMed] [Google Scholar]
- Ippagunta SK, Brand DD, Luo J, Boyd KL, Calabrese C, Stienstra R, Van de Veerdonk FL, Netea MG, Joosten LA, Lamkanfi M, Kanneganti TD. Inflammasome-independent role of apoptosis-associated speck-like protein containing a CARD (ASC) in T cell priming is critical for collagen-induced arthritis. The Journal of biological chemistry. 2010;285:12454–12462. doi: 10.1074/jbc.M109.093252. [DOI] [PMC free article] [PubMed] [Google Scholar]
- Iyer SS, He Q, Janczy JR, Elliott EI, Zhong Z, Olivier AK, Sadler JJ, Knepper-Adrian V, Han R, Qiao L, Eisenbarth SC, Nauseef WM, Cassel SL, Sutterwala FS. Mitochondrial cardiolipin is required for Nlrp3 inflammasome activation. Immunity. 2013;39:311–323. doi: 10.1016/j.immuni.2013.08.001. [DOI] [PMC free article] [PubMed] [Google Scholar]
- Jang H, Boltz D, Sturm-Ramirez K, Shepherd KR, Jiao Y, Webster R, Smeyne RJ. Highly pathogenic H5N1 influenza virus can enter the central nervous system and induce neuroinflammation and neurodegeneration. Proc Natl Acad Sci U S A. 2009;106:14063–14068. doi: 10.1073/pnas.0900096106. [DOI] [PMC free article] [PubMed] [Google Scholar]
- Jang Y, Lee AY, Jeong SH, Park KH, Paik MK, Cho NJ, Kim JE, Cho MH. Chlorpyrifos induces NLRP3 inflammasome and pyroptosis/apoptosis via mitochondrial oxidative stress in human keratinocyte HaCaT cells. Toxicology. 2015;338:37–46. doi: 10.1016/j.tox.2015.09.006. [DOI] [PubMed] [Google Scholar]
- Javed H, Azimullah S, Haque ME, Ojha SK. Cannabinoid Type 2 (CB2) Receptors Activation Protects against Oxidative Stress and Neuroinflammation Associated Dopaminergic Neurodegeneration in Rotenone Model of Parkinson's Disease. Front Neurosci. 2016;10:321. doi: 10.3389/fnins.2016.00321. [DOI] [PMC free article] [PubMed] [Google Scholar]
- Jha S, Srivastava SY, Brickey WJ, Iocca H, Toews A, Morrison JP, Chen VS, Gris D, Matsushima GK, Ting JP. The inflammasome sensor, NLRP3, regulates CNS inflammation and demyelination via caspase-1 and interleukin-18. J Neurosci. 2010;30:15811–15820. doi: 10.1523/JNEUROSCI.4088-10.2010. [DOI] [PMC free article] [PubMed] [Google Scholar]
- Jin H, Kanthasamy A, Harischandra DS, Kondru N, Ghosh A, Panicker N, Anantharam V, Rana A, Kanthasamy AG. Histone hyperacetylation up-regulates protein kinase Cdelta in dopaminergic neurons to induce cell death: relevance to epigenetic mechanisms of neurodegeneration in Parkinson disease. J Biol Chem. 2014;289:34743–34767. doi: 10.1074/jbc.M114.576702. [DOI] [PMC free article] [PubMed] [Google Scholar]
- Jing Z, Caltagarone J, Bowser R. Altered subcellular distribution of c-Abl in Alzheimer's disease. J Alzheimers Dis. 2009;17:409–422. doi: 10.3233/JAD-2009-1062. [DOI] [PMC free article] [PubMed] [Google Scholar]
- Juliana C, Fernandes-Alnemri T, Wu J, Datta P, Solorzano L, Yu JW, Meng R, Quong AA, Latz E, Scott CP, Alnemri ES. Anti-inflammatory compounds parthenolide and Bay 11-7082 are direct inhibitors of the inflammasome. J Biol Chem. 2010;285:9792–9802. doi: 10.1074/jbc.M109.082305. [DOI] [PMC free article] [PubMed] [Google Scholar]
- Kanthasamy A, Anantharam V, Ali SF, Kanthasamy AG. Methamphetamine induces autophagy and apoptosis in a mesencephalic dopaminergic neuronal culture model: role of cathepsin-D in methamphetamine-induced apoptotic cell death. Annals of the New York Academy of Sciences. 2006;1074:234–244. doi: 10.1196/annals.1369.022. [DOI] [PubMed] [Google Scholar]
- Karin M. How NF-kappaB is activated: the role of the IkappaB kinase (IKK) complex. Oncogene. 1999;18:6867–6874. doi: 10.1038/sj.onc.1203219. [DOI] [PubMed] [Google Scholar]
- Karuppagounder SS, Brahmachari S, Lee Y, Dawson VL, Dawson TM, Ko HS. The c-Abl inhibitor, nilotinib, protects dopaminergic neurons in a preclinical animal model of Parkinson's disease. Scientific reports. 2014;4:4874. doi: 10.1038/srep04874. [DOI] [PMC free article] [PubMed] [Google Scholar]
- Katsumata R, Ishigaki S, Katsuno M, Kawai K, Sone J, Huang Z, Adachi H, Tanaka F, Urano F, Sobue G. c-Abl inhibition delays motor neuron degeneration in the G93A mouse, an animal model of amyotrophic lateral sclerosis. PloS one. 2012;7:e46185. doi: 10.1371/journal.pone.0046185. [DOI] [PMC free article] [PubMed] [Google Scholar]
- Kauppinen A, Niskanen H, Suuronen T, Kinnunen K, Salminen A, Kaarniranta K. Oxidative stress activates NLRP3 inflammasomes in ARPE-19 cells--implications for age-related macular degeneration (AMD) Immunol Lett. 2012;147:29–33. doi: 10.1016/j.imlet.2012.05.005. [DOI] [PubMed] [Google Scholar]
- Keeney PM, Xie J, Capaldi RA, Bennett JP., Jr Parkinson's disease brain mitochondrial complex I has oxidatively damaged subunits and is functionally impaired and misassembled. J Neurosci. 2006;26:5256–5264. doi: 10.1523/JNEUROSCI.0984-06.2006. [DOI] [PMC free article] [PubMed] [Google Scholar]
- Kesidou E, Lagoudaki R, Touloumi O, Poulatsidou KN, Simeonidou C. Autophagy and neurodegenerative disorders. Neural Regen Res. 2013;8:2275–2283. doi: 10.3969/j.issn.1673-5374.2013.24.007. [DOI] [PMC free article] [PubMed] [Google Scholar]
- Khare S, Dorfleutner A, Bryan NB, Yun C, Radian AD, de Almeida L, Rojanasakul Y, Stehlik C. An NLRP7-containing inflammasome mediates recognition of microbial lipopeptides in human macrophages. Immunity. 2012;36:464–476. doi: 10.1016/j.immuni.2012.02.001. [DOI] [PMC free article] [PubMed] [Google Scholar]
- Kim MJ, Yoon JH, Ryu JH. Mitophagy: a balance regulator of NLRP3 inflammasome activation. BMB reports. 2016;49:529–535. doi: 10.5483/BMBRep.2016.49.10.115. [DOI] [PMC free article] [PubMed] [Google Scholar]
- Kim YS, Joh TH. Microglia, major player in the brain inflammation: their roles in the pathogenesis of Parkinson's disease. Experimental & molecular medicine. 2006;38:333–347. doi: 10.1038/emm.2006.40. [DOI] [PubMed] [Google Scholar]
- Ko HS, Lee Y, Shin JH, Karuppagounder SS, Gadad BS, Koleske AJ, Pletnikova O, Troncoso JC, Dawson VL, Dawson TM. Phosphorylation by the c-Abl protein tyrosine kinase inhibits parkin's ubiquitination and protective function. Proceedings of the National Academy of Sciences of the United States of America. 2010;107:16691–16696. doi: 10.1073/pnas.1006083107. [DOI] [PMC free article] [PubMed] [Google Scholar]
- Komatsu M, Ichimura Y. Physiological significance of selective degradation of p62 by autophagy. FEBS Lett. 2010;584:1374–1378. doi: 10.1016/j.febslet.2010.02.017. [DOI] [PubMed] [Google Scholar]
- Kowaltowski AJ, Castilho RF, Vercesi AE. Mitochondrial permeability transition and oxidative stress. FEBS Lett. 2001;495:12–15. doi: 10.1016/s0014-5793(01)02316-x. [DOI] [PubMed] [Google Scholar]
- Latz E. The inflammasomes: mechanisms of activation and function. Current opinion in immunology. 2010;22:28–33. doi: 10.1016/j.coi.2009.12.004. [DOI] [PMC free article] [PubMed] [Google Scholar]
- Lema Tome CM, Tyson T, Rey NL, Grathwohl S, Britschgi M, Brundin P. Inflammation and alpha-synuclein's prion-like behavior in Parkinson's disease--is there a link? Mol Neurobiol. 2013;47:561–574. doi: 10.1007/s12035-012-8267-8. [DOI] [PMC free article] [PubMed] [Google Scholar]
- Li N, Ragheb K, Lawler G, Sturgis J, Rajwa B, Melendez JA, Robinson JP. Mitochondrial complex I inhibitor rotenone induces apoptosis through enhancing mitochondrial reactive oxygen species production. The Journal of biological chemistry. 2003;278:8516–8525. doi: 10.1074/jbc.M210432200. [DOI] [PubMed] [Google Scholar]
- Lima H, Jr, Jacobson LS, Goldberg MF, Chandran K, Diaz-Griffero F, Lisanti MP, Brojatsch J. Role of lysosome rupture in controlling Nlrp3 signaling and necrotic cell death. Cell cycle. 2013;12:1868–1878. doi: 10.4161/cc.24903. [DOI] [PMC free article] [PubMed] [Google Scholar]
- Lin M, Chandramani-Shivalingappa P, Jin H, Ghosh A, Anantharam V, Ali S, Kanthasamy AG, Kanthasamy A. Methamphetamine-induced neurotoxicity linked to ubiquitin-proteasome system dysfunction and autophagy-related changes that can be modulated by protein kinase C delta in dopaminergic neuronal cells. Neuroscience. 2012;210:308–332. doi: 10.1016/j.neuroscience.2012.03.004. [DOI] [PMC free article] [PubMed] [Google Scholar]
- Lombardo LJ, et al. Discovery of N-(2-chloro-6-methyl- phenyl)-2-(6-(4-(2-hydroxyethyl)- piperazin-1-yl)-2-methylpyrimidin-4- ylamino)thiazole-5-carboxamide (BMS-354825), a dual Src/Abl kinase inhibitor with potent antitumor activity in preclinical assays. J Med Chem. 2004;47:6658–6661. doi: 10.1021/jm049486a. [DOI] [PubMed] [Google Scholar]
- Lu W, Lee HK, Xiang C, Finniss S, Brodie C. The phosphorylation of tyrosine 332 is necessary for the caspase 3-dependent cleavage of PKCdelta and the regulation of cell apoptosis. Cellular signalling. 2007;19:2165–2173. doi: 10.1016/j.cellsig.2007.06.015. [DOI] [PubMed] [Google Scholar]
- Mader BJ, Pivtoraiko VN, Flippo HM, Klocke BJ, Roth KA, Mangieri LR, Shacka JJ. Rotenone inhibits autophagic flux prior to inducing cell death. ACS chemical neuroscience. 2012;3:1063–1072. doi: 10.1021/cn300145z. [DOI] [PMC free article] [PubMed] [Google Scholar]
- Mahul-Mellier AL, Fauvet B, Gysbers A, Dikiy I, Oueslati A, Georgeon S, Lamontanara AJ, Bisquertt A, Eliezer D, Masliah E, Halliday G, Hantschel O, Lashuel HA. c-Abl phosphorylates alpha-synuclein and regulates its degradation: implication for alpha-synuclein clearance and contribution to the pathogenesis of Parkinson's disease. Human molecular genetics. 2014;23:2858–2879. doi: 10.1093/hmg/ddt674. [DOI] [PMC free article] [PubMed] [Google Scholar]
- Martinon F, Mayor A, Tschopp J. The inflammasomes: guardians of the body. Annual review of immunology. 2009;27:229–265. doi: 10.1146/annurev.immunol.021908.132715. [DOI] [PubMed] [Google Scholar]
- McGeer PL, Itagaki S, Boyes BE, McGeer EG. Reactive microglia are positive for HLA-DR in the substantia nigra of Parkinson's and Alzheimer's disease brains. Neurology. 1988;38:1285–1291. doi: 10.1212/wnl.38.8.1285. [DOI] [PubMed] [Google Scholar]
- McKnight NC, Zhenyu Y. Beclin 1, an Essential Component and Master Regulator of PI3K-III in Health and Disease. Curr Pathobiol Rep. 2013;1:231–238. doi: 10.1007/s40139-013-0028-5. [DOI] [PMC free article] [PubMed] [Google Scholar]
- Mitroulis I, Skendros P, Ritis K. Targeting IL-1beta in disease; the expanding role of NLRP3 inflammasome. European journal of internal medicine. 2010;21:157–163. doi: 10.1016/j.ejim.2010.03.005. [DOI] [PubMed] [Google Scholar]
- Mizushima N. Autophagy: process and function. Genes Dev. 2007a;21:2861–2873. doi: 10.1101/gad.1599207. [DOI] [PubMed] [Google Scholar]
- Mizushima N. The role of mammalian autophagy in protein metabolism. Proc Jpn Acad Ser B Phys Biol Sci. 2007b;83:39–46. doi: 10.2183/pjab.83.39. [DOI] [PMC free article] [PubMed] [Google Scholar]
- Moresco EM, Koleske AJ. Regulation of neuronal morphogenesis and synaptic function by Abl family kinases. Curr Opin Neurobiol. 2003;13:535–544. doi: 10.1016/j.conb.2003.08.002. [DOI] [PubMed] [Google Scholar]
- Moresco EM, Scheetz AJ, Bornmann WG, Koleske AJ, Fitzsimonds RM. Abl family nonreceptor tyrosine kinases modulate short-term synaptic plasticity. J Neurophysiol. 2003;89:1678–1687. doi: 10.1152/jn.00892.2002. [DOI] [PubMed] [Google Scholar]
- Moriyama Y, Takano T, Ohkuma S. Acridine orange as a fluorescent probe for lysosomal proton pump. J Biochem. 1982;92:1333–1336. doi: 10.1093/oxfordjournals.jbchem.a134053. [DOI] [PubMed] [Google Scholar]
- Mosley RL, Benner EJ, Kadiu I, Thomas M, Boska MD, Hasan K, Laurie C, Gendelman HE. Neuroinflammation, Oxidative Stress and the Pathogenesis of Parkinson's Disease. Clin Neurosci Res. 2006;6:261–281. doi: 10.1016/j.cnr.2006.09.006. [DOI] [PMC free article] [PubMed] [Google Scholar]
- Nakahira K, Haspel JA, Rathinam VA, Lee SJ, Dolinay T, Lam HC, Englert JA, Rabinovitch M, Cernadas M, Kim HP, Fitzgerald KA, Ryter SW, Choi AM. Autophagy proteins regulate innate immune responses by inhibiting the release of mitochondrial DNA mediated by the NALP3 inflammasome. Nature immunology. 2011;12:222–230. doi: 10.1038/ni.1980. [DOI] [PMC free article] [PubMed] [Google Scholar]
- Ozaki E, Campbell M, Doyle SL. Targeting the NLRP3 inflammasome in chronic inflammatory diseases: current perspectives. J Inflamm Res. 2015;8:15–27. doi: 10.2147/JIR.S51250. [DOI] [PMC free article] [PubMed] [Google Scholar]
- Panicker N, Saminathan H, Jin H, Neal M, Harischandra DS, Gordon R, Kanthasamy K, Lawana V, Sarkar S, Luo J, Anantharam V, Kanthasamy AG, Kanthasamy A. Fyn Kinase Regulates Microglial Neuroinflammatory Responses in Cell Culture and Animal Models of Parkinson's Disease. J Neurosci. 2015;35:10058–10077. doi: 10.1523/JNEUROSCI.0302-15.2015. [DOI] [PMC free article] [PubMed] [Google Scholar]
- Plaza Davila M, Martin Munoz P, Tapia JA, Ortega Ferrusola C, Balao da Silva CC, Pena FJ. Inhibition of Mitochondrial Complex I Leads to Decreased Motility and Membrane Integrity Related to Increased Hydrogen Peroxide and Reduced ATP Production, while the Inhibition of Glycolysis Has Less Impact on Sperm Motility. PloS one. 2015;10:e0138777. doi: 10.1371/journal.pone.0138777. [DOI] [PMC free article] [PubMed] [Google Scholar]
- Porkka K, et al. Dasatinib crosses the blood-brain barrier and is an efficient therapy for central nervous system Philadelphia chromosome-positive leukemia. Blood. 2008;112:1005–1012. doi: 10.1182/blood-2008-02-140665. [DOI] [PubMed] [Google Scholar]
- Qin L, Wu X, Block ML, Liu Y, Breese GR, Hong JS, Knapp DJ, Crews FT. Systemic LPS causes chronic neuroinflammation and progressive neurodegeneration. Glia. 2007;55:453–462. doi: 10.1002/glia.20467. [DOI] [PMC free article] [PubMed] [Google Scholar]
- Rubartelli A. DAMP-Mediated Activation of NLRP3-Inflammasome in Brain Sterile Inflammation: The Fine Line between Healing and Neurodegeneration. Frontiers in immunology. 2014;5:99. doi: 10.3389/fimmu.2014.00099. [DOI] [PMC free article] [PubMed] [Google Scholar]
- Saitoh T, Fujita N, Jang MH, Uematsu S, Yang BG, Satoh T, Omori H, Noda T, Yamamoto N, Komatsu M, Tanaka K, Kawai T, Tsujimura T, Takeuchi O, Yoshimori T, Akira S. Loss of the autophagy protein Atg16L1 enhances endotoxin-induced IL-1beta production. Nature. 2008;456:264–268. doi: 10.1038/nature07383. [DOI] [PubMed] [Google Scholar]
- Sakurai H, Suzuki S, Kawasaki N, Nakano H, Okazaki T, Chino A, Doi T, Saiki I. Tumor necrosis factor-alpha-induced IKK phosphorylation of NF-kappaB p65 on serine 536 is mediated through the TRAF2, TRAF5, and TAK1 signaling pathway. J Biol Chem. 2003;278:36916–36923. doi: 10.1074/jbc.M301598200. [DOI] [PubMed] [Google Scholar]
- Salminen A, Ojala J, Kaarniranta K, Kauppinen A. Mitochondrial dysfunction and oxidative stress activate inflammasomes: impact on the aging process and age-related diseases. Cell Mol Life Sci. 2012;69:2999–3013. doi: 10.1007/s00018-012-0962-0. [DOI] [PMC free article] [PubMed] [Google Scholar]
- Schlatterer SD, Acker CM, Davies P. c-Abl in neurodegenerative disease. Journal of molecular neuroscience : MN. 2011a;45:445–452. doi: 10.1007/s12031-011-9588-1. [DOI] [PMC free article] [PubMed] [Google Scholar]
- Schlatterer SD, Tremblay MA, Acker CM, Davies P. Neuronal c-Abl overexpression leads to neuronal loss and neuroinflammation in the mouse forebrain. Journal of Alzheimer's disease : JAD. 2011b;25:119–133. doi: 10.3233/JAD-2011-102025. [DOI] [PMC free article] [PubMed] [Google Scholar]
- Seo J, Ottesen EW, Singh RN. Antisense methods to modulate pre-mRNA splicing. Methods Mol Biol. 2014;1126:271–283. doi: 10.1007/978-1-62703-980-2_20. [DOI] [PubMed] [Google Scholar]
- Shi CS, Shenderov K, Huang NN, Kabat J, Abu-Asab M, Fitzgerald KA, Sher A, Kehrl JH. Activation of autophagy by inflammatory signals limits IL-1beta production by targeting ubiquitinated inflammasomes for destruction. Nat Immunol. 2012;13:255–263. doi: 10.1038/ni.2215. [DOI] [PMC free article] [PubMed] [Google Scholar]
- Shoji H, Watanabe M, Itoh S, Kuwahara H, Hattori F. Japanese encephalitis and parkinsonism. J Neurol. 1993;240:59–60. doi: 10.1007/BF00838449. [DOI] [PubMed] [Google Scholar]
- Siddiqui A, Bhaumik D, Chinta SJ, Rane A, Rajagopalan S, Lieu CA, Lithgow GJ, Andersen JK. Mitochondrial Quality Control via the PGC1alpha-TFEB Signaling Pathway Is Compromised by Parkin Q311X Mutation But Independently Restored by Rapamycin. J Neurosci. 2015;35:12833–12844. doi: 10.1523/JNEUROSCI.0109-15.2015. [DOI] [PMC free article] [PubMed] [Google Scholar]
- Sorbara MT, Girardin SE. Mitochondrial ROS fuel the inflammasome. Cell Res. 2011;21:558–560. doi: 10.1038/cr.2011.20. [DOI] [PMC free article] [PubMed] [Google Scholar]
- Stehlik C, Lee SH, Dorfleutner A, Stassinopoulos A, Sagara J, Reed JC. Apoptosis-associated speck-like protein containing a caspase recruitment domain is a regulator of procaspase-1 activation. Journal of immunology. 2003;171:6154–6163. doi: 10.4049/jimmunol.171.11.6154. [DOI] [PubMed] [Google Scholar]
- Stuart JR, Kawai H, Tsai KK, Chuang EY, Yuan ZM. c-Abl regulates early growth response protein (EGR1) in response to oxidative stress. Oncogene. 2005;24:8085–8092. doi: 10.1038/sj.onc.1208953. [DOI] [PubMed] [Google Scholar]
- Subramanian N, Natarajan K, Clatworthy MR, Wang Z, Germain RN. The adaptor MAVS promotes NLRP3 mitochondrial localization and inflammasome activation. Cell. 2013;153:348–361. doi: 10.1016/j.cell.2013.02.054. [DOI] [PMC free article] [PubMed] [Google Scholar]
- Sun X, Wu F, Datta R, Kharbanda S, Kufe D. Interaction between protein kinase C delta and the c-Abl tyrosine kinase in the cellular response to oxidative stress. J Biol Chem. 2000;275:7470–7473. doi: 10.1074/jbc.275.11.7470. [DOI] [PubMed] [Google Scholar]
- Sutterwala FS, Haasken S, Cassel SL. Mechanism of NLRP3 inflammasome activation. Ann N Y Acad Sci. 2014;1319:82–95. doi: 10.1111/nyas.12458. [DOI] [PMC free article] [PubMed] [Google Scholar]
- Tait SW, Green DR. Mitochondria and cell death: outer membrane permeabilization and beyond. Nat Rev Mol Cell Biol. 2010;11:621–632. doi: 10.1038/nrm2952. [DOI] [PubMed] [Google Scholar]
- Tak PP, Firestein GS. NF-kappaB: a key role in inflammatory diseases. The Journal of clinical investigation. 2001;107:7–11. doi: 10.1172/JCI11830. [DOI] [PMC free article] [PubMed] [Google Scholar]
- Tanida I, Ueno T, Kominami E. LC3 and Autophagy. Methods Mol Biol. 2008;445:77–88. doi: 10.1007/978-1-59745-157-4_4. [DOI] [PubMed] [Google Scholar]
- Tansey MG, Goldberg MS. Neuroinflammation in Parkinson's disease: its role in neuronal death and implications for therapeutic intervention. Neurobiology of disease. 2010;37:510–518. doi: 10.1016/j.nbd.2009.11.004. [DOI] [PMC free article] [PubMed] [Google Scholar]
- Tansey MG, McCoy MK, Frank-Cannon TC. Neuroinflammatory mechanisms in Parkinson's disease: potential environmental triggers, pathways, and targets for early therapeutic intervention. Exp Neurol. 2007;208:1–25. doi: 10.1016/j.expneurol.2007.07.004. [DOI] [PMC free article] [PubMed] [Google Scholar]
- Tomas-Camardiel M, Venero JL, Herrera AJ, De Pablos RM, Pintor-Toro JA, Machado A, Cano J. Blood-brain barrier disruption highly induces aquaporin-4 mRNA and protein in perivascular and parenchymal astrocytes: protective effect by estradiol treatment in ovariectomized animals. J Neurosci Res. 2005;80:235–246. doi: 10.1002/jnr.20443. [DOI] [PubMed] [Google Scholar]
- Tremblay MA, Acker CM, Davies P. Tau phosphorylated at tyrosine 394 is found in Alzheimer's disease tangles and can be a product of the Abl-related kinase, Arg. J Alzheimers Dis. 2010;19:721–733. doi: 10.3233/JAD-2010-1271. [DOI] [PMC free article] [PubMed] [Google Scholar]
- Tremblay ME, Stevens B, Sierra A, Wake H, Bessis A, Nimmerjahn A. The role of microglia in the healthy brain. J Neurosci. 2011;31:16064–16069. doi: 10.1523/JNEUROSCI.4158-11.2011. [DOI] [PMC free article] [PubMed] [Google Scholar]
- Tschopp J, Schroder K. NLRP3 inflammasome activation: The convergence of multiple signalling pathways on ROS production? Nat Rev Immunol. 2010;10:210–215. doi: 10.1038/nri2725. [DOI] [PubMed] [Google Scholar]
- Tsunemi T, Ashe TD, Morrison BE, Soriano KR, Au J, Roque RA, Lazarowski ER, Damian VA, Masliah E, La Spada AR. PGC-1alpha rescues Huntington's disease proteotoxicity by preventing oxidative stress and promoting TFEB function. Sci Transl Med. 2012;4:142ra197. doi: 10.1126/scitranslmed.3003799. [DOI] [PMC free article] [PubMed] [Google Scholar]
- van de Veerdonk FL, Netea MG, Dinarello CA, Joosten LA. Inflammasome activation and IL-1beta and IL-18 processing during infection. Trends in immunology. 2011;32:110–116. doi: 10.1016/j.it.2011.01.003. [DOI] [PubMed] [Google Scholar]
- Vermeulen L, De Wilde G, Van Damme P, Vanden Berghe W, Haegeman G. Transcriptional activation of the NF-kappaB p65 subunit by mitogen- and stress-activated protein kinase-1 (MSK1) EMBO J. 2003;22:1313–1324. doi: 10.1093/emboj/cdg139. [DOI] [PMC free article] [PubMed] [Google Scholar]
- Wen H, Gris D, Lei Y, Jha S, Zhang L, Huang MT, Brickey WJ, Ting JP. Fatty acid-induced NLRP3-ASC inflammasome activation interferes with insulin signaling. Nat Immunol. 2011a;12:408–415. doi: 10.1038/ni.2022. [DOI] [PMC free article] [PubMed] [Google Scholar]
- Wen J, Ribeiro R, Zhang Y. Specific PKC isoforms regulate LPS-stimulated iNOS induction in murine microglial cells. Journal of neuroinflammation. 2011b;8:38. doi: 10.1186/1742-2094-8-38. [DOI] [PMC free article] [PubMed] [Google Scholar]
- Won JH, Park S, Hong S, Son S, Yu JW. Rotenone-induced Impairment of Mitochondrial Electron Transport Chain Confers a Selective Priming Signal for NLRP3 Inflammasome Activation. J Biol Chem. 2015;290:27425–27437. doi: 10.1074/jbc.M115.667063. [DOI] [PMC free article] [PubMed] [Google Scholar]
- Wu F, Xu HD, Guan JJ, Hou YS, Gu JH, Zhen XC, Qin ZH. Rotenone impairs autophagic flux and lysosomal functions in Parkinson's disease. Neuroscience. 2015;284:900–911. doi: 10.1016/j.neuroscience.2014.11.004. [DOI] [PubMed] [Google Scholar]
- Wu XF, Ouyang ZJ, Feng LL, Chen G, Guo WJ, Shen Y, Wu XD, Sun Y, Xu Q. Suppression of NF-kappaB signaling and NLRP3 inflammasome activation in macrophages is responsible for the amelioration of experimental murine colitis by the natural compound fraxinellone. Toxicology and applied pharmacology. 2014;281:146–156. doi: 10.1016/j.taap.2014.10.002. [DOI] [PubMed] [Google Scholar]
- Yang Z, Klionsky DJ. An overview of the molecular mechanism of autophagy. Curr Top Microbiol Immunol. 2009;335:1–32. doi: 10.1007/978-3-642-00302-8_1. [DOI] [PMC free article] [PubMed] [Google Scholar]
- Yuan YH, Sun JD, Wu MM, Hu JF, Peng SY, Chen NH. Rotenone could activate microglia through NFkappaB associated pathway. Neurochem Res. 2013;38:1553–1560. doi: 10.1007/s11064-013-1055-7. [DOI] [PubMed] [Google Scholar]
- Yuan ZM, Shioya H, Ishiko T, Sun X, Gu J, Huang YY, Lu H, Kharbanda S, Weichselbaum R, Kufe D. p73 is regulated by tyrosine kinase c-Abl in the apoptotic response to DNA damage. Nature. 1999;399:814–817. doi: 10.1038/21704. [DOI] [PubMed] [Google Scholar]
- Zhao W, Beers DR, Bell S, Wang J, Wen S, Baloh RH, Appel SH. TDP-43 activates microglia through NF-kappaB and NLRP3 inflammasome. Exp Neurol. 2015;273:24–35. doi: 10.1016/j.expneurol.2015.07.019. [DOI] [PubMed] [Google Scholar]
- Zhou R, Yazdi AS, Menu P, Tschopp J. A role for mitochondria in NLRP3 inflammasome activation. Nature. 2011;469:221–225. doi: 10.1038/nature09663. [DOI] [PubMed] [Google Scholar]
- Zhou R, Tardivel A, Thorens B, Choi I, Tschopp J. Thioredoxin-interacting protein links oxidative stress to inflammasome activation. Nat Immunol. 2010;11:136–140. doi: 10.1038/ni.1831. [DOI] [PubMed] [Google Scholar]
Associated Data
This section collects any data citations, data availability statements, or supplementary materials included in this article.
Supplementary Materials
Sup. Fig. 1: Dasatinib causes dose-dependent attenuation of LPS-mediated activation of BV2 microglial cells. (A, B) DAS inhibits LPS-mediated NF-κB activation. (A) BV2 microglial cells were pretreated with 100nM DAS for 1h followed by treatment with LPS (1μg/ml) for 30min. Using immunofluorescence imaging, intracellular localization of p65 (red), an NF-κB subunit, was observed. Hoechst (blue) was used to stain the nuclei. The images represent 2 different experiments perform independently. The third row shows that LPS caused nuclear translocation of p65. Whereas, DAS pretreatment reduced the LPS-induced p65 translocation (bottom row). (B) IκB protein expression was analyzed using immunoblotting technique. BV2 cells pretreated with DAS (10, 30 and 100nM, 1h) were treated with 1μg/ml LPS for 30min. The whole cell lysates were collected at the indicated time and immunoblotted with the IκB antibody. Immunoblot reveals that LPS-mediated degradation of IκB was significantly recovered by DAS pretreatment in a dose-dependent manner. β actin was used as a loading control. The experiments were performed in duplicate at least 2 independent repetitions. (C) BV2 cells were pretreated with DAS (10, 30 and 100nM) for 1h followed by LPS (1μg/ml) treatment for 24h. The cell free supernatant was analyzed for secreted nitric oxide (NO) levels using Griess colorimetric assay. LPS caused >9-fold increase in extracellular release of NO, which was significantly reduced by DAS in a dose-dependent manner. The data represents the mean ± S.E.M. performed in replicates of 6. ***p<0.001 and **** p<0.0001 compared with LPS alone group. (D, E) Luminex® analysis of released inflammatory cytokines. BV2 cells were treated as described in sup. fig. 1(C) and cell free supernatant was collected for analysis of cytokines levels using Luminex® multiplex assay. The bar graph represents the concentration of IL-6 (D) and TNFα (E) in pg/ml. LPS induced aberrant release of these proinflammatory cytokines, while DAS pretreatment attenuated this effect. The data is presented as mean ± S.E.M. (n=6). *p<0.05, **p<0.01 and ***p<0.001 compare significance between LPS and DAS-pretreated LPS groups, while # # # #p<0.0001 denotes significance versus control group.
Sup. Fig. 2: c-Abl inhibitor attenuates ROT-induced oligomerization of ASC in LPS-primed BV2 cells. BV2 cells were pretreated with DAS (100nM, 1h) followed by priming with LPS (1μg/ml, 3h) and treatment with ROT (0.5μM) for 6h. Upon completion of treatment the cell lysates were subjected to centrifugation at 400 × g for 15 min at 4°C. The pellets were washed with PBS and subsequently cross linked with DSS for 30 min. The cross linked pellets and cell lysates were subsequently immunoblotted for ASC. The upper panel represents the immunoblot of cross linked (+ DSS) lysates and bottom blot represents the whole cell lysate (- DSS). β actin was used as a loading control. The results indicate that LPS-primed ROT-treated cells have increased expression of ASC with increased level of ASC oligomer (activated form). However, cells pretreated with DAS showed significant reduction in ASC expression and oligomerization induced by LPS and ROT. The bar graph represents the normalized densitometry data, represented as % of control. The data is presented as mean ± S.E.M. of two independent experiments. ***p<0.001 versus control, while # # # #p<0.0001 denotes significant difference between LPS-primed ROT-treated group with and without DAS pretreatment.