Abstract
Sialylated glycans are found at elevated levels in many types of cancer and have been implicated in disease progression. However, the specific glycoproteins that contribute to the cancer cell-surface sialylation are not well characterized, specifically in bona fide human disease tissue. Metabolic and bioorthogonal labeling methods have previously enabled the enrichment and identification of sialoglycoproteins from cultured cells and model organisms. Herein, we report the first application of this glycoproteomic platform to human tissues cultured ex vivo. Both normal and cancerous prostate tissues were sliced and cultured in the presence of the azide-functionalized sialic acid biosynthetic precursor Ac4ManNAz. The compound was metabolized to the azidosialic acid and incorporated into cell surface and secreted sialoglycoproteins. Chemical biotinylation followed by enrichment and mass spectrometry led to the identification of glycoproteins that were found at elevated levels or uniquely in cancerous prostate tissue. This work therefore extends the use of bioorthogonal labeling strategies to problems of clinical relevance.
Keywords: bioorthogonal chemistry, glycosylation, metabolic incorporation, prostate cancer, proteomics
Metabolic labeling of glycans, proteins, lipids, nucleic acids, and other metabolites with bioorthogonal functional groups is now a widely used strategy for studying these biomolecules in living systems.[1,2] Once functionalized, the target biomolecules are armed for chemical reaction with probes that enable the capture and subsequent biochemical analysis or direct visualization. Early work focused on labeling biomolecules in cultured cells,[3] but for studies that address questions of biomedical relevance there is motivation to deploy this chemical platform in systems more closely related to human disease. Translation to model organisms has been an important step in this direction, as reflected in reports of bioorthogonal labeling in Caenorhabditis elegans,[4] Drosophila melanogaster,[5] zebrafish,[6] and mice.[7,8] However, the application of metabolic/chemical labeling methods in the most authentic model of human disease, that is, live human tissues, is appealing to conceptualize but difficult to realize in practice.
Accurate models of human biology are particularly important for research at the intersection of glycoscience and human health. There is a substantive body of literature that correlates changes in glycosylation with cancer progression;[9] several groups have sought to define these changes at a level of molecular detail that would enable new diagnostic or therapeutic interventions.[10] Sialylated glycans and glycoproteins have attracted special attention based on observations that they are upregulated in numerous cancers and, in circulation, have the potential to serve as biomarkers of disease.[11]
Motivated by these observations, we[12] and others[13,14] have applied metabolic and bioorthogonal labeling methods to profile glycoproteins from prostate cancer cell lines using mass spectrometry (MS)-based proteomics.[15] To target sialoglycoproteins specifically, cells are metabolically labeled with a modified peracetylated N-acetylmannosamine (Ac4ManNAc) analogue such as peracetylated N-azidoace-tylmannosamine (Ac4ManNAz, 1)[16] or its alkynyl counterpart, peracetylated N-pentynoylmannosamine (Ac4ManNAl). These compounds are converted by the Roseman–Warren pathway into the corresponding sialic acid derivatives, which are, in turn, incorporated into sialoglycoproteins.[17] The functionalized sialoglycoproteins are reacted with a complementary enrichment probe. One might choose among phosphine-, terminal alkyne- or cyclooctyne-functionalized probes to tag azido sialic acids, or an azide-functionalized probe to tag alkynyl sialic acids.[18,19] More recently, Chen et al. have transitioned such studies to a mouse tumor model.[20]
While metabolic labeling can be performed in model organisms, in humans it is hindered by the significant barriers associated with introducing chemically altered sugars into people. We were therefore intrigued by the prospect of using live human tumor tissue ex vivo in the form of tissue slice cultures (TSCs). TSCs can maintain their native in vivo cell–cell and cell–matrix interactions for many days while remaining viable and, importantly, metabolically active.[21,22]
Prostate TSCs retain physiological properties that are lost in cell cultures and also allow direct comparisons of cancerous and normal tissue from the same patient source.[23] Herein, we demonstrate that cultured human prostatic tissue slices can be metabolically labeled with Ac4ManNAz and subjected to glycoproteomic analysis. This analysis allowed the identification of glycoproteins that were elevated in or unique to prostate cancer. These data suggest that bioorthogonal labeling methods may be applied to human TSCs to reveal disease biomarkers in a more authentic experimental setting.
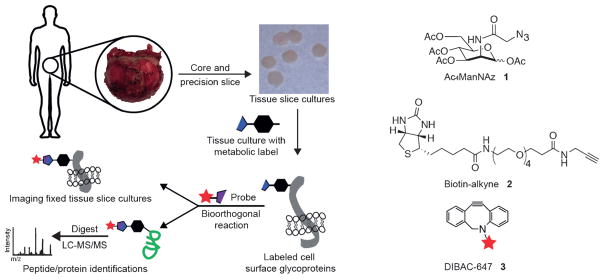
Prostate tissue slices were collected as previously reported and subjected to the workflow depicted in Figure 1. Importantly, structural and functional fidelity of the TSCs could be maintained for at least five days.[24] The TSCs were labeled by incubation with 50 μM Ac4ManNAz, Ac4ManNAl, or Ac4ManNAc, a control sugar lacking the chemical reporter functionality for subsequent analysis. For imaging, TSCs were fixed and reacted with a suitable conjugated fluorescent probe.[25] For proteomic identification, TSCs were homogenized in lysis buffer and covalently reacted with a biotin probe. Proteins were captured with avidin resin, digested on-bead with trypsin and analyzed by LC-MS/MS (Figure 1).
Figure 1.
Workflow for preparation and bioorthogonal labeling of human prostate tissue slice cultures (TSCs). Radical prostatectomy specimens were cored and precision sliced for ex vivo culture. TSCs were incubated with a metabolic reporter (for example, Ac4ManNAz, 1) for specific labeling of sialoglycoproteins. After incubation, slices were either fixed and reacted with a cyclooctyne-functionalized optical probe 3 for imaging or, alternatively, lysed, reacted with an alkyne affinity probe 2 for enrichment, and analyzed by mass spectrometry-based proteomics.
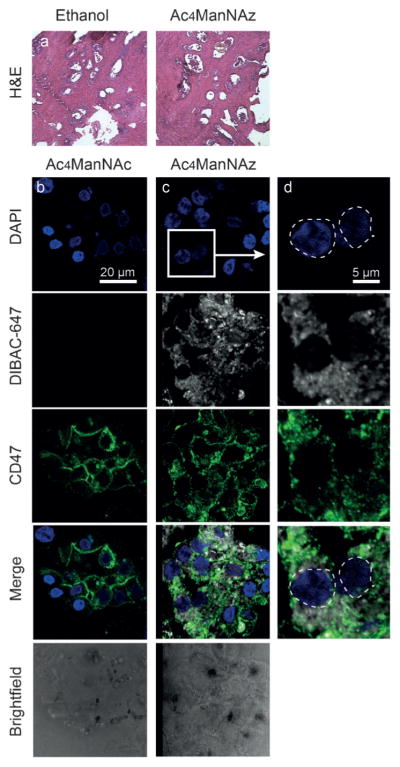
We first sought to confirm that Ac4ManNAz metabolism would not grossly perturb the integrity of prostatic TSCs. Histological analysis of TSC by hematoxylin and eosin (H&E) staining showed that Ac4ManNAz, Ac4ManNAc, and Ac4ManNAl treatments had no obvious effect on TSC morphology (Figure 2a and Supporting Information, Figure S1). To test that the labeling was specific to cell-surface glycoproteins, TSCs were fixed and reacted with the commercial fluorescent cyclooctyne reagent dibenzoazacyclooctyne (DIBAC) conjugated to AlexaFluor 647 (DIBAC-647, 3, Figure 1). Fluorescence microscopy of TSCs treated with either Ac4ManNAz or Ac4ManNAc followed by 25 μM DIBAC-647 showed robust and azide-specific cell-surface labeling (Figure 2b–d). We observed co-localization of DIBAC labeling with CD47, a cell-surface marker of prostate epithelial cells, indicating Ac4ManNAz labeling is cell-surface-specific.
Figure 2.
Labeling and imaging of cell-surface sialoglycoproteins in human prostate tissue slice cultures (TSCs). a) Prostate TSCs stained with hematoxylin and eosin (H&E). b–d) Representative fluorescence microscopy images of TSCs treated either with control sugar Ac4ManNAc (b, left) or with Ac4ManNAz (c, center). TSCs stained with DAPI in blue, treated with DIBAC-647 in white, CD47 epithelial cell surface marker in green and merge. Rightmost panel shows enlarged region with Ac4ManNAz labeling.
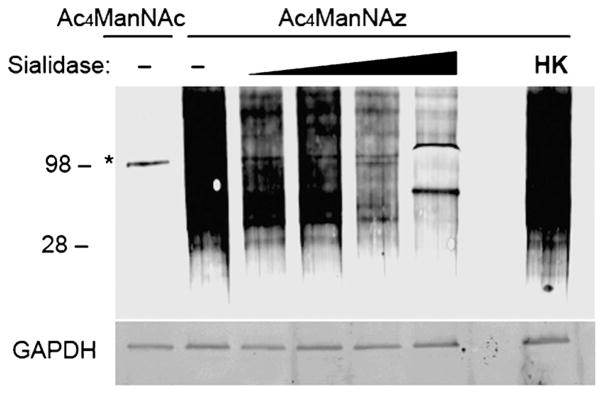
To confirm sialoglycoprotein-specificity, we digested TSC lysates with sialidase, reacted with DIBAC-biotin, and performed a western blot analysis. As shown in Figure 3, we observed a dose-dependent decrease in signal for sialidase-treated samples, confirming that the azide-specific signal was indeed due to azide incorporation into sialoglycoprotein residues.
Figure 3.
Efficient biotinylation of sialoglycoproteins using Ac4ManNAz. Western blot analysis of sialidase-treated or untreated (−) TSC lysates administered Ac4ManNAz or control sugar, Ac4ManNAc. The samples were incubated with active and increasing concentrations or heat-killed (HK) sialidase from V. cholera (asterisk denotes background labeling of highly abundant sialidase enzyme, MW =98 kDa). Total protein loading was confirmed by GAPDH.
Prior to the proteomic analysis of sialoglycoproteins, we confirmed that the Ac4ManNAz-labeled lysate reacted with the biotin-alkyne probe (2, Figure 1) under copper-catalyzed azide–alkyne [3+2] cycloaddition (CuAAC) conditions.[26] TSC lysates were robustly labeled with no observable background by western blot (Supporting Information, Figure S2) and the efficiency of capture was assessed by western blot. We also switched the azide–alkyne partners and observed robust metabolic labeling with Ac4ManNAl (Figure S2c). However, Ac4ManNAz with biotin-alkyne 2 gave more probe-dependent protein identifications and was thus employed for capture of labeled sialoglycoproteins for identification by MS-based proteomics.
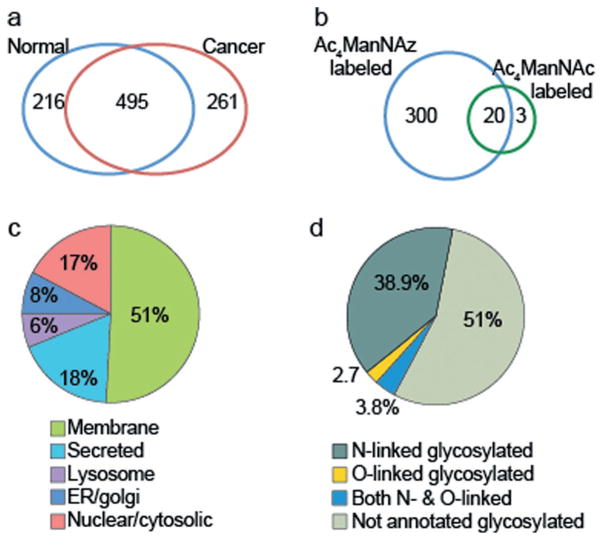
Having developed effective labeling conditions, we analyzed human prostate TSCs infiltrated with cancer of Gleason grades 3 and 4 (n =8) and TSCs from normal, noncancerous tissue (n =8), as determined by histological analysis of adjacent tissue slices. TSCs were incubated for three days with Ac4ManNAz or Ac4ManNAc, lysed, then reacted with biotin-alkyne 2, and subjected to MS-based proteomic analysis. In total, 972 non-redundant proteins were observed in the normal and cancer samples with 495 common to both groupings. We found 216 and 261 proteins that were unique to normal and cancer tissue, respectively (Figure 4a, Table S2). Although high detergent washes were performed, several highly abundant housekeeping proteins were still identified in the Ac4ManNAc control groups, such as actin and tubulin (Figure 4b). We also enriched sialylated glycoproteins from conditioned media of Ac4ManNAz-treated TSCs and identified 146 proteins unique to azide-labeled samples (Supporting Information, Figure S3).
Figure 4.
Distribution of identified proteins after enrichment. a) Unique proteins identified over n =8 cancer and normal TSCs after chemical biotinylation followed by enrichment. b) Azide-specific labeling was observed. c) Subcellular localization was highly specific to sialoglycoproteins. d) Both N- and O-linked glycoproteins were observed as determined by Swiss-Prot databank annotations.
We next analyzed the predicted subcellular compartment for each of the enriched proteins observed in tissue lysates. Over 68% of the proteins were classified as being membrane-bound or secreted (Figure 4c) and using the Swiss-Prot protein sequence databank annotations, over 45% were known glycoproteins (Figure 4d). This distribution is consistent with a glycosylation-dependent enrichment method. Based on these results, we compiled a list of proteins that had a greater than 4-fold increase in cancer versus normal tissue (Supporting Information, Table S1).
One such protein was voltage-dependent anion-selective channel 1 (VDAC1). VDAC1 is thought to be a mitochondrial membrane-bound protein; however, there is evidence of additional residence in the plasma membrane.[27] Recently, VDAC1 was proposed as a biomarker for gastric cancer,[28] and there is evidence of a correlation between VDAC1 expression and breast cancer grade.[29] Shoshan-Barmatz et al. recently demonstrated that silencing VDAC1 expression in PC-3 prostate cancer cells inhibited cellular proliferation and xenograft tumor growth.[30] We observed a 22-fold increase in VDAC1 in cancer compared to normal TSCs (Table S1). This increase could be due to higher protein concentration or, alternatively, to increased glycosylation, which would lead to greater enrichment efficiency. We confirmed that VDAC1 protein levels were dramatically upregulated in cancer TSC lysates (Supporting Information, Figure S4), strengthening the case for VDAC1 as a potential biomarker and demonstrating the utility of bioorthogonal labeling as a biomarker discovery platform.
In addition to enrichment of glycoproteins found in cancer versus normal TSCs, we also found proteins that were unique to cancer TSCs (Table 1). After removing cytosolic proteins, we identified 21 proteins seen in at least half of the cancer TSCs and none of the normal TSCs. Some of these proteins were previously implicated in prostate cancer, while others had no previous reported association.
Table 1.
Proteins found in prostate cancer proteomic dataset that were absent in normal dataset.
| Gene name | Protein name | Previous report |
|---|---|---|
| AGR2 | Anterior gradient protein 2 homolog | Ref. [33] |
| SYNGR2 | Synaptogyrin-2 | |
| ATP6AP1 | V-type proton ATPase subunit S1 | |
| LGMN | Legumain | Ref. [31] |
| GUSB | Beta-glucuronidase | |
| FUCA1 | Tissue alpha-L-fucosidase | |
| HLA-DRB1 | HLA class II histocompatibility antigen | Ref. [34] |
| CYB561 | Cytochrome b561 | |
| CFB | Complement factor B | Ref. [35] |
| HLA-A HLAA |
HLA class I histocompatibility antigen | Ref. [36] |
| APMAP | Adipocyte plasma membrane-associated protein | |
| HLA-H HLAH |
Putative HLA class I histocompatibility antigen | Ref. [36] |
| PCYOX1 | Prenylcysteine oxidase 1 | |
| CALR | Calreticulin | Ref. [37] |
| ORM2 | Alpha-1-acid glycoprotein 2 | |
| LMBRD1 | Probable lysosomal cobalamin transporter | |
| PODXL | Podocalyxin | Ref. [38] |
| PLXNB2 | Plexin-B2 | |
| TMED10 | Transmembrane emp24 domain-containing protein 10 | |
| FAM174B | Membrane protein FAM174B | |
| SCARB1 | Scavenger receptor class B member 1 | Ref. [39] |
| LDHA | L-lactate dehydrogenase A | Ref. [40] |
| VAS1 | V-type proton ATPase subunit S1 | Ref. [41] |
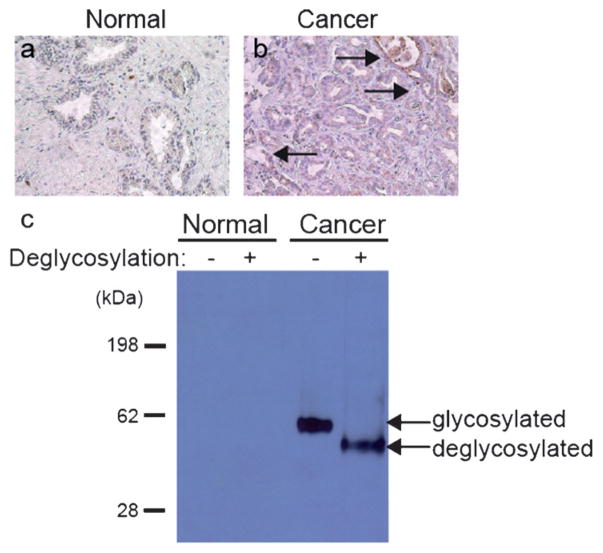
We were particularly interested in legumain (encoded by the gene LGMN), an asparaginyl endopeptidase that is highly expressed in several types of cancer. In our studies, it was observed in five out of eight prostate cancer tissue samples but not in any of the eight patient-derived normal TSCs. Recently, Ohno et al. reported that increased legumain expression correlated with prostate cancer invasiveness and aggression.[31] We did not detect legumain in normal fixed tissues, whereas in cancer tissue, we observed labeling on malignant epithelial cells (Figure 5a,b). Western blot analysis after digestion with deglycosylation enzymes confirmed that legumain in prostate cancer TSCs is indeed glycosylated (Figure 5c). This result supports the conclusion that the proteins in Table 1 are potentially unique to or uniquely glycosylated in cancer TSCs.
Figure 5.
Legumain is over-expressed and glycosylated in human prostate cancer tissue. Histological analysis of legumain expression in a) normal and b) cancer prostate tissue slice cultures. Arrows indicate epithelial cells with legumain immunoreactivity. c) Western blot of prostate TSCs lysate probed with a α-legumain mAb. Deglycosylation denotes presence or absence of commercial deglycosylation enzyme cocktail. Total protein loading was confirmed by Ponceau stain (not shown).
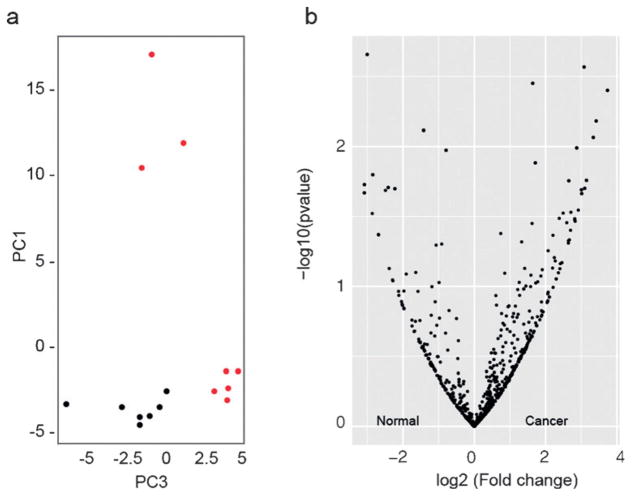
Finally, we determined whether a statistical modeling of our data could establish a glycoprotein signature that distinguishes cancer from normal tissue. We employed supervised principal component analysis (SPCA) using a method described by Tibshirani et al.[32] SPCA indicated that cancer TSCs were more heterogeneous than normal TSCs (Figure 6a). The quantitative data for each of the proteins observed is displayed in a volcano plot (Figure 6b).
Figure 6.
Comparative analysis of differentially regulated glycoproteins between normal and cancer TSCs. a) Supervised principle component analysis of normal (black) and cancer (red) datasets. b) Volcano plots illustrate differentially observed proteins from normal and cancer TSC samples. The x-axis represents the log2 (fold change) whereas y-axis represents the −log10 (p-value) where “p-value” is the p-value associated to the statistical Welch test.
One of the biggest challenges in the detection and management of cancer remains the lack of prognostic and predictive biomarkers. Of the molecular tissue-based risk classifiers commercially available to predict aggressive prostate cancer at the time of diagnosis or post-prostatectomy (Prolaris, Decipher, Oncotype Dx, and ProMark), only the latter is protein-based while the others measure RNA expression.[42] It is interesting to note that VDAC1, found in our study to be enriched in cancer versus normal prostate TSCs, was one of the 12 prognostic proteins identified by quantitative proteomics of prostate tissues from which the current eight-protein ProMark assay was derived.[43,44] Overall, however, few genes or proteins overlap among the current classifiers and clinical value remains to be validated in future prospective studies.
A contributor to this challenge is a lack of preclinical models that accurately recapitulate normal human prostate tissue or primary prostate cancer.[45 Herein, we demonstrate that human prostate TSCs can be metabolically labeled for the identification of cell-surface and secreted glycoproteins. We performed MS-based proteomics and identified glycoproteins that may be explored further as disease biomarkers.
This platform could be used to answer other questions related to cancer. For example, hypersialylation appears to play a role in tumor cell immune evasion.[46] Merging this platform with intact glycoproteome analysis techniques such as IsoTaG[47] may further augment the information obtained from cancer TSCs. Finally, while in this study we focused on the sialoglycoproteome, there are other sectors of the glycome that can be targeted with this method as well as other post-translational modifications that might change as a function of disease.
Supplementary Material
Acknowledgments
We thank Lauren J. S. Wagner, Lissette Andres, and Ben Schumann for helpful discussions and C. J. Cambier and Mireille Kamariza for technical assistance. We thank Frances Rodriguez-Rivera, Samantha Keyser and Ioannis Mountziaris for critical manuscript feedback. This research was supported by NIH (R01 CA200423 and U01 CA207701) and D.R.S. was supported by an NSF predoctoral fellowship. S.L.M. was supported by NIH training grant T32 K007217 and S.C.P. was supported by a UC Berkeley Regents’ and Chancellor’s fellowship. UC Berkeley QB3/Chemistry Mass Spectrometry Facility receives NIH support (1S10OD020062-01).
Footnotes
Conflict of interest
The authors declare no conflict of interest.
Supporting information, including experimental details and characterization, and the ORCID identification number(s) for the author(s) of this article can be found under: https://doi.org/10.1002/anie.201701424.
Contributor Information
David R. Spiciarich, College of Chemistry, University of California, Berkeley Berkeley, CA 94720 (USA)
Rosalie Nolley, Department of Urology, Stanford University School of Medicine Stanford, CA 94305 (USA).
Dr. Sophia L. Maund, Department of Urology, Stanford University School of Medicine Stanford, CA 94305 (USA)
Sean C. Purcell, College of Chemistry, University of California, Berkeley Berkeley, CA 94720 (USA)
Jason Herschel, Department of Mathematics, California State University, East Bay Hayward, CA 94542 (USA).
Dr. Anthony T. Iavarone, QB3/Chemistry Mass Spectrometry Facility, UC Berkeley Berkeley, CA 94720 (USA)
Prof. Donna M. Peehl, Department of Urology, Stanford University School of Medicine Stanford, CA 94305 (USA)
Prof. Carolyn R. Bertozzi, Department of Chemistry, Stanford University Stanford, CA 94305-4401 (USA) and Howard Hughes Medical Institute (USA)
References
- 1.Grammel M, Hang HC. Nat Chem Biol. 2013;9:475–484. doi: 10.1038/nchembio.1296. [DOI] [PMC free article] [PubMed] [Google Scholar]
- 2.Chuh KN, Pratt MR. Curr Opin Chem Biol. 2015;24:27–37. doi: 10.1016/j.cbpa.2014.10.020. [DOI] [PMC free article] [PubMed] [Google Scholar]
- 3.Mahal LK, Yarema KJ, Bertozzi CR. Science. 1997;276:1125–1128. doi: 10.1126/science.276.5315.1125. [DOI] [PubMed] [Google Scholar]
- 4.Laughlin ST, Bertozzi CR. ACS Chem Biol. 2009;4:1068–1072. doi: 10.1021/cb900254y. [DOI] [PMC free article] [PubMed] [Google Scholar]
- 5.Bianco A, Townsley FM, Greiss S, Lang K, Chin JW. Nat Chem Biol. 2012;8:748–750. doi: 10.1038/nchembio.1043. [DOI] [PubMed] [Google Scholar]
- 6.Laughlin ST, Baskin JM, Amacher SL, Bertozzi CR. Science. 2008;320:664–667. doi: 10.1126/science.1155106. [DOI] [PMC free article] [PubMed] [Google Scholar]
- 7.Prescher JA, Dube DH, Bertozzi CR. Nature. 2004;430:873–877. doi: 10.1038/nature02791. [DOI] [PubMed] [Google Scholar]
- 8.Ernst RJ, Krogager TP, Maywood ES, Zanchi R, Beránek V, Elliott TS, Barry NP, Hastings MH, Chin JW. Nat Chem Biol. 2016;12:776–778. doi: 10.1038/nchembio.2160. [DOI] [PMC free article] [PubMed] [Google Scholar]
- 9.Pinho SS, Reis CA. Nat Rev Cancer. 2015;15:540–555. doi: 10.1038/nrc3982. [DOI] [PubMed] [Google Scholar]
- 10.Dube DH, Bertozzi CR. Nat Rev Drug Discov. 2005;4:477–488. doi: 10.1038/nrd1751. [DOI] [PubMed] [Google Scholar]
- 11.Kailemia MJ, Park D, Lebrilla CB. Anal Bioanal Chem. 2017;409:395–410. doi: 10.1007/s00216-016-9880-6. [DOI] [PMC free article] [PubMed] [Google Scholar]
- 12.Hubbard SC, Boyce M, McVaugh CT, Peehl DM, Bertozzi CR. Bioorg Med Chem Lett. 2011;21:4945–4950. doi: 10.1016/j.bmcl.2011.05.045. [DOI] [PMC free article] [PubMed] [Google Scholar]
- 13.Hanson SR, Hsu T-L, Weerapana E, Kishikawa K, Simon GM, Cravatt BF, Wong C-H. J Am Chem Soc. 2007;129:7266–7267. doi: 10.1021/ja0724083. [DOI] [PMC free article] [PubMed] [Google Scholar]
- 14.Yang L, Nyalwidhe JO, Guo S, Drake RR, Semmes OJ. Mol Cell Proteomics. 2011;10:M110.007294. doi: 10.1074/mcp.M110.007294. [DOI] [PMC free article] [PubMed] [Google Scholar]
- 15.Palaniappan KK, Bertozzi CR. Chem Rev. 2016;116:14277–14306. doi: 10.1021/acs.chemrev.6b00023. [DOI] [PMC free article] [PubMed] [Google Scholar]
- 16.Saxon E, Bertozzi CR. Science. 2000;287:2007–2010. doi: 10.1126/science.287.5460.2007. [DOI] [PubMed] [Google Scholar]
- 17.Wratil PR, Horstkorte R, Reutter W. Angew Chem Int Ed. 2016;55:9482–9512. doi: 10.1002/anie.201601123. [DOI] [PubMed] [Google Scholar]; Angew Chem. 2016;128:9632–9665. [Google Scholar]
- 18.Sletten EM, Bertozzi CR. Acc Chem Res. 2011;44:666–676. doi: 10.1021/ar200148z. [DOI] [PMC free article] [PubMed] [Google Scholar]
- 19.Hsu T-L, Hanson SR, Kishikawa K, Wang SK, Sawa M, Wong C-H. Proc Natl Acad Sci USA. 2007;104:2614–2619. doi: 10.1073/pnas.0611307104. [DOI] [PMC free article] [PubMed] [Google Scholar]
- 20.Xie R, Dong L, Du Y, Zhu Y, Hua R, Zhang C, Chen X. Proc Natl Acad Sci USA. 2016;113:5173–5178. doi: 10.1073/pnas.1516524113. [DOI] [PMC free article] [PubMed] [Google Scholar]
- 21.Hällström T, Jäämaa S, Monkkönen M, Peltonen K, Andersson LC, Medema RH, Peehl DM, Laiho M. Proc Natl Acad Sci USA. 2007;104:7211–7216. doi: 10.1073/pnas.0609299104. [DOI] [PMC free article] [PubMed] [Google Scholar]
- 22.de Graaf IA, Olinga P, de Jager MH, Merema MT, de Kanter R, van de Kerkhof EG, Groothuis GM. Nat Protoc. 2010;5:1540–1551. doi: 10.1038/nprot.2010.111. [DOI] [PubMed] [Google Scholar]
- 23.Vaira V, Fedele G, Pyne S, Fasoli E, Zadra G, Bailey D, Snyder E, Faversani A, Coggi G, Flavin R, Bosari S, Loda M. Proc Natl Acad Sci USA. 2010;107:8352–8356. doi: 10.1073/pnas.0907676107. [DOI] [PMC free article] [PubMed] [Google Scholar]
- 24.Maund SL, Nolley R, Peehl DM. Lab Invest. 2014;94:208–221. doi: 10.1038/labinvest.2013.141. [DOI] [PMC free article] [PubMed] [Google Scholar]
- 25.Belardi B, de la Zerda A, Spiciarich DR, Maund SL, Peehl DM, Bertozzi CR. Angew Chem Int Ed. 2013;52:14045–14049. doi: 10.1002/anie.201307512. [DOI] [PMC free article] [PubMed] [Google Scholar]; Angew Chem. 2013;125:14295–14299. [Google Scholar]
- 26.Rostovtsev VV, Green LG, Fokin VV, Sharpless KB. Angew Chem Int Ed. 2002;41:2596–2599. doi: 10.1002/1521-3773(20020715)41:14<2596::AID-ANIE2596>3.0.CO;2-4. [DOI] [PubMed] [Google Scholar]; Angew Chem. 2002;114:2708–2711. [Google Scholar]
- 27.De Pinto V, Messina A, Lane DJR, Lawen A. FEBS Lett. 2010;584:1793–1799. doi: 10.1016/j.febslet.2010.02.049. [DOI] [PubMed] [Google Scholar]
- 28.Gao W, Xua J, Wang F, Zhang L, Penga R, Zhu Y, Tang Q, Wu J. Cell Phys Biochem. 2015;37:2339–2354. doi: 10.1159/000438588. [DOI] [PubMed] [Google Scholar]
- 29.Shoshan-Barmatz V, Golan M. Curr Med Chem. 2012;19:714–735. doi: 10.2174/092986712798992110. [DOI] [PubMed] [Google Scholar]
- 30.Arif T, Vasilkovsky L, Refaely Y, Konson A, Shoshan-Barmatz V. Mol Ther Nucleic Acids. 2014;3:e159. doi: 10.1038/mtna.2014.9. [DOI] [PMC free article] [PubMed] [Google Scholar]
- 31.Ohno Y, Nakashima J, Izumi M, Ohori M, Hashimoto T, Tachibana M. World J Urol. 2013;31:359–364. doi: 10.1007/s00345-012-0977-z. [DOI] [PubMed] [Google Scholar]
- 32.Bair E, Hastie T, Paul D, Tibshirani R. J Am Stat Assoc. 2006;101:119–137. [Google Scholar]
- 33.Kani K, Malihi PD, Jiang Y, Wang H, Wang Y, Ruderman DL, Agus DB, Mallick P, Gross ME. Prostate. 2013;73:306–315. doi: 10.1002/pros.22569. [DOI] [PubMed] [Google Scholar]
- 34.Younger AR, Amria S, Jeffrey WA, Mahdy AE, Goldstein OG, Norris JS, Haque A. Prostate Cancer Prostatic Dis. 2008;11:334–341. doi: 10.1038/sj.pcan.4501021. [DOI] [PubMed] [Google Scholar]
- 35.Hudson BD, Kulp KS, Loots GG. Brief Funct Genomics. 2013;12:397–410. doi: 10.1093/bfgp/elt021. [DOI] [PubMed] [Google Scholar]
- 36.Carlsson B, Forsberg O, Bengtsson M, Tötterman TH, Essand M. Prostate. 2007;67:389–395. doi: 10.1002/pros.20498. [DOI] [PubMed] [Google Scholar]
- 37.Lu YC, Weng WC, Lee H. Biomed Res Int. 2015:526524. doi: 10.1155/2015/526524. [DOI] [PMC free article] [PubMed] [Google Scholar]
- 38.Casey G, Neville PJ, Liu X, Plummer SJ, Cicek MS, Krumroy LM, Curran AP, McGreevy MR, Catalona WJ, Klein EA, Witte JS. Hum Mol Genet. 2006;15:735–741. doi: 10.1093/hmg/ddi487. [DOI] [PubMed] [Google Scholar]
- 39.Schörghofer D, Kinslechner K, Preitschopf A, Schütz B, Röhrl C, Hengstschläger M, Stangl H, Mikula M. Reprod Biol Endocrinol. 2015;13:88. doi: 10.1186/s12958-015-0087-z. [DOI] [PMC free article] [PubMed] [Google Scholar]
- 40.Naruse K, Yamada Y, Aoki S, Taki T, Nakamura K, Tobiume M, Zennami K, Katsuda R, Sai S, Nishio Y, Inoue Y, Noguchi H, Hondai N. Hinyokika Kiyo. 2007;53:287–292. [PubMed] [Google Scholar]
- 41.Michel V, Licon-Munoz Y, Trujillo K, Bisoffi M, Parra KJ. Int J Cancer. 2013;132:E1–E10. doi: 10.1002/ijc.27811. [DOI] [PMC free article] [PubMed] [Google Scholar]
- 42.Moschini M, Spahn M, Mattei A, Cheville J, Karnes RJ. BMC Med. 2016;14 doi: 10.1186/s12916-016-0613-7. s12916-016-0613-7. [DOI] [PMC free article] [PubMed] [Google Scholar]
- 43.Shipitsin M, Small C, Choudhury S, Giladi E, Friedlander S, Nardone J, Hussain S, Hurley AD, Ernst C, Huang YE, Chang H, Nifong TP, Rimm DL, Dunyak J, Loda M, Berman DM, Blume-Jensen P. Br J Cancer. 2014;111:1201–1212. doi: 10.1038/bjc.2014.396. [DOI] [PMC free article] [PubMed] [Google Scholar]
- 44.Blume-Jensen P, Berman DM, Rimm DL, Shipitsin M, Putzi M, Nifong TP, Small C, Choudhury S, Capela T, Coupal L, Ernst C, Hurley A, Kaprelyants A, Chang H, Giladi E, Nardone J, Dunyak J, Loda M, Klein EA, Magi-Galluzzi C, Latour M, Epstein JI, Kantoff P, Saad F. Clin Can Res. 2015;21:2591–2600. doi: 10.1158/1078-0432.CCR-14-2603. [DOI] [PubMed] [Google Scholar]
- 45.Pienta KJ, Abate-Shen C, Agus DB, Attar RM, Chung LW, Greenberg NM, Hahn WC, Isaacs JT, Navone NM, Peehl DM, Simons JW, Solit DB, Soule HR, VanDyke TA, Weber MJ, Wu L, Vessella RL. Prostate. 2008;68:629–39. doi: 10.1002/pros.20726. [DOI] [PMC free article] [PubMed] [Google Scholar]
- 46.Büll C, Stoel MA, den Brok MH, Adema GJ. Cancer Res. 2014;74:3199–3204. doi: 10.1158/0008-5472.CAN-14-0728. [DOI] [PubMed] [Google Scholar]
- 47.Woo CM, Iavarone AT, Spiciarich DR, Palaniappan KK, Bertozzi CR. Nat Methods. 2015;12:561–567. doi: 10.1038/nmeth.3366. [DOI] [PMC free article] [PubMed] [Google Scholar]
Associated Data
This section collects any data citations, data availability statements, or supplementary materials included in this article.


