Abstract
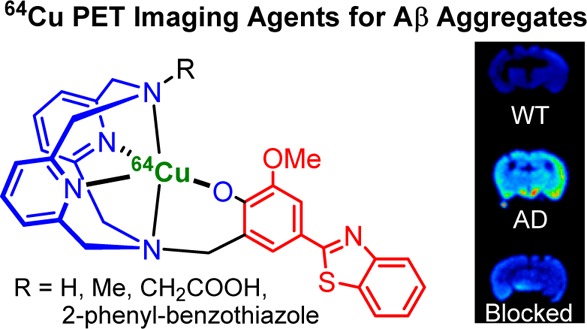
Positron emission tomography (PET) imaging agents that detect amyloid plaques containing amyloid beta (Aβ) peptide aggregates in the brain of Alzheimer’s disease (AD) patients have been successfully developed and recently approved by the FDA for clinical use. However, the short half-lives of the currently used radionuclides 11C (20.4 min) and 18F (109.8 min) may limit the widespread use of these imaging agents. Therefore, we have begun to evaluate novel AD diagnostic agents that can be radiolabeled with 64Cu, a radionuclide with a half-life of 12.7 h, ideal for PET imaging. Described herein are a series of bifunctional chelators (BFCs), L1–L5, that were designed to tightly bind 64Cu and shown to interact with Aβ aggregates both in vitro and in transgenic AD mouse brain sections. Importantly, biodistribution studies show that these compounds exhibit promising brain uptake and rapid clearance in wild-type mice, and initial microPET imaging studies of transgenic AD mice suggest that these compounds could serve as lead compounds for the development of improved diagnostic agents for AD.
Introduction
Alzheimer’s disease (AD) is the most common neurodegenerative disease and the sixth leading cause of death in the United States.1,2 Currently, more than 5 million people are diagnosed with AD in the US, and the number is expected to reach 15 million by the year 2050. The formation of amyloid plaques containing the amyloid β (Aβ) peptide is a key pathological characteristic of the brains of Alzheimer’s patients.1,3 The main alloforms of the Aβ peptides found in the amyloid plaques are 40 or 42 amino acids long (Aβ40 and Aβ42, respectively) with the latter considered to be more neurotoxic.4,5 According to the amyloid cascade hypothesis, Aβ aggregation and amyloid plaque formation initiate cellular events that can lead to neurodegeneration and AD.3,6 However, recent in vivo studies have shown that the soluble aggregates of the Aβ peptide, the Aβ oligomers, are possibly most neurotoxic, their formation being correlated with memory loss and neurodegeneracy.7,8 Thus, a new dogma in neurobiology has emerged suggesting that soluble Aβ oligomers,9 rather than insoluble amyloid fibrils, may be responsible for synaptic dysfunction and learning deficits in the brains of AD patients and AD animal models.10,11
Until recently, the unambiguous method to quantify the extent of amyloid plaque formation involved post-mortem histopathology techniques. Therefore, development of in vivo noninvasive positron emission tomography (PET) agents to identify Aβ plaques in living AD patients was a remarkable achievement.12−20 However, the only successful radionuclides to enable this feat exhibit short decay half-lives (11C, t1/2 = 20.4 min and 18F, t1/2= 109.8 min). These radionuclides also require multiple synthetic steps to be incorporated into the imaging agent. In this study, a series of bifunctional chelators (BFCs) were employed to chelate 64Cu and generate PET imaging agents. 64Cu is a radionuclide with a longer half-life (t1/2 = 12.7 h, β+ = 17%, β– = 39%, EC = 43%, Emax = 0.656 MeV) that can be considered an ideal PET tracer as long as the proper dose is administered.21−23 Moreover, the ease of metal chelation dramatically simplifies the radiosynthesis steps and leads to PET imaging agents that can be used for longer periods of time as well as allow their shipment in remote areas. However, the development of chelators that form Cu complexes stable enough to face the challenge of transchelation in vivo remains a difficult task.22 Commonly studied H4DOTA and H4TETA ligands were shown to form stable complexes of Cu2+ with high thermodynamic stability, yet they exhibit limited kinetic inertness.21−23 To obtain more kinetically inert complexes, cage-like polyazamacrocyclic chelators such as bicyclic hexaamines, dicarboxylic acid cross-bridged cyclen, and cyclam have been subsequently developed, yet these systems require harsher radiolabeling conditions.24−29 Most recently, cyclen, 1,4,7-triazacylononane (TACN), and bispidine ligands were shown to rapidly form Cu complexes with remarkable inertness.30−32
A great deal of research has been directed to developing multifunctional radiopharmaceuticals for theranostic applications.33 These often comprise macrocyclic ligands coupled to molecular fragments that exhibit affinity for specific biological targets.34−43 To that end, we have already shown that BFCs generated by linking metal-chelating groups to a 2-phenyl-benzothiazole fragment that resembles the amyloid-binding dye Thioflavin T (ThT) show high affinity for Aβ aggregates and also bind Cu2+ ions with picomolar affinity.44 Herein, we have employed the triazacyclononane (TACN) and 2,11-diaza[3.3](2,6)pyridinophane (N4) macrocycles linked to 2-phenyl-benzothiazole fragments to generate BFCs (Figure 1) that could be radiolabeled with 64Cu and thus be employed as PET imaging agents for the detection of Aβ aggregates in vivo. Both TACN and N4-type compounds have been shown previously to act as strong metal chelators.33,45,46
Figure 1.
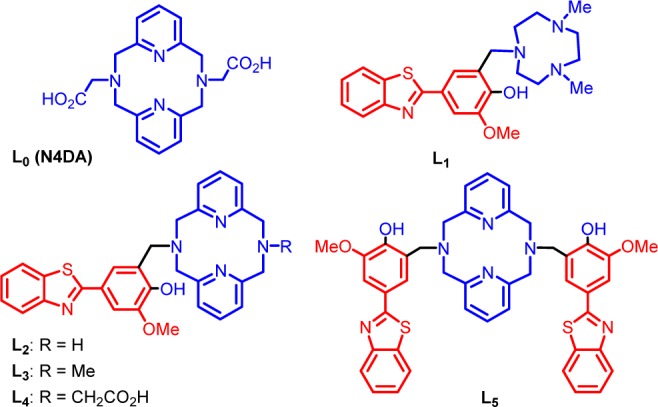
Structures of the investigated ligands L0 (N4DA) and L1–L5. The metal-binding and Aβ-interacting fragments are shown in blue and red, respectively.
Experimental Section
General Methods
All reagents were purchased from commercial sources and used as received unless stated otherwise. Solvents were purified prior to use by passing through a column of activated alumina using an MBRAUN SPS. For radiochemistry, ultrapure or trace metal-grade reagents were obtained from Sigma-Aldrich (St. Louis, MO) and used as received. All solutions and buffers were prepared using water purified from a Millipore Integral 5 Milli-Q water system (18 MΩ·cm resistivity, Billerica, MA). The water was then treated with Chelex overnight and filtered through a 0.22 μm nylon filter to remove trace amounts of metal ions. Whatman 60 Å silica gel thin layer chromatography (TLC) plates were purchased from Fisher Scientific (Pittsburgh, PA) and Radio-TLCs were analyzed using a Bioscan 200 imaging scanner (Bioscan, Inc., Washington, DC). Radioactivity was counted with a Beckman Gamma 8000 counter containing a NaI crystal (Beckman Instruments, Inc., Irvine, CA). High-performance liquid chromatography (HPLC) analysis was performed using Kinetex (Phenomenex) C-18 column (5 μm, 4.6 × 150 mm I.D.) in Agilent Technologies 1200 series HPLC equipped with a NaI radiotracer detector and a photodiode array detector.
Fluorescence Measurements
All fluorescence measurements were performed using a SpectraMax M2e plate reader (Molecular Devices). For ThT fluorescence studies, samples were diluted to a final concentration of 2.5 μM Aβ in PBS containing 10 μM ThT, and the fluorescence measured at 485 nm (λex = 435 nm). For Aβ fibril direct binding fluorescent studies, a 5 μM Aβ fibril solution was titrated with various amounts of a compound, and the fluorescence intensity was measured (λex/λem = 350/450 nm). For ThT competition assays, a 5 μM Aβ fibril solution with 2 μM ThT was titrated with various amounts of compound, and the ThT fluorescence was measured (λex/λem = 435/485 nm). For calculating the Ki values, a Kd value of 1.17 μM was used for the binding affinity of ThT to Aβ fibrils.44
Amyloid β Peptide Experiments
Aβ monomeric films were prepared by dissolving commercial Aβ42 or Aβ40 peptide (Keck Biotechnology Resource Laboratory, Yale University) in 1,1,1,3,3,3-hexafluoro-2-propanol (HFIP, 1 mM) and incubating for 1 h at room temperature.47 The solution was then aliquoted out and evaporated overnight. The aliquots were vacuum centrifuged, and the resulting monomeric films were stored at −80 °C. Aβ fibrils were generated by dissolving monomeric Aβ films in DMSO, diluting into the appropriate buffer, and incubating for 24 h at 37 °C with continuous agitation (final DMSO concentration was <2%).
Fluorescence Imaging of Tg2576 Mice Brain Sections
Fifteen month old Tg2576 transgenic mice and aged-matched WT mice brain sections were stained with Congo Red, a known amyloid-binding dye, and amyloid plaque load was determined according to previously published protocols.48,49 Stained brain sections were imaged using a LSM 7010 confocal fluorescent microscope (Zeiss). The fluorescent images were merged to determine the correlation between the autoradiography intensity and the fluorescent staining of the amyloid deposits.
Radiolabeling
64Cu was produced by a (p,n) reaction on enriched 64Ni on a CS-15 biomedical cyclotron (Cyclotron Corporation, Berkeley, CA) at Mallinckrodt Institute of Radiology, Washington University School of Medicine, and purified with an automated system using standard procedures.50,51 A stock solution of 64CuCl2 was diluted with a 10-fold excess of 0.1 M ammonium acetate (NH4OAc), pH 7 for radiolabeling. Labeling of BFCs with 64Cu was achieved by adding 0.01–0.05 μmol of compounds to 37 MBq (1 mCi) of 64CuCl2 in 100 μL of 0.1 M NH4OAc, pH 7. The reactions were incubated on a thermomixer with 800 rpm agitation at 45 °C for 20 min. Radiolabeled complexes were analyzed by TLC and high-performance liquid chromatography (HPLC). Radio-TLCs were developed in acetonitrile:water 70:30% v/v mixture and analyzed using a TLC imaging scanner. Radio-HPLC analysis was performed with a mobile phase of water (0.1% TFA) and acetonitrile (0.1% TFA), 0–100% acetonitrile over 20 min, and elution was run for 15 min with a 1 mL/min flow rate. A radiochemical yield of greater than 95% was achieved for all labeled compounds, and therefore, they were used without further purification.
Lipophilicity Studies
The 64Cu-labeled complexes (5 μL, 0.37 MBq, 10 μCi) were added to a 1:1 v:v mixture of N-octanol and Milli-Q water (500 μL/ea). The samples were vortexed at 1,000 rpm for 1 h and then given 30 min for the layers to separate. Aliquots (100 μL) from the aqueous and the N-octanol layers were removed and counted separately in an automated gamma counter. The partition coefficients were calculated using the ratio of (activity detected in N-octanol)/(activity detected in aqueous layer) to obtain the logPoct values. The experiment was conducted in triplicates of triplicates, and the overall average was recorded as the final logPoct value for each compound.
In Vitro Binding Assay with 64Cu-Radiolabeled Complexes
For blocking studies, the nonradiolabeled compounds 4-hydroxyphenylbenzothiazole (B1) and 4-aminomethyl-phenylbenzothiazole (B2) were used (Figure S1).52 Aβ40 fibrils (5 μg) were dissolved in 100 μL of binding buffer (10 mM HEPES, 5 mM MgCl2, 1 mM EDTA, 0.1% BSA, 10 μg/mL of leupeptin, 10 μg/mL of pepstatin, 0.5 μg/mL of aprotinin, and 200 μg/mL of bacitracin, pH 7.4) and added to 0.1% polyethylenimine-pretreated wells of a 96-well Multiscreen Durapore filtration plate (Millipore Corp., Bedford, MA) via vacuum manifold aspiration. Triplicates were used for each BFC. The wells were washed three times with wash buffer (10 mM HEPES, 1 mM EDTA, 5 mM MgCl2, 0.1% BSA). After the addition of 5 μg of Aβ40 fibrils to each well, 0 μg of block, 10 μg of B1, or 10 μg of B2 in a volume of 10 μL of binding buffer was added to triplicate wells. Approximately 500,000 counts per minute (CPM) of 64Cu-labeled BFCs in 100 μL of binding buffer were added to each triplicate well. The plate was incubated at room temperature for 1 h on a shaker, and then the wells were washed twice with wash buffer. The membranes were allowed to dry, removed, and placed in separate tubes for determination of bound radioactivity. The radioactivity was counted using an automated gamma counter.
Biodistribution Studies
All animal experiments were performed in compliance with the Guidelines for Care and Use of Research Animals established by the Division of Comparative Medicine and the Animal Studies Committee of Washington University School of Medicine. Initial biodistribution studies were conducted in wild-type CD-1 female mice (Charles River Laboratories) of age 5–7 weeks weighing 25.4 ± 1.4 g. The injection dose was prepared by diluting into a 90% saline solution. The uptake of 64Cu-labeled compounds was evaluated in mice (L0, L1, L4, n = 7; L2, L3, L5, n = 3) that were injected via the tail vein with 0.22–0.37 MBq (6–10 μCi) of each compound per animal in 100 μL of saline solution. After each time point (2, 60, and 240 min), mice were anesthetized with 1–2% isoflurane and euthanized by cervical dislocation. The post-PET biodistribution studies were conducted with 15 month old Tg2576 transgenic mice and aged-matched wild-type (WT) mice, and the biodistribution counting was performed immediately after the imaging. Brain, blood, kidney, liver, and other organs of interest were harvested, and the amount of radioactivity in each organ was counted on a gamma counter containing a NaI crystal. The data were corrected for radioactive decay, and the percent injected dose per gram (%ID/g) of tissue was calculated. All samples were calibrated against a known standard. Quantitative data were processed by Prism 6 (GraphPad Software, v 6.03, La Jolla, CA) and expressed as mean ± SEM. Statistical analysis was performed using one-way analysis of variance and Student’s t test. Differences at the 95% confidence level (p < 0.05) were considered statistically significant.
Ex Vivo Autoradiography Studies
Brain sections of 15 month old Tg2576 transgenic mice and aged-matched WT mice were obtained as described previously48,49 and immersed into a cryoprotectant solution. These sections were sorted and carefully removed using phosphate buffer in saline (PBS) with 1% tween-20 solution and mounted onto adhesive glass slides (CFSA 1X, Leica Bio Systems). Each section was washed with 100% PBS three times, and ∼0.925 MBq (25 μCi) of 64Cu-labeled BFC in 100 μL total volume was added to completely cover the brain section and incubate for 1 h at room temperature in a shielded bunker. After the incubation, brain sections were washed using PBS with five 1 min cycles and briefly air-dried. The imaging slides were mounted onto a phosphor imaging screen plate (GE Healthcare Life Sciences) and exposed for 1–5 min. The plates were scanned using a phosphor imager plate scanner (Storm 840), and the resulting images were processed using ImageQuant 5.2 (Molecular Dynamics) and ImageJ (v1.48, public domain) software.
PET/CT Imaging Studies
Small animal PET/CT imaging studies were conducted in Tg2576 transgenic mice weighing 27.3 ± 3.7 g. To these mice, 2.55–3.70 MBq (69–100 μCi) of 64Cu-labeled BFCs were administrated via tail vein injection. Mice were anesthetized with 1–2% isofluorane/oxygen and imaged on an Inveon small animal PET/CT scanner (Siemens Medical Solutions) for 30 min. Dynamic images were collected and reconstructed with the maximum aposteriory probability (MAP) algorithm followed by CT coregistration with the Inveon Research Workstation image display software (Siemens Medical Solutions, Knoxville, TN). Regions of interest (ROI) were selected from PET images with the CT anatomical guidelines, and the associated radioactivity was measured using Inveon Research Workstation software. Standard uptake values (SUV) were calculated as nCi/cc×animal weight/injected dose.
Results and Discussion
Design and Synthesis of BFCs
During the past several years, we have reported a novel class of bifunctional compounds (BFCs) that can chelate transition metal ions and also interact with Aβ aggregates.44,53 For example, the BFCs L1–L5 were generated using a convergent synthetic route based on a Mannich reaction between 2-(4-hydroxy-3-methoxyphenyl-benzothiazole and strong metal chelators such as 2,4-dimethyl-1,4,7-triazacyclononane (for L2) and 2,11-diaza[3.3](2,6)-pyridinophane derivatives (for L3–L5) in the presence of paraformaldehyde (Figure 1).54,55 The 4-hydroxyphenyl-benzothiazole molecular structure is derived from Thioflavin T, a well-known amyloid-binding fluorescent dye, and o-vanilin, a compound shown to have affinity for Aβ oligomers.56,57 The previously reported metal chelator N,N′-diacetate-2,11-diaza[3.3](2,6)-pyridinophane (L0 or N4DA) was employed as a control compound that does not contain an amyloid-binding fragment.45,46
Interaction of L1–L5 with Aβ Species
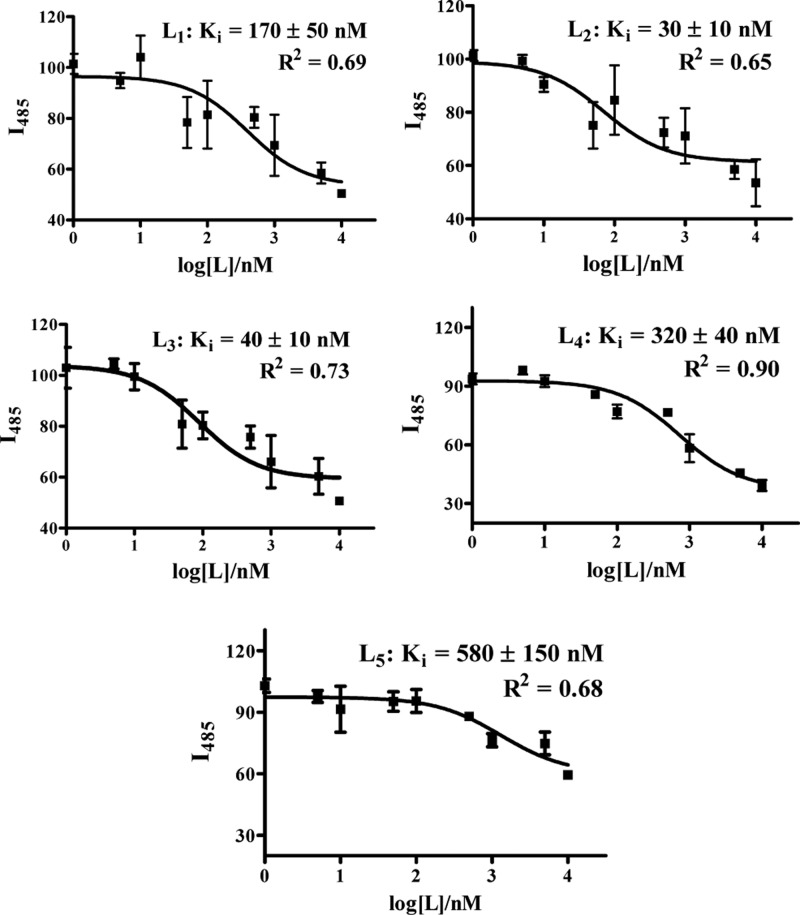
First, the in vitro affinities of BFCs L1–L5 for amyloid fibrils were evaluated. For this purpose, Aβ40 fibrils were used as they are known to be fairly homogeneous without any nonfibrillar aggregates,58,59 and a ThT fluorescence competition assay was employed to determine the binding affinity of L1–L5 for Aβ40 fibrils.44,52,60 Although direct binding fluorescent assays could also be employed to obtain Kd values for these BFCs (as shown for L1 and L5 in Figures S4 and S5, respectively), the different emission intensities of these compounds hamper a direct comparison of their affinity for Aβ aggregates. In addition, the direct binding assays could be complicated due to slightly different binding sites for the various compounds. In the ThT competition assays, to a solution containing fixed concentrations of Aβ40 fibrils and ThT, various amounts of BFC ligand (0–5 μM) were added, and the decrease in ThT fluorescence intensity was measured. In our conditions, ThT exhibited an affinity of Kd = 1.17 ± 0.14 μM for Aβ40 fibrils, similar to literature values.44 The BFCs L1–L5 exhibit nanomolar affinity for Aβ40 fibrils with Ki values from 30 to 580 nM (Figure 2 and Table 1). Compounds L2 and L3 show the highest affinity for Aβ fibrils with Ki values of 30 ± 10 and 40 ± 10 nM, respectively, whereas L4 and L5 show the lowest affinity with Ki values of 320 ± 40 and 580 ± 150 nM, respectively. These results suggest that, for an N4-type BFC containing an amyloid-binding 2-phenyl-benzothiazole fragment, a small second N-substituent such as H or CH3 is preferred, because a larger group such as acetate or even another 2-phenyl-benzothiazole group may hinder the interaction of the BFC with the β-sheet structure of the Aβ fibrils. By comparison, the TACN-derived BFC L1 exhibits a Ki value of 170 ± 50 nM, corresponding to an affinity for Aβ fibrils that is slightly lower than those of L2 and L3 and that suggests that the N4-type chelator may exhibit additional interactions with the β-sheet structure of the Aβ fibrils through pyridine rings of the N4 macrocycle. Although indeed the Ki values obtained through these ThT fluorescence competition assays exhibit appreciable error, overall they do suggest that the investigated BFCs L1–L5 exhibit good affinity for Aβ40 fibrils in vitro to justify their amyloid-binding evaluation ex vivo.
Figure 2.
ThT fluorescence competition assays for BFCs L1–L5 with ThT-bound Aβ40 fibrils ([Aβ] = 2 μM, [ThT] = 1 μM). The fits to the data, along with the corresponding Ki values and goodness of fit, are given for each plot.
Table 1. Properties of Ligands L0–L5, Measured Log Poct Values for the Corresponding 64Cu-Radiolabeled Complexes, and Aβ Fibril-Binding Affinity Ki Values for BFCs and their Cu Complexes (NA = Not Applicable).
| ligand | MW (g mol–1) | log Poct | KiLn (nM) | Ki Cu-Ln (nM) |
|---|---|---|---|---|
| L0 | 384.4 | –1.09 ± 0.16 | NA | NA |
| L1 | 426.6 | 0.97 ± 0.12 | 170 ± 50 | 765 ± 30 |
| L2 | 509.6 | 0.72 ± 0.08 | 30 ± 10 | 275 ± 20 |
| L3 | 523.7 | 0.64 ± 0.11 | 40 ± 10 | 325 ± 25 |
| L4 | 567.9 | 0.82 ± 0.05 | 320 ± 40 | 2350 ± 250 |
| L5 | 779.0 | 0.92 ± 0.07 | 580 ± 150 | 142 ± 55 |
Fluorescence Imaging of Amyloid Plaques in Tg2576 AD Mouse Brain Sections
The amyloid-binding properties of L1–L5 were further probed through fluorescence microscopy studies by taking advantage of their intrinsic fluorescent properties.61 For these ex vivo studies, brain sections of 15 month old Tg2576 APP transgenic mice were employed. Tg2576 mice overexpress a mutant form of amyloid precursor protein (APP) linked to early onset familial Alzheimer’s disease, and they develop amyloid plaques and progressive cognitive impairments.62 Interestingly, an appreciable amount of fluorescence staining was observed upon incubation of the brain sections for 30 min with 5 μM solutions of our BFCs (Figure 3 and Figure S11), especially for L1–L3 (Figure 3, left panels). The specific staining of amyloid plaques was confirmed by staining with Congo Red, another amyloid-binding fluorescent dye (Figure 3, column 2). Importantly, it seems that our BFCs might have the ability to stain both dense and diffuse amyloid plaques in vivo, as shown for L1 (white arrows in the top-right panel of Figure 3), which could be used for the development of PET imaging agents for early diagnosis of AD.63 Overall, these ex vivo amyloid binding studies strongly support the in vitro Aβ fibril binding results and suggest that these BFCs could be employed in studies in vivo (see below).
Figure 3.
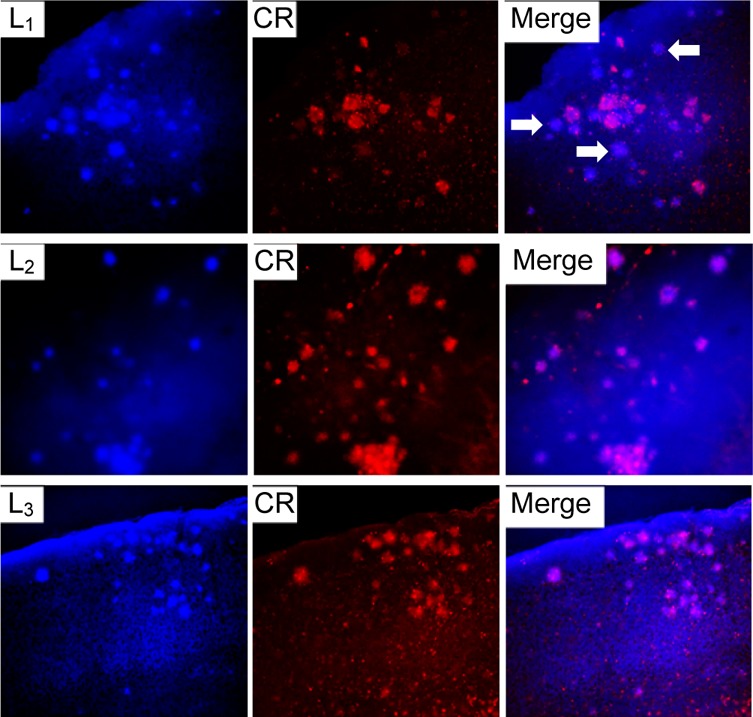
Fluorescence microscopy images of Tg2576 brain sections incubated with compounds L1, L2, and L3 (left panels), Congo Red (middle panels), and merged images (right panels). The white arrows in the top-right panel show the staining by L1 of diffuse plaques, which are not stained significantly by Congo Red.
Interaction of Cu Complexes of L1–L5 with Aβ Aggregates
The goal of our studies is to employ 64Cu-labeled BFCs in PET imaging applications.64−66 In that regard, we have first synthesized and fully characterized the cold Cu complexes of these BFCs.55 Spectrophotometric titrations reveal that L1–L5 are extremely strong chelators for Cu2+ with log K stability constants of 27–32 for the corresponding Cu complexes,55 which are tighter than the common metal scavengers EDTA and DTPA.67
We have also investigated the Aβ binding affinity of the Cu complexes of these BFCs. Because Cu2+ ions are well-known to quench the fluorescence of the Cu-bound ligands, we have employed ThT competition assays to determine the affinities of Cu complexes of L1–L5 for Aβ40 fibrils (Table 1). For example, L1-Cu showed a moderate affinity with a Ki of 765 ± 30 nM (Figure S6)68 that is only slightly lower than that of free L1 (Ki = 175 ± 50 nM, Figure 2). Gratifyingly, L2-Cu, L3-Cu, and L5-Cu complexes all show higher affinities for Aβ40 fibrils with Ki values of 275 ± 20, 325 ± 25, and 142 ± 55 nM, respectively (Figures S7, S8, and S10). In contrast, the L4-Cu complex showed an appreciably lower affinity with Ki of 2.33 ± 0.25 μM (Figure S9),68 which may due to the change in the charge of the metal complex upon deprotonation of the carboxylic acid arm. In contrast, the L5-Cu complex exhibits a higher affinity for Aβ40 fibrils than the parent L5 compound, likely due to a rearrangement of the two 2-phenyl-benzothiazole groups upon Cu binding to allow for a better interaction with the amyloid fibril structure. Overall, these results confirm that the Cu complexes of L1–L5 have the ability to interact with Aβ aggregates with affinities comparable to those of the metal-free BFCs. Importantly, to the best of our knowledge, this is the first study to report the quantitative determination of Aβ binding affinities for Cu complexes,64−66 which is an essential in vitro experiment needed for the development of 64Cu-labeled PET imaging agents for Aβ aggregates.
Radiolabeling and Log P Value Determination
The radiolabeling of compounds L0–L5 was performed using 64CuCl2 and employing the conditions described in the Experimental Section. Quality control assays were conducted using HPLC and/or TLC, and HPLC retention times were observed as 5.3, 10.8, 10.9, 10.9, 11.2, and 10.8 min, respectively, for the 64Cu-radiolabeled L0–L5 complexes (Figures S12 and S13).68 All radiochemical purities were >95% within minutes at 45 °C with specific activities of 100 Ci/mmol or greater. Therefore, all radiolabeled complexes were used directly without further purification.
One important aspect of developing an imaging agent for Alzheimer’s disease is that it should be able to effectively cross the blood–brain barrier (BBB).69,70 For the hydrophobicity of the radiolabeled compounds to be determined, the octanol/water partition coefficient values log Poct were determined for the 64Cu complexes of L0–L5 (Table 1). Gratifyingly, the obtained log Poct values for the 64Cu-radiolabeled complexes L1–L5 are in the range of 0.64–0.97, which suggests their potential ability to cross the BBB.71 By comparison, the 64Cu complex of L0 (N4DA), which does not contain an amyloid-binding fragment, exhibits a negative log Poct value of −1.09 ± 0.16 and thus is not expected to cross the BBB. We are indeed aware that compounds with slightly higher log Poct values (ideally larger than 1) would be desirable, and thus we expect that simple chemical modifications of these BFCs should improve the log Poct values of second-generation compounds by increasing their hydrophobicity and eventually increasing their BBB permeability.71
Single Point Binding Assays
The in vitro Aβ binding affinities of 64Cu-labeled BFCs were determined by incubating the radiolabeled complexes with a constant amount of Aβ40 fibrils both in the absence and presence of a blocking agent (Figure 4). The two blocking agents employed, B1 and B2, contain a 2-phenyl-benzothiazole fragment and exhibit high affinities for Aβ fibrils (Figures S1–S3).68 Importantly, all BFCs showed similar uptake values that confirm a tight interaction with the Aβ fibrils. By contrast, for all compounds except L3, the signal decreases by at least 60% in the presence of a blocking agent (especially for B1, which is a more effective blocking agent than B2) and thus supporting specific binding to the Aβ fibrils. Compound L3 shows an appreciable amount of nonspecific binding and thus was not employed in subsequent in vivo imaging studies (see below). Overall, these blocking studies strongly support the specific binding of the 64Cu-radiolabeled BFCs to the Aβ fibrils.
Figure 4.
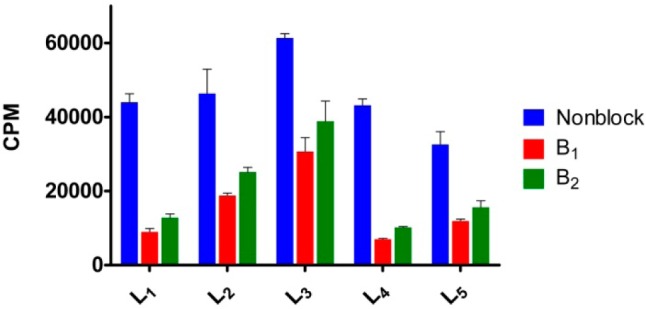
Single point in vitro binding studies to evaluate the specificity of the 64Cu-radiolabeled ligands for the Aβ fibrils.
Autoradiography Studies
Ex vivo autoradiography studies using brain sections of transgenic Tg2576 mice were also conducted to determine the specific binding of the 64Cu-labeled BFCs to the amyloid plaques. The brain sections were stained, washed, and imaged as described in the Experimental Section. By comparison to the wild-type brain sections that show a limited background intensity (Figure 5, second row), an increased autoradiography intensity was observed upon treatment of the Tg2576 mouse brain sections with the 64Cu-labeled complexes of L1–L5 (Figure 5, second row). As expected, for 64Cu-L0 that does not bind to amyloid plaques, no marked difference was observed between the WT and transgenic mouse brain sections. The specific binding to amyloid plaques of the radiolabeled BFC was further confirmed by blocking with the nonradioactive blocking agent B1, which led to a markedly decreased autoradiography intensity (Figure 5, third row). Finally, the presence of the amyloid plaques toward the edges of the Tg2576 mouse brain sections was confirmed by subsequent staining with Congo Red of the brain sections that were used in the autoradiography studies (Figure 6). Overall, these autoradiography results strongly suggest that 64Cu-labeled BFCs L1–L5 exhibit the ability to detect Aβ in vivo.
Figure 5.
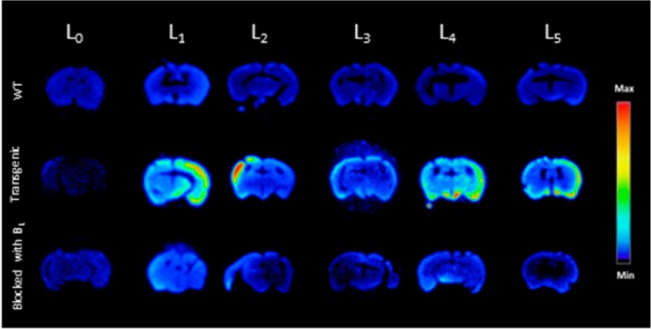
Autoradiography images of brain sections of WT and transgenic mice (Tg2576) in the absence and presence of a known Aβ-specific blocking agent (B1).
Figure 6.
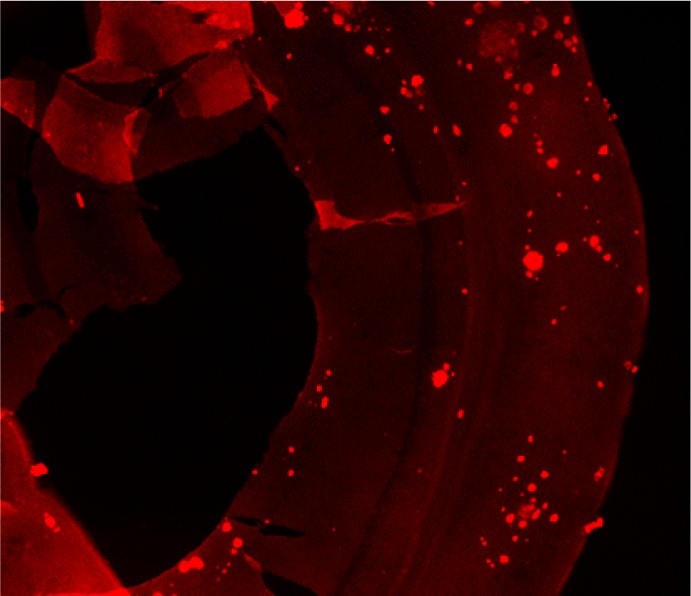
A representative Tg2576 mouse brain section used for the autoradiography study with 64Cu-L4 and subsequently stained with Congo Red to confirm the presence of amyloid plaques close to the edges of the brain section.
Biodistribution Studies
Encouraged by the promising in vitro studies, in vivo biodistribution experiments were performed to investigate the pharmacokinetics of 64Cu-radiolabeled L0–L5 complexes using normal CD-1 mice as described in the Experimental Section. The retention and accumulation of the 64Cu-radiolabeled complexes in selected organs were evaluated at 2, 60, and 240 min after tracer administration (Table 2). Excitingly, appreciable brain uptake was observed for all BFCs at 2 min post-injection, followed by a rapid washout from the brains of these wild-type mice (Figure 7). Surprisingly, the brain uptake of 64Cu-L0, albeit low, was slightly higher than that of 64Cu-L1, likely due to the formation of a neutral Cu complex for L0 vs a monocationic Cu complex for L1.55 Among all BFCs tested, 64Cu-L2 showed the highest brain uptake of 1.33 ± 0.27% ID/g at 2 min post-injection, which dropped to 0.27 ± 0.03% ID/g at 60 min. 64Cu-L4 and 64Cu-L5 also showed good brain uptake of 0.61 ± 0.14 and 0.75 ± 0.16% ID/g at 2 min post-injection, respectively (Figure 7). Importantly, the brain uptake observed for 64Cu-L2 compares favorably to those observed recently by Donnelly et al. for 64Cu complexes of amyloid-binding bis-thiosemicarbazone derivatives.66 It is important to note the appreciable liver uptake of the 64Cu-labeled L1–L5 compounds (Table 2). Although this may suggest a somewhat limited stability of the radiolabeled Cu complexes in vivo, the observed liver uptake also correlates with the lipophilicity of these 64Cu-labeled BFCs (Table 1). In addition, the observed liver uptake observed herein is similar to that observed for 64Cu-labeled DOTA,72 an extensively used Cu chelator for PET imaging studies.21−23 Overall, these biodistribution studies strongly suggest that these 64Cu-radiolabeled compounds can cross the BBB, and thus could serve as PET imaging agents for detection of Aβ aggregates in vivo. Importantly, the rapid clearance from the brain of WT mice suggest that these radiolabeled BFCs do not release 64Cu ions in the brain to an appreciable extent and thus should not lead to a significant background PET signal in healthy controls.
Table 2. Overall Biodistribution Results of 64Cu-Labeled L0–L5 for the Three Time Points Evaluated (2, 60, and 240 min; % Injected Dose/Gram, Mean ± SEM).
| L0 2 min | L0 60 min | L0 240 min | L1 2 min | L1 60 min | L1 240 min | |
|---|---|---|---|---|---|---|
| blood | 7.58 ± 0.48 | 0.96 ± 0.06 | 0.88 ± 0.01 | 4.32 ± 0.46 | 0.98 ± 0.04 | 1.04 ± 0.19 |
| lung | 7.49 ± 0.73 | 5.14 ± 0.23 | 5.08 ± 0.55 | 3.32 ± 0.04 | 3.67 ± 0.06 | 4.48 ± 0.31 |
| liver | 5.59 ± 0.40 | 9.87 ± 0.84 | 7.71 ± 0.37 | 37.58 ± 3.18 | 18.03 ± 1.46 | 10.39 ± 0.75 |
| kidney | 33.95 ± 2.09 | 8.43 ± 0.29 | 6.98 ± 0.30 | 73.56 ± 6.98 | 46.89 ± 2.99 | 27.92 ± 3.92 |
| muscle | 2.55 ± 0.14 | 0.55 ± 0.03 | 0.40 ± 0.03 | 0.74 ± 0.05 | 0.55 ± 0.18 | 0.40 ± 0.05 |
| brain | 0.37 ± 0.06 | 0.14 ± 0.01 | 0.20 ± 0.01 | 0.17 ± 0.02 | 0.13 ± 0.01 | 0.20 ± 0.02 |
| bone | 2.66 ± 0.09 | 1.06 ± 0.09 | 0.97 ± 0.18 | 0.69 ± 0.01 | 0.68 ± 0.02 | 0.89 ± 0.11 |
| tail | 15.51 ± 2.53 | 3.95 ± 0.38 | 2.00 ± 0.24 | 5.32 ± 1.72 | 2.28 ± 0.69 | 1.60 ± 0.19 |
| L2 2 min | L2 60 min | L2 240 min | L3 2 min | L3 60 min | L3 240 min | |
|---|---|---|---|---|---|---|
| blood | 20.54 ± 1.17 | 3.66 ± 0.20 | 2.75 ± 0.20 | 12.16 ± 1.15 | 1.26 ± 0.18 | 1.43 ± 0.26 |
| lung | 11.51 ± 0.83 | 6.93 ± 0.33 | 8.66 ± 0.92 | 29.25 ± 1.65 | 6.85 ± 1.44 | 7.18 ± 0.31 |
| liver | 31.42 ± 5.32 | 27.13 ± 2.76 | 24.14 ± 1.55 | 38.57 ± 1.21 | 43.36 ± 6.24 | 35.11 ± 1.07 |
| kidney | 31.78 ± 2.26 | 42.51 ± 1.46 | 31.10 ± 1.82 | 35.22 ± 2.13 | 22.12 ± 3.15 | 18.56 ± 2.01 |
| muscle | 1.25 ± 0.11 | 0.97 ± 0.08 | 0.76 ± 0.09 | 0.77 ± 0.12 | 0.44 ± 0.04 | 0.48 ± 0.06 |
| brain | 1.33 ± 0.27 | 0.27 ± 0.03 | 0.30 ± 0.01 | 0.49 ± 0.01 | 0.22 ± 0.04 | 0.21 ± 0.01 |
| bone | 2.09 ± 0.21 | 1.37 ± 0.04 | 1.35 ± 0.06 | 1.30 ± 0.13 | 1.19 ± 0.33 | 1.38 ± 0.09 |
| tail | 61.81 ± 4.63 | 15.52 ± 5.02 | 17.03 ± 6.21 | 15.00 ± 3.57 | 14.14 ± 3.58 | 9.12 ± 1.48 |
| L4 2 min | L4 60 min | L4 240 min | L5 2 min | L5 60 min | L5 240 min | |
|---|---|---|---|---|---|---|
| blood | 10.93 ± 0.86 | 0.99 ± 0.08 | 0.93 ± 0.07 | 22.88 ± 2.96 | 2.53 ± 0.05 | 2.16 ± 0.03 |
| lung | 7.65 ± 0.63 | 3.92 ± 0.88 | 4.21 ± 0.30 | 11.91 ± 1.82 | 7.20 ± 0.86 | 10.03 ± 0.34 |
| liver | 36.53 ± 2.12 | 11.60 ± 0.93 | 9.20 ± 0.53 | 57.70 ± 4.43 | 35.83 ± 3.68 | 26.65 ± 0.17 |
| kidney | 17.64 ± 0.52 | 15.53 ± 1.01 | 6.23 ± 0.27 | 79.87 ± 2.80 | 80.82 ± 12.03 | 36.69 ± 1.46 |
| muscle | 1.67 ± 0.07 | 0.39 ± 0.03 | 0.38 ± 0.06 | 1.38 ± 0.09 | 0.87 ± 0.05 | 0.68 ± 0.06 |
| brain | 0.61 ± 0.14 | 0.13 ± 0.01 | 0.16 ± 0.01 | 0.75 ± 0.16 | 0.26 ± 0.01 | 0.40 ± 0.03 |
| bone | 2.47 ± 0.28 | 0.61 ± 0.12 | 0.66 ± 0.04 | 2.31 ± 0.30 | 1.32 ± 0.05 | 1.68 ± 0.07 |
| tail | 9.20 ± 0.33 | 5.02 ± 2.02 | 2.35 ± 0.70 | 24.57 ± 9.06 | 24.83 ± 4.68 | 25.60 ± 8.33 |
Figure 7.
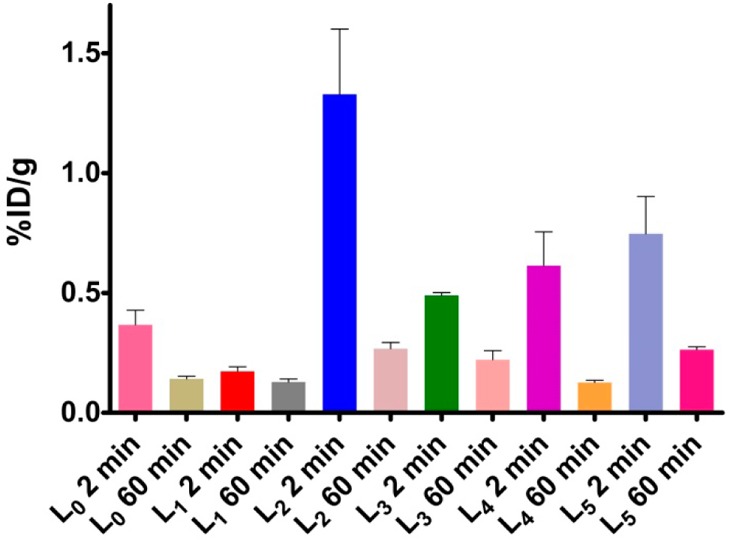
Brain uptake (% ID/g) results from the in vivo biodistribution study in CD-1 mice at 2 and 60 min post-injection.
PET/CT Imaging Studies
In vivo PET imaging studies were conducted to investigate the brain uptake and activity distribution of the 64Cu-radiolabeled BFCs L1, L2, L4, and L5 in Tg2576 transgenic mice (n = 3). Thirty-minute dynamic scans were conducted following intravenous injection of the radiotracers. The PET images are shown in Figure 8, and the PET/CT-fused maximum intensity projections are shown in Figure S14. Excitingly, radiotracer accumulation was observed in the head and neck area for 64Cu-L2, 64Cu-L4, and 64Cu-L5, whereas 64Cu-L1 showed no appreciable uptake in line with the biodistribution studies. The maximum brain uptake values were observed in the 1–8 min window, and then the excess radioactivity was washed out according to the dynamic scans (Figures 9). Importantly, the standard uptake value (SUV) curves clearly indicate that 64Cu-L2 has a significantly higher brain uptake and tracer accumulation compared to those of the other 64Cu-labeled BFCs. These results correlate well with the biodistribution studies in wild-type mice and also with the in vitro amyloid binding experiments that showed L2 has that highest affinity for Aβ aggregates. This lends promise to the use of such in vitro assays for rapid screening of the second-generation BFCs currently being developed in our laboratories and thus should lead to compounds with improved brain uptake and Aβ binding properties in vivo. In addition, the use of transgenic AD mice instead of WT mice in PET imaging studies seems to be essential for the accurate screening for imaging agents that show specificity for amyloid aggregates.66
Figure 8.
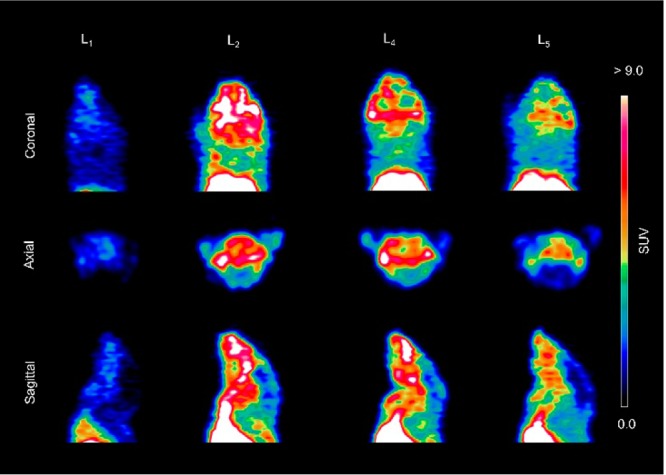
Representative coronal, axial, and sagittal PET images of 64Cu-radiolabeled ligands L1, L2, L4, and L5 in Tg2576 transgenic mice with dynamic scans summed from 1 to 10 min post-injection.
Figure 9.
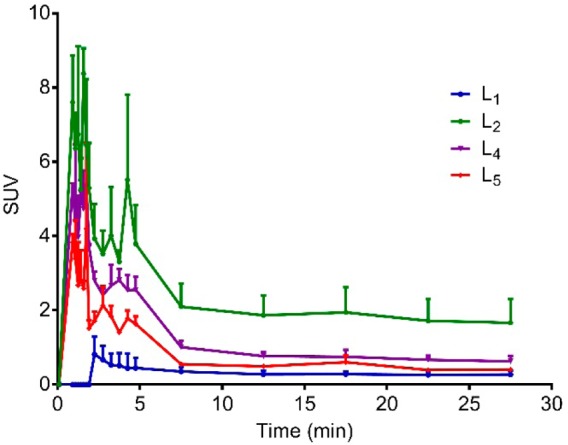
Maximum standard uptake value (SUV) time-activity curves confirming tracer accumulation of 64Cu-radiolabeled L1, L2, L4, and L5 in the brains of Tg2576 transgenic mice (n = 3).
Post-PET Biodistribution with Tg2576 Transgenic Mice
After the 30 min PET dynamic scans and 20 min CT scans, the mice were euthanized and subjected to biodistribution studies. The brain uptake values are shown in Figure 10a, and they correlate well with the end stage (20–30 min post-injection) standard uptake values from the PET imaging studies (Figure 10b). Indeed, 64Cu-L2 shows the highest brain uptake of 0.57 ± 0.05%ID/g in post-PET biodistribution analysis and an SUV of 1.78 ± 0.09 at 20–30 min from PET in vivo imaging. These results further confirm the superior ability of 64Cu-L2 to accumulate in the brain and exhibit a brain uptake that is significantly higher than those of the other radiolabeled BFCs. Overall, these proof-of-concept PET imaging results suggest that the 64Cu-radiolabeled BFCs presented here show an acceptable extent of brain uptake necessary to image Aβ aggregates in vivo. In addition, we expect that further chemical modifications of these first-generation BFCs should lead to compounds with improved physicochemical properties required for increased brain uptake.
Figure 10.
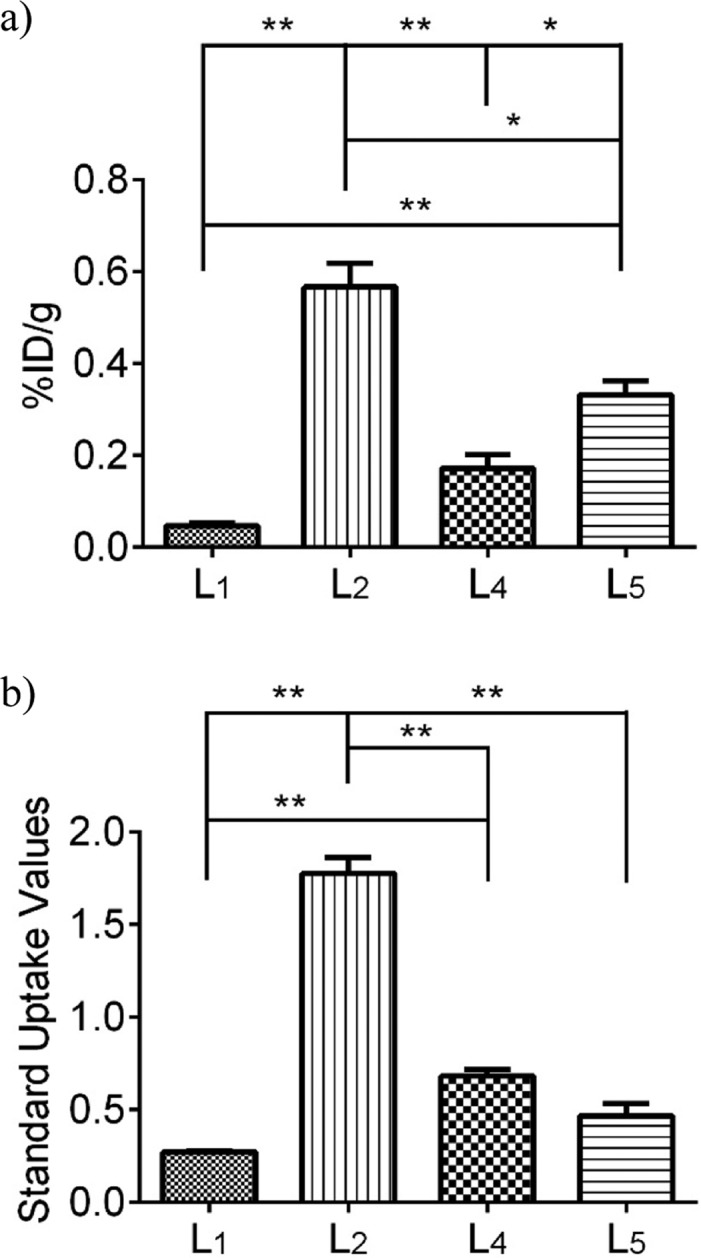
(a) Post-PET biodistribution brain uptakes of 64Cu-L1, -L2, -L4, and -L5 in Tg2576 transgenic mice (n = 3). (b) Maximum standard uptake values (t = 20–30 min post-injection) obtained from dynamic PET imaging. Unpaired t test with Welch’s correction was used; *p < 0.05, **p < 0.01.
Conclusions
Although a few 11C- and 18F-radiolabeled PET imaging agents have been recently approved by the FDA as diagnostic agents for AD, developing novel imaging agents that contain longer-lived radionuclides for noninvasive PET imaging would be advantageous for both diagnostic and drug development purposes. Described here are a series of bifunctional chelators that were designed to contain a strong chelator for 64Cu and also contain an amyloid-interacting molecular fragment. The developed compounds and their Cu complexes were shown to exhibit low nanomolar affinity for Aβ aggregates in vitro as well as specific binding to amyloid plaques in the brain sections of AD transgenic mice. Moreover, these compounds can be readily and quantitatively radiolabeled with 64Cu at mild temperatures, which is an important advantage over other radiosynthetic approaches. The 64Cu-radiolabeled complexes also exhibit specific binding to Aβ aggregates both in vitro and ex vivo in brain sections of AD transgenic mice, suggesting that metal complexation does not dramatically affect the amyloid-binding affinity of these ligands. Most importantly, biodistribution studies have shown that these compounds exhibit promising brain uptake in wild-type mice followed by rapid clearance, whereas initial microPET imaging studies of transgenic AD mice suggest that these compounds could serve as lead compounds for the development of improved diagnostic agents for AD. Current efforts focus on the development of second-generation BFCs with low nanomolar affinity for various Aβ aggregates and increased brain uptake for in vivo PET imaging applications.
Acknowledgments
The authors thank the small animal imaging facilities at Washington University School of Medicine for excellent technical assistance and the Isotope Production Group at Washington University for on time weekly production of 64Cu. N.B. is supported by the DOE Integrated Research Training Program of Excellence in Radiochemistry (DE-SC0002032). L.M.M. acknowledges research funding from NIH (R01GM114588), the Alzheimer’s Association (NIRG 12-259199), Washington University Alzheimer’s Disease Research Center (NIH P50-AG05681), and McDonnell Center for Cellular and Molecular Neurobiology at Washington University School of Medicine.
Supporting Information Available
The Supporting Information is available free of charge on the ACS Publications website at DOI: 10.1021/jacs.7b05937.
Fluorescence binding assays, HPLC chromatograms of radiolabeling assays, and fused PET/CT scans (PDF)
Author Contributions
¶ N.B. and A.K.S. contributed equally to this work.
The authors declare no competing financial interest.
Supplementary Material
References
- Citron M. Nat. Rev. Drug Discovery 2010, 9, 387. 10.1038/nrd2896. [DOI] [PubMed] [Google Scholar]
- Perrin R. J.; Fagan A. M.; Holtzman D. M. Nature 2009, 461, 916. 10.1038/nature08538. [DOI] [PMC free article] [PubMed] [Google Scholar]
- LaFerla F. M.; Green K. N.; Oddo S. Nat. Rev. Neurosci. 2007, 8, 499. 10.1038/nrn2168. [DOI] [PubMed] [Google Scholar]
- Musiek E. S.; Holtzman D. M. Nat. Neurosci. 2015, 18, 800. 10.1038/nn.4018. [DOI] [PMC free article] [PubMed] [Google Scholar]
- Ising C.; Stanley M.; Holtzman D. M. Clin. Pharmacol. Ther. 2015, 98, 469. 10.1002/cpt.200. [DOI] [PubMed] [Google Scholar]
- Hardy J.; Selkoe D. J. Science 2002, 297, 353. 10.1126/science.1072994. [DOI] [PubMed] [Google Scholar]
- Bush A. I. Curr. Opin. Chem. Biol. 2000, 4, 184. 10.1016/S1367-5931(99)00073-3. [DOI] [PubMed] [Google Scholar]
- Gong Y. S.; Chang L.; Viola K. L.; Lacor P. N.; Lambert M. P.; Finch C. E.; Krafft G. A.; Klein W. L. Proc. Natl. Acad. Sci. U. S. A. 2003, 100, 10417. 10.1073/pnas.1834302100. [DOI] [PMC free article] [PubMed] [Google Scholar]
- Lesne S.; Koh M. T.; Kotilinek L.; Kayed R.; Glabe C. G.; Yang A.; Gallagher M.; Ashe K. H. Nature 2006, 440, 352. 10.1038/nature04533. [DOI] [PubMed] [Google Scholar]
- Klein W. L.; Krafft G. A.; Finch C. E. Trends Neurosci. 2001, 24, 219. 10.1016/S0166-2236(00)01749-5. [DOI] [PubMed] [Google Scholar]
- Walsh D. M.; Selkoe D. J. J. Neurochem. 2007, 101, 1172. 10.1111/j.1471-4159.2006.04426.x. [DOI] [PubMed] [Google Scholar]
- Klunk W. E.; Engler H.; Nordberg A.; Wang Y. M.; Blomqvist G.; Holt D. P.; Bergstrom M.; Savitcheva I.; Huang G. F.; Estrada S.; Ausen B.; Debnath M. L.; Barletta J.; Price J. C.; Sandell J.; Lopresti B. J.; Wall A.; Koivisto P.; Antoni G.; Mathis C. A.; Langstrom B. Ann. Neurol. 2004, 55, 306. 10.1002/ana.20009. [DOI] [PubMed] [Google Scholar]
- Nordberg A. Curr. Opin. Neurol. 2007, 20, 398. 10.1097/WCO.0b013e3281a47744. [DOI] [PubMed] [Google Scholar]
- Archer H. A.; Edison P.; Brooks D. J.; Barnes J.; Frost C.; Yeatman T.; Fox N. C.; Rossor M. N. Ann. Neurol. 2006, 60, 145. 10.1002/ana.20889. [DOI] [PubMed] [Google Scholar]
- Kemppainen N. M.; Aalto S.; Wilson I. A.; Nagren K.; Helin S.; Bruck A.; Oikonen V.; Kailajarvi M.; Scheinin M.; Viitanen M.; Parkkola R.; Rinne J. O. Neurology 2006, 67, 1575. 10.1212/01.wnl.0000240117.55680.0a. [DOI] [PubMed] [Google Scholar]
- Mintun M. A.; Larossa G. N.; Sheline Y. I.; Dence C. S.; Lee S. Y.; Mach R. H.; Klunk W. E.; Mathis C. A.; DeKosky S. T.; Morris J. C. Neurology 2006, 67, 446. 10.1212/01.wnl.0000228230.26044.a4. [DOI] [PubMed] [Google Scholar]
- Engler H.; Forsberg A.; Almkvist O.; Blomquist G.; Larsson E.; Savitcheva I.; Wall A.; Ringheim A.; Langstrom B.; Nordberg A. Brain 2006, 129, 2856. 10.1093/brain/awl178. [DOI] [PubMed] [Google Scholar]
- Choi S. R.; Golding G.; Zhuang Z.; Zhang W.; Lim N.; Hefti F.; Benedum T. E.; Kilbourn M. R.; Skovronsky D.; Kung H. F. J. Nucl. Med. 2009, 50, 1887. 10.2967/jnumed.109.065284. [DOI] [PMC free article] [PubMed] [Google Scholar]
- Wong D. F.; Rosenberg P. B.; Zhou Y.; Kumar A.; Raymont V.; Ravert H. T.; Dannals R. F.; Nandi A.; Brasic J. R.; Ye W.; Hilton J.; Lyketsos C.; Kung H. F.; Joshi A. D.; Skovronsky D. M.; Pontecorvo M. J. J. Nucl. Med. 2010, 51, 913. 10.2967/jnumed.109.069088. [DOI] [PMC free article] [PubMed] [Google Scholar]
- Clark C. M.; Schneider J. A.; Bedell B. J.; Beach T. G.; Bilker W. B.; Mintun M. A.; Pontecorvo M. J.; Hefti F.; Carpenter A. P.; Flitter M. L.; Krautkramer M. J.; Kung H. F.; Coleman R. E.; Doraiswamy P. M.; Fleisher A. S.; Sabbagh M. N.; Sadowsky C. H.; Reiman E. P.; Zehntner S. P.; Skovronsky D. M.; Group A. A. S. J. Am. Med. Soc. 2011, 305, 275. [DOI] [PMC free article] [PubMed] [Google Scholar]
- Maheshwari V.; Dearling J. L. J.; Treves S. T.; Packard A. B. Inorg. Chim. Acta 2012, 393, 318. 10.1016/j.ica.2012.07.012. [DOI] [Google Scholar]
- Wadas T. J.; Wong E. H.; Weisman G. R.; Anderson C. J. Curr. Pharm. Des. 2007, 13, 3. 10.2174/138161207779313768. [DOI] [PubMed] [Google Scholar]
- Sin I.; Kang C. S.; Bandara N.; Sun X.; Zhong Y. L.; Rogers B. E.; Chong H. S. Bioorg. Med. Chem. 2014, 22, 2553. 10.1016/j.bmc.2014.02.041. [DOI] [PMC free article] [PubMed] [Google Scholar]
- Voss S. D.; Smith S. V.; DiBartolo N.; McIntosh L. J.; Cyr E. M.; Bonab A. A.; Dearling J. L. J.; Carter E. A.; Fischman A. J.; Treves S. T.; Gillies S. D.; Sargeson A. M.; Huston J. S.; Packard A. B. Proc. Natl. Acad. Sci. U. S. A. 2007, 104, 17489. 10.1073/pnas.0708436104. [DOI] [PMC free article] [PubMed] [Google Scholar]
- Anderson C. J.; Ferdani R. Cancer Biother. Radiopharm. 2009, 24, 379. 10.1089/cbr.2009.0674. [DOI] [PMC free article] [PubMed] [Google Scholar]
- Sun X.; Wuest M.; Weisman G. R.; Wong E. H.; Reed D. P.; Boswell C. A.; Motekaitis R.; Martell A. E.; Welch M. J.; Anderson C. J. J. Med. Chem. 2002, 45, 469. 10.1021/jm0103817. [DOI] [PubMed] [Google Scholar]
- Boswell C. A.; Sun X.; Niu W.; Weisman G. R.; Wong E. H.; Rheingold A. L.; Anderson C. J. J. Med. Chem. 2004, 47, 1465. 10.1021/jm030383m. [DOI] [PubMed] [Google Scholar]
- Wong E. H.; Weisman G. R.; Hill D. C.; Reed D. P.; Rogers M. E.; Condon J. S.; Fagan M. A.; Calabrese J. C.; Lam K.-C.; Guzei I. A.; Rheingold A. L. J. Am. Chem. Soc. 2000, 122, 10561. 10.1021/ja001295j. [DOI] [Google Scholar]
- Ferdani R.; Stigers D. J.; Fiamengo A. L.; Wei L.; Li B. T. Y.; Golen J. A.; Rheingold A. L.; Weisman G. R.; Wong E. H.; Anderson C. J. Dalton Trans. 2012, 41, 1938. 10.1039/C1DT11743B. [DOI] [PMC free article] [PubMed] [Google Scholar]
- Esteves C. V.; Lamosa P.; Delgado R.; Costa J.; Désogère P.; Rousselin Y.; Goze C.; Denat F. Inorg. Chem. 2013, 52, 5138. 10.1021/ic400015v. [DOI] [PubMed] [Google Scholar]
- Roger M.; Lima L. M. P.; Frindel M.; Platas-Iglesias C.; Gestin J.-F.; Delgado R.; Patinec V.; Tripier R. Inorg. Chem. 2013, 52, 5246. 10.1021/ic400174r. [DOI] [PubMed] [Google Scholar]
- Comba P.; Hunoldt S.; Morgen M.; Pietzsch J.; Stephan H.; Wadepohl H. Inorg. Chem. 2013, 52, 8131. 10.1021/ic4008685. [DOI] [PubMed] [Google Scholar]
- Bartholomä M. D. Inorg. Chim. Acta 2012, 389, 36. 10.1016/j.ica.2012.01.061. [DOI] [Google Scholar]
- Ratnakar S. J.; Viswanathan S.; Kovacs Z.; Jindal A. K.; Green K. N.; Sherry A. D. J. Am. Chem. Soc. 2012, 134, 5798. 10.1021/ja211601k. [DOI] [PMC free article] [PubMed] [Google Scholar]
- Rojas-Quijano F. A.; Tircsó G.; Tircsóné Benyó E.; Baranyai Z.; Tran Hoang H.; Kálmán F. K.; Gulaka P. K.; Kodibagkar V. D.; Aime S.; Kovács Z.; Sherry A. D. Chem. - Eur. J. 2012, 18, 9669. 10.1002/chem.201200266. [DOI] [PMC free article] [PubMed] [Google Scholar]
- Green K. N.; Viswanathan S.; Rojas-Quijano F. A.; Kovacs Z.; Sherry A. D. Inorg. Chem. 2011, 50, 1648. 10.1021/ic101856d. [DOI] [PMC free article] [PubMed] [Google Scholar]
- Carney C. E.; Tran A. D.; Wang J.; Schabel M. C.; Sherry A. D.; Woods M. Chem. - Eur. J. 2011, 17, 10372. 10.1002/chem.201101007. [DOI] [PMC free article] [PubMed] [Google Scholar]
- Varasteh Z.; Velikyan I.; Lindeberg G.; Sörensen J.; Larhed M.; Sandström M.; Selvaraju R. K.; Malmberg J.; Tolmachev V.; Orlova A. Bioconjugate Chem. 2013, 24, 1144. 10.1021/bc300659k. [DOI] [PubMed] [Google Scholar]
- Chang A. J.; Sohn R.; Lu Z. H.; Arbeit J. M.; Lapi S. E. PLoS One 2013, 8, 1. 10.1371/journal.pone.0058949. [DOI] [PMC free article] [PubMed] [Google Scholar]
- Ferreira C. L.; Bayly S. R.; Green D. E.; Storr T.; Barta C. A.; Steele J.; Adam M. J.; Orvig C. Bioconjugate Chem. 2006, 17, 1321. 10.1021/bc060085e. [DOI] [PubMed] [Google Scholar]
- Ferreira C. L.; Yapp D. T. T.; Mandel D.; Gill R. K.; Boros E.; Wong M. Q.; Jurek P.; Kiefer G. E. Bioconjugate Chem. 2012, 23, 2239. 10.1021/bc300348d. [DOI] [PubMed] [Google Scholar]
- Bailey G. A.; Price E. W.; Zeglis B. M.; Ferreira C. L.; Boros E.; Lacasse M. J.; Patrick B. O.; Lewis J. S.; Adam M. J.; Orvig C. Inorg. Chem. 2012, 51, 12575. 10.1021/ic302225z. [DOI] [PMC free article] [PubMed] [Google Scholar]
- Boros E.; Cawthray J. F.; Ferreira C. L.; Patrick B. O.; Adam M. J.; Orvig C. Inorg. Chem. 2012, 51, 6279. 10.1021/ic300482x. [DOI] [PubMed] [Google Scholar]
- Sharma A. K.; Pavlova S. T.; Kim J.; Finkelstein D.; Hawco N. J.; Rath N. P.; Kim J.; Mirica L. M. J. Am. Chem. Soc. 2012, 134, 6625. 10.1021/ja210588m. [DOI] [PMC free article] [PubMed] [Google Scholar]
- Kim W. D.; Hrncir D. C.; Kiefer G. E.; Sherry A. D. Inorg. Chem. 1995, 34, 2225. 10.1021/ic00112a040. [DOI] [Google Scholar]
- Kim W. D.; Kiefer G. E.; Maton F.; McMillan K.; Muller R. N.; Sherry A. D. Inorg. Chem. 1995, 34, 2233. 10.1021/ic00112a041. [DOI] [Google Scholar]
- Klein W. L. Neurochem. Int. 2002, 41, 345. 10.1016/S0197-0186(02)00050-5. [DOI] [PubMed] [Google Scholar]
- Han B. H.; Zhou M. L.; Vellimana A. K.; Milner E.; Kim D. H.; Greenberg J. K.; Chu W. H.; Mach R. H.; Zipfel G. J. Mol. Neurodegener. 2011, 6, 86. 10.1186/1750-1326-6-86. [DOI] [PMC free article] [PubMed] [Google Scholar]
- Han B. H.; Zhou M. L.; Abousaleh F.; Brendza R. P.; Dietrich H. H.; Koenigsknecht-Talboo J.; Cirrito J. R.; Milner E.; Holtzman D. M.; Zipfel G. J. J. Neurosci. 2008, 28, 13542. 10.1523/JNEUROSCI.4686-08.2008. [DOI] [PMC free article] [PubMed] [Google Scholar]
- McCarthy D. W.; Shefer R. E.; Klinkowstein R. E.; Bass L. A.; Margeneau W. H.; Cutler C. S.; Anderson C. J.; Welch M. J. Nucl. Med. Biol. 1997, 24, 35. 10.1016/S0969-8051(96)00157-6. [DOI] [PubMed] [Google Scholar]
- Kume M.; Carey P. C.; Gaehle G.; Madrid E.; Voller T.; Margenau W.; Welch M. J.; Lapi S. E. Appl. Radiat. Isot. 2012, 70, 1803. 10.1016/j.apradiso.2012.03.009. [DOI] [PubMed] [Google Scholar]
- Yona R. L.; Mazeres S.; Faller P.; Gras E. ChemMedChem 2008, 3, 63. 10.1002/cmdc.200700188. [DOI] [PubMed] [Google Scholar]
- Sharma A. K.; Kim J.; Hawco N. J.; Rath N. P.; Kim J.; Mirica L. M. Inorg. Chem. 2014, 53, 11367. 10.1021/ic500926c. [DOI] [PMC free article] [PubMed] [Google Scholar]
- Mashraqui S. H.; Kumar S.; Vashi D. J. Inclusion Phenom. Mol. Recognit. Chem. 2004, 48, 125. 10.1023/B:JIPH.0000022531.17974.fb. [DOI] [Google Scholar]
- The detailed synthesis and characterization of these BFCs and their coordination chemistry has been reported elsewhere:Sharma A. K.; Schultz J. W.; Prior J. T.; Rath N. P.; Mirica L. M.. Inorg. Chem., submitted. [Google Scholar]; See also:; Mirica L. M.; Sharma A. K.; Schultz J. W.. Metal-Binding Bifunctional Compounds as Diagnostic Agents for Alzheimer's Disease. U.S. Patent 20150209452 A1, July 30, 2015.
- Necula M.; Kayed R.; Milton S.; Glabe C. G. J. Biol. Chem. 2007, 282, 10311. 10.1074/jbc.M608207200. [DOI] [PubMed] [Google Scholar]
- LeVine H. 3rd Methods Enzymol. 1999, 309, 274. 10.1016/S0076-6879(99)09020-5. [DOI] [PubMed] [Google Scholar]
- Klunk W. E.; Wang Y. M.; Huang G. F.; Debnath M. L.; Holt D. P.; Mathis C. A. Life Sci. 2001, 69, 1471. 10.1016/S0024-3205(01)01232-2. [DOI] [PubMed] [Google Scholar]
- Lockhart A.; Ye L.; Judd D. B.; Merritt A. T.; Lowe P. N.; Morgenstern J. L.; Hong G. Z.; Gee A. D.; Brown J. J. Biol. Chem. 2005, 280, 7677. 10.1074/jbc.M412056200. [DOI] [PubMed] [Google Scholar]
- Sharma A. K.; Pavlova S. T.; Kim J.; Kim J.; Mirica L. M. Metallomics 2013, 5, 1529. 10.1039/c3mt00161j. [DOI] [PMC free article] [PubMed] [Google Scholar]
- Rodriguez-Rodriguez C.; de Groot N. S.; Rimola A.; Alvarez-Larena A.; Lloveras V.; Vidal-Gancedo J.; Ventura S.; Vendrell J.; Sodupe M.; Gonzalez-Duarte P. J. Am. Chem. Soc. 2009, 131, 1436. 10.1021/ja806062g. [DOI] [PubMed] [Google Scholar]
- Oakley H.; Cole S. L.; Logan S.; Maus E.; Shao P.; Craft J.; Guillozet-Bongaarts A.; Ohno M.; Disterhoft J.; Van Eldik L.; Berry R.; Vassar R. J. Neurosci. 2006, 26, 10129. 10.1523/JNEUROSCI.1202-06.2006. [DOI] [PMC free article] [PubMed] [Google Scholar]
- Price J. L.; McKeel D. W.; Buckles V. D.; Roe C. M.; Xiong C. J.; Grundman M.; Hansen L. A.; Petersen R. C.; Parisi J. E.; Dickson D. W.; Smith C. D.; Davis D. G.; Schmitt F. A.; Markesbery W. R.; Kaye J. F.; Kurlan R.; Hulette C.; Kurland B. F.; Higdon R.; Kukull W.; Morris J. C. Neurobiol. Aging 2009, 30, 1026. 10.1016/j.neurobiolaging.2009.04.002. [DOI] [PMC free article] [PubMed] [Google Scholar]
- Fodero-Tavoletti M. T.; Villemagne V. L.; Paterson B. M.; White A. R.; Li Q. X.; Camakaris J.; O’Keefe G. J.; Cappai R.; Barnham K. J.; Donnelly P. S. J. Alzheimer's Dis. 2010, 20, 49. 10.3233/JAD-2010-1359. [DOI] [PubMed] [Google Scholar]
- Lim S.; Paterson B. M.; Fodero-Tavoletti M. T.; O’Keefe G. J.; Cappai R.; Barnham K. J.; Villemagne V. L.; Donnelly P. S. Chem. Commun. 2010, 46, 5437. 10.1039/c0cc01175d. [DOI] [PubMed] [Google Scholar]
- Hickey J. L.; Lim S.; Hayne D. J.; Paterson B. M.; White J. M.; Villemagne V. L.; Roselt P.; Binns D.; Cullinane C.; Jeffery C. M.; Price R. I.; Barnham K. J.; Donnelly P. S. J. Am. Chem. Soc. 2013, 135, 16120. 10.1021/ja4057807. [DOI] [PubMed] [Google Scholar]
- Storr T.; Merkel M.; Song-Zhao G. X.; Scott L. E.; Green D. E.; Bowen M. L.; Thompson K. H.; Patrick B. O.; Schugar H. J.; Orvig C. J. Am. Chem. Soc. 2007, 129, 7453. 10.1021/ja068965r. [DOI] [PubMed] [Google Scholar]
- See Supporting Information.
- Scott L. E.; Orvig C. Chem. Rev. 2009, 109, 4885. 10.1021/cr9000176. [DOI] [PubMed] [Google Scholar]
- Lipinski C. A.; Lombardo F.; Dominy B. W.; Feeney P. J. Adv. Drug Delivery Rev. 2001, 46, 3. 10.1016/S0169-409X(00)00129-0. [DOI] [PubMed] [Google Scholar]
- Dishino D. D.; Welch M. J.; Kilbourn M. R.; Raichle M. E. J. Nucl. Med. 1983, 24, 1030. [PubMed] [Google Scholar]
- De Silva R. A.; Jain S.; Lears K. A.; Chong H. S.; Kang C. S.; Sun X.; Rogers B. E. Nucl. Med. Biol. 2012, 39, 1099. 10.1016/j.nucmedbio.2012.05.009. [DOI] [PMC free article] [PubMed] [Google Scholar]
Associated Data
This section collects any data citations, data availability statements, or supplementary materials included in this article.


