Warner et al. show that knock-in mice expressing a human disease–associated STING mutation spontaneously develop inflammatory lung and skin disease, hypercytokinemia, and T cell cytopenia, which occurs independently of IRF3.
Abstract
Patients with stimulator of interferon genes (STING)–associated vasculopathy with onset in infancy (SAVI) develop systemic inflammation characterized by vasculopathy, interstitial lung disease, ulcerative skin lesions, and premature death. Autosomal dominant mutations in STING are thought to trigger activation of IRF3 and subsequent up-regulation of interferon (IFN)-stimulated genes (ISGs) in patients with SAVI. We generated heterozygous STING N153S knock-in mice as a model of SAVI. These mice spontaneously developed inflammation within the lung, hypercytokinemia, T cell cytopenia, skin ulcerations, and premature death. Cytometry by time-of-flight (CyTOF) analysis revealed that the STING N153S mutation caused myeloid cell expansion, T cell cytopenia, and dysregulation of immune cell signaling. Unexpectedly, we observed only mild up-regulation of ISGs in STING N153S fibroblasts and splenocytes and STING N154S SAVI patient fibroblasts. STING N153S mice lacking IRF3 also developed lung disease, myeloid cell expansion, and T cell cytopenia. Thus, the SAVI-associated STING N153S mutation triggers IRF3-independent immune cell dysregulation and lung disease in mice.
Introduction
Stimulator of type I IFN genes (TMEM173; STING) is a cytosolic nucleic acid sensor that plays a critical role in the cell-intrinsic innate immune response to microbial DNA and cyclic dinucleotides, as well as to aberrant host DNA (Stetson, 2012; Gao et al., 2013; Li et al., 2016). Genetic deletion of STING in mice results in impaired immunity to a variety of pathogens including bacteria and viruses (Ishikawa et al., 2009; Schoggins et al., 2014; Parker et al., 2015). In humans, several autosomal dominant de novo or inherited mutations in STING have been reported in STING-associated vasculopathy with onset in infancy (SAVI) and patients with familial chilblain lupus (Jeremiah et al., 2014; Liu et al., 2014; Picard et al., 2016; König et al., 2017). One of the most frequently found SAVI mutations is STING N154S (N153S in mouse orthologue), a mutation that is thought to constitutively activate IRF3 to induce transcription of IFN-β and IFN-stimulated genes (ISGs; Liu et al., 2014). SAVI patients with the STING N154S mutation develop systemic inflammatory disease characterized by vasculopathic lesions that affect the lung and skin (Liu et al., 2014). The resulting clinical syndrome includes interstitial lung disease, ulcerative skin lesions, digital ischemia, and T cell cytopenia (Liu et al., 2014; Picard et al., 2016).
STING resides on the ER and is activated by cGAMP, a cyclic dinucleotide second messenger that is produced by cGAMP synthase (cGAS) upon detection of cytosolic host or microbial DNA (Stetson, 2012; Schoggins et al., 2014; West et al., 2015; Li et al., 2016). Binding of cGAMP to STING triggers a conformational change in the STING C terminus (Ouyang et al., 2012) and subsequent ER-to-vesicle trafficking (Dobbs et al., 2015), which activates downstream effectors including TANK-binding kinase 1 (TBK1; Tanaka and Chen, 2012) and IκB kinase (Ishikawa and Barber, 2008). TBK1 phosphorylates IRF3, which leads to IRF3 translocation into the nucleus and transcriptional activation of IFN-β and ISGs (Li et al., 2016; Wang et al., 2016). Activation of the type I IFN response via IRF3 is thought to be the driving force behind SAVI disease pathogenesis (Liu et al., 2014), although this hypothesis was not previously tested experimentally in an animal model of the disease. Interestingly, one recent study provided evidence that abnormalities in T cell proliferation in human patients with SAVI occur independently of any interaction with TBK1 and IRF3 (Cerboni et al., 2017). Thus, there is a need for models of SAVI that will allow in vivo testing of previously hypothesized mechanisms of disease pathogenesis, beyond cell culture studies of IRF3 activation. Here, we describe the generation of STING N153S knock-in mice as a model of SAVI. Like SAVI patients, the mice developed T cell cytopenia, myeloid cell expansion, and spontaneous pulmonary inflammation, which occurred independently of IRF3 in mice.
Results
STING N153S mice develop spontaneous lung and skin disease, causing premature death
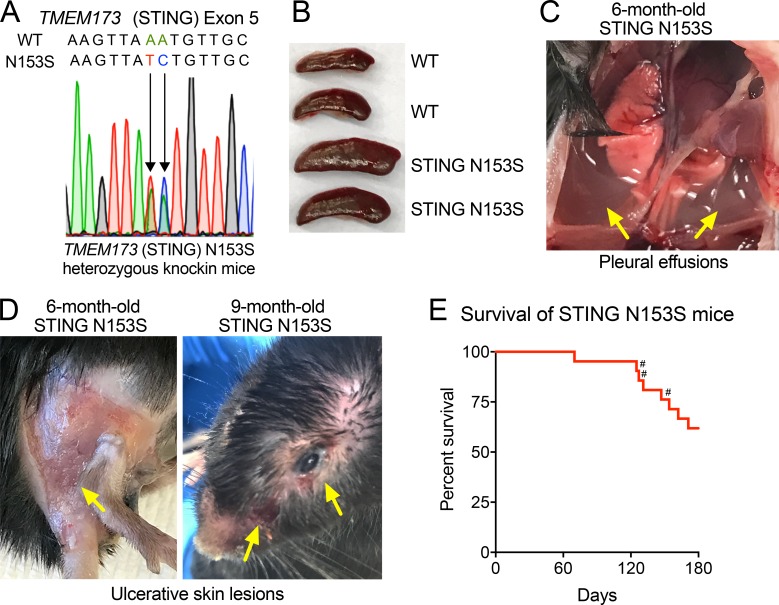
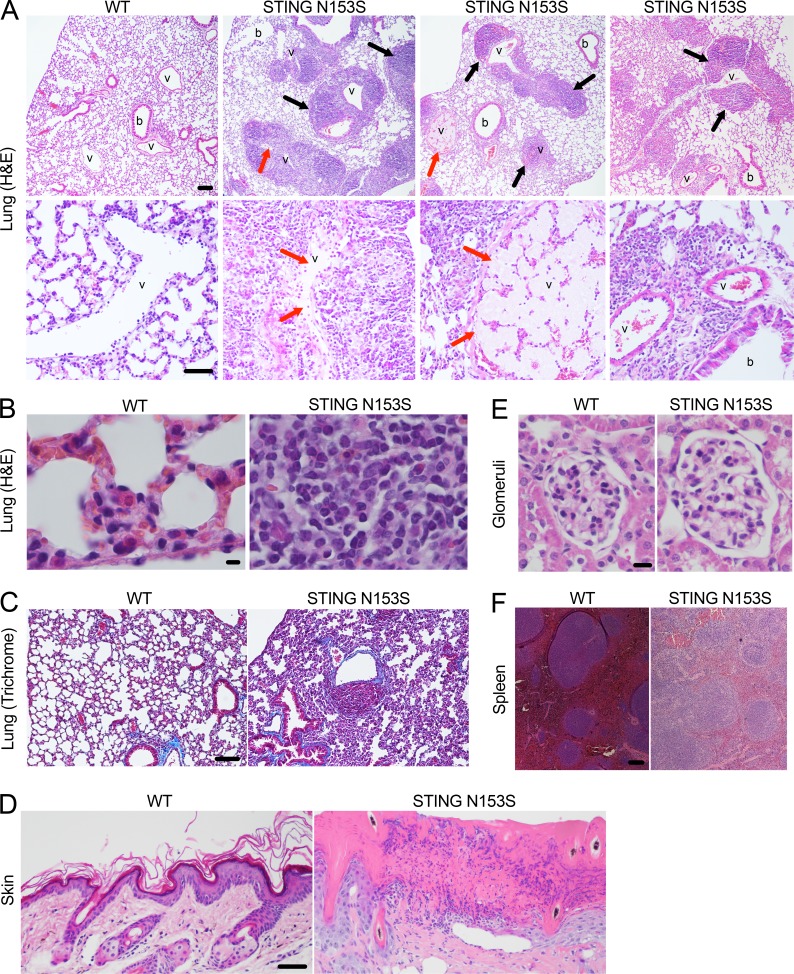
The original description of SAVI found that four of six patients had the STING N154S mutation (Liu et al., 2014; N153S in mouse STING), a mutation that we previously confirmed to cause up-regulation of type I IFN in 293T cell assays (Dobbs et al., 2015). Thus, we chose to introduce the STING N153S mutation in mice to produce a model of SAVI. Using CRISPR/Cas9, we generated heterozygous STING N153S mice by introducing a DNA oligonucleotide donor containing a two-nucleotide missense mutation into exon 5 of TMEM173 (STING), which resulted in replacement of asparagine 153 with serine (STING N153S; Fig. 1 A). Homozygous knock-in mice did not survive gestation, whereas adult STING N153S heterozygous animals (STING N153S mice) developed spontaneous disease characterized by splenomegaly (Fig. 1 B), pleural effusions (Fig. 1 C), and ulcerative skin lesions of the extremities of five mice and on the head of one 9-mo-old STING N153S animal (Fig. 1 D). Severe respiratory distress occurred frequently, required euthanasia, and was sometimes observed during late pregnancy in STING N153S dams that were unable to survive labor (Fig. 1 E). Histopathological evaluation of the lung revealed chronic perivascular inflammation with heterogeneous immune cell infiltration (Fig. 2 A, black arrows) and organized thrombosis in pulmonary blood vessels (Fig. 2 A, red arrows). Higher-magnification images (Fig. 2 B) and flow cytometric analysis of immune cells in the lungs of STING N153S mice revealed substantially increased numbers of immune cells (two- to fourfold, P < 0.05), predominantly consisting of CD19+ B cells and CD11b+ myeloid cells, with smaller numbers of CD4+ and CD8+ T cells (Fig. S1). Because SAVI patients frequently develop interstitial lung disease, we performed a histological assessment for pulmonary fibrosis by Gomori trichrome staining of STING N153S lungs, but we found no evidence of pulmonary fibrosis, even in animals that were evaluated at necropsy after spontaneous death caused by respiratory distress (Fig. 2 C). Histopathological assessment of skin lesions revealed mixed immune cell infiltration, ulceration, and scarring (Fig. 2 D). Some features of disease are shared in SAVI and systemic lupus erythematosus (Balada et al., 2016), but unlike many patients with systemic lupus, SAVI patients do not develop glomerulonephritis. Consistent with SAVI in humans, we found no evidence of inflamed or abnormal glomeruli in STING N153S mice (Fig. 2 E). However, histopathological examination of the spleen consistently demonstrated abnormal architecture (Fig. 2 F), suggesting that the STING N153S mutation may trigger immune cell dysregulation in secondary lymphoid organs.
Figure 1.
Spontaneous disease and mortality in STING N153S mice. (A) Electropherogram of WT and STING N153S mutant alleles within exon 5. (B) Spleens from WT littermate control and STING N153S mice. (C) STING N153S mouse lungs with surrounding pleural effusions, indicated by the yellow arrows. (D) Representative skin ulcerations (yellow arrows) on the extremities and head of STING N153S mice. (E) Mortality was assessed in STING N153S male and female mice (n = 21) for 180 d. Three pregnant female mice (#) succumbed to disease. No mortality occurred in WT littermate control animals (n = 20).
Figure 2.
STING N153S mice develop spontaneous perivascular inflammation of the lung. (A) Hematoxylin and eosin (H&E) images of paraffin-embedded lung sections from 4–5-mo-old STING N153S and WT littermate control mice. Pulmonary blood vessels (v) and bronchioles (b) are indicated. Top, black arrows indicate perivascular immune cell infiltrate. Bar, 100 µm. Bottom, red arrows indicate organized thrombosis. Bar, 50 µm. (B) High-magnification H&E images of WT (left) and STING N153S (right) lung sections. Bar, 5 µm. (C) Gomori trichrome staining of WT and STING N153S lung sections. Bar, 100 µm. (D) H&E staining of WT as well as STING N153S skin from the ulcerated skin lesion on a hind limb. Bar, 50 µm. (E) H&E staining of representative STING N153S and WT littermate glomeruli. Bar, 10 µm. (F) H&E staining of WT and STING N153S spleens. Bar, 100 µm. Spleen and kidney histology is representative of n = 3 mice per genotype from three independent experiments. Skin histology is representative of n = 2 mice per genotype. Lung histology is representative of seven mice per genotype from three independent experiments.
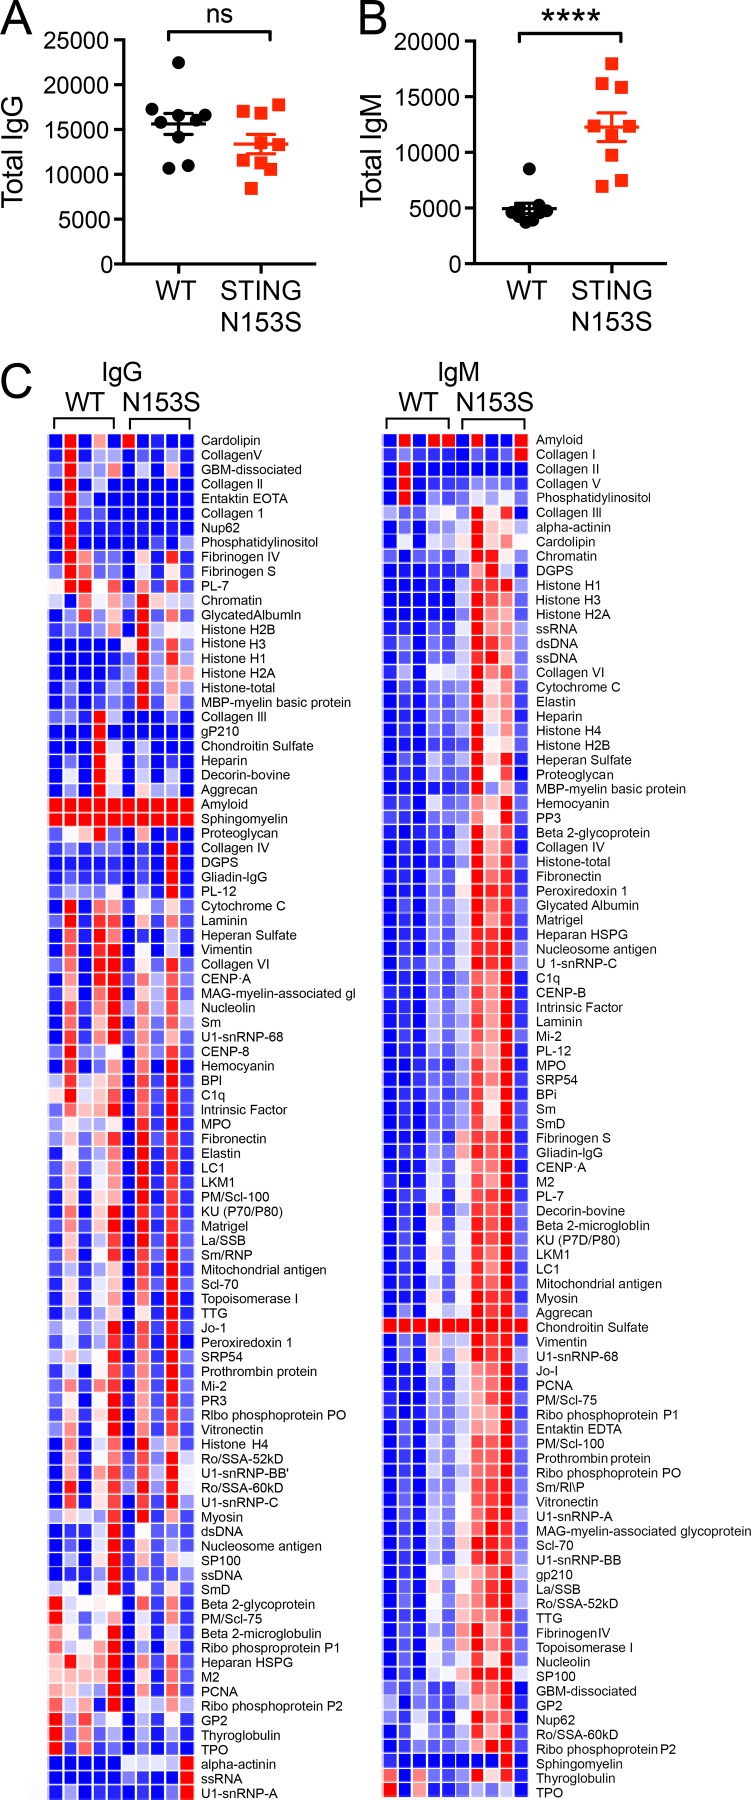
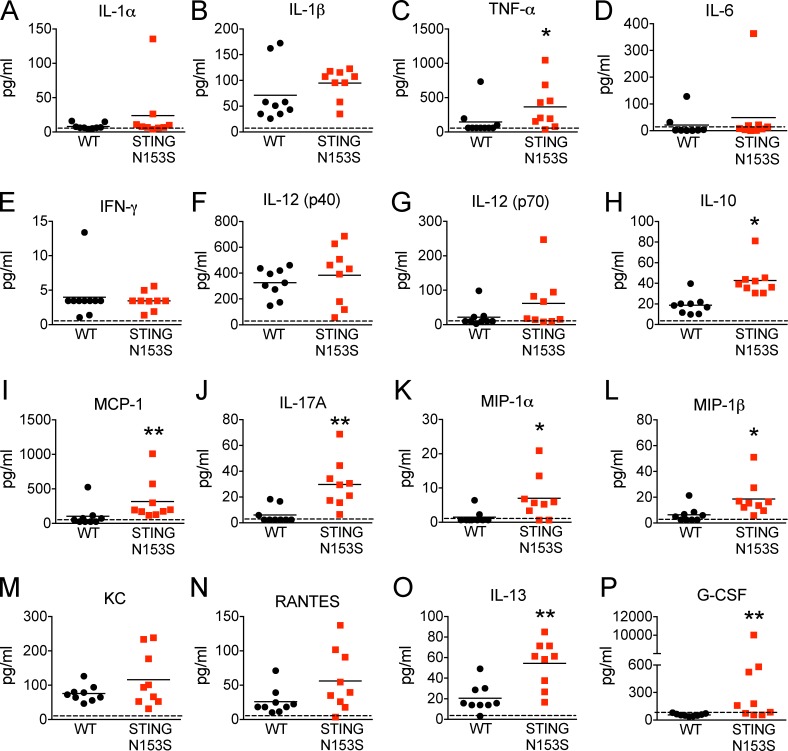
Because some SAVI patients develop autoantibodies (Liu et al., 2014), we quantitated levels of total IgM and IgG antibodies and performed autoantigen array analysis of serum from STING N153S mice and WT littermate control animals. Three of five STING N153S mice produced higher levels of IgM but not IgG autoantibodies compared with WT littermates (Fig. 3). However, all five of the STING N153S mice had severe lung disease, including animals without detectable autoantibodies, suggesting that autoantibodies are not required for disease pathogenesis in mice. A multiplexed cytokine assay performed on the serum of 4–6-mo-old STING N153S mice and WT littermate controls revealed elevated levels of multiple cytokines and chemokines including TNF, IL-17A, IL-13, G-CSF, MIP-1α, MIP-1β, MCP-1, and IL-10 (2–23-fold increase, P < 0.05; Fig. 4). Thus, STING N153S mice develop hypercytokinemia and spontaneous inflammation of the lung and skin.
Figure 3.
Increased IgM autoantibodies in the serum of STING N153S mice. Immunoglobulin analysis of WT and STING N153S mouse serum (n = 9). (A and B) Quantitation of total IgG (A) and total IgM (B). (C) Heat maps of IgG and IgM autoantibodies against autoantigens. n = 9 per genotype. ****, P < 0.0001; ns, not significant. Data are the result of two independent experiments with four to five samples per experiment and were analyzed by Mann–Whitney test. Error bars represent SEM.
Figure 4.
Hypercytokinemia in STING N153S mice. (A–P) Serum was collected from 4–6-mo-old STING N153S and WT littermate control mice, and cytokine and chemokine levels were measured by Bio-Plex assay (n = 9 mice per group). Data represent the mean from two independent experiments. *, P < 0.05; **, P < 0.005 by Mann–Whitney.
The STING N153S mutation causes myeloid cell expansion and cell-intrinsic T cell cytopenia
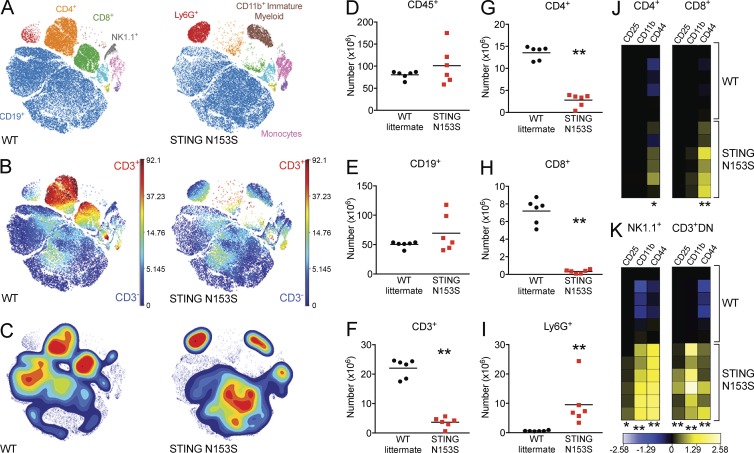
SAVI patients were previously reported to have T cell cytopenia and impaired myeloid cell differentiation (Liu et al., 2014). To begin to characterize immune cells in STING N153S mice, we used cytometry by time-of-flight (CyTOF) to assess immune cell populations in the spleen (Fig. 5). Although we detected no difference in numbers of splenic CD45+ and CD19+ cells in STING N153S mice, there was a deficiency in T cells (22 × 106 CD3+ cells in WT vs. 2.9 × 10⁶ in STING N153S; P < 0.005), which was more severe, and consistently observed, for CD8+ T cells than for CD4+ T cells (Fig. 5, A–C and F–H). Additionally, we observed marked expansion of Ly6G+ myeloid cells (0.6 × 10⁶ in WT vs. 9.5 × 10⁶ in STING N153S; P < 0.005; Fig. 5, A–C and I) and immature myeloid cells (CD11b+cKit+MHCII−; Fig. 5 A). Also, in T and NK cells, activation markers including CD44 were up-regulated (Fig. 5, J and K), which may occur as a direct result of cell-intrinsic STING signaling or may reflect an indirect consequence of chronic hypercytokinemia.
Figure 5.
WT and STING N153S immune cell populations. WT and STING N153S splenocytes were analyzed by CyTOF. (A) viSNE map of WT and STING N153S splenocytes illustrating color-coded cell populations that clustered based on cell surface marker expression. (B) viSNE map indicating the level of CD3 marker expression in immune cell populations defined in A. (C) Density plots of immune cell populations defined in A. (D–I) Total number of CD45+ (D), CD19+ (E), CD3+ (F), CD4+ (G), CD8+ (H), and Ly6G+ (I) cells in WT littermate control and STING N153S splenocytes. Horizontal bars represent the mean of n = 6 samples from two independent experiments. **, P < 0.005 by Mann-Whitney test. (J and K) Heat maps illustrating the calculated arcsinh ratios of median intensities of CD25, CD11b, and CD44 expression in CD4+ (J, left), CD8+ (J, right), NK1.1+ (K, left), and CD3+CD4−CD8− (CD3+DN; K, right) splenocytes. *, P < 0.05; **, P < 0.005 by Mann-Whitney test.
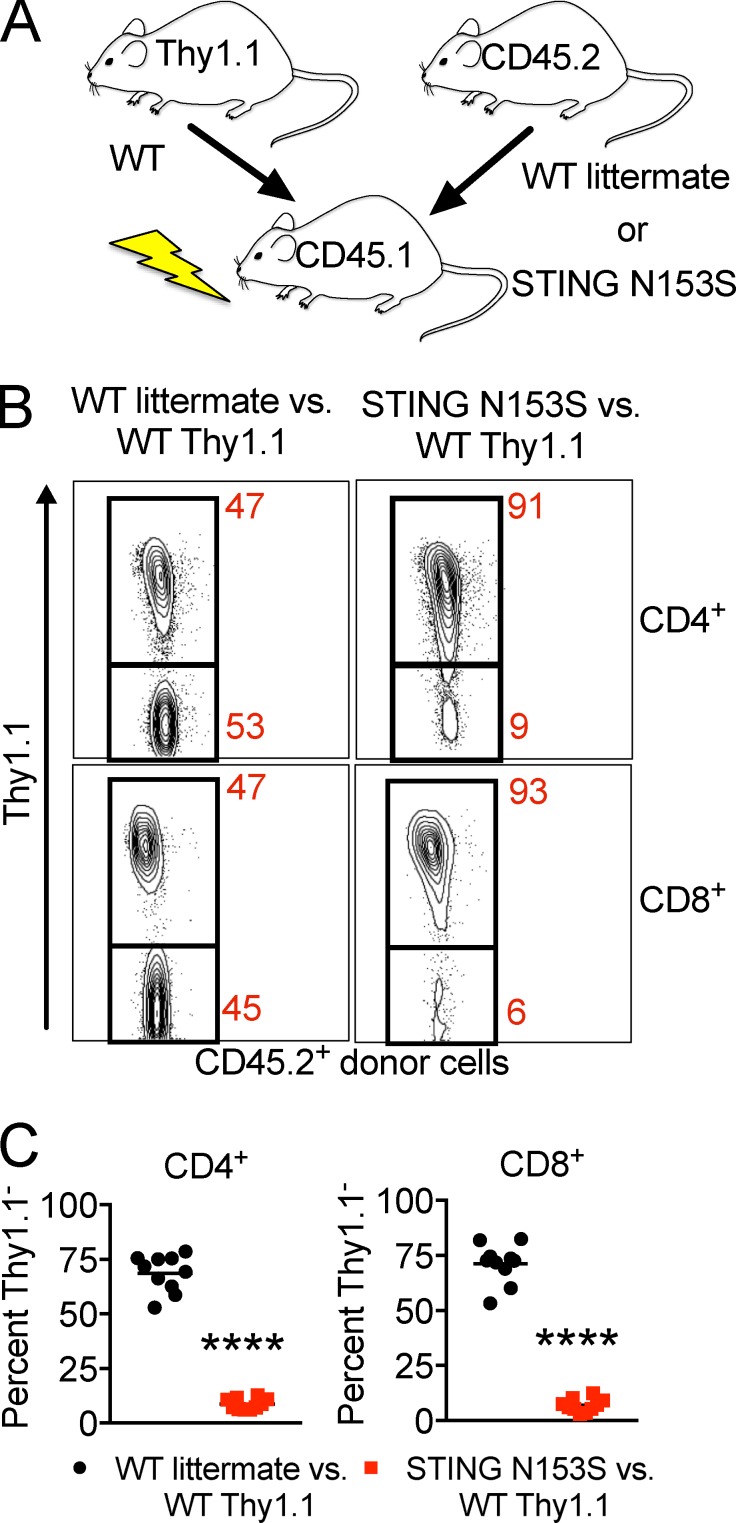
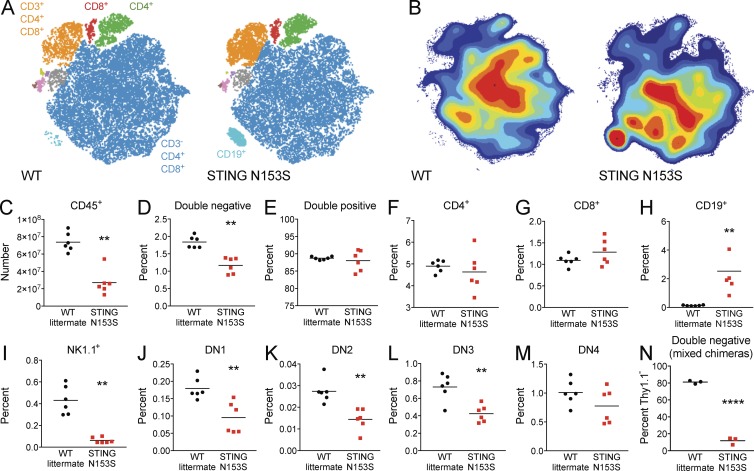
To test whether T cell cytopenia may result from cell-intrinsic effects of the STING N153S mutation, we generated mixed bone marrow chimeras by comparing WT Thy1.1+ versus either WT littermate control or STING N153S marrow transplanted into CD45.1 recipients (Fig. 6 A). In the competition between the Thy1.1+ and STING N153S donors, CD4+ and CD8+ T cells were predominantly generated from WT Thy1.1+ bone marrow, revealing that the STING N153S T cell deficiency is intrinsic to the hematopoietic compartment (Fig. 6, B and C). To further evaluate the cause of splenic T cell deficiency, we performed CyTOF analysis of thymocytes (Fig. 7) and found a decrease in total numbers of thymocytes (2.7-fold in STING N153S compared with WT, P < 0.005), a large increase in the number and percent of thymic B cells (0.13% in WT vs. 2.5% in STING N153S, P < 0.005), and a lower fraction of double-negative T cells (1.8% in WT vs. 1.2% in STING N153S, P < 0.005; Fig. 7). Although diminished in total number, the percentages of individual thymocyte subsets did not suggest a block at any specific stage in T cell development. Evaluation of mixed bone marrow chimeric mice confirmed diminished STING N153S T cell numbers at all stages of development, including at the DN1 stage, consistent with what was observed in mixed chimeric mice (Fig. 7 N). These results suggest that the STING N153S mutation exerts hematopoietic cell-intrinsic deleterious effects on the early stages of thymocyte development. This result also is consistent with prior in vitro studies demonstrating that a different SAVI-associated mutation (STING V155M) caused cell-intrinsic effects in human T cells (Cerboni et al., 2017), although our in vivo findings suggest that T cell cytopenia results mostly from cell-intrinsic effects on early T cell precursors.
Figure 6.
WT and STING N153S mixed bone marrow chimeras. (A) Diagram depicting the approach for generation of WT littermate and STING N153S mixed bone marrow chimeras (n = 10). (B) Representative contour plots of circulating CD4+ (top) and CD8+ (bottom) donor T cells. (C) Percentage of Thy1.1− WT littermate or STING N153S circulating CD4+ and CD8+ cells from mixed bone marrow chimeras. Data represent the mean of samples collected from n = 10 mice from two independent experiments. ****, P < 0.0001 by Mann–Whitney.
Figure 7.
CyTOF analysis of thymocytes from WT and STING N153S mice. Thymocytes were harvested from 4–6-mo-old WT and STING N153S mice and analyzed by CyTOF. (A) viSNE map of representative WT and STING N153S thymocyte populations illustrating color-coded cell populations that were clustered together based on similarity in cell surface marker expression. (B) Contour plots of viSNE maps illustrating the density of cell populations as defined in A. (C–M) The total number of thymocytes was determined. The percentage of thymocytes labeled with each of the respective surface markers was measured by CyTOF and used to calculate the total numbers of CD45+ cells (C). Percentages of other populations are displayed as follows: CD4−CD8− (double negative; D), CD4+CD8+ (double positive; E), CD4+ (F), CD8+ (G), CD19+ (H), NK1.1+(I), CD25−CD44+ (DN1; J), CD25+CD44+ (DN2; K), CD25+CD44− (DN3; L), and CD25−CD44− (DN4; M) cells. (N) Percentage Thy1.1− WT littermate or STING N153S double-negative thymocytes from mixed bone marrow chimeras. Data in C–M represent the mean of samples from n = 6 mice per genotype from two independent experiments analyzed by Mann-Whitney test. **, P < 0.005. Data in N represent the mean of samples from n = 3 bone marrow chimeric mice analyzed by unpaired t test. ****, P < 0.0001.
Activation of STAT and mTORC1 signaling in STING N153S splenocytes
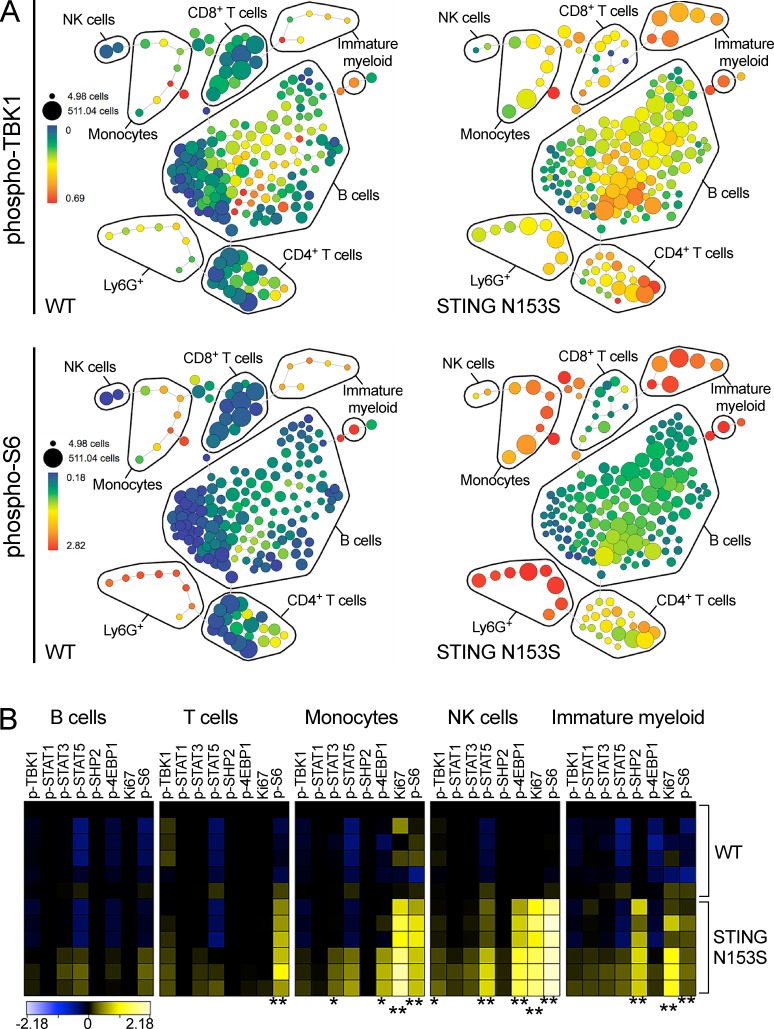
To further investigate the effects of STING N153S on cell signaling, we used CyTOF to assess phosphorylation status of TBK1, STAT1, STAT3, STAT5, SHP2, 4E-BP1, S6, and the presence of Ki67, a marker of cellular proliferation. In STING N153S splenocytes, we observed a pronounced activation of the mTORC1 pathway (phospho-S6 and phospho-4E-BP1) in immune cell subsets known to express STING (monocytes, T cells, NK cells, and cKit+ immature myeloid cells; Liu et al., 2014; Kobayashi et al., 2015) as well as increased activation of STAT3 and STAT5 in monocytes and NK cells, respectively (Fig. 8, A and B). These data suggest that the STING N153S mutation results in activation of mTORC1, STAT3, and STAT5 signaling in specific immune cell subsets that may occur as a result of either cell-intrinsic or -extrinsic effects of the mutation.
Figure 8.
STING N153S mice exhibit altered immune cell signaling. (A and B) Splenocytes were harvested from 4–6-mo-old WT and STING N153S mice and analyzed by CyTOF. (A) Representative SPADE plots of phospho-TBK1 (top) and phospho-S6 (bottom) in WT and STING N153S splenocytes. Size of nodes reflects the cell number, and color reflects transformed median intensities of the phosphoprotein signal. (B) Heat maps depicting calculated arcsinh ratios of median intensities of phosphoprotein signal in WT and STING N153S splenocytes. Data were pooled from two independent experiments with n = 6 mice. *, P < 0.05; **, P < 0.005 by Mann–Whitney test.
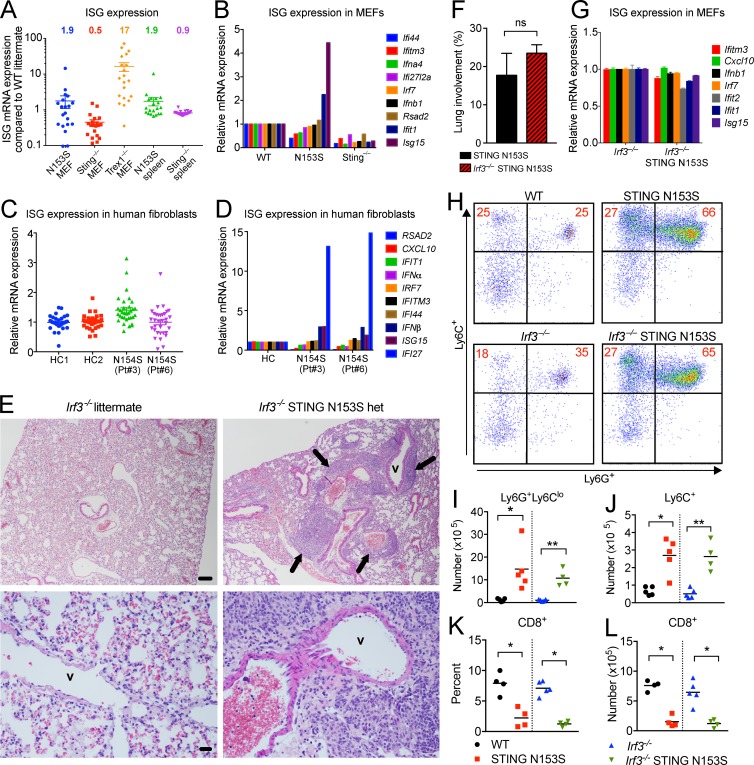
Because SAVI patient PBMCs exhibit a type I IFN gene expression signature (Liu et al., 2014), we examined whether STING N153S mice also up-regulate expression of ISGs. Using RNA-sequencing, and confirmed by quantitative RT-PCR (qRT-PCR), we detected only an approximately twofold up-regulation of ISGs in MEFs and splenocytes compared with WT littermate controls (Fig. 9, A and B), suggesting only mild up-regulation of type I IFN signaling. This ISG signature is much weaker in comparison to Trex1−/− mice, which exhibit constitutive STING activation and an interferonopathy with clinically distinct manifestations of disease (Morita et al., 2004), and in which the majority of ISGs within the same panel were markedly elevated (17-fold compared with WT littermate controls; Fig. 9, A and B). Because Trex1−/− cells accumulate self-DNA that constitutively activates STING through the cGAS-STING-TBK1-IRF3 pathway (Hasan et al., 2013), our results collectively suggest that STING N153S does not cause potent activation of type I IFN signaling in vivo in mice. Next, we decided to correlate our findings with human SAVI patient samples and found that only one of two SAVI patient fibroblasts with the STING N154S mutation exhibited significant up-regulation of ISG expression (Fig. 9, C and D). Similarly, we did not detect enhanced cGAMP-mediated activation of STING in patient cells compared with healthy controls or in STING N153S MEFs compared with WT littermate control MEFs (Fig. S2, A–F), although we observed up-regulation of ISGs in 293T cells that overexpress mouse STING N153S in this study (Fig. S2 G) and also in our prior study comparing human STING N154S and mouse STING N153S in parallel (Dobbs et al., 2015). These findings suggest that the STING mutations may exhibit differential effects in cell lines and in primary cells, or that overexpression produces a more pronounced effect on expression of ISGs.
Figure 9.
STING N153S triggers perivascular pulmonary inflammation, myeloid cell expansion, and T cell cytopenia independently of IRF3. (A) Expression of ISGs in STING N153S, STING knockout (Sting−/−), and Trex1−/− MEFs as well as STING N153S and Sting−/− spleens. Each data point represents a unique ISG as fold increase compared with a WT littermate control. Data were assembled using ISG expression values from RNA-sequencing. (B) qRT-PCR analysis of ISGs in WT, STING N153S, Sting−/− MEFs. mRNA expression is normalized to WT. (C) ISG expression in two healthy control (HC) and SAVI patient skin fibroblasts. Data represent a selection of ISGs assembled from RNA-sequencing. (D) qRT-PCR analysis of ISGs in skin fibroblasts. Data are from two independent experiments with two technical replicates per ISG, normalized to HC. (E) Hematoxylin and eosin images of lungs from Irf3−/− and Irf3−/− STING N153S mice (4–6 mo of age). Pulmonary vessels are indicated (v) with black arrows highlighting perivascular immune cell infiltration. Pulmonary vessels are indicated (v) with arrows. Bar, 100 µm. (F) Quantitation of perivascular lung lesions in STING N153S (n = 7) and Irf3−/− N153S (n = 4) mice. Results in F represent the mean ± SEM of data collected and analyzed in two independent experiments. (G) ISG mRNA expression in Irf3−/− and Irf3−/− N153S MEFs normalized to gene expression in Irf3−/− MEFs. Data represent the mean ± SEM from two independent experiments with n = 3 biological replicates per genotype. (H–J) Representative dot plots (H) and quantification (I and J) of splenic myeloid cell populations from WT, STING N153S, Irf3−/−, and Irf3−/− STING N153S mice. Data represent the mean of two independent experiments with n = 4 or 5 mice per genotype. (K and L) Percentage (K) and total number (L) of CD8+ splenocytes from WT, STING N153S, Irf3−/−, and Irf3−/− STING N153S mice. Data were pooled from two independent experiments with n = 4 or 5 mice per genotype. ns, not significant; *, P < 0.05; **, P < 0.005 by Mann–Whitney test.
SAVI has been postulated to result from STING-mediated activation of IRF3, which potently up-regulates expression of ISGs, so we initially hypothesized that genetic deletion of IRF3 would rescue the mice from disease. To test this hypothesis, we generated Irf3−/− STING N153S mice. Unexpectedly, we observed a similar degree of perivascular immune cell infiltration in Irf3−/− STING N153S mice compared with STING N153S control animals (Fig. 9, E and F). Conversely, Irf3−/− STING N153S MEFs exhibited reduced IFIT1 and ISG15 expression compared with STING N153S MEFs (Fig. 9 G), confirming that IRF3 is required for STING N153S-dependent up-regulation of IFIT1 and ISG15. IRF7 is up-regulated in a positive feedback loop downstream of IRF3 and IFN-β (Marié et al., 1998; Sato et al., 1998), but we did not detect any up-regulation of IRF7 in vivo or in vitro (Fig. 9, A–D).
To determine whether IRF3 is required for STING N153S-mediated myeloid cell expansion and T cell cytopenia, we assessed WT, STING N153S, Irf3−/−, and Irf3−/− STING N153S splenocytes by flow cytometry. We observed similarly increased numbers of Ly6G+ and Ly6C+ myeloid cell populations in Irf3−/− STING N153S mice and STING N153S control animals (Fig. 9, H–J; P > 0.7). Additionally, the percent and absolute number of CD8+ T cells were similarly reduced in splenocytes from Irf3−/− STING N153S and STING N153S mice (Fig. 9, K and L) compared with their respective controls. Thus, lung disease, myeloid cell expansion, and CD8+ T cell cytopenia occur independently of IRF3 signaling in this STING N153S mouse model of SAVI.
Discussion
Our study demonstrates that a SAVI-associated STING mutation causes spontaneous inflammatory lung and skin disease in mice. However, certain features of the disease in mice were distinct from clinical features of SAVI in humans. For example, STING N153S mice did not develop pulmonary fibrosis, and we did not observe a significant type I IFN gene expression signature in mice, which has been reported in humans with SAVI. However, species-specific effects of a disease-causing mutation are not entirely unexpected. For example, humans lacking functional TREX1, which leads to type I IFN production caused by constitutive STING signaling, develop spontaneous brain inflammation (Crow et al., 2006), whereas mice lacking Trex1 develop an interferonopathy with myocarditis (Morita et al., 2004). In contrast to the differential effects of Trex1 mutations in humans and mice, STING N153S mice and SAVI patients have some interesting cross-species similarities, including organ-specific inflammation (e.g., skin and lung disease) as well as T cell cytopenia.
Up-regulation of ISGs occurs in PBMCs of SAVI patients (Liu et al., 2014; Picard et al., 2016), but whether type I IFN plays a causal role in the human disease remains to be determined. Importantly, some of the clinical manifestations of SAVI are distinct from other interferonopathies such as Aicardi-Goutières syndrome, a disease in which the STING pathway is chronically activated because of loss of TREX1 function (Crow and Manel, 2015). One view is that SAVI pathogenesis is mediated by IRF3-induced activation of the type I IFN response (Liu et al., 2014; Kim et al., 2016; Melki et al., 2017), as occurs in other interferonopathies (Crow and Manel, 2015; Kim et al., 2016), but this had not previously been tested experimentally in an animal model with a human disease-causing STING mutation. We observed only mild effects on ISG expression in STING N153S MEFs, and these effects were abolished in the absence of IRF3 (Fig. 9 G), demonstrating that there was indeed some mild IRF3-dependent up-regulation of certain ISGs in MEFs. Additionally, we observed mild up-regulation of ISGs in patient fibroblast cell lines bearing the STING N154S mutation. Our results demonstrate that the STING N153S mutation causes inflammatory lung and skin disease in mice without substantive up-regulation of ISGs in primary cells, without up-regulation of IRF7 in vivo or in vitro, and without IRF3, a major downstream effector thought to promote disease in patients with SAVI. Nevertheless, additional studies in STING N153S mice lacking the type I IFN receptor are still required to completely exclude any contribution of type I IFN in this mouse model of SAVI. Given that IRF3 does not play a role in the disease in mice, it seems plausible that STING mutations in humans also cause disease via other mechanisms and that up-regulation of type I IFN in patient PBMCs might be an epiphenomenon. Alternatively, mechanisms of disease pathogenesis may be entirely distinct in humans with SAVI and the STING N153S mice, with type I IFN playing a more important role in the human disease.
In patients with systemic sclerosis and interstitial lung disease, there is an association between type I IFN and pulmonary fibrosis, suggesting a possible role for type I IFN in fibrosing lung disease (Eloranta et al., 2010). Based on association, pulmonary fibrosis in SAVI patients also may be influenced by type I IFN (Picard et al., 2016). We found that the STING N153S knock-in mice universally developed chronic lung inflammation by age 3–4 mo, but without evidence of fibrosis even in mice that were examined after death from respiratory distress. However, mice older than 6 mo were not assessed. Chronic inflammation may eventually cause fibrosis in older animals that survive longer. Alternatively, the relative absence of a type I IFN gene expression signature in STING N153S mice may be one reason the animals failed to develop fibrosing lung disease.
STING exerts multiple effects on the pathogenesis of autoimmune disease. Aside from its capacity to up-regulate ISGs, the TREX1-cGAS-STING pathway modulates cellular senescence (Yang et al., 2017), adaptive immunity (Fu et al., 2015; Cerboni et al., 2017), and production of proinflammatory cytokines (Abe and Barber, 2014). Paradoxically, STING also limits autoantibody generation and type I IFN production as well as nephritis in lupus-prone mice (Sharma et al., 2015). Furthermore, STING deficiency unexpectedly led to hyperresponsiveness of macrophages to TLR7 and TLR9 ligands (Sharma et al., 2015). Thus, in addition to its effects on type I IFN signaling, the STING N153S mutation is likely to influence multiple cellular and immunological pathways in a variety of ways that also could contribute to disease.
A prior study found that STING regulates T cell proliferation in cell culture independently of IRF3 (Cerboni et al., 2017). Consistent with these previous in vitro findings that used SAVI patient cells with the V155M mutation, we demonstrated that the STING N153S mutation affects T cells in mice in an IRF3-independent manner, and that this was caused by hematopoietic cell-intrinsic effects. In addition to altered proliferation of T cells, our mixed bone marrow chimera studies revealed that STING N153S impacts T cells at the early stages of thymocyte development. Similar to the effects of STING N153S on T cells, myeloid cell expansion in the STING N153S mice also occurred independently of IRF3. Because the STING N153S mice develop immune cell abnormalities resembling those observed in SAVI patients, future therapeutic studies will determine whether WT bone marrow transplantation into STING N153S recipients may protect animals from disease, which may have implications for clinical practice.
In summary, our STING N153S knock-in mouse model demonstrates a role for a human disease–causing mutation in immune cell homeostasis and inflammatory lung and skin disease in mice. This mouse model will serve as an important tool to define mechanisms of STING-induced autoinflammatory disease, including type I IFN-independent effects, in the context of a human disease–causing mutation.
Materials and methods
Design
The goal of our study was to define the disease phenotype of mice heterozygous for the STING N153S mutation. Power analysis was conducted for institutional animal care and use committee–approved in vivo studies to determine the number of animals needed per experimental group. A minimum of two independent in vivo experiments were conducted to replicate findings. No randomization of animals was used for experiments, but WT littermate control animals were used in all studies of STING N153S mice. No outliers were excluded from analyses. There was no blinding with regard to data analyses with the exception of histological analysis, which was carried out in a blinded fashion. The number of technical and biological replicates for each experiment is listed in the figure legends.
Study approvals
Patient fibroblasts were provided by R. Goldbach-Mansky (NIAID, NIH, Bethesda, MD), were de-identified, and were studied under UT Southwestern Medical Center institutional review board approval for de-identified human samples. Animal protocols were approved by the Institutional Animal Care and Use Committees at the Washington University School of Medicine (assurance no. A-3381-01) and UT Southwestern Medical Center (assurance no. APN2011-0081).
Generation of STING N153S knock-in mice
A single guide RNA (sgRNA; 5′-GTTAAATGTTGCCCACGGGCTGG-3′) was designed based on specificity and proximity to the targeted Tmem173 (STING) mutation site. Efficiency of genomic DNA cutting was tested in an in vitro cell line assay as previously described (Parikh et al., 2015). T7 templates for gRNA and WT Cas9 (px330) were prepared by PCR amplification and purified by Qiaquick PCR purification spin columns (Qiagen). RNA synthesis was then performed according to the manufacturer’s protocol using the Megashortscript kit (Thermo Fisher Scientific) and mMESSAGE mMACHINE T7 Ultra kit (Thermo Fisher Scientific), for sgRNA and Cas9 mRNA, respectively. RNA was purified using MEGAclear RNA purification kit (Life Technologies; sgRNA) or by lithium chloride precipitation (Cas9 mRNA) and diluted in nuclease-free injection buffer. A single-stranded oligonucleotide donor (ssODN) encoding the amino acid substitution (N153S) with 99-nucleotide homology arms was synthesized by IDT (Ultramer oligo): 5′-gctttggacatcccccttgaaagtccctcaggcccttctgctgtcttcagAGCTTGACTCCAGC-GGAAGTCTCTGCAGTCTGTGAAGAAAAGAAGTTAtcTGTTGCCCACGGGCTGGCCTGGTCATACTACATTGGGTACTTGCGGTTGATCTTACCAGgtagggcacctctggatgttgatgtgtggacaacaaaacac-3′ (exonic sequence in uppercase, flanking intronic sequence in lowercase, and mutant nucleotides in underlined lowercase). Female C57BL/6N mice, 4 wk of age, were superovulated and mated with C57BL/6N males. Single-cell embryos (embryonic day 0.5 [E0.5]) were isolated and injected with a combination of either 50 ng/μl Cas9, 25 ng/μl gRNA, and 100 ng/μl ssODN or a combination of 25 ng/μl Cas9, 13 ng/μl gRNA, and 100 ng/μl ssODN in DNase/RNase-free microinjection buffer (1 mM Tris and 0.25 mM EDTA, pH 7.4). Over the course of 6 d of microinjection, ∼80–100 modified embryos per day were transferred into E0.5 pseudo-pregnant ICR/CD1 female recipient mice. Two independent founder mice were backcrossed to WT animals for five generations, and WT littermate controls were used for all experiments. Experiments were performed on mice between 12 and 24 wk of age, including equal numbers of mice of both sexes, with matched littermate control animals. Sample sizes were chosen according to our previously published studies. Mice were randomly allocated for all experiments.
Mice
Mice were housed in pathogen-free mouse facilities at the Washington University School of Medicine and UT Southwestern Medical Center and given standard diet and water ad libitum. ICR/CD1 mice were provided by the Hope Transgenic Mouse Core at Washington University in St. Louis. Sting−/− mice were gifts from G. Barber (University of Miami, Miami, FL). The congenic backcrossed Irf3−/− mice (Sato et al., 2000) were gifts of T. Taniguchi (Tokyo, Japan) and provided by colleagues in the United States (I. Rifkin, Boston, MA; K. Fitzgerald, Worcester, MA).
Generation of mixed bone marrow chimeras
Femurs, tibias, and pelvises were dissected from STING N153S, WT littermate controls, and Thy1.1 mice. Bone marrow was flushed from bones, and red blood cells were lysed with ACK lysis buffer. Debris was removed by passing cells through a 70-µM strainer and counted via hemocytometer. WT or STING N153S bone marrow was mixed with Thy1.1 bone marrow at a 1:1 ratio, and a total of 10 × 106 cells were transplanted into CD45.1 hosts via retroorbital i.v. injection. Hosts received two doses of whole-body irradiation (500 rads, total 1,000 rads) 5 h apart, 24 h before transplantation. Chimeras were bled 6 wk after transplantation for FACS analysis of circulating immune cells. Three animals per group were euthanized ∼10 wk after transplantation for analysis of thymocytes.
Antibodies and other reagents
Antibodies used for flow cytometry include the following: FITC–anti-CD19 (rat IgG2a; 1:200, #115506; BioLegend), PE–anti-CD45.1 (mouse [A.SW] IgG2a; 1:100, #110707; BioLegend), PE/Cy7–anti-Thy1.1 (mouse IgG1; 1:100, #202518; BioLegend), BV421–anti-CD4 (rat IgG2b; 1:150, #100438; BioLegend), APC–anti-CD45.2 (mouse [SJL] IgG2a; 1:100, #109813; BioLegend), V500–anti-CD3e (Syrian hamster IgG2; 1:50, #560771; BD Biosciences), FITC–anti-CD25 (rat IgG2b; 1:100, #101907; BioLegend), PerCP/Cy5.5–anti-CD19 (rat IgG2a; 1:100, #152405, BioLegend), PerCP/Cy5.5–anti-NK1.1 (mouse IgG2a; 1:100, #108727; BioLegend), PerCP/Cy5.5–anti-CD8b (rat IgG2b; 1:100, #126609; BioLegend), BV605–anti-CD44 (rat IgG2b; 1:100, #103047; BioLegend), FITC–anti-CD8a (rat IgG2a; 1:100, #100705; BioLegend), BV510–anti-CD11b (rat IgG2b; 1:100, #101245; BioLegend), BV421–anti-Ly6C (RçAT IgM; 1:100, #562727; BD Biosciences), and PerCP/Cy5.5–anti-Ly6G (rat IgG2a; 1:100, #127615; BioLegend). For mass cytometry experiments, metal-tagged antibodies were obtained from Fluidigm or conjugated using the Maxpar X8 Antibody Labeling kit according to the manufacturer’s instructions (Fluidigm). Clone and tag information can be found in Table S1.
Genotyping
Toe clips were digested with proteinase K, and DNA was isolated with the Qiagen kit per manufacturer’s protocol. Two separate PCR reactions were performed for genotyping: a WT allele PCR and a STING N153S mutant allele PCR. WT primer (5′-GTCTGTGAAGAAAAGAAGTTAAA-3′) or STING N153S forward primer (5′-GTCTGTGAAGAAAAGAAGTTAAC-3′) and reverse primer (5′-GTGATTTTATGTACCCTGGG-3′) recognizing sequences in exon 5 of Tmem173 (STING) were added to PCR SuperMix (Invitrogen) at a final concentration of 0.4 µM. PCR was performed with an initial denaturation (94°C, 2 min), followed by 34 cycles of denaturation (94°C, 30 s), annealing (47°C, 45 s), and extension (72°C, 1 min). Mice positive for the STING N153S mutation were identified by the appearance of a 258-bp band by agarose gel electrophoresis.
Primary cell isolation and culture
Primary WT littermate, heterozygous STING N153S, Irf3−/−, Irf3−/− heterozygous STING N153S, and Sting−/− MEFs (Ishikawa and Barber, 2008; gift from G. Barber) were generated from embryos on E13.5. MEFs were transfected with SV2 plasmid, encoding the large T antigen of SV40 polyomavirus. Cells were passaged ∼10 times and used for subsequent experiments. In some experiments, primary MEFs were used to confirm phenotypes observed in transformed MEFs. Cell lines were genotyped to confirm their identity. Human fibroblasts were generated from SAVI patients and healthy controls (Liu et al., 2014; gift to the Yan laboratory from R. Goldbach-Mansky). All cells were cultured at 37°C with 5% CO2 in DMEM supplemented with 10% FBS and 2 mM l-glutamine, 1× nonessential amino acid solution, 1 mM sodium pyruvate, 10 mM Hepes, 100 U/ml penicillin, and 100 mg/ml streptomycin.
Cytokine assay
Mouse serum was collected by terminal exsanguination of anesthetized mice and stored at −20°C before measurement of cytokine and chemokine levels on the Luminex platform using the Bio-Plex Pro Mouse Cytokine Group I Panel 23-Plex Assay kit (Bio-Rad). The BioPlex Pro Assay was performed according to the manufacturer's protocol. Cytokines and chemokines tested include IL-1α, IL-1β, IL-2, IL-3 IL-4, IL-5, IL-6, IL-9, IL-10, IL-12p40, IL-12p70, IL-13, IL-17, eotaxin, G-CSF, GM-CSF, IFN-γ, Iα, MIP-1β, RANTES (CCL5), and TNF.
Autoantigen arrays
Autoantigen arrays were performed on serum samples by the University of Texas Southwestern Medical Center Microarray Core as previously described (Li et al., 2005).
Stimulation of cell lines with cGAS-STING ligands
Transfections of 2′3′-cGAMP (Invivogen), htDNA (Sigma-Aldrich), and poly I:C (Sigma-Aldrich) were performed using Lipofectamine 2000 (Thermo Fisher Scientific) as previously described (Dobbs et al., 2015). After 6 h of treatment, RNA was isolated using Trizol (Sigma-Aldrich), and ISGs and IFN-β were measured via qRT-PCR.
qRT-PCR
Total RNA was isolated by RNeasy kit (Qiagen) per manufacturer’s protocol. RNA was quantified and quality confirmed using a NanoDrop ND-1000 spectrophotometer. cDNA was synthesized with iScript cDNA synthesis kit (Bio-Rad). iTaq Universal SYBR Green Supermix (Bio-Rad) and an ABI-7500 Fast Real-Time PCR system (Applied Biosystems) were used for qRT-PCR. Alternatively, in some experiments, TaqMan RNA-to-Ct 1-Step kit (Applied Biosystems) was used to measure mRNA expression. Ct values for all target genes were normalized to Ct values of the housekeeping gene GAPDH. Data are reported as ΔCt (Cttarget – CtGAPDH).
CyTOF
Spleen and thymus tissues were isolated from WT and STING N153S mice and mashed through 70-µm Nylon cell strainers, washed twice with culture media, and treated with RBC lysis buffer. Cells were then washed with CyFACS (0.1% BSA, 2 mM EDTA, and 0.02% NaN2 in PBS; Rockland) followed by CyPBS. For viability staining, cells were incubated with 2.5 µM cisplatin for 1 min at room temperature, washed twice in CyFACS, and fixed in 1.5% PFA (final concentration) for 10 min at room temperature. After two washes, 3 × 10⁶ cells per sample were incubated for 10 min with Fc block, after which a cocktail of 17 surface markers (Table S1) was added and incubated with the cells for 1 h on ice. Cells were washed in CyFACS and permeabilized with ice-cold methanol overnight at −20°C. The next day, cells were washed twice with CyFACS and incubated with a cocktail of 11 intracellular antibodies on ice for 1 h (Table S1). Cells were washed, suspended in CyPBS containing iridium-intercalator (DNA stain; Fluidigm) and 2% PFA, and stored at 4°C overnight. Before acquisition on a CyTOF2 mass cytometer (Fluidigm), cells were counted, washed with ddH2O water, and suspended in EQ Four Element calibration beads (Fluidigm) per the manufacturer’s instructions. Normalization was performed using Normalizer v0.3 Matlab Complier Runtime (GitHub; Nolan laboratory), and Cytobank (cytobank.org) was used for data analysis and generation of SPADE trees, viSNE maps, and heat maps. Splenocyte populations were clustered in each viSNE map by CD45, CD4, CD8α, CD11b, Ly6G, CD3ε, CD19, NK1.1, and MHCII, whereas thymocyte populations were clustered by CD45, TCRβ, CD4, CD8α, CD11b, Ly6G, TER119, TCRγδ, B220, CD3ε, CD19, NK1.1, CD117, and MHCII. Natural separations in the viSNE map combined with marker-dependent color-coding of dot plots were used to manually draw gates and define populations. Cell populations represented in SPADE trees and heat maps were also manually defined according to cell surface marker expression as explained in Table S2. For analysis of heat map data and comparison of signal intensity, log10 scales were compressed according to the arcsinh transformation as previously described (Bendall et al., 2011) and in accordance with the standard analytical procedure for mass cytometry data on cytobank.org.
Staining of tissue
Tissue was isolated from STING N153S, WT littermate control, Irf3−/−, and Irf3−/− STING N153S mice, fixed in 4% PFA for 24 h at 4°C, and resuspended in 70% ethanol before being embedded in paraffin blocks. Tissue sections were subjected to hematoxylin and eosin or Gomori trichrome staining. Samples were imaged using a Nikon Eclipse E400 microscope and NIS Elements software. The percentage of lung comprised of perivascular inflammatory lesions in each mouse was determined by averaging the measurements of two random fields using ImageJ (Schneider et al., 2012).
Flow cytometry
Immunophenotyping of spleens was performed on a FACSCanto flow cytometer (BD Biosciences) and analyzed using FlowJo software.
Statistics
Unless otherwise specified, all data were analyzed using GraphPad Prism software by Mann–Whitney or t test as specified in the figure legends. Flow cytometry data were analyzed using FlowJo, and CyTOF results were analyzed using cytobank.org.
Online supplemental material
Supplemental material associated with this study includes FACS characterization of infiltrating immune cells in the lungs of STING N153S mice (Fig. S1), as well as a comparison of type I IFN and ISG induction in patient and mouse fibroblasts and also in transfected 293T cells (Fig. S2). Supplemental tables include CyTOF panels (Table S1) and definitions of immune cell populations from CyTOF analysis (Table S2).
Supplementary Material
Acknowledgments
We thank Dr. Raphaela Goldbach-Mansky for providing SAVI patient fibroblast cell lines. We thank Renate Lewis of the Hope Transgenic Vectors Core for assistance with generation and validation of the CRISPR/Cas9 knock-in sgRNA and oligo donor. We also thank Mia Wallace of the Mouse Genetics Core at Washington University in Saint Louis School of Medicine for performing the microinjections to generate the knock-in mice, as well as the Digestive Diseases Research Core Center and Pulmonary Morphology Cores for assistance with histology. We thank Dr. Michael S. Diamond for facilitating the inception of this project and critical reading of the manuscript, Dr. Chyi Hsieh for guidance on T cell studies, Matthew Gorman for helpful discussions, and the Andrew M. and Jane M. Bursky Center for Human Immunology and Immunotherapy Programs Immunomonitoring Laboratory for the CyTOF panel design and data acquisition.
The Miner laboratory is supported by grants from the National Institutes of Health (NIH; K08AR070918) and the Rheumatology Research Foundation. The Yan laboratory is supported by grants from the National Institutes of Health (R01AR067135) and the Burroughs Wellcome Fund. J.D. Warner and R.A. Irizarry-Caro are both supported by NIH T32 training grants (5T32AR007279-39 at Washington University in St. Louis and 5T32AI005284-38 at UT Southwestern Medical Center).
The authors declare no competing financial interests.
Author contributions: J.D. Warner, R.A. Irizarry-Caro, B.G. Bennion, T.L. Ai, A.M. Smith, C.A. Miner, V.K. Gonugunta, J. Wu, and D.J. Platt performed experiments and analyzed data. J.D. Warner and R.A. Irizarry-Caro wrote some portions of the initial manuscript. J.J. Miner, B.G. Bennion, and R.A. Irizarry-Caro revised the final version of the manuscript. N. Yan guided experiments, analyzed data, and edited the manuscript. J.J. Miner conceived the project, performed experiments, analyzed data, and wrote the complete manuscript.
Footnotes
Abbreviations used:
- cGAS
- cGAMP synthase
- CyTOF
- cytometry by time-of-flight
- ISG
- IFN-stimulated gene
- qRT-PCR
- quantitative RT-PCR
- SAVI
- STING-associated vasculopathy with onset in infancy
- STING
- stimulator of type I IFN genes
References
- Abe T., and Barber G.N.. 2014. Cytosolic-DNA-mediated, STING-dependent proinflammatory gene induction necessitates canonical NF-κB activation through TBK1. J. Virol. 88:5328–5341. 10.1128/JVI.00037-14 [DOI] [PMC free article] [PubMed] [Google Scholar]
- Balada E., Selva-O’Callaghan A., Felip L., Ordi-Ros J., Simeón-Aznar C.P., Solans-Laqué R., and Vilardell-Tarrés M.. 2016. Sequence analysis of TMEM173 exon 5 in patients with systemic autoimmune diseases. Autoimmunity. 49:12–16. 10.3109/08916934.2015.1113404 [DOI] [PubMed] [Google Scholar]
- Bendall S.C., Simonds E.F., Qiu P., Amir A.D., Krutzik P.O., Finck R., Bruggner R.V., Melamed R., Trejo A., Ornatsky O.I., et al. . 2011. Single-cell mass cytometry of differential immune and drug responses across a human hematopoietic continuum. Science. 332:687–696. 10.1126/science.1198704 [DOI] [PMC free article] [PubMed] [Google Scholar]
- Cerboni S., Jeremiah N., Gentili M., Gehrmann U., Conrad C., Stolzenberg M.-C., Picard C., Neven B., Fischer A., Amigorena S., et al. . 2017. Intrinsic antiproliferative activity of the innate sensor STING in T lymphocytes. J. Exp. Med. 214:1769–1785. 10.1084/jem.20161674 [DOI] [PMC free article] [PubMed] [Google Scholar]
- Crow Y.J., and Manel N.. 2015. Aicardi-Goutières syndrome and the type I interferonopathies. Nat. Rev. Immunol. 15:429–440. 10.1038/nri3850 [DOI] [PubMed] [Google Scholar]
- Crow Y.J., Hayward B.E., Parmar R., Robins P., Leitch A., Ali M., Black D.N., van Bokhoven H., Brunner H.G., Hamel B.C., et al. . 2006. Mutations in the gene encoding the 3′-5′ DNA exonuclease TREX1 cause Aicardi-Goutières syndrome at the AGS1 locus. Nat. Genet. 38:917–920. 10.1038/ng1845 [DOI] [PubMed] [Google Scholar]
- Dobbs N., Burnaevskiy N., Chen D., Gonugunta V.K., Alto N.M., and Yan N.. 2015. STING activation by translocation from the ER is associated with infection and autoinflammatory disease. Cell Host Microbe. 18:157–168. 10.1016/j.chom.2015.07.001 [DOI] [PMC free article] [PubMed] [Google Scholar]
- Eloranta M.L., Franck-Larsson K., Lövgren T., Kalamajski S., Rönnblom A., Rubin K., Alm G.V., and Rönnblom L.. 2010. Type I interferon system activation and association with disease manifestations in systemic sclerosis. Ann. Rheum. Dis. 69:1396–1402. 10.1136/ard.2009.121400 [DOI] [PubMed] [Google Scholar]
- Fu J., Kanne D.B., Leong M., Glickman L.H., McWhirter S.M., Lemmens E., Mechette K., Leong J.J., Lauer P., Liu W., et al. . 2015. STING agonist formulated cancer vaccines can cure established tumors resistant to PD-1 blockade. Sci. Transl. Med. 7:283ra52 10.1126/scitranslmed.aaa4306 [DOI] [PMC free article] [PubMed] [Google Scholar]
- Gao D., Wu J., Wu Y.T., Du F., Aroh C., Yan N., Sun L., and Chen Z.J.. 2013. Cyclic GMP-AMP synthase is an innate immune sensor of HIV and other retroviruses. Science. 341:903–906. 10.1126/science.1240933 [DOI] [PMC free article] [PubMed] [Google Scholar]
- Hasan M., Koch J., Rakheja D., Pattnaik A.K., Brugarolas J., Dozmorov I., Levine B., Wakeland E.K., Lee-Kirsch M.A., and Yan N.. 2013. Trex1 regulates lysosomal biogenesis and interferon-independent activation of antiviral genes. Nat. Immunol. 14:61–71. 10.1038/ni.2475 [DOI] [PMC free article] [PubMed] [Google Scholar]
- Ishikawa H., and Barber G.N.. 2008. STING is an endoplasmic reticulum adaptor that facilitates innate immune signalling. Nature. 455:674–678. 10.1038/nature07317 [DOI] [PMC free article] [PubMed] [Google Scholar]
- Ishikawa H., Ma Z., and Barber G.N.. 2009. STING regulates intracellular DNA-mediated, type I interferon-dependent innate immunity. Nature. 461:788–792. 10.1038/nature08476 [DOI] [PMC free article] [PubMed] [Google Scholar]
- Jeremiah N., Neven B., Gentili M., Callebaut I., Maschalidi S., Stolzenberg M.C., Goudin N., Frémond M.L., Nitschke P., Molina T.J., et al. . 2014. Inherited STING-activating mutation underlies a familial inflammatory syndrome with lupus-like manifestations. J. Clin. Invest. 124:5516–5520. 10.1172/JCI79100 [DOI] [PMC free article] [PubMed] [Google Scholar]
- Kim H., Sanchez G.A.M., and Goldbach-Mansky R.. 2016. Insights from Mendelian interferonopathies: Comparison of CANDLE, SAVI with AGS, monogenic lupus. J. Mol. Med. (Berl.). 94:1111–1127. 10.1007/s00109-016-1465-5 [DOI] [PMC free article] [PubMed] [Google Scholar]
- Kobayashi H., Kobayashi C.I., Nakamura-Ishizu A., Karigane D., Haeno H., Yamamoto K.N., Sato T., Ohteki T., Hayakawa Y., Barber G.N., et al. . 2015. Bacterial c-di-GMP affects hematopoietic stem/progenitors and their niches through STING. Cell Reports. 11:71–84. 10.1016/j.celrep.2015.02.066 [DOI] [PubMed] [Google Scholar]
- König N., Fiehn C., Wolf C., Schuster M., Cura Costa E., Tüngler V., Alvarez H.A., Chara O., Engel K., Goldbach-Mansky R., et al. . 2017. Familial chilblain lupus due to a gain-of-function mutation in STING. Ann. Rheum. Dis. 76:468–472. 10.1136/annrheumdis-2016-209841 [DOI] [PubMed] [Google Scholar]
- Li Q.-Z., Xie C., Wu T., Mackay M., Aranow C., Putterman C., and Mohan C.. 2005. Identification of autoantibody clusters that best predict lupus disease activity using glomerular proteome arrays. J. Clin. Invest. 115:3428–3439. 10.1172/JCI23587 [DOI] [PMC free article] [PubMed] [Google Scholar]
- Li T., Cheng H., Yuan H., Xu Q., Shu C., Zhang Y., Xu P., Tan J., Rui Y., Li P., and Tan X.. 2016. Antitumor activity of cGAMP via stimulation of cGAS-cGAMP-STING-IRF3 mediated innate immune response. Sci. Rep. 6:19049 10.1038/srep19049 [DOI] [PMC free article] [PubMed] [Google Scholar]
- Liu Y., Jesus A.A., Marrero B., Yang D., Ramsey S.E., Sanchez G.A.M., Tenbrock K., Wittkowski H., Jones O.Y., Kuehn H.S., et al. . 2014. Activated STING in a vascular and pulmonary syndrome. N. Engl. J. Med. 371:507–518. 10.1056/NEJMoa1312625 [DOI] [PMC free article] [PubMed] [Google Scholar]
- Marié I., Durbin J.E., and Levy D.E.. 1998. Differential viral induction of distinct interferon-α genes by positive feedback through interferon regulatory factor-7. EMBO J. 17:6660–6669. 10.1093/emboj/17.22.6660 [DOI] [PMC free article] [PubMed] [Google Scholar]
- Melki I., Rose Y., Uggenti C., Van Eyck L., Frémond M.-L., Kitabayashi N., Rice G.I., Jenkinson E.M., Boulai A., Jeremiah N., et al. . 2017. Disease-associated mutations identify a novel region in human STING necessary for the control of type I interferon signaling. J. Allergy Clin. Immunol. 140:543–552.e5. 10.1016/j.jaci.2016.10.031 [DOI] [PubMed] [Google Scholar]
- Morita M., Stamp G., Robins P., Dulic A., Rosewell I., Hrivnak G., Daly G., Lindahl T., and Barnes D.E.. 2004. Gene-targeted mice lacking the Trex1 (DNase III) 3′-->5′ DNA exonuclease develop inflammatory myocarditis. Mol. Cell. Biol. 24:6719–6727. 10.1128/MCB.24.15.6719-6727.2004 [DOI] [PMC free article] [PubMed] [Google Scholar]
- Ouyang S., Song X., Wang Y., Ru H., Shaw N., Jiang Y., Niu F., Zhu Y., Qiu W., Parvatiyar K., et al. . 2012. Structural analysis of the STING adaptor protein reveals a hydrophobic dimer interface and mode of cyclic di-GMP binding. Immunity. 36:1073–1086. 10.1016/j.immuni.2012.03.019 [DOI] [PMC free article] [PubMed] [Google Scholar]
- Parikh B.A., Beckman D.L., Patel S.J., White J.M., and Yokoyama W.M.. 2015. Detailed phenotypic and molecular analyses of genetically modified mice generated by CRISPR-Cas9-mediated editing. PLoS One. 10:e0116484 10.1371/journal.pone.0116484 [DOI] [PMC free article] [PubMed] [Google Scholar]
- Parker Z.M., Murphy A.A., and Leib D.A.. 2015. Role of the DNA sensor STING in protection from lethal infection following corneal and intracerebral challenge with herpes simplex virus 1. J. Virol. 89:11080–11091. 10.1128/JVI.00954-15 [DOI] [PMC free article] [PubMed] [Google Scholar]
- Picard C., Thouvenin G., Kannengiesser C., Dubus J.-C., Jeremiah N., Rieux-Laucat F., Crestani B., Belot A., Thivolet-Béjui F., Secq V., et al. . 2016. Severe pulmonary fibrosis as the first manifestation of interferonopathy (TMEM173 Mutation). Chest. 150:e65–e71. 10.1016/j.chest.2016.02.682 [DOI] [PubMed] [Google Scholar]
- Sato M., Hata N., Asagiri M., Nakaya T., Taniguchi T., and Tanaka N.. 1998. Positive feedback regulation of type I IFN genes by the IFN-inducible transcription factor IRF-7. FEBS Lett. 441:106–110. 10.1016/S0014-5793(98)01514-2 [DOI] [PubMed] [Google Scholar]
- Sato M., Suemori H., Hata N., Asagiri M., Ogasawara K., Nakao K., Nakaya T., Katsuki M., Noguchi S., Tanaka N., and Taniguchi T.. 2000. Distinct and essential roles of transcription factors IRF-3 and IRF-7 in response to viruses for IFN-alpha/beta gene induction. Immunity. 13:539–548. 10.1016/S1074-7613(00)00053-4 [DOI] [PubMed] [Google Scholar]
- Schneider C.A., Rasband W.S., and Eliceiri K.W.. 2012. NIH Image to ImageJ: 25 years of image analysis. Nat. Methods. 9:671–675. 10.1038/nmeth.2089 [DOI] [PMC free article] [PubMed] [Google Scholar]
- Schoggins J.W., MacDuff D.A., Imanaka N., Gainey M.D., Shrestha B., Eitson J.L., Mar K.B., Richardson R.B., Ratushny A.V., Litvak V., et al. . 2014. Pan-viral specificity of IFN-induced genes reveals new roles for cGAS in innate immunity. Nature. 505:691–695. 10.1038/nature12862 [DOI] [PMC free article] [PubMed] [Google Scholar]
- Sharma S., Campbell A.M., Chan J., Schattgen S.A., Orlowski G.M., Nayar R., Huyler A.H., Nündel K., Mohan C., Berg L.J., et al. . 2015. Suppression of systemic autoimmunity by the innate immune adaptor STING. Proc. Natl. Acad. Sci. USA. 112:E710–E717. 10.1073/pnas.1420217112 [DOI] [PMC free article] [PubMed] [Google Scholar]
- Stetson D.B. 2012. Endogenous retroelements and autoimmune disease. Curr. Opin. Immunol. 24:692–697. 10.1016/j.coi.2012.09.007 [DOI] [PMC free article] [PubMed] [Google Scholar]
- Tanaka Y., and Chen Z.J.. 2012. STING specifies IRF3 phosphorylation by TBK1 in the cytosolic DNA signaling pathway. Sci. Signal. 5:ra20 10.1126/scisignal.2002521 [DOI] [PMC free article] [PubMed] [Google Scholar]
- Wang F., Alain T., Szretter K.J., Stephenson K., Pol J.G., Atherton M.J., Hoang H.-D., Fonseca B.D., Zakaria C., Chen L., et al. . 2016. S6K-STING interaction regulates cytosolic DNA-mediated activation of the transcription factor IRF3. Nat. Immunol. 17:514–522. 10.1038/ni.3433 [DOI] [PMC free article] [PubMed] [Google Scholar]
- West A.P., Khoury-Hanold W., Staron M., Tal M.C., Pineda C.M., Lang S.M., Bestwick M., Duguay B.A., Raimundo N., MacDuff D.A., et al. . 2015. Mitochondrial DNA stress primes the antiviral innate immune response. Nature. 520:553–557. 10.1038/nature14156 [DOI] [PMC free article] [PubMed] [Google Scholar]
- Yang H., Wang H., Ren J., Chen Q., and Chen Z.J.. 2017. cGAS is essential for cellular senescence. Proc. Natl. Acad. Sci. USA. 114:E4612–E4620. 10.1073/pnas.1705499114 [DOI] [PMC free article] [PubMed] [Google Scholar]
Associated Data
This section collects any data citations, data availability statements, or supplementary materials included in this article.


